

Abstract
Cancer immunotherapy using immune-checkpoint inhibitors has emerged as an effective treatment option for a variety of advanced cancers in the past decade. Because of the distinct mechanisms of immunotherapy that activate the host immunity to treat cancers, unconventional immune-related phenomena are encountered in terms of tumor response and progression, as well as drug toxicity. Imaging plays an important role in objectively characterizing immune-related tumor responses and progression and in detecting and monitoring immune-related adverse events. Moreover, emerging data suggest a promise for molecular imaging that can visualize the specific target molecules involved in immune-checkpoint pathways. In this article, the background and current status of cancer immunotherapy are summarized, and the current methods for imaging evaluations of immune-related responses and toxicities are reviewed along with their limitations and pitfalls. Emerging approaches with molecular imaging are also discussed as a future direction to address unmet needs.
© RSNA, 2018
Learning Objectives:
After reading the article and taking the test, the reader will be able to:
■ Describe the mechanism of immune-checkpoint inhibitor therapy and its implications on image interpretation in patients treated with immune-checkpoint inhibitors
■ Recognize the unconventional tumor response patterns at imaging of patients treated with immune-checkpoint inhibitors
■ Describe the spectrum of imaging manifestations of immune-related adverse events in various organs
Accreditation and Designation Statement
The RSNA is accredited by the Accreditation Council for Continuing Medical Education (ACCME) to provide continuing medical education for physicians. The RSNA designates this journal-based SA-CME activity for a maximum of 1.0 AMA PRA Category 1 Credit™. Physicians should claim only the credit commensurate with the extent of their participation in the activity.
Disclosure Statement
The ACCME requires that the RSNA, as an accredited provider of CME, obtain signed disclosure statements from the authors, editors, and reviewers for this activity. For this journal-based CME activity, author disclosures are listed at the end of this article.
Summary
Knowledge of cancer immunotherapy and unique manifestations of immune-related adverse events is essential for radiologists to accurately interpret imaging studies and to effectively communicate the results to the referring physicians.
Essentials
■ Cancer immunotherapy using immune-checkpoint inhibitors has introduced a paradigm shift in the treatment of various types of advanced cancers in the past decade.
■ Because of the distinctive biologic mechanisms of immune-checkpoint blockade that utilize host immunity to treat cancer, unconventional tumor response patterns have been noted in imaging studies of patients treated with immune-checkpoint inhibitors.
■ Although pseudoprogression is increasingly recognized among referring physicians and radiologists and is often featured as a representative phenomenon of immune-related tumor response, the incidence of pseudoprogression among patients treated with immune-checkpoint inhibitors is actually low (<10%).
■ The use of immune-checkpoint inhibition in cancer treatment is associated with unique toxicities, termed immune-related adverse events, which can involve various organs from head to toe and present a spectrum of imaging manifestations in each organ.
■ Molecular-based imaging has shown promise to address unmet clinical needs in the field, and further studies are needed to translate the approach in the clinical setting for better selection and monitoring of patients to maximize the benefit of cancer immunotherapy.
Introduction
The recent advances in cancer immunotherapy using immune-checkpoint blockade have brought a paradigm shift in advanced cancer treatments. The mechanism of cancer immune-checkpoint inhibitor therapy is through the blockade of tumor-mediated inhibition of immune responses, which can be associated with novel types of tumor response patterns and toxicities. Imaging plays a critical role for objectively defining tumor response and progression in patients treated with immunotherapy and for detecting and monitoring immune-related toxicities, which can involve various organs. Given the rapidly increasing use of cancer immunotherapy in the clinical setting, it is essential for radiologists to be familiar with the cutting-edge approaches to immune-related response and toxicity evaluations with imaging. This article provides an overview of the background and current status of cancer immunotherapy and summarizes the current imaging strategies for immunotherapy response and toxicity assessments. This article also reviews emerging approaches using molecular imaging that try to address the unmet needs in the rapidly evolving field of immuno-oncology.
Overview and Current Status of Cancer Immunotherapy
Cancer immunotherapy using immune-checkpoint inhibitors has emerged as a successful treatment option for the treatment of various types of advanced cancers in the past decade (1–6). The mechanism of anticancer activity of immune-checkpoint inhibitors is based on the blockade of immune inhibition by tumors rather than direct cytotoxic or targeted effects to tumor cells. It has become clearer that T cells have major roles in immune-mediated defense mechanisms against cancer (1–7). The stimulatory and inhibitory signals from the ligand-receptor pairs between tumor cells, T cells, dendritic cells, and macrophages in the tumor microenvironment are called “immune checkpoints.” These immune checkpoint molecules regulate T-cell activation specific to tumor cells as immune responses of the host against cancer (Fig 1) (1–8). Tumor cells are the major mediators of immune suppression in the interaction and facilitate their escape from T-cell–mediated host immune responses so that they can survive and proliferate (5,7,9,10). Immune-checkpoint inhibitors, such as cytotoxic T-lymphocyte antigen 4 (CTLA-4) inhibitors and programmed cell death protein 1 (PD-1) and programmed cell death protein ligand 1 (PD-L1) inhibitors, can interfere with the interaction and block the T-cell immune inhibition by tumors, leading to the activation of the immune response against cancer (9–12).
Figure 1:

Immune-checkpoint molecules between tumor cells and immune cells in the tumor microenvironment. A number of inhibitory receptors and ligands are expressed on T cells, dendritic cells, macrophages, and tumor cells in the tumor microenvironment and serve as critical mediators of immune suppression by tumors. These receptor-ligand pairs, such as programmed cell death ligand 1 (PD-1)/programmed cell death protein ligand 1 (PD-L1) in the T cell and tumor cell interaction, are called “immune checkpoint” molecules. The blockade of these checkpoints using immune-checkpoint inhibitors such as PD1/PD-L1 inhibitors and cytotoxic T-lymphocyte antigen 4 (CTLA-4) inhibitors have emerged as successful treatment options for a variety of advanced cancers. (Modified from references 4 and 5.) GITR = glucocorticoid-induced tumor necrosis factor receptor-related protein, GITRL = GITR ligand, ICOS = inducible T-cell co-stimulator, ICOSL = ICOS ligand, LAG = lymphocyte activation gene, MHC = major histocompatibility complex, TCR = T-cell receptor, TIM = T-cell immunoglobulin and mucin domain.
In 2010, Hodi et al (13) reported the result of a phase III trial of the CTLA-4 inhibitor ipilimumab in advanced melanoma and demonstrated a significantly improved overall survival. The median overall survival was 10.0 months in patients treated with ipilimumab plus a glycoprotein 100 peptide vaccine (gp100), compared with 6.4 months among patients receiving gp100 alone as a control group (hazard ratio for death, 0.68; P < .001). The results of the study opened a new era of utilizing immune-checkpoint blockade for cancer therapy. Subsequent clinical trials have also studied PD-1/PD-L1 inhibitors, which showed promising activity in patients with various types of advanced cancers, leading to the regulatory approvals of these agents for a variety of indications (Table 1). Immune-checkpoint blockade has quickly become a mainstream treatment strategy for advanced cancers in the oncology clinic.
Table 1:
Immune-Checkpoint Inhibitors and Their Approved Indications in Oncology Practice in the United States
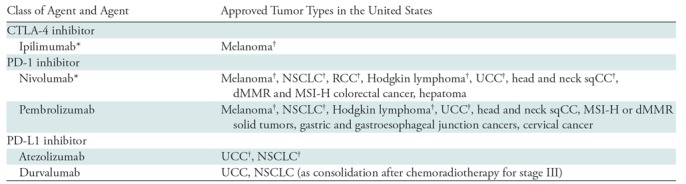
Note.—CTLA-4 = cytotoxic T-lymphocyte antigen 4, dMMR = mismatch repair deficient, MSI-H = microsatellite instability high, NSCLC = non–small cell lung cancer, PD-L1 = programmed cell death protein ligand 1, PD-1 = programmed cell death protein 1, RCC = renal cell carcinoma, sqCC = squamous cell carcinoma, UCC = urothelial cancer.
* Ipilimumab and nivolumab combination therapy is also approved for metastatic melanoma and advanced RCC and for dMMR and MSI-H colorectal cancer.
†The indications have also been approved in the European Union (14).
The unique mechanism of immune-checkpoint inhibitor therapy underlies a wide range of novel patterns of tumor responses and toxicities, which are often associated with specific imaging findings on treatment-monitoring studies in patients receiving immunotherapy. Given the rapidly increasing use of immunotherapeutic agents in the oncology practice, understanding the mechanism of action of these agents is essential for radiologists to accurately interpret the imaging studies and effectively communicate the results to the referring physicians.
Immune-related Response Assessment with Imaging
Because of the distinctive biologic mechanisms of immune-checkpoint blockade, unconventional tumor response patterns at imaging have been noted in patients treated with immune-checkpoint inhibitors. Well-recognized immune-related response patterns include response after an initial increase in tumor burden (Fig 2) or response during or after the appearance of new lesions (Fig 3). These phenomena are often termed “pseudoprogression,” because these patterns would be categorized as progression according to conventional tumor response criteria such as Response Evaluation Criteria in Solid Tumors (RECIST) at the time of the initial increase in or appearance of new lesions (4,8,15–17). The mechanism of pseudoprogression is thought to be the infiltration of T cells into tumors, resulting in an initial apparent increase in tumor burden rather than true proliferation of tumor cells (16).
Figure 2a:

Pseudoprogression with initial increase in tumor burden followed by subsequent tumor shrinkage due to immune-related response in a 66-year-old woman with metastatic melanoma treated with nivolumab and ipilimumab. (a) Baseline contrast material–enhanced axial CT image obtained before therapy shows a metastatic nodule (arrow) in the left upper medial thigh measuring 4 cm in the longest diameter. (b) Follow-up axial CT image at 3 months of therapy shows an increase in the lesion, which now measures 5 cm (arrow), indicating progressive disease according to the Response Evaluation Criteria in Solid Tumors, or RECIST. (c) Further follow-up axial CT image at 6 months of therapy shows a decrease in size of the lesion, which now measures 2.5 cm (arrow), representing immune-related tumor response.
Figure 3a:

Pseudoprogression with appearance of a new lesion followed by subsequent immune-related response in a 66-year-old woman with metastatic melanoma treated with nivolumab and ipilimumab. Compared with (a) a baseline axial CT image obtained prior to the initiation of therapy, (b) a follow-up axial CT image obtained after 3 months of therapy shows a new subcutaneous lesion (arrow), indicating progressive disease according to the Response Evaluation Criteria in Solid Tumors, or RECIST; however, (c) a further follow-up axial CT image obtained after 6 months of therapy shows shrinkage of the new lesion (arrow), representing immune-related response. Note that another lesion in the deep subcutaneous tissue (*) increased at 3-month follow-up, followed by subsequent shrinkage of the lesion, also indicating immune-related response after initial increase in tumor burden.
Figure 2b:

Pseudoprogression with initial increase in tumor burden followed by subsequent tumor shrinkage due to immune-related response in a 66-year-old woman with metastatic melanoma treated with nivolumab and ipilimumab. (a) Baseline contrast material–enhanced axial CT image obtained before therapy shows a metastatic nodule (arrow) in the left upper medial thigh measuring 4 cm in the longest diameter. (b) Follow-up axial CT image at 3 months of therapy shows an increase in the lesion, which now measures 5 cm (arrow), indicating progressive disease according to the Response Evaluation Criteria in Solid Tumors, or RECIST. (c) Further follow-up axial CT image at 6 months of therapy shows a decrease in size of the lesion, which now measures 2.5 cm (arrow), representing immune-related tumor response.
Figure 2c:

Pseudoprogression with initial increase in tumor burden followed by subsequent tumor shrinkage due to immune-related response in a 66-year-old woman with metastatic melanoma treated with nivolumab and ipilimumab. (a) Baseline contrast material–enhanced axial CT image obtained before therapy shows a metastatic nodule (arrow) in the left upper medial thigh measuring 4 cm in the longest diameter. (b) Follow-up axial CT image at 3 months of therapy shows an increase in the lesion, which now measures 5 cm (arrow), indicating progressive disease according to the Response Evaluation Criteria in Solid Tumors, or RECIST. (c) Further follow-up axial CT image at 6 months of therapy shows a decrease in size of the lesion, which now measures 2.5 cm (arrow), representing immune-related tumor response.
Figure 3b:

Pseudoprogression with appearance of a new lesion followed by subsequent immune-related response in a 66-year-old woman with metastatic melanoma treated with nivolumab and ipilimumab. Compared with (a) a baseline axial CT image obtained prior to the initiation of therapy, (b) a follow-up axial CT image obtained after 3 months of therapy shows a new subcutaneous lesion (arrow), indicating progressive disease according to the Response Evaluation Criteria in Solid Tumors, or RECIST; however, (c) a further follow-up axial CT image obtained after 6 months of therapy shows shrinkage of the new lesion (arrow), representing immune-related response. Note that another lesion in the deep subcutaneous tissue (*) increased at 3-month follow-up, followed by subsequent shrinkage of the lesion, also indicating immune-related response after initial increase in tumor burden.
Figure 3c:

Pseudoprogression with appearance of a new lesion followed by subsequent immune-related response in a 66-year-old woman with metastatic melanoma treated with nivolumab and ipilimumab. Compared with (a) a baseline axial CT image obtained prior to the initiation of therapy, (b) a follow-up axial CT image obtained after 3 months of therapy shows a new subcutaneous lesion (arrow), indicating progressive disease according to the Response Evaluation Criteria in Solid Tumors, or RECIST; however, (c) a further follow-up axial CT image obtained after 6 months of therapy shows shrinkage of the new lesion (arrow), representing immune-related response. Note that another lesion in the deep subcutaneous tissue (*) increased at 3-month follow-up, followed by subsequent shrinkage of the lesion, also indicating immune-related response after initial increase in tumor burden.
Several modified criteria have been proposed to capture these atypical patterns in patients receiving cancer immunotherapy. This section will review (a) the evolution and current status of immune-related response evaluation strategies, (b) pitfalls of the current immune-response evaluations, and (c) emerging observations in immune-related tumor response dynamics.
Evolution and Current Status of Immune-related Response Evaluation Strategies
Conventionally, strategies for evaluation of tumor response to therapy include the World Health Organization criteria, which were introduced in 1979, and RECIST, which were introduced in 2000 and revised in 2009 (Table 2) (18–21). In the process of tumor response evaluations, target lesions are selected on baseline images, and measurements of these lesions are performed on serial follow-up images to quantify tumor burden changes and define response and progression according to the criteria described in Table 2.
Table 2:
Summary of Conventional Tumor Response Criteria and Modified Strategies for Immune-related Response Evaluations
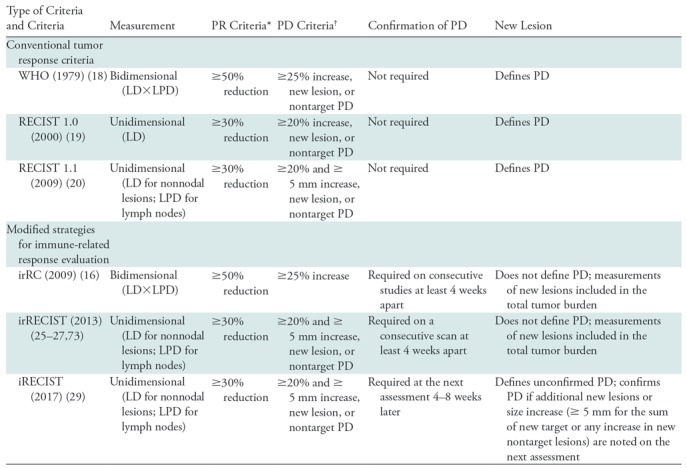
Note.—irRC = immune-related response criteria, irRECIST = immune-related RECIST, LD = longest diameter, LPD = longest perpendicular diameter, PD = progressive disease, PR = partial response, RECIST = Response Evaluation Criteria in Solid Tumors, WHO = World Health Organization.
*In reference to the baseline measurements.
†In reference to the nadir (the smallest measurement since the baseline).
On the basis of observations of immune-related response patterns, modifications of the conventional tumor response criteria have been proposed in an attempt to accurately characterize immune-related response patterns. These efforts resulted in a series of modified criteria and guidelines specifically designed for patients treated with immunotherapy (Table 2). The first set of criteria was the immune-related response criteria (irRC), which were developed in 2009 (16). There are two key features of irRC that introduced an important concept for immune-related response evaluations. First, irRC required confirmation of progression on two consecutive studies at least 4 weeks apart, rather than declaring progressive disease (PD) immediately at the initial increase in tumor burden above the threshold. This is to capture instances of pseudoprogression, which may subsequently demonstrate tumor reduction (Fig 4) (8,16). Second, when new lesions appear, irRC includes the measurements of new lesions in the sum of the entire tumor burden for response assessment, rather than defining PD. This is because some patients may respond during or after the appearance of new lesions (Fig 3) (8,16). Subsequently, irRC were used in immunotherapy trials to define end points and was evaluated for its added value. In a study comparing irRC and RECIST 1.1 in 327 patients with advanced melanoma treated with pembrolizumab, 7% (24 of 327) of the patients demonstrated pseudoprogression (15). Patients assessed as having PD according to RECIST 1.1 but non-PD according to irRC had longer overall survival than patients with PD according to both RECIST 1.1 and irRC (median overall survival: 22.5 vs 8.4 months) (15), indicating an added value of irRC.
Figure 4:

Axial chest CT images show pseudoprogression followed by subsequent tumor reduction noted after confirmation of progressive disease on consecutive images obtained over the course of several months in a 63-year-old woman with lung adenocarcinoma treated with nivolumab who experienced pseudoprogression. Comparing subsequent findings to, A, the baseline, the patient experienced tumor burden increase at, B, 1.4 months of therapy, meeting the criteria for progressive disease, which was confirmed on, C, a serial CT scan at 5.0 months of therapy. Subsequently, tumor regression was noted at, D, 8.8 months of therapy. (Reprinted, with permission, from reference 34).
Although there is no doubt that irRC introduced an important concept for immune-related response evaluations and contributed to raise awareness of atypical response patterns during immunotherapy, there were a few issues in this approach, mostly related to the methods of tumor measurements. Notably, irRC was based on World Health Organization criteria and thus utilized bidimensional measurements, multiplying the longest diameter and the longest perpendicular diameter to quantify tumor burden (18,21). However, most solid-tumor trials after 2000 utilized RECIST, which uses unidimensional single-diameter measurements for tumor response evaluation (19–21). The use of bidimensional measurements in irRC was problematic because the direct comparisons of the trial results were difficult when some investigators use RECIST with its unidimensional measurements and others use irRC with its bidimensional measurements. In addition, a number of previous studies demonstrated that bidimensional measurements have larger measurement variability and higher misclassification rates compared with RECIST-based unidimensional measurements (22–24).
To propose a unified direction for immune-related response evaluations that are aligned with RECIST, Nishino et al (25–27) performed a series of studies to optimize strategies and to develop a “common language” for immune-related response assessment (25–27). In 57 patients with advanced melanoma treated with ipilimumab, the results of response assessment by using the original irRC with bidimensional measurements were compared with those of response assessment by using unidimensional irRC that utilized RECIST-based single-diameter measurements while retaining the important features of irRC in terms of new lesions and confirmation of progression (26). Bidimensional and unidimensional irRC resulted in highly concordant response evaluations (κw = 0.881 for best immune-related response), with no evidence of a difference for time to progression (26). Measurement variability of the unidimensional approach was half of that of the bidimensional irRC (95% limits of agreement: −16.1%, 5.8% vs −31.3%, 19.7%, respectively) (26), confirming higher reproducibility of RECIST-based unidimensional methods. A subsequent study (25) demonstrated that RECIST 1.1 revisions, including a reduced number of target lesions and short-axis measurements in lymph nodes, are also feasible in immune-related response evaluations. These studies provided the scientific basis for a current direction toward RECIST-based assessment for immunotherapy, while keeping the important features of irRC. These response criteria are referred to as immune-related RECIST (irRECIST) among investigators of immuno-oncology community and are used in trials of novel immunotherapeutic agents (4,25,26,28).
Another recent development is the introduction of iRECIST, updated criteria for immunotherapy trials (29). iRECIST follows the direction demonstrated by irRECIST in that it utilizes RECIST-based measurements and keeps important modifications to capture immune-related response patterns. Additionally, iRECIST introduced a concept of “unconfirmed PD” (iUPD), which indicates PD according to RECIST 1.1 that remains to be confirmed. iUPD can become “confirmed PD” (iCPD) if the next imaging study in 4–8 weeks shows further increase. The concept can be helpful for further delineation of response assessment results, because patients with initial tumor burden increase may not necessarily be reevaluated with a consecutive study for confirmation. Some patients may choose to start the next systemic therapy without waiting for 4 weeks or more to have the confirmation study. Others may not tolerate immunotherapy any further because of side effects or cannot return for the follow-up study because of clinical deterioration. New lesion assessments were also updated per iRECIST, and instead of new lesion measurements being included in the sum of the entire tumor burden, new lesions are recorded and measured separately (29). iCPD can be assigned if additional new lesions or an increase in new lesions is noted at the next imaging study in 4–8 weeks (29). The value of iRECIST remains to be validated in prospective trials, and some details may need further clarification. Regardless, the introduction of iRECIST further ensures that a RECIST-based approach should be used for immune-related response evaluations and supplements the ongoing efforts to develop a common language for treatment response assessment for immunotherapy.
Pitfalls of Current Immune-Response Evaluations
Pseudoprogression is increasingly recognized among referring physicians and radiologists and is often featured as a representative phenomenon of immune-related tumor response. However, it is also important to be aware that the incidence of pseudoprogression among patients treated with immune-checkpoint inhibitors is low (4,17,30). The incidence rate of pseudoprogression is up to 10% or often lower in melanoma (15,16,31,32), and was 5% in advanced non–small cell lung cancer (NSCLC) in a phase I nivolumab trial (33). A recent study (34) of advanced NSCLC treated with single-agent PD-1 inhibitor therapy as a part of standard care reported pseudoprogression in 0.6% (one of 160) of the patients, further indicating the rarity of the event. In terms of the frequency of subsequent response in patients whose disease progresses initially, a phase I trial of pembrolizumab in ipilimumab-refractory advanced melanoma reported that three (5%) among 58 patients who initially progressed according to RECIST achieved immune-related partial response at 24 weeks (35).
Although further investigations are needed in various tumor types and different immunotherapeutic regimens, based on the accumulated data to date, tumor burden increase during immune-checkpoint inhibitor therapy indicates true progression in most patients rather than pseudoprogression. In this context, radiologists have an essential role in objectively assessing imaging findings in reference to the available data and having active dialogues with referring physicians about the details of specific cases, including the patient's symptoms and overall clinical status for optimal treatment.
Another shortcoming of the current strategy of immune-related response evaluations relates to the timeframe between pseudoprogression and subsequent tumor reduction. The current criteria define confirmed PD on the basis of the second consecutive study at 4–8 weeks later (16,25,26,29,36). However, these recommended time intervals are not based on scientific evidence, and further studies are needed to determine the optimal timeframe for confirmatory studies. Moreover, tumor reduction after pseudoprogression can occur after confirmed PD over the course of several months (Fig 4) (32,34). These observations indicate the limitation of the current methods and the need for further strategies for how to differentiate a small subset of patients with pseudoprogression from other patients to address this ongoing clinical dilemma.
In addition to tumor size changes, tumor density measured as CT attenuation can be a marker for response and outcome in patients with cancer, as demonstrated in gastrointestinal stromal tumors treated with antiangiogenic therapy (8,37). A prior study (38) evaluated CT attenuation changes in patients with advanced melanoma treated with ipilimumab plus the vascular endothelial growth factor inhibitor bevacizumab. One-third of the patients achieved a tumor density increase of 15% or greater, meeting the criteria for partial response according to CT attenuation criteria developed by Choi et al (37). However, attenuation changes were not associated with survival in these patients. The role of CT attenuation changes in evaluating response to immunotherapy remains to be further established (38). Similarly, the role of fluorine 18 fluorodeoxyglucose (FDG) PET in the response assessment of immunotherapy remains to be established.
Emerging Observations in Immune-related Tumor Response Dynamics
Although tumor response criteria are important for defining response and progression and for providing end points for clinical trials, emerging observations from recent studies indicate the importance of longitudinal tumor burden dynamics on serial imaging studies during immunotherapy.
In 96 patients with advanced melanoma treated with pembrolizumab monotherapy, a tumor burden increase of less than 20% from baseline during therapy according to irRECIST was noted in 55% of the patients and was associated with longer overall survival (32). Patients with a tumor burden increase of less than 20% throughout PD-1 therapy had significantly reduced hazards of death compared with those who experienced a tumor burden increase of 20% or greater (hazard ratio [HR] = 0.19 and P < .0001 at univariate analysis; HR = 0.18 and P < .0001 at multivariable analysis) (32). Another study in 160 patients with advanced NSCLC who were treated with nivolumab or pembrolizumab monotherapy (34) also showed a significantly prolonged overall survival in patients with a tumor burden increase of less than 20% throughout therapy compared with those who experienced a tumor burden increase of 20% or greater (HR = 0.24, Cox P < .0001 after adjusting for smoking [HR = 0.86, P = .61] and baseline tumor burden [HR = 1.55, P = .062]). These results propose a practical marker of treatment benefit of immune-checkpoint inhibitor therapy based on the longitudinal evaluations of CT scans to guide treatment decisions.
Additionally, a recent report by Champiat et al (39) described “hyperprogressive disease” as a novel aggressive pattern of immune-related tumor behavior. Hyperprogressive disease was defined as a RECIST progression at the first evaluation and a twofold or greater increase in the tumor growth rate after starting PD-1/PD-L1 inhibitor therapy compared with the period before starting PD-1/PD-L1 inhibitor therapy. Hyperprogressive disease was noted in 9% (12 of 131) of patients treated in phase I clinical trials of PD-1/PD-L1 inhibitor monotherapy for various tumor types and was associated with an older age (P < .05). The frequency of hyperprogressive disease was 19% (seven of 36) in patients older than 65 years, as compared with 5% (five of 95) in patients younger than 64 years (P = .018) (39). These observations indicate a need for further studies to understand the mechanisms of rapid tumor progression and to refine strategies for patient selection for immunotherapy.
Immune-related Adverse Events and the Spectrum of Imaging Manifestations
The use of immune-checkpoint inhibition in cancer treatment is associated with unique toxicities, termed immune-related adverse events (irAEs), which can involve various organs from head to toe. The irAEs present a spectrum of imaging manifestations in an organ-specific manner (40–44). irAEs are newly recognized entities in the past few years of immuno-oncology practice, and thus the concept and knowledge of them are still evolving. The mechanism of irAEs is presumed to be autoimmune effects resulting from misdirected stimulation of the immune system during immunotherapy (45). With the rapidly increasing access to immunotherapeutic agents in the clinical setting, there are increasing demands for radiologists to be familiar with clinical and imaging manifestations of irAEs and to contribute to early diagnosis and optimal monitoring as a member of a multidisciplinary team for cancer care. We focus on a spectrum of clinical and radiographic manifestations of several organ-specific irAEs for which imaging plays critical roles in diagnosis and monitoring.
Hypophysitis
Hypophysitis is one of the most common immune-related endocrinopathies and has been increasingly recognized as an important irAE, noted in up to 10%–13% of patients with melanoma treated with ipilimumab (46–48). The diagnosis of immune-related hypophysitis is presumptive and is generally based on the development of new hypopituitarism and pituitary enlargement at imaging after initiation of immunotherapy without an alternative etiology (49). In a recent meta-analysis of the incidence of endocrine dysfunction in immunotherapy trials (50), patients with melanoma who were treated with PD-1 inhibitors had significantly less risk of hypophysitis (odds ratio [OR], 0.29; P < .001) compared with those treated with ipilimumab. Combination immunotherapy was also associated with significantly higher odds of developing hypophysitis (OR, 2.2; P = .001) . Another study in patients with melanoma treated with ipilimumab reported that male sex and older age were risk factors for immune-related hypophysitis (47).
Clinical presentations of immune-related hypophysitis are commonly headache and fatigue or weakness, while visual defects are extremely rare, likely because the enlargement of the pituitary gland is usually mild compared with lymphocytic hypophysitis in other settings (49). The median onset of hypophysitis was 9 weeks after therapy initiation, with a range of 5–36 weeks, in an ipilimumab-treated cohort (48). New pituitary enlargement at imaging in patients undergoing immune-checkpoint blockade therapy is recognized as a sensitive and specific indicator of the entity (Fig 5) and may precede clinical symptoms or biochemical hypopituitarism (47,49). At MRI, enlarged pituitary glands may demonstrate homogeneous or heterogeneous enhancement, and thickening of the pituitary stalk may also be noted (46,47,49). Treatment strategies include systemic high-dose corticosteroid administration, while hormone replacement for hypophysitis-related hormone deficiencies is also useful (46,47,49). Resolution of pituitary findings at MRI along with resolution of clinical symptoms is often noted during the course of immune-related hypophysitis, where MRI plays an important role for both detection and monitoring of this irAE (46,47,49,51).
Figure 5:
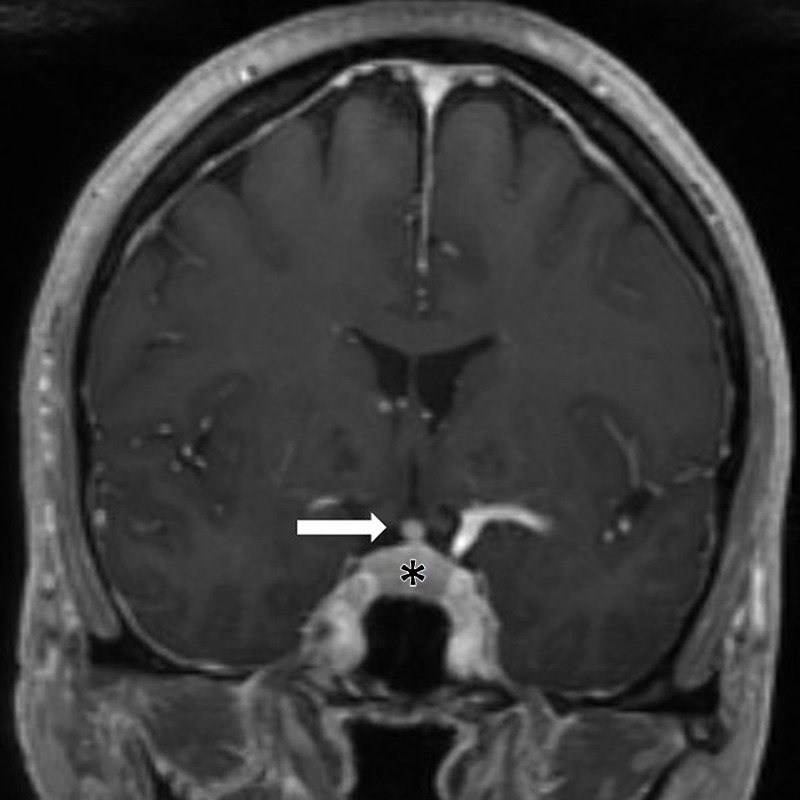
Immune-related hypophysitis in a 56-year-old woman with metastatic melanoma receiving ipilimumab and nivolumab and with headaches at presentation. Coronal MR image after 8 weeks of ipilimumab and nivolumab therapy shows an enlarged pituitary gland (*) and infundibular thickening (arrow), representing immune-related hypophysitis. The symptom and findings resolved after corticosteroid therapy.
Pneumonitis
Pneumonitis related to immune-checkpoint inhibitor therapy is of concern, especially in patients treated with PD-1/PD-L1 inhibitors. Although it is relatively rare, pneumonitis is a clinically serious and potentially life-threatening toxicity of immune-checkpoint blockade, resulting in pneumonitis-related deaths in early phase trials, and is recognized as an “event of special interest” (33,42,52–54). Initial reports of pneumonitis related to immune-checkpoint inhibitors have described a spectrum of radiologic manifestations with different morphologic patterns of interstitial pneumonias (54,55). The clinical courses also varied among patients; some patients required admission to the intensive care unit and sometimes even intubation, whereas others were successfully treated with oral corticosteroids and were able to restart PD-1 inhibitor therapy without experiencing recurrent pneumonitis (54,55). These initial observations prompted further systematic studies of pneumonitis related to immune-checkpoint inhibitors (Fig 6).
Figure 6:

Axial chest CT images show the spectrum of radiographic patterns of immune-checkpoint inhibitor–related pneumonitis, which includes, A, the cryptogenic organizing pneumonia (COP) pattern, B, the nonspecific interstitial pneumonia (NSIP) pattern, C, the hypersensitivity pneumonitis (HP) pattern, and, D, the acute interstitial pneumonia (AIP)/acute respiratory distress syndrome (ARDS) pattern. A, The COP pattern is characterized by multifocal bilateral parenchymal consolidations with peripheral and lower lung distribution, with ground-glass opacities (GGOs) and reticular opacities (arrows). B, The NSIP pattern demonstrates GGOs and reticular opacities predominantly in a peripheral and lower lung distribution (arrows). * = Lung tumor burden. C, The HP pattern demonstrates diffuse GGOs and centrilobular nodularities, with scattered areas of air trapping. D, The AIP/ARDS pattern is characterized by diffuse or multifocal GGOs or consolidations, along with lung volume loss and traction bronchiectasis. (Reprinted, with permission, from reference 66).
In terms of the incidence of pneumonitis, a prior meta-analysis of 20 clinical trials of PD-1 inhibitor therapy in melanoma, NSCLC, and renal cell carcinoma reported that the overall incidence was 2.7% for all-grade pneumonitis and 0.8% for pneumonitis of grade 3 or higher in patients treated with PD-1 inhibitor monotherapy (56). Higher odds of pneumonitis were noted in NSCLC for all-grade pneumonitis (OR, 1.43; P = .05) and for pneumonitis of grade 3 or higher (OR, 2.85; P < .0001) compared with melanoma. Combination immunotherapy had significantly higher odds than monotherapy for all-grade pneumonitis (OR, 2.04; P < .0001) and for pneumonitis of grade 3 or higher (OR, 2.86; P < .0001) (56). Another meta-analysis of 19 clinical trials investigating PD-1 inhibitors and PD-L1 inhibitors as single-agent therapy in NSCLC reported a higher incidence of pneumonitis for PD-1 inhibitors than for PD-L1 inhibitors (3.6% vs 1.3%, respectively; P = .001) (57). In a subanalysis of 550 patients with NSCLC treated with pembrolizumab in the phase I KEYNOTE-001 trial, the overall incidence of pneumonitis was 3.8% (21 of 550) (58). The incidence was higher in patients with a history of asthma or chronic obstructive pulmonary disease (5.3%) and in those with a history of thoracic radiation (6.0%) (58). While these studies provide important insights for the propensity of developing pneumonitis among different patient cohorts, many questions remain to be addressed, including biomarkers for pneumonitis, accurate diagnostic methods and monitoring strategies, and optimal treatment approaches.
From a radiology perspective, characterization of pneumonitis using the radiographic patterns according to the classification of interstitial pneumonias has been shown to be applicable in patients treated with novel precision therapies, including immunotherapy (42,59–66). A prior study characterized the spectrum of radiographic patterns of pneumonitis in correlation with clinical severity in 20 patients with melanoma, NSCLC, or lymphoma who developed pneumonitis during treatment with nivolumab (63). The median time from treatment initiation to the development of pneumonitis was 2.6 months (range, 0.5–11.5 months). A wide spectrum of radiographic patterns was noted, including an acute interstitial pneumonia (AIP)/acute respiratory distress syndrome (ARDS) pattern, a cryptogenic organizing pneumonia (COP) pattern, a nonspecific interstitial pneumonia (NSIP) pattern, and a hypersensitivity pneumonitis (HP) pattern. Among these patterns, a radiographic COP pattern was the most common pattern seen across all tumors and treatment regimens (Fig 7) (63). The radiographic patterns were associated with toxicity grades of pneumonitis, and the AIP/ARDS pattern had the highest grade, followed by the COP pattern, whereas the NSIP and HP patterns were associated with lower grades (median grade: 3, 2, 1, and 1, respectively) (63). The results indicated the utility of a radiographic pattern–based approach as a guide for patient treatment and monitoring for immunotherapy-related pneumonitis.
Figure 7:

Axial chest CT scans show programmed cell death protein 1 (PD-1) inhibitor–related pneumonitis in a patient with advanced non–small cell lung cancer treated with nivolumab. A, B, CT scans at 8 weeks of nivolumab therapy show new ground-glass opacities (GGOs), reticular opacities, and consolidation in the lower lobes predominantly on the left, with a peripheral and lower distribution, radiographically representing a cryptogenic organizing pneumonia (COP) pattern (arrows). C, D, On CT scans obtained at 15 weeks of therapy, the findings have substantially increased and involve all lobes, with multifocal areas of GGO, reticular opacities, and consolidation (arrows), as well as centrilobular nodularity and traction bronchiectasis in a predominantly peripheral distribution, demonstrating the overall features of a COP pattern. E, F, Further follow-up CT scans obtained after 4 weeks of prednisone treatment show a marked decrease in the CT findings with residual GGOs, demonstrating a “reversed halo” sign with central GGO surrounded by dense air-space consolidation of a crescentic shape (arrows in F). G, H, CT scans obtained 4 weeks after the completion of prednisone treatment show development of dense consolidations with GGOs and reticular opacities (arrows) in peripheral and multifocal distributions, involving both upper and lower lobes, again demonstrating the COP pattern noted during the first episode of PD-1 pneumonitis. Given the similarity of the radiographic and clinical manifestations to those of the first episode, the patient restarted prednisone for treatment of a “pneumonitis flare.” I, J, Follow-up CT scans obtained 2 weeks after starting the second course of prednisone therapy show decrease of consolidation and GGOs (arrows), indicating improving pneumonitis in response to corticosteroid therapy. (Reprinted, with permission, from reference 55.).
Treatment of pneumonitis consists of corticosteroids along with withholding the responsible immunotherapeutic agents for most cases. A subset of cases can be unresponsive to corticosteroids and may require additional treatment with infliximab (an anti–tumor necrosis factor-α immunosuppressant), mycophenolate mofetil, or cyclophosphamide (41,42,54,66,67). Re-treatment with immunotherapy after episodes of pneumonitis is another challenging issue. Although the data are limited, up to one-third of patients may be able to restart immune-checkpoint inhibitor therapy after successful treatment of pneumonitis. However, about one-fourth of these patients may experience recurrent pneumonitis due to retreatment (Fig 7) (42,63,66,67). Moreover, in a small subset of patients, pneumonitis may recur after the completion of a corticosteroid taper without restarting immune-checkpoint inhibitors or any other systemic agents, representing a phenomenon termed a “pneumonitis flare” (Fig 7) (27,63). These observations indicate a complex immune-mediated nature for pneumonitis, which requires further investigations to optimize patient selection and monitoring.
Sarcoid-like Lymphadenopathy and Granulomatosis
Sarcoid-like lymphadenopathy and granulomatosis is also recognized as an irAE, most commonly noted in mediastinal and hilar lymph nodes, and noted in up to 5%–7% of patients treated with immune-checkpoint inhibitors (43,44,68). It is often clinically silent without symptoms and can be self limited without specific treatment. Symptomatic patients can be treated with corticosteroids with good response (68). The median time from the initiation of therapy was 3.2 months (range, 0.2–9.1 months) in patients with melanoma treated with ipilimumab (43).
At imaging, mediastinal and hilar lymphadenopathy is seen in patients receiving immune-checkpoint blockade, with distributions and appearance that are similar to those of sarcoidosis. Lymph nodes can be FDG-avid at PET/CT. Lung parenchymal changes with nodular thickening of peribronchovascular bundles and the interlobular septum can also be noted (Fig 8). Histologic sampling of these cases revealed granulomatous inflammation in an interlobular, peribronchiolar, and subpleural distribution resembling sarcoidosis (43,44,68). A recent report (69) demonstrated that this entity can also occur as an isolated finding in the lung, with a focus of lung consolidation in the absence of lymphadenopathy or symptoms. These findings resolve after immune-checkpoint inhibitors are withheld.
Figure 8a:

Sarcoid-like lymphadenopathy in an asymptomatic 81-year-old man with metastatic melanoma treated with ipilimumab. (Reprinted, with permission, from reference 43.) (a) Coronal reformatted contrast-enhanced chest CT scan obtained 4.9 months after the initiation of ipilimumab therapy shows new bilateral symmetric mediastinal and hilar lymphadenopathy (arrows) resembling sarcoidosis. (b) Axial CT image of the lungs shows bilateral irregular and nodular parenchymal opacities with upper- and middle-lung predominance (arrows) and peribronchovascular involvement, which falls in the spectrum of lung parenchymal manifestations of pulmonary sarcoidosis.
Figure 8b:

Sarcoid-like lymphadenopathy in an asymptomatic 81-year-old man with metastatic melanoma treated with ipilimumab. (Reprinted, with permission, from reference 43.) (a) Coronal reformatted contrast-enhanced chest CT scan obtained 4.9 months after the initiation of ipilimumab therapy shows new bilateral symmetric mediastinal and hilar lymphadenopathy (arrows) resembling sarcoidosis. (b) Axial CT image of the lungs shows bilateral irregular and nodular parenchymal opacities with upper- and middle-lung predominance (arrows) and peribronchovascular involvement, which falls in the spectrum of lung parenchymal manifestations of pulmonary sarcoidosis.
Sarcoid-like lymphadenopathy and granulomatosis can create a diagnostic dilemma for radiologists, because most patients receiving immune-checkpoint blockade have advanced malignancy, and new or enlarging lymph nodes primarily raise a suspicion for recurrent or progressive cancer. Accompanying pulmonary changes resembling sarcoidosis can help distinguish this entity from tumor progression or recurrence; however, these are not always present. An elevated angiotensin-converting enzyme level has been reported in some cases but not in others (42–44,68). It is essential for radiologists to be familiar with the clinical and radiographic presentation of this entity, correlate the pattern and onset of imaging findings in relation to the detailed course of immunotherapy, and pay particular attention to the systemic tumor burden changes in other parts of the body. Discussion with clinical providers in terms of the symptoms and overall disease status of cancer also provides important clues for challenging cases (42).
Colitis
Colitis during immune-checkpoint inhibitor therapy is one of the most common organ-specific irAEs, especially for those treated with ipilimumab. The incidence of colitis during immune-checkpoint inhibitor therapy ranges from 8% to 22% (43,70). In ipilimumab-treated patients, colitis usually develops 6–7 weeks after the initiation of treatment and resolves within 6–8 weeks (43,71). Two distinct patterns of clinical and radiographic manifestations of immune-related colitis have been reported. The first pattern is a diffuse colitis pattern, seen in about 75% of cases, which is characterized by mild diffuse bowel wall thickening or a fluid-filled distended colon with mesenteric vessel engorgement (Fig 9) (43,72,73). The second pattern is a segmental colitis associated with diverticulosis (SCAD) pattern, noted in approximately 25% of cases. SCAD is characterized by moderate wall thickening and associated pericolic fat stranding in a segment of preexisting diverticulosis (43,72,73). Although imaging findings of SCAD may be similar to those in infectious diverticulitis, patients with SCAD have relatively mild systemic symptoms and lack evidence of a fecal bacterial pathogen or fecal leukocytes (72).
Figure 9:
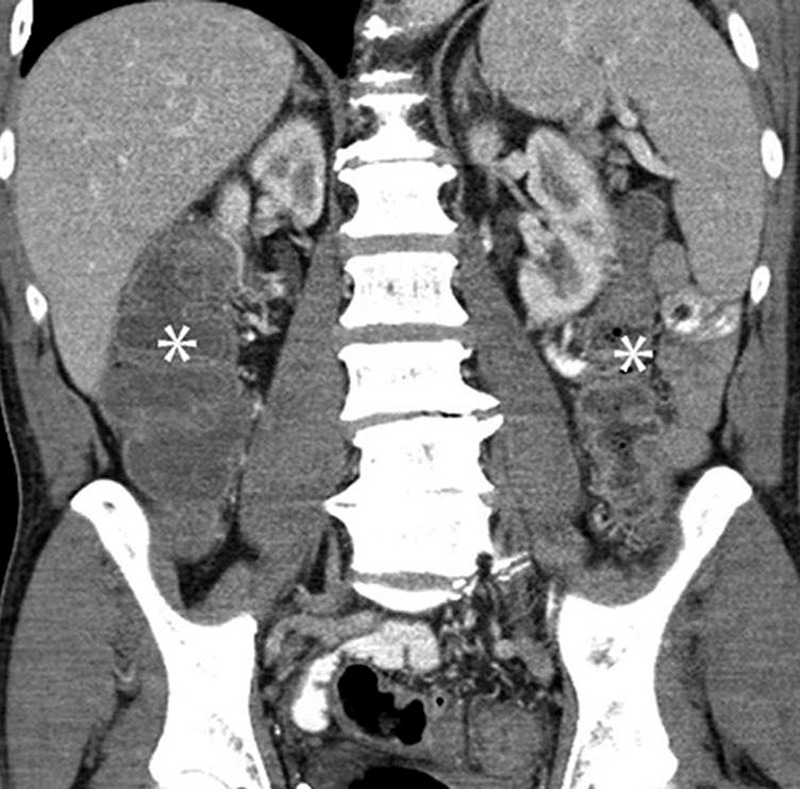
Colitis with a diffuse colitis pattern in a 64-year-old man with advanced melanoma treated with ipilimumab and with diarrhea at presentation. Coronal reformatted contrast-enhanced CT image of the abdomen obtained 2.6 months after the initiation of ipilimumab treatment shows a new finding of a fluid-filled dilated colon (*), with mucosal hyperemia indicating diffuse colitis. Colonoscopic biopsy confirmed colonic inflammation with mucosal injury consistent with ipilimumab-associated colitis. The patient was treated with oral steroids followed by intravenous infliximab, leading to resolution of the findings at the follow-up study performed 1.8 months after onset. (Reprinted, with permission, from reference 43.).
Recognition of these two patterns is important because they are associated with clinical symptoms and management course. A diffuse colitis pattern manifests with profuse watery diarrhea, whereas a SCAD pattern manifests with mixed watery and bloody diarrhea with cramping pain (43,72,73). Diffuse colitis cases can often be managed with corticosteroids alone, while SCAD cases are treated with corticosteroids and antibiotics. A few cases may be corticosteroid refractory and may also require additional therapies (72). Early detection and diagnosis of colitis are critical, because serious complications, including bowel perforation and colitis-related deaths, although rare, can occur if patients are not promptly treated (43,71).
Hepatitis
Hepatitis during immune-checkpoint inhibitor therapy is a relatively rare event, seen in 1%–2% of patients (41,43,71). Time between therapy initiation and hepatitis is 5 weeks (range, 1–49 weeks) in patients treated with PD-1/PD-L1 or CTLA-4 inhibitor monotherapy (74). Hepatitis has a spectrum of manifestations, ranging from mild asymptomatic cases with mildly increased liver function without imaging abnormalities, to severe cases with systemic symptoms and highly elevated liver function test results. Severe cases are often accompanied by hepatomegaly, periportal edema, and periportal lymphadenopathy at imaging (Fig 10) (43,73,75). At histologic examination, two patterns of injury are noted—an acute hepatitis pattern with predominant injuries to hepatocytes, and a biliary pattern with predominant injuries to bile ducts (75). Most cases are treated with corticosteroids, while the addition of azathioprine or mycophenolate mofetil is considered in steroid-refractory cases according to the management guidelines of autoimmune hepatitis (41).
Figure 10:
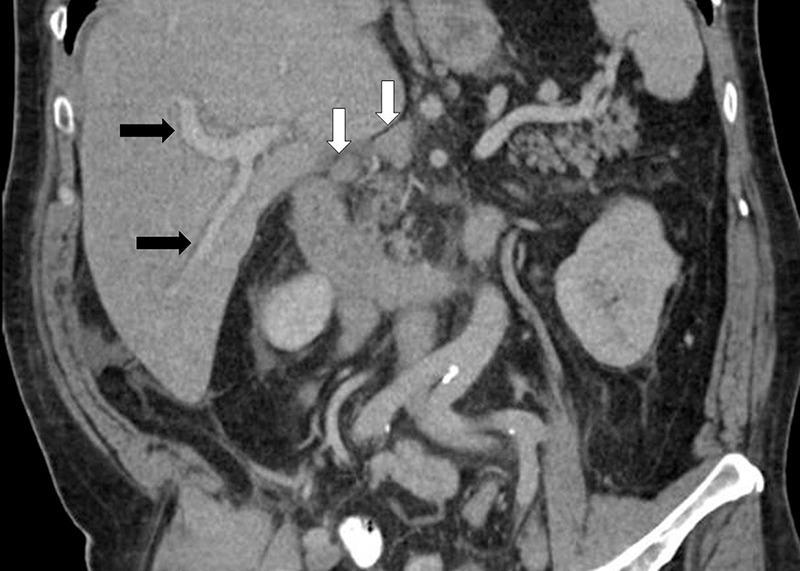
Immune-checkpoint inhibitor-related hepatitis in a patient with metastatic melanoma treated with ipilimumab and with markedly elevated liver function test levels at presentation. Coronal CT scan obtained after 2.7 months of ipilimumab therapy shows new periportal edema (black arrows), new periportal lymphadenopathy (white arrows), and hepatomegaly with trace perihepatic free fluid, demonstrating ipilimumab-related hepatitis.
Other Organ-specific irAEs and Unmet Clinical Needs
A number of other organ-specific irAEs have been described in patients treated with immune-checkpoint inhibitors, including encephalitis, myelitis, arthritis, nephritis, pancreatitis, and myocarditis, to name a few. Among them, a few fatal cases of immune-related myocarditis have recently been reported (76,77). Myocarditis is a rare irAE, occurring in 0.27% of patients treated with PD-1 plus CTLA-4 inhibitors. MRI shows characteristic findings of acute myocarditis, including late gadolinium enhancement in a myocarditis-like pattern noted in the focal subepicardial lateral wall and myocardial edema, indicating another emerging need for radiologists’ contributions (76,77). The concept and knowledge of irAEs are still evolving as we experience more cases in the clinical setting. Many of the irAEs require a multidisciplinary approach based on clinical, radiographic, and sometimes histologic findings for accurate diagnosis and management. The increased awareness of irAEs among health care providers, including radiologists, is essential to further understanding specific toxicities during immunotherapy. Furthermore, there are urgent and unmet clinical needs to further elucidate the mechanisms of irAEs, identify risk factors for improved safety profiles, develop accurate diagnostic methods, and establish optimal management and monitoring strategies for specific types of irAEs. Radiologists are at the front line for the detection, diagnosis, and monitoring of many of these novel irAEs and can make substantial contributions as key members of multidisciplinary cancer care in the era of immuno-oncology.
Emerging Approaches Using Molecular Imaging for Immunotherapy
Although conventional anatomy-based imaging can provide practical information on response and toxicity evaluations in patients treated with immunotherapy in the clinical setting, there are many important questions that remain to be addressed. To address the unmet needs in the field, molecular imaging techniques using novel radioactive tracers that target the key molecules of immune-checkpoint pathways and cellular immune responses have been explored (78–87).
Early efforts have focused on radiolabeling of antibodies against key molecules such as PD-1 and PD-L1 (78–85). Natarajan et al (78,79) developed an anti–PD-1 human antibody labeled with zirconium 89 or copper 64 (64Cu) and demonstrated in vivo imaging of PD-1–expressing tumor-infiltrating lymphocytes within the tumor and lymphoid tissues in mouse models. Heskamp et al (81) developed an indium 111–labeled anti–PD-L1 antibody and demonstrated specific uptake of the tracer in PD-L1–expressing tumors in mouse xenografts. Although these radiolabeled antibodies have advantages as imaging agents, including naturally high avidity, antigen specificity, and ease of production, several disadvantages have also been noted (80). These include long circulation times, high background signal, and nonspecific uptake, resulting in more than 24-hour intervals between the injection of tracers and visualization of target molecules (80).
As a measure to overcome these limitations of antibody-based imaging, Maute et al (88) developed a high-affinity competitive nonantibody antagonist of PD-L1, which demonstrated superior tumor penetration. The antagonist was conjugated with 64Cu-DOTA (tetraazacyclododecane tetraacetic acid) and was tested as a PET tracer. High tumor uptake with favorable tumor-to-background ratios at 1 hour after injection in mouse xenografts was noted, with persistent strong uptake in PD-L1–positive tumors for 24 hours (88). Another approach by Larimer and colleagues (89) focused on in vivo visualization of granzyme B, a serine protease released by CD8+ T cells and natural killer cells during the cellular immune response. A PET imaging agent, gallium 68 (68Ga)-NOTA-GZP, is a radiolabeled peptide developed to detect the release of granzyme B by activated immune cells (89). In tumor-bearing mice treated with PD-1 inhibitor therapies, 68Ga-NOTA-GZP uptake was shown to reflect tumoral granzyme B expression. High 68Ga-NOTA-GZP uptake at 12 days of therapy was predictive of subsequent tumor volume response in tumor-bearing mice treated with a PD-1 inhibitor plus a CTLA-1 inhibitor (89). These promising results in preclinical models support further investigations of these agents for clinical translation to human imaging, to supplement the current strategies to further optimize patient selection, response evaluations, and treatment decision making.
Conclusion
Cancer immunotherapy with immune-checkpoint blockade plays a major role in the treatment of advanced cancers, and clinical application of immune-checkpoint inhibitors continues to expand. Imaging is a key component for characterizing tumor response and progression and detecting and monitoring irAEs in patients treated with immunotherapy. Familiarity with the current strategies of immune-related response and toxicity evaluation and their limitations and pitfalls are essential for radiologists to provide useful information for clinical providers to guide their treatment decisions. Molecular-based imaging has shown promise in addressing unmet clinical needs in the field, and further studies are needed to translate the approach to the clinical setting for better selection and monitoring of patients to maximize the benefit of cancer immunotherapy.
M.N. and H.H. supported by the National Cancer Institute (grants R01CA203636 and U01CA209414).
Disclosures of Conflicts of Interest: M.N. Activities related to the present article: disclosed no relevant relationships. Activities not related to the present article: is a consultant for WorldCare Clinical, Toshiba Medical Systems, and Daiichi Sankyo; institution has received research grants from Merck, Toshiba Medical Systems, and AstraZeneca; has received honoraria for lectures from Bayer and Roche. Other relationships: disclosed no relevant relationships. H.H. Activities related to the present article: disclosed no relevant relationships. Activities not related to the present article: is a consultant for Mitsubishi Chemical Holding and Toshiba Medical Systems; institution has grants or grants pending with Toshiba Medical Systems, Konica-Minolta. Other relationships: disclosed no relevant relationships. F.S.H. Activities related to the present article: disclosed no relevant relationships. Activities not related to the present article: is a consultant for Merck, Bristol-Myers Squibb, Novartis, Genentech, and EMD Serono; institution has grants or grants pending from Bristol-Myers Squibb; institution has patents (planned, pending, or issued) and receives royalties for MICA-Related Disorders; has received payment for development of educational presentations from Harvard Medical School and George Washington Medical School. Other relationships: disclosed no relevant relationships.
Abbreviations:
- CTLA-4
- cytotoxic T-lymphocyte antigen 4
- FDG
- fluorine 18 fluorodeoxyglucose
- irAE
- immune-related adverse event
- irRC
- immune-related response criteria
- irRECIST
- immune-related RECIST
- NSCLC
- non–small cell lung cancer
- OR
- odds ratio
- PD
- progressive disease
- PD-L1
- programmed cell death protein ligand 1
- PD-1
- programmed cell death protein 1
- RECIST
- Response Evaluation Criteria in Solid Tumors
- SCAD
- segmental colitis associated with diverticulosis
References
- 1.Allison JP, Krummel MF. The yin and yang of T cell costimulation. Science 1995;270(5238):932–933. [DOI] [PubMed] [Google Scholar]
- 2.Hodi FS, Mihm MC, Soiffer RJ, et al. Biologic activity of cytotoxic T lymphocyte-associated antigen 4 antibody blockade in previously vaccinated metastatic melanoma and ovarian carcinoma patients. Proc Natl Acad Sci U S A 2003;100(8):4712–4717. [DOI] [PMC free article] [PubMed] [Google Scholar]
- 3.Hodi FS, Oble DA, Drappatz J, et al. CTLA-4 blockade with ipilimumab induces significant clinical benefit in a female with melanoma metastases to the CNS. Nat Clin Pract Oncol 2008;5(9):557–561. [DOI] [PubMed] [Google Scholar]
- 4.Nishino M, Ramaiya NH, Hatabu H, Hodi FS. Monitoring immune-checkpoint blockade: response evaluation and biomarker development. Nat Rev Clin Oncol 2017;14(11):655–668. [DOI] [PMC free article] [PubMed] [Google Scholar]
- 5.Ott PA, Hodi FS, Robert C. CTLA-4 and PD-1/PD-L1 blockade: new immunotherapeutic modalities with durable clinical benefit in melanoma patients. Clin Cancer Res 2013;19(19):5300–5309. [DOI] [PubMed] [Google Scholar]
- 6.Wolchok J. How recent advances in immunotherapy are changing the standard of care for patients with metastatic melanoma. Ann Oncol 2012;23(Suppl 8):viii15–viii21. [DOI] [PMC free article] [PubMed] [Google Scholar]
- 7.Lenschow DJ, Walunas TL, Bluestone JA. CD28/B7 system of T cell costimulation. Annu Rev Immunol 1996;14(1):233–258. [DOI] [PubMed] [Google Scholar]
- 8.Nishino M, Jagannathan JP, Krajewski KM, et al. Personalized tumor response assessment in the era of molecular medicine: cancer-specific and therapy-specific response criteria to complement pitfalls of RECIST. AJR Am J Roentgenol 2012;198(4):737–745. [DOI] [PMC free article] [PubMed] [Google Scholar]
- 9.Zielinski C, Knapp S, Mascaux C, Hirsch F. Rationale for targeting the immune system through checkpoint molecule blockade in the treatment of non-small-cell lung cancer. Ann Oncol 2013;24(5):1170–1179. [DOI] [PMC free article] [PubMed] [Google Scholar]
- 10.Pardoll DM. The blockade of immune checkpoints in cancer immunotherapy. Nat Rev Cancer 2012;12(4):252–264. [DOI] [PMC free article] [PubMed] [Google Scholar]
- 11.Chen DS, Irving BA, Hodi FS. Molecular pathways: next-generation immunotherapy—inhibiting programmed death-ligand 1 and programmed death-1. Clin Cancer Res 2012;18(24):6580–6587. [DOI] [PubMed] [Google Scholar]
- 12.Okazaki T, Chikuma S, Iwai Y, Fagarasan S, Honjo T. A rheostat for immune responses: the unique properties of PD-1 and their advantages for clinical application. Nat Immunol 2013;14(12):1212–1218. [DOI] [PubMed] [Google Scholar]
- 13.Hodi FS, O’Day SJ, McDermott DF, et al. Improved survival with ipilimumab in patients with metastatic melanoma. N Engl J Med 2010;363(8):711–723. [DOI] [PMC free article] [PubMed] [Google Scholar]
- 14.European Medicines Agency Web site. http://www.ema.europa.eu/ema/. Accessed July 16, 2018.
- 15.Hodi FS, Hwu WJ, Kefford R, et al. Evaluation of immune-related response criteria and RECIST v1.1 in patients with advanced melanoma treated with pembrolizumab. J Clin Oncol 2016;34(13):1510–1517. [DOI] [PMC free article] [PubMed] [Google Scholar]
- 16.Wolchok JD, Hoos A, O’Day S, et al. Guidelines for the evaluation of immune therapy activity in solid tumors: immune-related response criteria. Clin Cancer Res 2009;15(23):7412–7420. [DOI] [PubMed] [Google Scholar]
- 17.Chiou VL, Burotto M. Pseudoprogression and immune-related response in solid tumors. J Clin Oncol 2015;33(31):3541–3543. [DOI] [PMC free article] [PubMed] [Google Scholar]
- 18.Miller AB, Hoogstraten B, Staquet M, Winkler A. Reporting results of cancer treatment. Cancer 1981;47(1):207–214. [DOI] [PubMed] [Google Scholar]
- 19.Therasse P, Arbuck SG, Eisenhauer EA, et al. New guidelines to evaluate the response to treatment in solid tumors: European Organization for Research and Treatment of Cancer, National Cancer Institute of the United States, National Cancer Institute of Canada. J Natl Cancer Inst 2000;92(3):205–216. [DOI] [PubMed] [Google Scholar]
- 20.Eisenhauer EA, Therasse P, Bogaerts J, et al. New response evaluation criteria in solid tumours: revised RECIST guideline (version 1.1). Eur J Cancer 2009;45(2):228–247. [DOI] [PubMed] [Google Scholar]
- 21.Nishino M, Jagannathan JP, Ramaiya NH, Van den Abbeele AD. Revised RECIST guideline version 1.1: what oncologists want to know and what radiologists need to know. AJR Am J Roentgenol 2010;195(2):281–289. [DOI] [PubMed] [Google Scholar]
- 22.Erasmus JJ, Gladish GW, Broemeling L, et al. Interobserver and intraobserver variability in measurement of non-small-cell carcinoma lung lesions: implications for assessment of tumor response. J Clin Oncol 2003;21(13):2574–2582. [DOI] [PubMed] [Google Scholar]
- 23.Nishino M, Guo M, Jackman DM, et al. CT tumor volume measurement in advanced non-small-cell lung cancer: performance characteristics of an emerging clinical tool. Acad Radiol 2011;18(1):54–62. [DOI] [PMC free article] [PubMed] [Google Scholar]
- 24.Zhao B, James LP, Moskowitz CS, et al. Evaluating variability in tumor measurements from same-day repeat CT scans of patients with non-small cell lung cancer. Radiology 2009;252(1):263–272. [DOI] [PMC free article] [PubMed] [Google Scholar]
- 25.Nishino M, Gargano M, Suda M, Ramaiya NH, Hodi FS. Optimizing immune-related tumor response assessment: does reducing the number of lesions impact response assessment in melanoma patients treated with ipilimumab? J Immunother Cancer 2014;2(1):17. [DOI] [PMC free article] [PubMed] [Google Scholar]
- 26.Nishino M, Giobbie-Hurder A, Gargano M, Suda M, Ramaiya NH, Hodi FS. Developing a common language for tumor response to immunotherapy: immune-related response criteria using unidimensional measurements. Clin Cancer Res 2013;19(14):3936–3943. [DOI] [PMC free article] [PubMed] [Google Scholar]
- 27.Nishino M, Ramaiya NH, Chambers ES, et al. Immune-related response assessment during PD-1 inhibitor therapy in advanced non-small-cell lung cancer patients. J Immunother Cancer 2016;4(1):84. [DOI] [PMC free article] [PubMed] [Google Scholar]
- 28.Bohnsack O, Hoos A, Ludajic K. 1070P - Adaptation of the immune-related response criteria: irRECIST. Ann Oncol 2014;25(Suppl 4):iv361–iv372. [Google Scholar]
- 29.Seymour L, Bogaerts J, Perrone A, et al. iRECIST: guidelines for response criteria for use in trials testing immunotherapeutics. Lancet Oncol 2017;18(3):e143–e152. [DOI] [PMC free article] [PubMed] [Google Scholar]
- 30.Nishino M. Immune-related response evaluations during immune-checkpoint inhibitor therapy: establishing a “common language” for the new arena of cancer treatment. J Immunother Cancer 2016;4(1):30. [DOI] [PMC free article] [PubMed] [Google Scholar]
- 31.Nishino M, Giobbie-Hurder A, Manos MP, et al. Immune-related tumor response dynamics in melanoma patients (pts) treated with pembrolizumab: identifying markers for clinical outcome and treatment decisions. J Clin Oncol 2017;35(15 Suppl):9521. [DOI] [PMC free article] [PubMed] [Google Scholar]
- 32.Nishino M, Giobbie-Hurder A, Manos MP, et al. Immune-related tumor response dynamics in melanoma patients treated with pembrolizumab: identifying markers for clinical outcome and treatment decisions. clin cancer res 2017;23(16):4671–4679. [DOI] [PMC free article] [PubMed] [Google Scholar]
- 33.Gettinger SN, Horn L, Gandhi L, et al. Overall survival and long-term safety of nivolumab (anti-programmed death 1 antibody, BMS-936558, ONO-4538) in patients with previously treated advanced non-small-cell lung cancer. J Clin Oncol 2015;33(18):2004–2012. [DOI] [PMC free article] [PubMed] [Google Scholar]
- 34.Nishino M, Dahlberg SE, Adeni AE, et al. Tumor response dynamics of advanced non-small cell lung cancer patients treated with PD-1 inhibitors: imaging markers for treatment outcome. Clin Cancer Res 2017;23(19):5737–5744. [DOI] [PMC free article] [PubMed] [Google Scholar]
- 35.Robert C, Ribas A, Wolchok JD, et al. Anti-programmed-death-receptor-1 treatment with pembrolizumab in ipilimumab-refractory advanced melanoma: a randomised dose-comparison cohort of a phase 1 trial. Lancet 2014;384(9948):1109–1117. [DOI] [PubMed] [Google Scholar]
- 36.Okada H, Weller M, Huang R, et al. Immunotherapy response assessment in neuro-oncology: a report of the RANO working group. Lancet Oncol 2015;16(15):e534–e542. [DOI] [PMC free article] [PubMed] [Google Scholar]
- 37.Choi H, Charnsangavej C, de Castro Faria S, et al. CT evaluation of the response of gastrointestinal stromal tumors after imatinib mesylate treatment: a quantitative analysis correlated with FDG PET findings. AJR Am J Roentgenol 2004;183(6):1619–1628. [DOI] [PubMed] [Google Scholar]
- 38.Nishino M, Giobbie-Hurder A, Ramaiya NH, Hodi FS. Response assessment in metastatic melanoma treated with ipilimumab and bevacizumab: CT tumor size and density as markers for response and outcome. J Immunother Cancer 2014;2(1):40. [DOI] [PMC free article] [PubMed] [Google Scholar]
- 39.Champiat S, Dercle L, Ammari S, et al. Hyperprogressive disease is a new pattern of progression in cancer patients treated by anti-PD-1/PD-L1. Clin Cancer Res 2017;23(8):1920–1928. [DOI] [PubMed] [Google Scholar]
- 40.Weber JS, Hodi FS, Wolchok JD, et al. Safety profile of nivolumab monotherapy: a pooled analysis of patients with advanced melanoma. J Clin Oncol 2017;35(7):785–792. [DOI] [PubMed] [Google Scholar]
- 41.Michot JM, Bigenwald C, Champiat S, et al. Immune-related adverse events with immune checkpoint blockade: a comprehensive review. Eur J Cancer 2016;54:139–148. [DOI] [PubMed] [Google Scholar]
- 42.Nishino M, Hatabu H, Sholl LM, Ramaiya NH. Thoracic complications of precision cancer therapies: a practical guide for radiologists in the new era of cancer care. RadioGraphics 2017;37(5):1371–1387. [DOI] [PMC free article] [PubMed] [Google Scholar]
- 43.Tirumani SH, Ramaiya NH, Keraliya A, et al. Radiographic profiling of immune-related adverse events in advanced melanoma patients treated with ipilimumab. Cancer Immunol Res 2015;3(10):1185–1192. [DOI] [PMC free article] [PubMed] [Google Scholar]
- 44.Bronstein Y, Ng CS, Hwu P, Hwu WJ. Radiologic manifestations of immune-related adverse events in patients with metastatic melanoma undergoing anti-CTLA-4 antibody therapy. AJR Am J Roentgenol 2011;197(6):W992–W1000. [DOI] [PubMed] [Google Scholar]
- 45.Baxi S, Yang A, Gennarelli RL, et al. Immune-related adverse events for anti-PD-1 and anti-PD-L1 drugs: systematic review and meta-analysis. BMJ 2018;360:k793. [DOI] [PMC free article] [PubMed] [Google Scholar]
- 46.Comstock DE, Nishino M, Giardino AA. Headache in the setting of immunotherapy treatment for metastatic melanoma. JAMA Oncol 2017;3(5):703–704. [DOI] [PubMed] [Google Scholar]
- 47.Faje AT, Sullivan R, Lawrence D, et al. Ipilimumab-induced hypophysitis: a detailed longitudinal analysis in a large cohort of patients with metastatic melanoma. J Clin Endocrinol Metab 2014;99(11):4078–4085. [DOI] [PubMed] [Google Scholar]
- 48.Min L, Hodi FS, Giobbie-Hurder A, et al. Systemic high-dose corticosteroid treatment does not improve the outcome of ipilimumab-related hypophysitis: a retrospective cohort study. Clin Cancer Res 2015;21(4):749–755. [DOI] [PMC free article] [PubMed] [Google Scholar]
- 49.Faje A. Immunotherapy and hypophysitis: clinical presentation, treatment, and biologic insights. Pituitary 2016;19(1):82–92. [DOI] [PubMed] [Google Scholar]
- 50.Barroso-Sousa R, Barry WT, Garrido-Castro AC, et al. Incidence of endocrine dysfunction following the use of different immune checkpoint inhibitor regimens: a systematic review and meta-analysis. JAMA Oncol 2018;4(2):173–182. [DOI] [PMC free article] [PubMed] [Google Scholar]
- 51.Carpenter KJ, Murtagh RD, Lilienfeld H, Weber J, Murtagh FR. Ipilimumab-induced hypophysitis: MR imaging findings. AJNR Am J Neuroradiol 2009;30(9):1751–1753. [DOI] [PMC free article] [PubMed] [Google Scholar]
- 52.Topalian SL, Hodi FS, Brahmer JR, et al. Safety, activity, and immune correlates of anti-PD-1 antibody in cancer. N Engl J Med 2012;366(26):2443–2454. [DOI] [PMC free article] [PubMed] [Google Scholar]
- 53.Postow MA, Chesney J, Pavlick AC, et al. Nivolumab and ipilimumab versus ipilimumab in untreated melanoma. N Engl J Med 2015;372(21):2006–2017. [DOI] [PMC free article] [PubMed] [Google Scholar]
- 54.Nishino M, Sholl LM, Hodi FS, Hatabu H, Ramaiya NH. Anti-PD-1-related pneumonitis during cancer immunotherapy. N Engl J Med 2015;373(3):288–290. [DOI] [PMC free article] [PubMed] [Google Scholar]
- 55.Nishino M, Chambers ES, Chong CR, et al. Anti-PD-1 inhibitor-related pneumonitis in non-small cell lung cancer. Cancer Immunol Res 2016;4(4):289–293. [DOI] [PMC free article] [PubMed] [Google Scholar]
- 56.Nishino M, Giobbie-Hurder A, Hatabu H, Ramaiya NH, Hodi FS. Incidence of programmed cell death 1 inhibitor-related pneumonitis in patients with advanced cancer: a systematic review and meta-analysis. JAMA Oncol 2016;2(12):1607–1616. [DOI] [PubMed] [Google Scholar]
- 57.Khunger M, Rakshit S, Pasupuleti V, et al. Incidence of pneumonitis with use of programmed death 1 and programmed death-ligand 1 inhibitors in non-small cell lung cancer: a systematic review and meta-analysis of trials. Chest 2017;152(2):271–281. [DOI] [PubMed] [Google Scholar]
- 58.Ahn MA, Gandhi L, Hamid O, et al. 459P - Risk of pneumonitis in patients with advanced NSCLC treated with pembrolizumab in KEYNOTE-001. Ann Oncol 2015;26(Suppl 9):125–147. [Google Scholar]
- 59.Müller NL, White DA, Jiang H, Gemma A. Diagnosis and management of drug-associated interstitial lung disease. Br J Cancer 2004;91(Suppl 2):S24–S30. [DOI] [PMC free article] [PubMed] [Google Scholar]
- 60.Min JH, Lee HY, Lim H, et al. Drug-induced interstitial lung disease in tyrosine kinase inhibitor therapy for non-small cell lung cancer: a review on current insight. Cancer Chemother Pharmacol 2011;68(5):1099–1109. [DOI] [PubMed] [Google Scholar]
- 61.Nishino M, Boswell EN, Hatabu H, Ghobrial IM, Ramaiya NH. Drug-related pneumonitis during mammalian target of rapamycin inhibitor therapy: radiographic pattern-based approach in Waldenström macroglobulinemia as a paradigm. Oncologist 2015;20(9):1077–1083. [DOI] [PMC free article] [PubMed] [Google Scholar]
- 62.Nishino M, Brais LK, Brooks NV, Hatabu H, Kulke MH, Ramaiya NH. Drug-related pneumonitis during mammalian target of rapamycin inhibitor therapy in patients with neuroendocrine tumors: a radiographic pattern-based approach. Eur J Cancer 2016;53:163–170. [DOI] [PMC free article] [PubMed] [Google Scholar]
- 63.Nishino M, Ramaiya NH, Awad MM, et al. PD-1 inhibitor-related pneumonitis in advanced cancer patients: radiographic patterns and clinical course. Clin Cancer Res 2016;22(24):6051–6060. [DOI] [PMC free article] [PubMed] [Google Scholar]
- 64.Erasmus JJ, McAdams HP, Rossi SE. High-resolution CT of drug-induced lung disease. Radiol Clin North Am 2002;40(1):61–72. [DOI] [PubMed] [Google Scholar]
- 65.Travis WD, Costabel U, Hansell DM, et al. An official American Thoracic Society/European Respiratory Society statement: update of the international multidisciplinary classification of the idiopathic interstitial pneumonias. Am J Respir Crit Care Med 2013;188(6):733–748. [DOI] [PMC free article] [PubMed] [Google Scholar]
- 66.Nishino M, Hatabu H, Hodi FS, Ramaiya NH. Drug-related pneumonitis in the era of precision cancer therapy. JCO Precis Oncol 2017 May 26 [Epub ahead of print]. [DOI] [PMC free article] [PubMed] [Google Scholar]
- 67.Naidoo J, Wang X, Woo KM, et al. Pneumonitis in patients treated with anti-programmed death-1/programmed death ligand 1 therapy. J Clin Oncol 2017;35(7):709–717. [DOI] [PMC free article] [PubMed] [Google Scholar]
- 68.Berthod G, Lazor R, Letovanec I, et al. Pulmonary sarcoid-like granulomatosis induced by ipilimumab. J Clin Oncol 2012;30(17):e156–e159. [DOI] [PubMed] [Google Scholar]
- 69.Nishino M, Sholl LM, Awad MM, Hatabu H, Armand P, Hodi FS. Sarcoid-like granulomatosis of the lung related to immune-checkpoint inhibitors: distinct clinical and imaging features of a unique immune-related adverse event. Cancer Immunol Res 2018;6(6):630–635. [DOI] [PMC free article] [PubMed] [Google Scholar]
- 70.Boutros C, Tarhini A, Routier E, et al. Safety profiles of anti-CTLA-4 and anti-PD-1 antibodies alone and in combination. Nat Rev Clin Oncol 2016;13(8):473–486. [DOI] [PubMed] [Google Scholar]
- 71.Weber JS, Dummer R, de Pril V, Lebbé C, Hodi FS; MDX010-20 Investigators. Patterns of onset and resolution of immune-related adverse events of special interest with ipilimumab: detailed safety analysis from a phase 3 trial in patients with advanced melanoma. Cancer 2013;119(9):1675–1682. [DOI] [PubMed] [Google Scholar]
- 72.Kim KW, Ramaiya NH, Krajewski KM, et al. Ipilimumab-associated colitis: CT findings. AJR Am J Roentgenol 2013;200(5):W468–W474. [DOI] [PubMed] [Google Scholar]
- 73.Nishino M, Tirumani SH, Ramaiya NH, Hodi FS. Cancer immunotherapy and immune-related response assessment: the role of radiologists in the new arena of cancer treatment. Eur J Radiol 2015;84(7):1259–1268. [DOI] [PMC free article] [PubMed] [Google Scholar]
- 74.De Martin E, Michot JM, Papouin B, et al. Characterization of liver injury induced by cancer immunotherapy using immune checkpoint inhibitors. J Hepatol 2018;68(6):1181–1190. [DOI] [PubMed] [Google Scholar]
- 75.Kim KW, Ramaiya NH, Krajewski KM, et al. Ipilimumab associated hepatitis: imaging and clinicopathologic findings. Invest New Drugs 2013;31(4):1071–1077. [DOI] [PubMed] [Google Scholar]
- 76.Löffler AI, Salerno M. Cardiac MRI for the evaluation of oncologic cardiotoxicity. J Nucl Cardiol 2018 May 7 [Epub ahead of print]. [DOI] [PMC free article] [PubMed] [Google Scholar]
- 77.Johnson DB, Balko JM, Compton ML, et al. Fulminant myocarditis with combination immune checkpoint blockade. N Engl J Med 2016;375(18):1749–1755. [DOI] [PMC free article] [PubMed] [Google Scholar]
- 78.Natarajan A, Mayer AT, Xu L, Reeves RE, Gano J, Gambhir SS. Novel radiotracer for ImmunoPET imaging of PD-1 checkpoint expression on tumor infiltrating lymphocytes. Bioconjug Chem 2015;26(10):2062–2069. [DOI] [PubMed] [Google Scholar]
- 79.Natarajan A, Mayer AT, Reeves RE, Nagamine CM, Gambhir SS. Development of novel ImmunoPET tracers to image human PD-1 checkpoint expression on tumor-infiltrating lymphocytes in a humanized mouse model. Mol Imaging Biol 2017;19(6):903–914. [DOI] [PMC free article] [PubMed] [Google Scholar]
- 80.Mayer AT, Natarajan A, Gordon SR, et al. Practical Immuno-PET radiotracer design considerations for human immune checkpoint imaging. J Nucl Med 2017;58(4):538–546. [DOI] [PMC free article] [PubMed] [Google Scholar]
- 81.Heskamp S, Hobo W, Molkenboer-Kuenen JD, et al. Noninvasive imaging of tumor PD-L1 expression using radiolabeled anti-PD-L1 antibodies. Cancer Res 2015;75(14):2928–2936. [DOI] [PubMed] [Google Scholar]
- 82.Josefsson A, Nedrow JR, Park S, et al. Imaging, biodistribution, and dosimetry of radionuclide-labeled PD-L1 antibody in an immunocompetent mouse model of breast cancer. Cancer Res 2016;76(2):472–479. [DOI] [PMC free article] [PubMed] [Google Scholar]
- 83.Nedrow JR, Josefsson A, Park S, Ranka S, Roy S, Sgouros G. Imaging of programmed cell death ligand 1: impact of protein concentration on distribution of anti-PD-L1 SPECT agents in an immunocompetent murine model of melanoma. J Nucl Med 2017;58(10):1560–1566. [DOI] [PMC free article] [PubMed] [Google Scholar]
- 84.Chatterjee S, Lesniak WG, Gabrielson M, et al. A humanized antibody for imaging immune checkpoint ligand PD-L1 expression in tumors. Oncotarget 2016;7(9):10215–10227. [DOI] [PMC free article] [PubMed] [Google Scholar]
- 85.Lesniak WG, Chatterjee S, Gabrielson M, et al. PD-L1 detection in tumors using [(64)Cu]atezolizumab with PET. Bioconjug Chem 2016;27(9):2103–2110. [DOI] [PMC free article] [PubMed] [Google Scholar]
- 86.Ehlerding EB, England CG, McNeel DG, Cai W. Molecular imaging of immunotherapy targets in cancer. J Nucl Med 2016;57(10):1487–1492. [DOI] [PMC free article] [PubMed] [Google Scholar]
- 87.Larimer BM, Wehrenberg-Klee E, Caraballo A, Mahmood U. Quantitative CD3 PET imaging predicts tumor growth response to anti-CTLA-4 therapy. J Nucl Med 2016;57(10):1607–1611. [DOI] [PMC free article] [PubMed] [Google Scholar]
- 88.Maute RL, Gordon SR, Mayer AT, et al. Engineering high-affinity PD-1 variants for optimized immunotherapy and immuno-PET imaging. Proc Natl Acad Sci U S A 2015;112(47):E6506–E6514. [DOI] [PMC free article] [PubMed] [Google Scholar]
- 89.Larimer BM, Wehrenberg-Klee E, Dubois F, et al. Granzyme B PET imaging as a predictive biomarker of immunotherapy response. Cancer Res 2017;77(9):2318–2327. [DOI] [PMC free article] [PubMed] [Google Scholar]