Supplemental Digital Content is available in the text.
Keywords: cerebral small vessel disease; blood flow velocity; cerebral hemorrhage; magnetic resonance imaging; perforating artery; pulsatility index; stroke, lacunar
Abstract
Background and Purpose—
Cerebral small vessel disease (SVD) is a major cause of stroke and dementia, but underlying disease mechanisms are still largely unknown, partly because of the difficulty in assessing small vessel function in vivo. We developed a method to measure blood flow velocity pulsatility in perforating arteries in the basal ganglia and semioval center. We aimed to determine whether this novel method could detect functional abnormalities at the level of the small vessels in patients with stroke attributable to SVD.
Methods—
We investigated 10 patients with lacunar infarction (mean age 61 years, 80% men), 11 patients with deep intracerebral hemorrhage (ICH) considered to be caused by SVD (ICH, mean age 58 years, 82% men) and 18 healthy controls that were age- and sex-matched. We performed 2-dimensional phase contrast magnetic resonance imaging at 7 T to measure time-resolved blood flow velocity in cerebral perforating arteries of the semioval center and the basal ganglia. We compared the number of detected arteries, pulsatility index and mean velocity between the patient groups and controls.
Results—
In the basal ganglia, the number of detected perforators was lower in lacunar infarction (26±9, P=0.01) and deep ICH patients (28±6, P=0.02) than in controls (35±7). The pulsatility index in the basal ganglia was higher in lacunar infarction (1.07±0.13, P=0.03), and deep ICH patients (1.02±0.11, P=0.11), than in controls (0.94±0.10). Observations in the semioval center were similar. Number of detected perforators was lower in lacunar infarction (32±18, P=0.06), and deep ICH patients (28±18, P=0.02), than in controls (45±16). The pulsatility index was higher in lacunar infarction (1.18±0.15, P=0.02), and deep ICH patients (1.17±0.14, P=0.045) than in controls (1.08±0.07). No velocity differences were detected.
Conclusions—
This exploratory study shows that SVD can be expressed in terms of functional measures, such as pulsatility index, which are derived directly from the small vessels themselves. Future studies may use this technique to further unravel the mechanisms underlying SVD.
Cerebral small vessel disease (SVD) is a major cause of stroke and dementia. As such it imposes a significant disease burden on the aging population and on healthcare globally.1,2 Two stroke subtypes that are explicitly linked to SVD are lacunar ischemic stroke and (hypertension related) deep intracerebral hemorrhage (ICH). Currently, there is no effective treatment specifically targeting the small vessels. This is largely related to the fact that the exact disease mechanisms contributing to the main forms of SVD, arteriolosclerosis and cerebral amyloid angiopathy, are still largely unknown. A challenge in this field is that the affected vessels have thus far been inaccessible by in vivo human imaging. Imaging assessment of the burden of SVD in the brain therefore largely relies on detection of the parenchymal lesions that develop as a consequence of SVD.1,2 With the advent of high-field magnetic resonance imaging (MRI) it is starting to become feasible to assess the structure and function of tiny cerebral arterial perforators.3
Increased blood flow pulsation is hypothesized to reflect—and possibly even is a contributing mechanism to several cerebrovascular pathologies involving larger arteries, but likely also in SVD.4,5 Until now, Doppler ultrasound and lower field MRI have been used to measure blood flow pulsation in the large intracerebral vessels such as the middle cerebral artery, but these techniques lack the resolution to probe the smaller vessels. Increased pulsation in these large vessels is a prognostic factor for ischemic stroke and is applied in research into cerebrovascular disease.4–6 Taking measurements of pulsatility to the level of the small vessels themselves would offer a potential breakthrough in SVD research.
Recently, we have developed a novel MRI technique that allows the assessment of the pulsatile blood flow velocity in small cerebral perforating arteries using 2-dimensional (2D) phase contrast MRI at 7 T.7,8 It is able to reproducibly measure blood flow velocity and its pulsation in perforating arteries of the basal ganglia (BG, diameters up to 1 mm) and the semioval center (CSO, diameters under 200 µm)9,10 in older subjects. These perforating arteries are among the vessels that are affected by arteriolosclerosis in lacunar stroke and deep ICH.1,10
The aim of this explorative study is to compare blood flow velocity and its pulsatility in perforating arteries between patients with lacunar infarcts or deep ICH, and healthy controls.
Methods
Study Participants
The data created for this study have not been made publicly available. The institutional review board of our hospital approved this study and all subjects provided written informed consent. Patients were recruited through the Department of Neurology at the University Medical Center Utrecht. Patients were eligible for inclusion if they had been admitted up to 4 years before the study for either a lacunar infarction or a spontaneous deep ICH, attributed to SVD without evidence for an alternative cause during the diagnostic workup. Lacunar infarction is the prototype of cerebral ischemia caused by SVD and deep ICH related to hypertensive vasculopathy is the prototypic hemorrhagic stroke caused by hypertension-related SVD. Both patients with lacunar infarction and deep ICH were diagnosed according to standard clinical guidelines. Patients were diagnosed with lacunar infarction only if they presented with acute deficits compatible with lacunar infarction and had a compatible recent small vessel subcortical infarct on MRI in the days following the stroke.11 Patients were diagnosed with deep ICH caused by SVD only if they presented with acute neurological deficits and a lesion (mostly on admission computed tomography) compatible with hypertension-related deep ICH, with no other explanation on clinical imaging (generally computed tomography or MR angiography). We excluded patients who were dependent on others for their activities of daily living and those who were not able to provide informed consent. We recruited the partners of participating patients as healthy controls and we recruited controls that participated in previous studies. We applied frequency matching to make the controls age- and sex-matched to the patient groups. Controls were not eligible for inclusion if they had a history of neurological disease. Controls were excluded when they proved to have silent SVD on their MRI, defined as white matter hyperintensities (Fazekas scale ≥2), lacunar infarction or deep ICH. A total of 11 patients with lacunar infarction, 12 with deep ICH, and 20 controls were recruited.
All patients were interviewed with a questionnaire about cardiovascular risk factors and medical history. A body mass index was calculated from self-reported height and weight and blood pressure was measured on the day of study participation (last measurement out of 3). Hypertension was defined as a (systolic/diastolic) blood pressure above 140/90 mm Hg or as the use of antihypertensive drugs. Hypercholesterolemia was defined as previously diagnosed or current use of statins. Cardiovascular disease other than the inclusion and exclusion criteria was defined as a history of myocardial infarction, peripheral arterial disease, aneurysm, cardiac arrhythmia, heart failure, or valvular heart disease. Smoking was recorded as the cumulated pack-years (cigarettes smoked per day÷20×years of active smoking).
Measurements
A previously published velocity encoded 2D phase contrast MRI (2D PC) acquisition was performed at 7 T to measure time-resolved blood flow velocity in cerebral perforating arteries (Table 1).7,8 The 2D PC acquisition was performed in perforating arteries at the level of the BG, and in smaller perforating arteries at the level of the CSO (Figure 1). An anatomic acquisition was performed for planning and segmentation purposes. A fast fluid-attenuated inversion-recovery acquisition was performed to assess white matter hyperintensities.12 The parameters for the non-2D PC acquisitions can be found in the online-only Data Supplement.
Table 1.
Scan Parameters
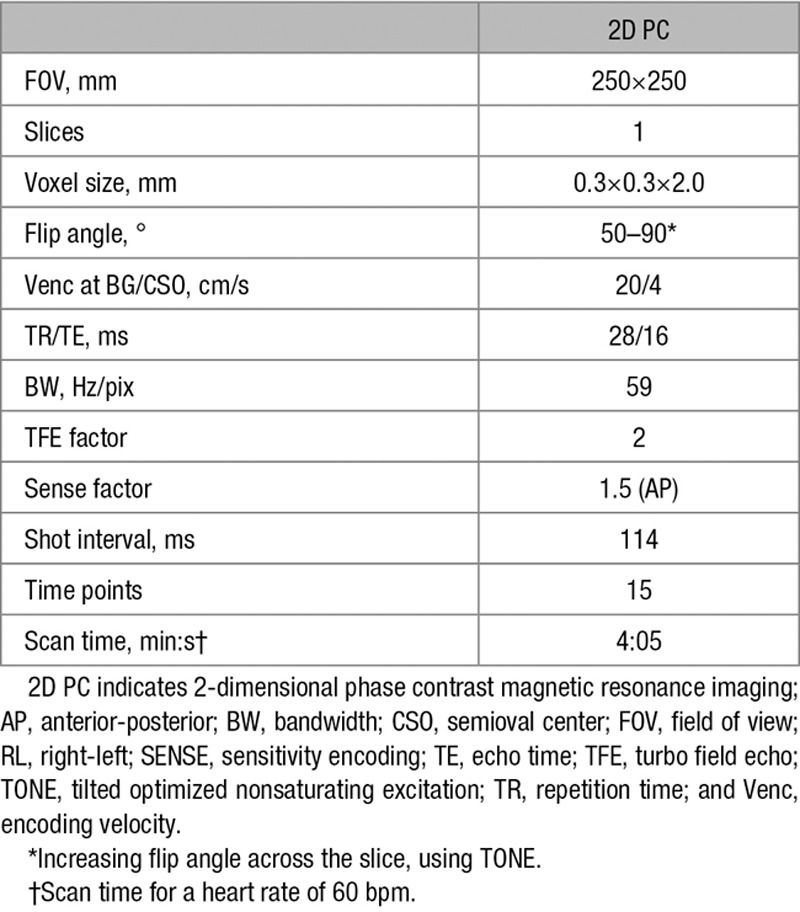
Figure 1.
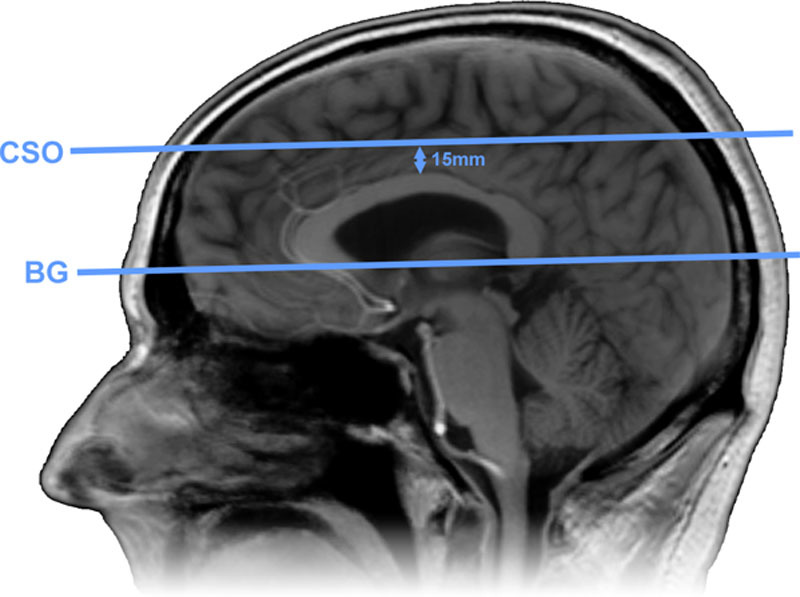
Slice planning. The 2-dimensional phase contrast magnetic resonance imaging (2D PC) slice through the basal ganglia (BG) was planned parallel to and just below the genu and splenium of the corpus callosum. The slice through the semioval center (CSO) was planned parallel to the BG slice at 15 mm above the corpus callosum.
The 2D PC acquisitions used a tilted optimized nonsaturating excitation pulse, with an increasing flip angle in the feet-head direction (50–90 degrees). Two velocity encoding cycles were acquired per cardiac time point (turbo field echo factor of 2), resulting in a temporal resolution of 114 ms (4·repetition time). The echo time of 16 ms causes veins (with a short transverse relaxation time [T2*]) to have nearly no signal, while arteries still have high signal.13 This ensures that only arterioles will be detected. As in previous studies, encoding velocities of 20 and 4 cm/s were chosen for the BG and CSO, respectively. The 2D PC images were processed and analyzed, measuring the number of detected perforators, their pulsatility index (PI) and their mean velocity. Scans were evaluated for subject motion or scanning errors. Acquisitions were labeled as corrupted by subject motion if severe ghosting was present, data showed severe magnitude instability, or the subject displaced to such a degree that slice planning failed. The time of day on which subjects were scanned depended on subject and scanner availability. On average, the time of day on which participants were scanned was similar between groups.
Image Processing
A MATLAB (2015b, Mathworks) tool was developed in-house to process the 2D PC images, as described in previous publications.7,8 In short, SPM12 (version 6906, October 20, 2016) functions were used for white matter segmentation.14 The resulting region of interest (ROI) was manually corrected to include missing white matter areas (for instance because of subject motion between the anatomic acquisition and the 2D PC acquisition). For the BG acquisition, an ROI was manually drawn between the insula and the ventricles. Both the CSO and the BG ROIs were edited to exclude tissue areas where an intrasulcal vessel ghosted over the tissue (Figure 2).
Figure 2.
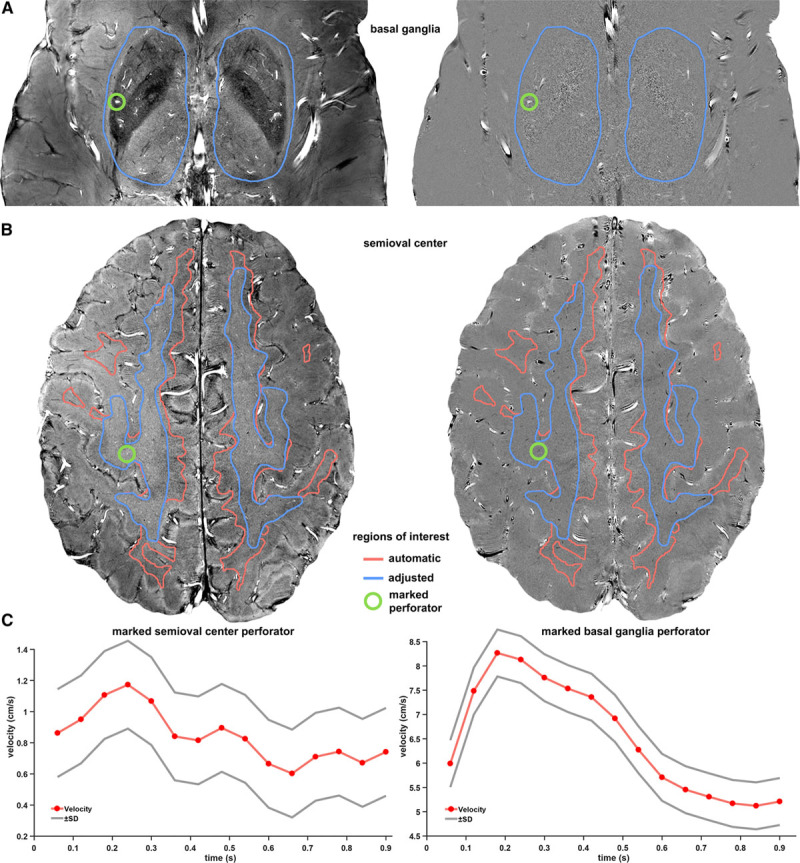
Region of interest creation and perforator examples. These images show representative 2-dimensional (2D) phase contrast slices of a patient with a lacune (left: magnitude images, right: velocity maps). The rows show the basal ganglia (A), the semioval center (B), and perforator velocity curves (C). The left images show the average magnitude and the right images show the average velocity. The green circles mark a detected perforator in each slice, for which the velocity curves are shown in C. Because the subject moved downward in the scanner during the experiment, the automatically generated region of interest (red) in the semioval center (CSO) had to be manually adjusted (blue) to only include white matter.
The velocity maps were corrected for phase offsets and a voxel-wise SD of noise in the magnitude was estimated. The estimated magnitude noise SD was used to test for significant (2 SD) blood flow velocity. In the BG images, the contrast to noise ratio in the magnitude was tested for significant (1 SD) contrast, to prevent double counts of larger, single perforators. Since perforators in this study are likely to consist of one voxel at most, the voxel with the highest absolute mean velocity within a group of adjacent significant voxels was identified as the perforator.
The results were also evaluated for their overlap with lesions. The fast fluid-attenuated inversion-recovery images were manually assessed for white matter hyperintensities with the Fazekas visual rating scale (absent=0, punctate=1, early confluent=2, confluent=3).15
Statistical Analysis
Number of Detected Perforators
All statistical analyses were performed in R (version 3.4.0, April 21, 2017).16 The image processing generated a number of detected perforators in the BG and CSO of each participant. In each detected perforator the velocity curve over cardiac time points was measured. The statistical analysis of the PI and blood flow velocity were performed separately, as explained below. The number of detected perforators was tested for differences between the control group and each of the patient groups with independent sample t tests (2-sided with equal variance).
Pulsatility Index
The velocity curves of the perforators were averaged per participant to create an average velocity curve with decreased noise. For the average velocity curves, the PI was calculated as  . The PI was tested for differences between the control group and each of the patient groups with unpaired 2 sample t tests (2 sided with equal variance).
Mean Velocity
The velocity curves of the perforators were averaged over time to get a mean velocity for each perforator. A linear mixed effects model was used to test group differences in velocity because the velocity measurements of perforators within participants are not independent from each other.17,18 The model took the mean velocity of each separate perforator as input, and allowed a random effect per subject, in addition to a fixed effect per group. The difference of the predicted mean velocity between the control group and each of the patient groups was tested for significance with the R package NLME (version 3.1–131, February 6, 2017).19 The comparisons were modeled and tested separately for each patient group.
Results
Baseline Characteristics
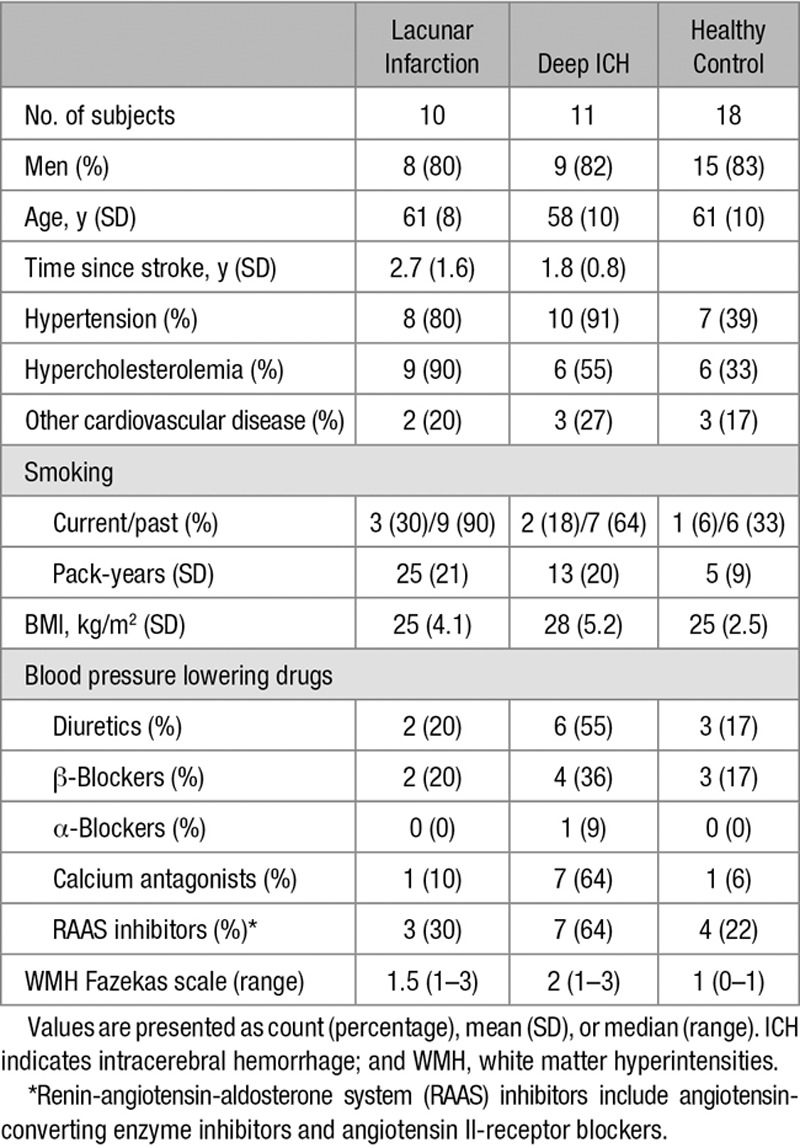
Two control participants were excluded from the study because of the presence of silent SVD on MRI. Two patients (1 with lacunar infarction and 1 with deep ICH) were excluded from the study because their scans showed motion artifacts. Thus, we included 10 of 11 patients with lacunar infarction, 11 of 12 patients with deep ICH, and 18 of 20 controls. Manual inspection showed that none of the included patients had lesions that overlapped with the ROIs to a large degree. None of the patients had overlap between lesions and the CSO ROI. Only 7 of the patients (with deep ICH) showed some decreased signal at the edge of the BG ROI caused by the blooming artifact of hemosiderin near the imaging slice. On average, patients with lacunar infarction were scanned 2.7 years after stroke onset, patients with ICH 1.6 years (Table 2). The age and sex distributions were comparable between groups of included participants. Both patient groups were more likely to have hypertension (and use blood pressure lowering drugs) or hypercholesterolemia and had smoked more than the controls.
Table 2.
Baseline Characteristics of Subjects That Were Included in the Analysis
BG Perforators
The BG acquisition had to be excluded in 3 patients with lacunar infarction, 2 with deep ICH, and 5 controls, because of acquisition errors related to the scanning protocol. Because of subject motion, 1 control BG acquisition was excluded. This led to 7 successful acquisitions in patients with lacunar infarction, 9 in patients with deep ICH, and 12 in controls. The number of detected perforators (mean±SD) in the BG was significantly lower in patients with lacunar infarction (26±9, P=0.01) and deep ICH (28±6, P=0.02) than in controls (35±7; Figure 3). The PI (mean±SD) of the BG perforators was higher in patients with lacunar infarction (1.07±0.13, P=.03), and deep ICH (1.02±0.11, P=.11), than controls (0.94±0.10), which was significant for patients with lacunar infarction only. The blood flow velocity in the BG perforators as fitted by the linear mixed effects model (mean±SEM) was not different in patients with lacunar infarction (4.2±0.2, P=0.8) or deep ICH (4.3±0.2, P=0.5) compared with controls (4.1±0.1).
Figure 3.
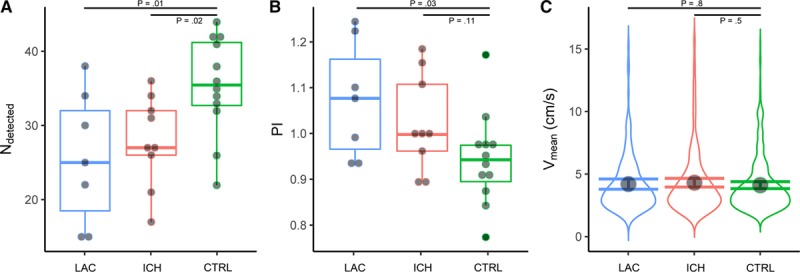
Basal Ganglia (BG) measurements. The horizontal axes show patients with lacunar infarction (LAC, in blue), with deep intracerebral hemorrhage (ICH, in red) and controls (CTRL, in green). The horizontal bars indicate the comparisons for which the P values are listed. A, Shows boxplots of the number of detected perforators. B, Shows boxplots of the pulsatility index (PI). The boxplots show interquartile ranges with markers for each participant. C, Shows the probability density distribution of blood flow velocity (Vmean) of all detected BG perforators of all participants in a group. The marker shows the blood flow velocity as fitted by the linear mixed effects model, with its 95% CI shown by error bars.
CSO Perforators
Because of subject motion, 1 CSO acquisition in a patient with lacunar infarction and 3 in patients with deep ICH were excluded. This resulted in 10 successful acquisitions in patients with lacunar infarction, 8 with deep ICH, and 17 controls. The number of detected perforators (mean±SD) in the CSO was lower in both patients with lacunar infarction (32±18, P=0.06), and with deep ICH (28±18, P=0.02), compared to controls (45±16; Figure 4), which was significant for the deep ICH patients only. The PI (mean±SD) of the CSO perforators was significantly higher in both patients with lacunar infarction (1.18±0.15, P=0.02) and with deep ICH (1.17±0.14, P=0.045) than in controls (1.08±0.07). The blood flow velocity in the CSO perforators as fitted by the linear mixed effects model (mean±SEM) was not significantly different in patients with lacunar infarction (0.75±0.06, P=0.18) or with deep ICH (0.74±0.06, P=0.18) compared with controls (0.85±0.04).
Figure 4.
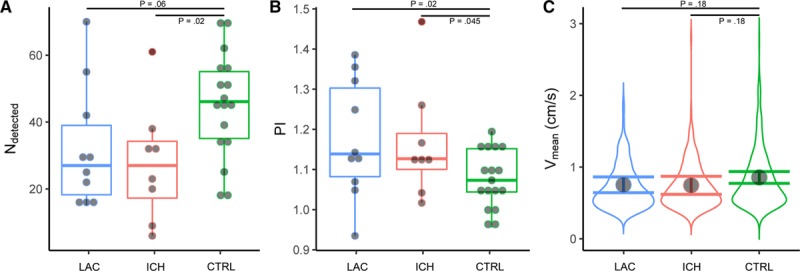
Semioval center (CSO) measurements. The horizontal axes show patients with lacunar infarction (LAC, in blue), with deep intracerebral hemorrhage (ICH, in red) and controls (CTRL, in green). The horizontal bars indicate the comparisons for which the P values are listed. A, Shows boxplots of the number of detected perforators. B, Shows boxplots of the pulsatility index (PI). The boxplots show interquartile ranges with markers for each participant. C, Shows the probability density distribution of blood flow velocity (Vmean) of all detected CSO perforators of all participants in a group. The marker shows the blood flow velocity as fitted by the linear mixed effects model, with its 95% CI shown by error bars.
Discussion
In this study, we have demonstrated abnormalities in BG and CSO perforator function in patients with stroke attributable to SVD. We detected a lower number of perforating arteries and a higher PI in both patients with lacunar infarction and deep ICH, compared with healthy controls. Although these differences were not statistically significant in every test, the size and direction of the effects were consistent. No differences in mean velocity were detected. These results indicate that it is possible to express SVD in terms of small vessel function.
We consistently detected fewer perforating arteries in patients than in controls, which was especially apparent in the CSO. This suggests that patients with lacunar infarction or deep ICH may have fewer functional perforators in the BG and CSO than healthy controls. However, other effects can also lead to the detection of fewer perforators. Fewer perforators might be detected because of a decrease in net cerebral blood flow, which other studies observed in patients with SVD.20–22 Low blood flow with accompanying lower velocity causes a low blood signal because slow flowing blood spins saturate more while flowing through the imaged slice. In turn, a lower blood signal causes a lower probability for a perforator to be detected since our detection threshold corresponds to a given signal to noise ratio. Consequently, lower net cerebral blood flow in the CSO could decrease the number of perforators detected by our method at a fixed threshold. Similarly, a smaller perforator lumen could lead to a decrease in the blood signal as well and, thus, a decrease in the number of detected perforators. Where we detected roughly 50% more perforators in the CSO in healthy controls compared with patients, the difference was much smaller in the BG (roughly 25%). This effect is probably caused by the larger flow and lumen diameter of BG perforators, which makes the detection threshold play a smaller role in the BG compared with the CSO. Still, fewer perforators were detected in the BG of patients, even with the decreased influence of the detection threshold. This may support the interpretation that patients have fewer functional perforators. Should this be the case, one could speculate that the missed vessels are less well-functioning perforators. The amount of missed vessels may indicate the severity of the reduction in vessel function as a result of SVD.
The consistently higher PI in the perforators of patients with lacunar infarction and deep ICH is in line with studies which show a higher PI in large arteries in subjects with cerebrovascular disease, including SVD.4 Middle cerebral artery PI as measured with Doppler ultrasound was previously shown to be associated with severe white matter lesions, and a recent study showed that it was associated with more progression of white matter lesions in patients with lacunar infarct.23,24 Similarly, other studies show that middle cerebral artery PI is associated with cognitive impairment and infarct volume.25,26 For a role of pulsatility in small vessel (dys-)function, it would be a prerequisite that these abnormal pulsatilities persist into the smaller arteries. This explorative study shows that a different pulsatility can indeed be measured in these arteries. This is relevant because pulsatility is thought to play a role in normal vascular physiology.27 In addition to that, endothelial dysfunction has been shown to be modulated by biomechanical forces exerted by blood flow and is suggested to be involved in the pathogenesis of SVD.2,4,28 Therefore, being able to measure hemodynamic differences in the microcirculation with the current technique can potentially help to understand the pathological processes behind SVD.
Of note, we did not measure significant differences in mean blood flow velocity in neither the BG nor the CSO perforators. This means that the velocity distribution of the detected vessels is similar, which implies that the measured PIs represent similar vessels for patients and controls. Moreover, since the detection threshold plays a relatively small role in the BG, the similar PI difference between patients and controls at the CSO compared with the BG, suggest that the method detects a representative set of perforators in the CSO, despite the fact that it only can assess the proverbial tip of the iceberg.
The PI values and mean velocities we measured in this study overall are higher than in our previous studies in healthy younger subjects.7,8 This may be explained by the fact that we acquired velocity measurements with a higher temporal resolution, which causes a better discrimination of peak velocities. We also automatically detected perforating arteries and changed the detection threshold to be equal for every participant. This will probably have led to fewer (mostly larger) perforators to be detected, which have larger flow velocities. In addition, we decreased the influence of blood signal saturation with tilted optimized nonsaturating excitation pulses, which decreases velocity underestimation. The PI in the perforators of the BG of our healthy older volunteers (61 years old, PI of 1.08) was also higher than that in the lenticulostriate arteries of healthy older volunteers in a recent study by others (74.8 years old, PI of 0.69).29 However, a direct comparison is precluded since in the current study we assessed different arteries (both lenticulostriate- and smaller perforating arteries), and use a different acquisition which is optimized for these smaller arteries (higher in-plane resolution, lower Venc, and other differences).
The current study has some limitations. First, the acquisition is relatively sensitive to subject motion. Subject motion causes blurring and other artifacts, which might lead to a lower measured velocity and a lower number of detected perforators. The sensitivity to motion is caused mostly by the high in-plane resolution and long scan time (relative to the small imaged perforators). Nevertheless, we were still able to successfully perform the acquisitions in most subjects. It is our hope that prospective motion correction techniques currently in development (since all high-resolution applications encounter similar issues) will soon be available in MR products. Second, the used method inherently has a detection threshold. Perforators with a blood flow velocity below the detection threshold are censored, which skews the measured velocity distribution and makes the true mean velocity unknown. This might partly explain why we did not detect velocity differences between groups, while brain perfusion and large vessel flow are thought to be decreased in patients with SVD.30,31 However, this still allows group comparisons of perforators with velocities that do reach the detection threshold. By happenstance, this also adds further meaning to detected pulsatility differences, since now the PI is only compared between perforators with similar flow velocities. The selection threshold could indirectly show changes in hemodynamics, for example, when an increase (or decrease) in blood flow causes a higher (or lower) number of vessels to be detected. However, one should critically consider the thresholding effects in cases where the threshold is influenced by other factors than changes in blood flow, for example, when comparing vessels within lesions (with abnormal tissue intensity) to vessels in other tissue areas. Third, the increased tortuosity of perforators in patients with SVD might cause perforators to run through the slice obliquely (especially in the BG). In these perforators, the flow displacement artifact might cause a voxel that is identified as a perforator to be off-center during systole (as the blood signal displaces), causing a lower measured maximum velocity and PI. Still, we did detect a higher PI in BG perforators of patients with lacunar infarction. Fourth, in light of its exploratory nature, the study had a small sample size. This precludes a detailed analysis of factors that might determine small vessel function in our study population, such as hypertension, hypercholesterolemia, and diabetes mellitus. Last, the small study size and custom made MRI acquisition and processing, as well as the visibility of SVD lesions on MRI, meant that the researchers were unblinded to which group a participant belonged to. This potentially creates a bias where the study was not automated, such as in determining scan quality, assessing white matter hyperintensities severity, and manually adjusting the included ROIs to remove artifacts from ghosting large vessels.
Conclusions
This explorative study shows, for the first time, that SVD in patients with lacunar infarction or deep ICH may be expressed in terms of functional measures, such as PI, that are derived directly from the small vessels themselves. Increased pulsatility was observed in 2 separate levels of perforators and 2 separate patient groups. Future studies may use this technique to further unravel the mechanisms underlying SVD.
Sources of Funding
Dr Zwanenburg is supported by the European Research Council under the European Union’s Seventh Framework Programme (FP7/2007–2013), grant agreement no. 337333. Dr Biessels is supported by the European Union’s Horizon 2020 research and innovation programme under grant agreement no. 666881 and Vici Grant 918.16.616 from the Netherlands Organization for Scientific Research (NWO). Dr Klijn is supported by a clinical established investigator grant of the Dutch Heart Foundation (2012T077) and an Aspasia grant from ZonMw (015008048).
Disclosures
None.
Supplementary Material
Footnotes
The online-only Data Supplement is available with this article at https://www.ahajournals.org/doi/suppl/10.1161/STROKEAHA.118.022516.
References
- 1.Pantoni L. Cerebral small vessel disease: from pathogenesis and clinical characteristics to therapeutic challenges. Lancet Neurol. 2010;9:689–701. doi: 10.1016/S1474-4422(10)70104-6. doi: 10.1016/S1474-4422(10)70104-6. [DOI] [PubMed] [Google Scholar]
- 2.Wardlaw JM, Smith C, Dichgans M. Mechanisms of sporadic cerebral small vessel disease: insights from neuroimaging. Lancet Neurol. 2013;12:483–497. doi: 10.1016/S1474-4422(13)70060-7. doi: 10.1016/S1474-4422(13)70060-7. [DOI] [PMC free article] [PubMed] [Google Scholar]
- 3.Zwanenburg JJM, van Osch MJP. Targeting cerebral small vessel disease with MRI. Stroke. 2017;48:3175–3182. doi: 10.1161/STROKEAHA.117.016996. doi: 10.1161/STROKEAHA.117.016996. [DOI] [PubMed] [Google Scholar]
- 4.Shi Y, Thrippleton MJ, Marshall I, Wardlaw JM. Intracranial pulsatility in patients with cerebral small vessel disease: a systematic review. Clin Sci (Lond) 2018;132:157–171. doi: 10.1042/CS20171280. doi: 10.1042/CS20171280. [DOI] [PubMed] [Google Scholar]
- 5.Webb AJ, Simoni M, Mazzucco S, Kuker W, Schulz U, Rothwell PM. Increased cerebral arterial pulsatility in patients with leukoaraiosis: arterial stiffness enhances transmission of aortic pulsatility. Stroke. 2012;43:2631–2636. doi: 10.1161/STROKEAHA.112.655837. doi: 10.1161/STROKEAHA.112.655837. [DOI] [PubMed] [Google Scholar]
- 6.Klijn CJ, Kappelle LJ, van Huffelen AC, Visser GH, Algra A, Tulleken CA, et al. Recurrent ischemia in symptomatic carotid occlusion: prognostic value of hemodynamic factors. Neurology. 2000;55:1806–1812. doi: 10.1212/wnl.55.12.1806. [DOI] [PubMed] [Google Scholar]
- 7.Bouvy WH, Geurts LJ, Kuijf HJ, Luijten PR, Kappelle LJ, Biessels GJ, et al. Assessment of blood flow velocity and pulsatility in cerebral perforating arteries with 7-T quantitative flow MRI. NMR Biomed. 2016;29:1295–1304. doi: 10.1002/nbm.3306. doi: 10.1002/nbm.3306. [DOI] [PMC free article] [PubMed] [Google Scholar]
- 8.Geurts L, Biessels GJ, Luijten P, Zwanenburg J. Better and faster velocity pulsatility assessment in cerebral white matter perforating arteries with 7T quantitative flow MRI through improved slice profile, acquisition scheme, and postprocessing. Magn Reson Med. 2018;79:1473–1482. doi: 10.1002/mrm.26821. doi: 10.1002/mrm.26821. [DOI] [PMC free article] [PubMed] [Google Scholar]
- 9.Nonaka H, Akima M, Hatori T, Nagayama T, Zhang Z, Ihara F. The microvasculature of the cerebral white matter: arteries of the deep white matter. J.Neuropathol.Exp. Neurol. 2003;62:154–161. doi: 10.1093/jnen/62.2.154. [DOI] [PubMed] [Google Scholar]
- 10.Fisher CM. The arterial lesions underlying lacunes. Acta Neuropathol. 1968;12:1–15. doi: 10.1007/BF00685305. [DOI] [PubMed] [Google Scholar]
- 11.Wardlaw JM, Smith EE, Biessels GJ, Cordonnier C, Fazekas F, Frayne R, et al. STandards for ReportIng Vascular changes on nEuroimaging (STRIVE v1) Neuroimaging standards for research into small vessel disease and its contribution to ageing and neurodegeneration. Lancet Neurol. 2013;12:822–838. doi: 10.1016/S1474-4422(13)70124-8. doi: 10.1016/S1474-4422(13)70124-8. [DOI] [PMC free article] [PubMed] [Google Scholar]
- 12.Visser F, Zwanenburg JJ, Hoogduin JM, Luijten PR. High-resolution magnetization-prepared 3D-FLAIR imaging at 7.0 Tesla. Magn Reson Med. 2010;64:194–202. doi: 10.1002/mrm.22397. doi: 10.1002/mrm.22397. [DOI] [PubMed] [Google Scholar]
- 13.Bouvy WH, Biessels GJ, Kuijf HJ, Kappelle LJ, Luijten PR, Zwanenburg JJ. Visualization of perivascular spaces and perforating arteries with 7 T magnetic resonance imaging. Invest Radiol. 2014;49:307–313. doi: 10.1097/RLI.0000000000000027. doi: 10.1097/RLI.0000000000000027. [DOI] [PubMed] [Google Scholar]
- 14.Ashburner J, Friston KJ. Unified segmentation. Neuroimage. 2005;26:839–851. doi: 10.1016/j.neuroimage.2005.02.018. doi: 10.1016/j.neuroimage.2005.02.018. [DOI] [PubMed] [Google Scholar]
- 15.Fazekas F, Chawluk JB, Alavi A, Hurtig HI, Zimmerman RA. MR signal abnormalities at 1.5 T in Alzheimer’s dementia and normal aging. AJR Am J Roentgenol. 1987;149:351–356. doi: 10.2214/ajr.149.2.351. doi: 10.2214/ajr.149.2.351. [DOI] [PubMed] [Google Scholar]
- 16.R Core Team. R: A Language and Environment for Statistical Computing [Internet]. 2017. https://www.r-project.org/. Accessed April 26, 2017.
- 17.Lindstrom MJ, Bates DM. Newton-Raphson and EM algorithms for linear mixed-effects models for repeated measures data. J.Am.Stat.Assoc. 1988;83:1014–1022. [Google Scholar]
- 18.Ware NM., L, J H. Random-effects models for longitudinal data. Int. Biometric Soc. 1982;38:963–974. [PubMed] [Google Scholar]
- 19.Pinheiro J, Bates D, DebRoy S, Sarkar D R Core Team. {nlme}: Linear and Nonlinear Mixed Effects Models [Internet]. 2017. https://cran.r-project.org/package=nlme. Accessed April 26, 2017.
- 20.Beishon L, Haunton VJ, Panerai RB, Robinson TG. Cerebral hemodynamics in mild cognitive impairment: a systematic review. J Alzheimers Dis. 2017;59:369–385. doi: 10.3233/JAD-170181. doi: 10.3233/JAD-170181. [DOI] [PubMed] [Google Scholar]
- 21.Rivera-Rivera LA, Turski P, Johnson KM, Hoffman C, Berman SE, Kilgas P, et al. 4D flow MRI for intracranial hemodynamics assessment in Alzheimer’s disease. J Cereb Blood Flow Metab. 2016;36:1718–1730. doi: 10.1177/0271678X15617171. doi: 10.1177/0271678X15617171. [DOI] [PMC free article] [PubMed] [Google Scholar]
- 22.Uh J, Yezhuvath U, Cheng Y, Lu H. In vivo vascular hallmarks of diffuse leukoaraiosis. J Magn Reson Imaging. 2010;32:184–190. doi: 10.1002/jmri.22209. doi: 10.1002/jmri.22209. [DOI] [PMC free article] [PubMed] [Google Scholar]
- 23.Lee WJ, Jung KH, Ryu YJ, Lee KJ, Kim JM, Lee ST, et al. Progression of cerebral white matter hyperintensities and the associated sonographic index. Radiology. 2017;284:824–833. doi: 10.1148/radiol.2017162064. doi: 10.1148/radiol.2017162064. [DOI] [PubMed] [Google Scholar]
- 24.Mok V, Ding D, Fu J, Xiong Y, Chu WW, Wang D, et al. Transcranial Doppler ultrasound for screening cerebral small vessel disease: a community study. Stroke. 2012;43:2791–2793. doi: 10.1161/STROKEAHA.112.665711. doi: 10.1161/STROKEAHA.112.665711. [DOI] [PubMed] [Google Scholar]
- 25.Altmann M, Thommessen B, Rønning OM, Benth JŠ, Reichenbach AS, Fure B. Middle cerebral artery pulsatility index is associated with cognitive impairment in lacunar stroke. J Neuroimaging. 2016;26:431–435. doi: 10.1111/jon.12335. doi: 10.1111/jon.12335. [DOI] [PubMed] [Google Scholar]
- 26.Kim Y, Lee H, An SA, Yim B, Kim J, Kim OJ, et al. The effect of pulsatility index on infarct volume in acute lacunar stroke. Yonsei Med J. 2016;57:950–955. doi: 10.3349/ymj.2016.57.4.950. doi: 10.3349/ymj.2016.57.4.950. [DOI] [PMC free article] [PubMed] [Google Scholar]
- 27.Wagshul ME, Eide PK, Madsen JR. The pulsating brain: a review of experimental and clinical studies of intracranial pulsatility. Fluids Barriers CNS. 2011;8:5. doi: 10.1186/2045-8118-8-5. doi: 10.1186/2045-8118-8-5. [DOI] [PMC free article] [PubMed] [Google Scholar]
- 28.Knottnerus IL, Ten Cate H, Lodder J, Kessels F, van Oostenbrugge RJ. Endothelial dysfunction in lacunar stroke: a systematic review. Cerebrovasc Dis. 2009;27:519–526. doi: 10.1159/000212672. doi: 10.1159/000212672. [DOI] [PubMed] [Google Scholar]
- 29.Schnerr RS, Jansen JFA, Uludag K, Hofman PAM, Wildberger JE, van Oostenbrugge RJ, et al. Pulsatility of lenticulostriate arteries assessed by 7 tesla flow MRI-measurement, reproducibility, and applicability to aging effect. Front Physiol. 2017;8:961. doi: 10.3389/fphys.2017.00961. doi: 10.3389/fphys.2017.00961. [DOI] [PMC free article] [PubMed] [Google Scholar]
- 30.Smith EE, Beaudin AE. New insights into cerebral small vessel disease and vascular cognitive impairment from MRI. Curr Opin Neurol. 2018;31:36–43. doi: 10.1097/WCO.0000000000000513. doi: 10.1097/WCO.0000000000000513. [DOI] [PubMed] [Google Scholar]
- 31.Stevenson SF, Doubal FN, Shuler K, Wardlaw JM. A systematic review of dynamic cerebral and peripheral endothelial function in lacunar stroke versus controls. Stroke. 2010;41:e434–e442. doi: 10.1161/STROKEAHA.109.569855. doi: 10.1161/STROKEAHA.109.569855. [DOI] [PubMed] [Google Scholar]


