

Abstract
An intricate link is becoming apparent between metabolism and cellular identities. Here, we explore the basis for such a link in an in vitro model for early mouse embryonic development: from naïve pluripotency to the specification of primordial germ cells (PGCs). Using single‐cell RNA‐seq with statistical modelling and modulation of energy metabolism, we demonstrate a functional role for oxidative mitochondrial metabolism in naïve pluripotency. We link mitochondrial tricarboxylic acid cycle activity to IDH2‐mediated production of alpha‐ketoglutarate and through it, the activity of key epigenetic regulators. Accordingly, this metabolite has a role in the maintenance of naïve pluripotency as well as in PGC differentiation, likely through preserving a particular histone methylation status underlying the transient state of developmental competence for the PGC fate. We reveal a link between energy metabolism and epigenetic control of cell state transitions during a developmental trajectory towards germ cell specification, and establish a paradigm for stabilizing fleeting cellular states through metabolic modulation.
Keywords: cell state transitions, germ cells, metabolism, pseudotime analysis, single‐cell analysis
Subject Categories: Development & Differentiation, Metabolism, Stem Cells
Introduction
Embryonic stem cells (ESCs) have the capacity for indefinite self‐renewal in vitro, while retaining the ability to differentiate into specialized cell types (Ng & Surani, 2011; Young, 2011). The in vitro differentiation of mouse ESCs (mESCs) from a naïve pluripotent state into primed epiblast‐like cells (EpiLCs) confers transient developmental competence for the primordial germ cell (PGC) fate (Hayashi et al, 2011) and provides a tractable model system for investigations on early embryonic cell state conversions (Fig 1A). These cell states and their transitions are associated with functional heterogeneity, which needs consideration (Cahan & Daley, 2013). While PGCs, the precursors of oocytes and sperm, and naïve ESCs share expression of some key pluripotency transcription factors, together with DNA and histone methylation status, these are distinct cell states (Saitou et al, 2003; Seki et al, 2005; Surani et al, 2007; Hackett & Surani, 2013; Kurimoto et al, 2015).
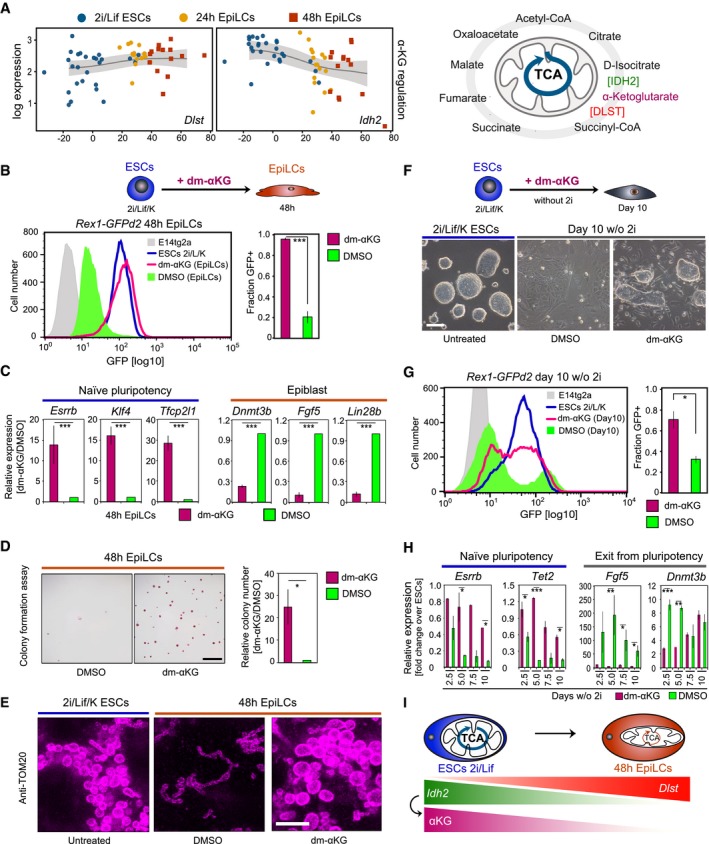
Figure 1. Embryonic cell state transitions underlie dynamic changes in energy metabolism.
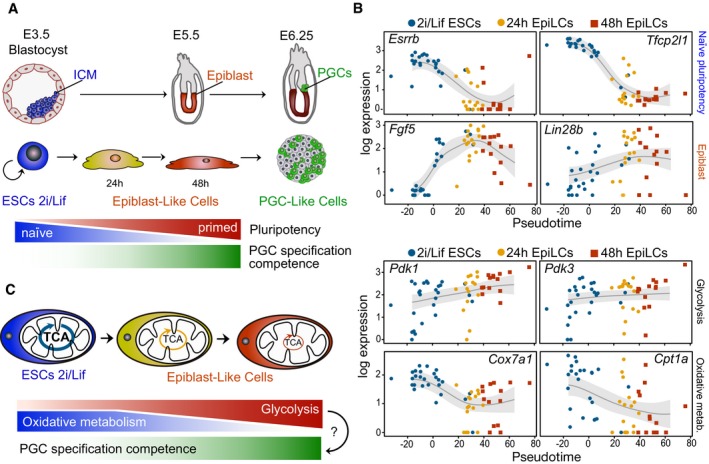
- Model depicting the conversion of mouse embryonic stem cells (ESCs) from a naïve pluripotent state in 2i/Lif culture conditions to primed epiblast‐like cells (EpiLCs), which acquire transient competence for induction into primordial germ cell (PGC)‐like cell fate. Corresponding developmental stages are shown in the mouse embryo.
- Single‐cell expression data in pseudotime of central regulators of naïve pluripotency, epiblast marker genes, glycolytic regulators and genes with key functions in oxidative metabolism.
- Schematic illustrating the dynamic changes in energy metabolism during the acquisition of developmental competence for the PGC fate. TCA, tricarboxylic acid cycle.
Nutritional state, metabolism and the accompanying epigenetic changes have an impact on cellular identity. For example, threonine metabolism is linked to the synthesis of the methyl donor S‐adenosylmethionine (SAM), which impacts on the histone methylation status, and, in turn, mESC pluripotency (Shyh‐Chang et al, 2013). Likewise, the metabolite alpha‐ketoglutarate (αKG) has a role in mESC self‐renewal through enhancing the efficiency of αKG‐dependent dioxygenases with key functions in the regulation of epigenetic state (Carey et al, 2015), but also in the differentiation of human ESCs (hESCs; TeSlaa et al, 2016). Similarly, aerobic glycolysis has been linked to chromatin structure and the maintenance of hESC pluripotency, with glycolysis‐derived cytosolic acetyl‐CoA serving as an essential substrate for histone acetylation (Moussaieff et al, 2015). While primed hESCs depend primarily on aerobic glycolysis, as is the case for the mouse epiblast stem cells (EpiSCs), naïve hESCs and mESCs utilize both glycolysis and oxidative phosphorylation pathways on demand (Zhou et al, 2012; Sperber et al, 2015). Consistently with their predominantly glycolytic metabolism, stimulating aerobic glycolysis via stabilization of hypoxia‐inducible factor 1 alpha (HIF‐1α) is sufficient to drive mESCs into epiblast‐like cell fates (Zhou et al, 2012). Accordingly, activation of oxidative metabolism facilitates the re‐acquisition of naïve pluripotency from highly glycolytic EpiSCs (Sone et al, 2017), suggesting that changes in cellular metabolism influence cell state transitions. The precise molecular regulation underlying the impact of energy metabolism on mESC pluripotency and during early embryonic development, however, remains poorly defined.
Here, we identify metabolic regulatory pathways that are dynamically modulated during the conversion from naïve to primed pluripotency in mouse, and establish the influence of oxidative metabolism on mESC pluripotency and developmental competence for the PGC fate. We link oxidative mitochondrial metabolism and tricarboxylic acid cycle to the production of αKG and, in turn, the activity of key epigenetic regulators. On the basis of our findings, we propose a metabolic regulatory mechanism via αKG, which mediates early embryonic cell state transitions and germ cell development through promoting permissive epigenetic states.
Results
Single‐cell analysis reveals metabolic regulatory dynamics and competence for the PGC fate
First, we used the in vitro differentiation of naïve mouse embryonic stem cells (ESCs) from pluripotent ground state (2i/Lif culture conditions; Ying et al, 2008) into primed epiblast‐like cell (EpiLC) fates (Hayashi et al, 2011; Fig 1A), and performed single‐cell RNA‐sequencing (RNA‐seq) at t = 0, t = 24 and t = 48 h (Fig EV1A and B). Gaussian process latent variable models (GPLVMs), a non‐linear dimensionality reduction approach (Lawrence, 2004; Buettner & Theis, 2012), grouped individual cells into distinct transcriptional states, which were highly correlated with sampling time (Fig EV1C). We harnessed the cellular heterogeneity arising during EpiLC differentiation to derive dynamic gene expression trajectories by statistically ordering single‐cell transcriptomes over a developmental time (“pseudotime”; Trapnell et al, 2014; Reid & Wernisch, 2016; Figs 1B and EV1D), and comprehensively quantified expression level changes (Appendix Table S1). Key regulators of naïve pluripotency, such as Esrrb and Tfcp2l1, displayed pronounced downward pseudotime profiles, while genes associated with epiblast development, such as Fgf5 and Lin28b, showed increasing expression over time; this recapitulates the known expression dynamics (Hayashi et al, 2011). Central regulators of energy metabolism exhibited similarly dynamic trajectories. Accordingly, pyruvate‐dependent kinases 1 and 3 (Pdk1 and Pdk3) and Slc2a1 and Stk11 (Fig EV1D) were upregulated over time, conceivably contributing to enhanced glycolysis by suppressing entry of pyruvate into the mitochondrial tricarboxylic acid (TCA) cycle and by facilitating glucose uptake, respectively. Conversely, genes with central roles in oxidative metabolism, such as Cox7a1 and Cpt1a, exhibited a prominent decline. These dynamic expression changes suggest a switch to an increased glycolytic state with a concomitant decrease in oxidative metabolism (Fig 1C), as cells acquire competence for the PGC fate (Zhou et al, 2012; Zhang et al, 2016).
Figure EV1. Single‐cell RNA‐seq during the ESC‐to‐EpiLC transition (related to Fig 1).
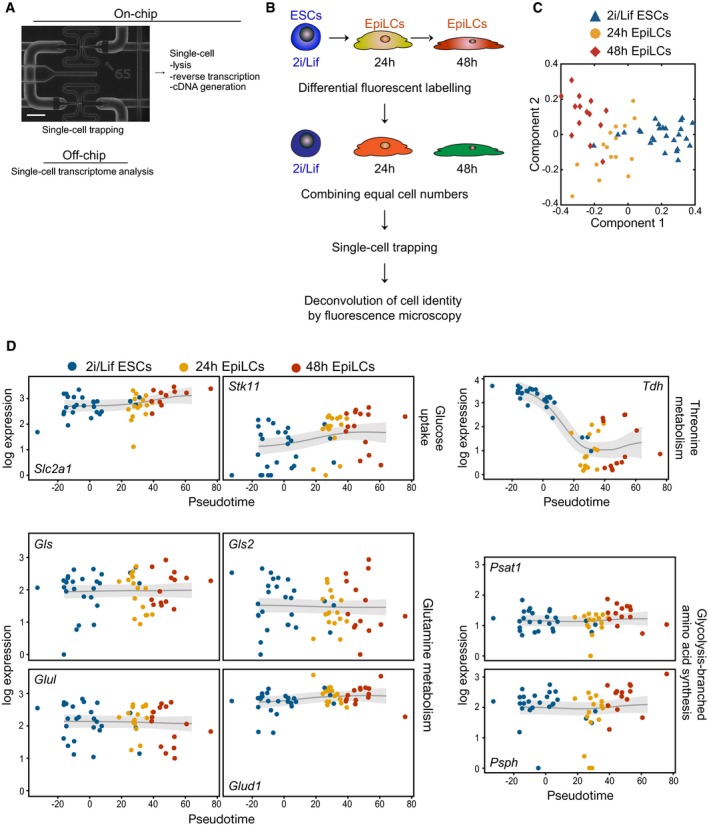
- Overview of the process flow of single‐cell transcriptome analysis using the C1 Single‐Cell AutoPrep System (Fluidigm). A magnified image of a microfluidic chip with single cells trapped within individual capture sites is shown. Scale bar, 20 μm.
- Scheme for the concurrent processing of single cells harvested at time points t = 0 h (ESCs 2i/Lif/KSR), t = 24 and t = 48 h following staggered EpiLC induction.
- GPLVM plot of single‐cell transcriptome data from ESCs in 2i/Lif/KSR, 24 and 48 h EpiLCs.
- Pseudotime expression trajectories for regulators with key functions in glucose uptake, threonine and glutamine metabolism, and glycolysis‐branched amino acid synthesis.
Oxidative mitochondrial metabolism maintains an embryonic stem cell‐like state
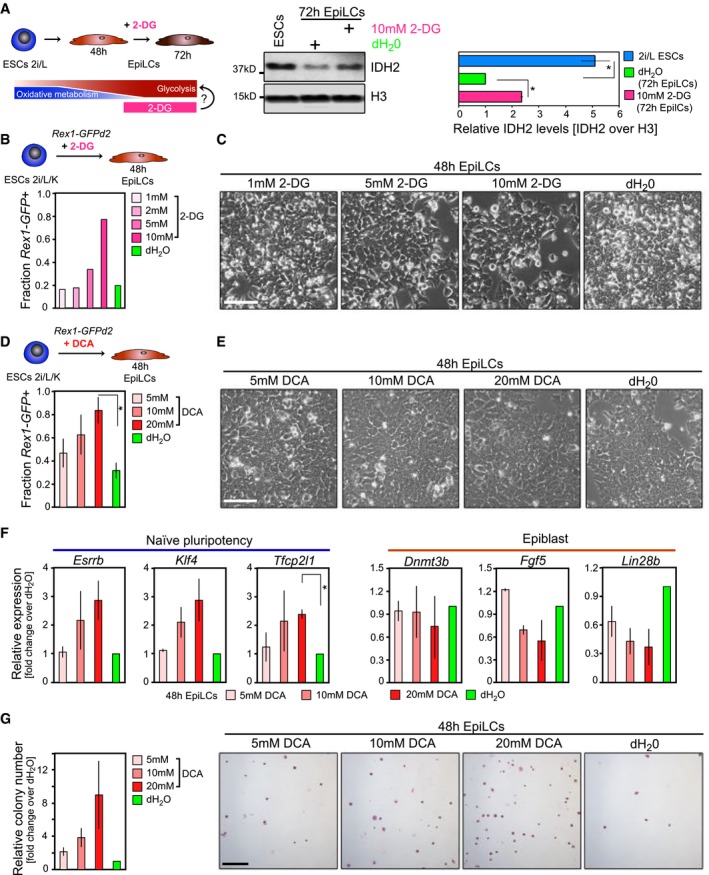
Next, we investigated potential implications of sustained oxidative mitochondrial metabolism through repression of glycolysis for naïve pluripotency (Fig 2A). Using a knock‐in reporter ESC line expressing a destabilized green fluorescent protein from the endogenous Zfp42/Rex1 locus (Rex1‐GFPd2; Wray et al, 2011; Kalkan et al, 2017), we found that inhibition of glycolysis through supplementation of the glucose analogue 2‐deoxy‐D‐glucose (2‐DG; Wick et al, 1957; Zhou et al, 2012) prevented the exit from naïve pluripotency, indicated by the sustained expression of Rex1‐GFPd2, in a dose‐dependent manner (Figs 2B and EV2A–C). Expression levels of marker genes for naïve pluripotency, including Esrrb, Klf4 and Tfcp2l1, that were strongly downregulated in controls by t = 48 h during the ESC‐to‐EpiLC transition remained elevated following 2‐DG treatment (Fig 2C). Conversely, epiblast markers, such as the de novo methyltransferase Dnmt3b, Fgf5 and Lin28b, were repressed (Fig 2C). Further, glycolytic suppression also had an impact on colony‐forming ability, a hallmark of naïve pluripotency. While ESCs have the potential to self‐renew and can generate colonies from single cells in naïve pluripotency‐promoting conditions, this ability is lost in 48 h EpiLCs (Murakami et al, 2016). The addition of 2‐DG during the ESC‐to‐EpiLC differentiation, however, resulted in the subsequent robust self‐renewal and colony formation (Fig 2D), supporting the maintenance of a naïve pluripotent state. Comparable results were obtained following treatment with the PDK inhibitor dichloroacetate (DCA), which enhances the conversion of pyruvate to acetyl‐CoA in the mitochondria (Stacpoole, 1989; Whitehouse et al, 1974; Fig EV2D–G).
Figure 2. Oxidative metabolism promotes naïve pluripotency.
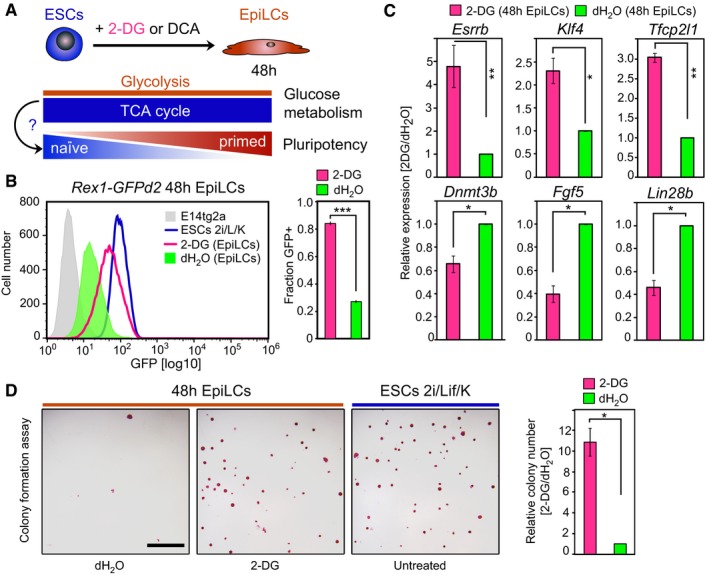
- Investigating the effect of sustained oxidative mitochondrial metabolism on the transition from naïve ESCs to primed EpiLCs through supplementation of the glycolysis inhibitors 2‐deoxy‐D‐glucose (2‐DG) and dichloroacetate (DCA), respectively.
- Flow cytometry analysis of Rex1‐GFPd2 cells following addition of 10 mM 2‐DG during the 48 h EpiLC induction. Representative GFP intensity distributions are depicted. Average proportions of Rex1‐GFPd2‐positive (GFP+) cells are quantified from two independent biological replicates. Error bars represent ± SE. ***P = 0.0006 (unpaired 1‐tailed Student's t‐test).
- Expression analysis by qRT–PCR of naïve pluripotency and epiblast marker genes in bulk 48 h cells after 10 mM 2‐DG treatment. Relative expression levels, normalized to control culture conditions, are shown. Graphs represent averages from triplicate (duplicate for Klf4 and Tfcp2l1) independent biological experiments. Error bars denote ± SE. *P ≤ 0.05; **P ≤ 0.01 (unpaired 1‐tailed Student's t‐test, see Appendix Table S3 for exact P‐values).
- Colony‐forming ability following 10 mM 2‐DG supplementation during EpiLC stimulation. Representative images of alkaline phosphatase (AP)‐stained colonies are displayed. Scale bar, 250 μm. The average colony formation, normalized to control culture conditions, quantified from two independent biological replicates, is shown. Error bars signify ± SE. *P = 0.0424 (unpaired 1‐tailed Student's t‐test).
Figure EV2. Glycolytic inhibition sustains a naïve pluripotent state (related to Fig 2).
-
A–GExamining the effect of glycolytic inhibition on pluripotent state through supplementation of 2‐deoxy‐D‐glucose (2‐DG; A–C) and pyruvate dehydrogenase kinase (PDK) inhibitor dichloroacetate (DCA; D–G), respectively, during the ESC‐to‐EpiLC transition. (A) Western blot showing protein levels for the αKG‐generating enzyme IDH2 as a marker for TCA cycle activity after addition of 2‐DG and dH2O, respectively, from t = 48 to t = 72 h during EpiLC differentiation. H3 is used as a loading control. Quantifications are based on two independent experiments. Error bars signify ± SE. *P ≤ 0.05 (unpaired 1‐tailed Student's t‐test, see Appendix Table S3 for precise P‐values). (B, D) Flow cytometry‐based quantification of Rex1‐GFPd2 cells following 2‐DG and DCA supplementation, respectively. (D) Proportions of Rex1‐GFPd2‐positive (GFP+) cells represent averages from duplicate experiments, with error bars denoting ± SE. *P = 0.0403 (unpaired 1‐tailed Student's t‐test). (C, E) Characteristic bright‐field images after addition of 2‐DG and DCA, respectively, during the 48 h EpiLC induction. Scale bar, 10 μm. (F) Expression analysis by qRT–PCR of naïve pluripotency regulators and epiblast marker genes in bulk 48 h cells following culture in EpiLC‐inducing conditions in the presence of increasing doses of DCA. Graphs show average fold changes in expression over control culture conditions from duplicate experiments. Error bars indicate ± SE. *P = 0.0246 (unpaired 1‐tailed Student's t‐test). (G) Colony‐forming ability subsequent to 48 h DCA treatment. Representative images of AP‐stained colonies are displayed. Scale bar, 250 μm. Colony formation following DCA supplementation is normalized to control‐treated cells. Graphs represent averages from duplicate experiments. Error bars signify ± SE.
Collectively, activation of mitochondrial oxidative metabolism through inhibition of glycolysis sustains an ESC‐like state, suggesting that the oxidative‐to‐glycolytic switch might functionally promote the conversion from naïve to primed pluripotency and consequently the acquisition of developmental competence for the PGC fate.
The TCA cycle metabolite αKG mediates the naïve pluripotency‐promoting effect of oxidative mitochondrial metabolism
Pseudotime expression profiles and quantitative analysis of enzymes central to the mitochondrial TCA cycle revealed pronounced downregulation of the αKG‐producing enzyme Idh2 but slight upregulation of the αKG‐to‐succinate‐converting enzyme Dlst (Fig 3A, Appendix Table S1), suggesting that αKG levels are diminished during the transition from naïve to primed pluripotency. Correspondingly, IDH2 protein levels were distinctly lower in 48 and 72 h EpiLCs, as compared to naïve ESCs (Fig EV3A).
Figure 3. αKG maintains naïve pluripotency.
-
APseudotime expression profiles for the αKG‐regulating enzymes Idh2 and Dlst during the transition from naïve to primed pluripotency. TCA cycle enzymes and metabolites produced within the TCA cycle are illustrated.
-
BRepresentative flow cytometry profiles of Rex1‐GFPd2 cells following 4 mM dm‐αKG supplementation during the EpiLC induction are depicted. Graphs show average fractions of Rex1‐GFPd2‐positive (GFP+) cells from six independent biological assays. Error bars indicate ± SE. ***P = 1.241E‐05 (unpaired 1‐tailed Student's t‐test).
-
CqRT–PCR analysis of naïve pluripotency regulators and epiblast marker genes following EpiLC stimulation in the presence of 4 mM dm‐αKG. Expression data are normalized to control culture conditions and represent averages from five biological replicates in bulk 48 h cells. Error bars denote ± SE. ***P ≤ 0.005 (unpaired 1‐tailed Student's t‐test, see Appendix Table S3 for exact P‐values).
-
DColony‐forming ability succeeding 4 mM dm‐αKG treatment during the 48 h EpiLC induction. Characteristic images of AP‐stained colonies are shown. Scale bar, 250 μm. Colony formation is normalized to control‐treated cells and quantified from quadruplicate experiments. Error bars signify ± SE. *P = 0.0283 (unpaired 1‐tailed Student's t‐test).
-
ERepresentative super‐resolution images of TOM‐20 immune‐labelled mitochondria in ESCs following 48 h culture in 2i/Lif/KSR media, and EpiLC‐inducing conditions in the presence of 4 mM dm‐αKG and DMSO, respectively, are displayed. Scale bar, 3 μm.
-
F–HTen‐day culture of Rex1‐GFPd2 cells in N2B27/Lif/KSR with 4 mM dm‐αKG and DMSO, respectively, with passaging every 2.5 days. (F) Characteristic bright‐field images of Rex1‐GFPd2 cells after 10 days of culture in 2i/Lif/KSR and N2B27/Lif/KSR, in the presence of dm‐αKG and DMSO, respectively. Scale bar, 10 μm. (G) Flow cytometer‐based quantification of Rex1‐GFPd2‐positive (GFP+) cells. Representative GFP intensity distributions are displayed. The average fractions of GFP+ cells are measured from duplicate experiments. Error bars denote ± SE. *P = 0.0477 (unpaired 1‐tailed Student's t‐test). (H) qRT–PCR analysis of naïve pluripotency and differentiation markers in bulk cells harvested at 2.5‐day intervals during the 10‐day culture in N2B27/Lif/KSR with dm‐αKG or DMSO. Expression data are normalized to time‐matched ESCs in 2i/Lif/KSR culture conditions and are averaged over two independent biological experiments. Error bars indicate ± SE. *P ≤ 0.05; **P ≤ 0.01; ***P ≤ 0.005 (unpaired 1‐tailed Student's t‐test, see Appendix Table S3 for precise P‐values).
-
IModel illustrating the IDH2‐mediated production of αKG in the mitochondrial TCA cycle during oxidative metabolism in ESCs in naïve pluripotency conditions.
Figure EV3. The effect of αKG on naïve pluripotency is concentration‐dependent and fully reversible (related to Fig 3).
-
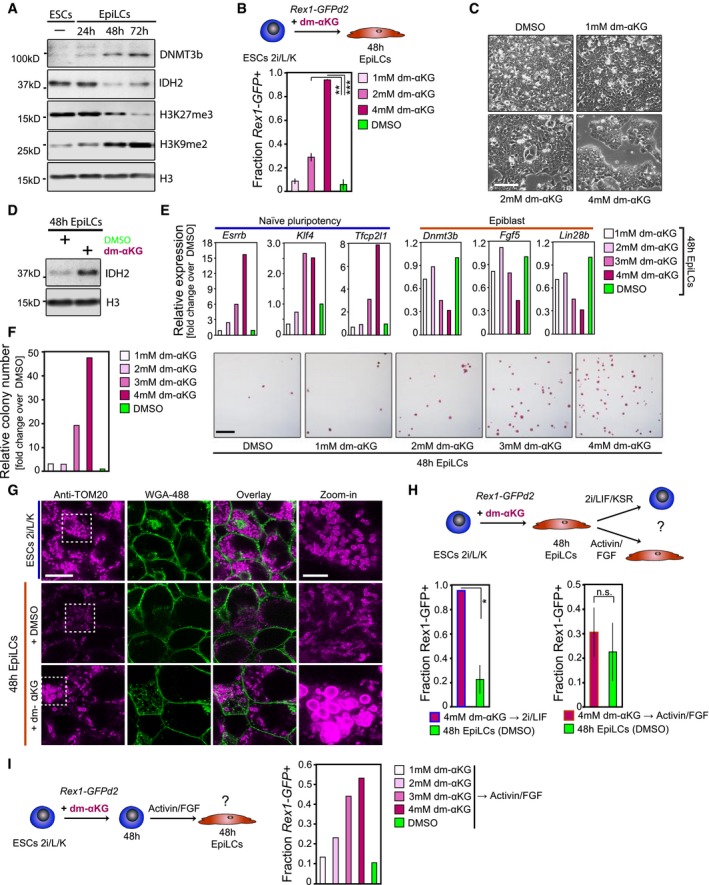
ARepresentative Western blot showing DNMT3b, IDH2, H3K27me3 and H3K27me2 dynamics during the ESC‐to EpiLC transition. H3 is used as a loading control.
-
B–DInvestigating the impact of dm‐αKG supplementation during the ESC‐to‐EpiLC transition on pluripotent state. (B) Flow cytometer analysis of Rex1‐GFPd2‐positive (Rex1‐GFP+) cells. Graphs represent average fractions of Rex1‐GFP+ cells quantified from triplicate experiments. Error bars denote ± SE. **P ≤ 0.01; ***P ≤ 0.005 (unpaired 1‐tailed Student's t‐test, see Appendix Table S3 for precise P‐values). (C) Characteristic bright‐field images of Rex1‐GFPd2 cells following 48 h culture in EpiLC‐inducing conditions in the presence of increasing doses of dm‐αKG. Scale bar, 10 μm. (D) Representative Western blot displaying IDH2 levels following 48 h EpiLC stimulation with 4 mM dm‐αKG and DMSO, respectively. H3 is used as a loading control.
-
EExpression analysis by qRT–PCR of key regulators of naïve pluripotency and epiblast genes in bulk 48 h cells. Transcript levels are normalized to levels in control culture conditions.
-
FColony formation after culture with increasing dm‐αKG concentration during the ESC‐to‐EpiLC transition, normalized to control culture conditions. Representative images of AP‐stained colonies are displayed. Scale bar, 250 μm.
-
GSuper‐resolution images of TOM‐20 immune‐stained outer mitochondrial membranes (in magenta) following 48 h culture in 2i/Lif/KSR and EpiLC‐inducing conditions with 4 mM dm‐αKG and DMSO, respectively. Cell membranes (in green) are stained with Alexa‐488‐coupled wheat germ agglutinin (WGA‐488). Scale bars, 10 and 3 μm (in zoomed‐in images), respectively.
-
HFlow cytometry‐based quantification of Rex1‐GFPd2‐positive (Rex1‐GFP+) cells following 4 mM dm‐αKG supplementation during the ESC‐to‐EpiLC transition, and subsequent release into standard 2i/Lif/KSR and EpiLC culture conditions, respectively. Average fractions of Rex1‐GFP+ cells are calculated from duplicate experiments each. Error bars indicate ± SE. *P = 0.0517 (unpaired 1‐tailed Student's t‐test).
-
IFlow cytometer analysis of Rex1‐GFPd2‐positive (GFP+) cells following 48 h dm‐αKG pre‐treatment of ESCs in 2i/Lif/KSR culture conditions and subsequent release into EpiLC‐inducing culture conditions.
To investigate a potential functional link between oxidative mitochondrial metabolism, TCA cycle activity, and αKG levels, we examined the effect of sustained αKG supplementation on the ESC‐to‐EpiLC transition. Addition of dimethyl‐αKG (dm‐αKG) during the 48 h EpiLC induction resulted in the retention of Rex1‐GFPd2‐positive cells in a dose‐dependent manner (Figs 3B, and EV3B and C). Indeed, cells cultured in 4 mM dm‐αKG (Carey et al, 2015) retained a homogeneous Rex1‐high state, with a GFP intensity distribution resembling naïve ESCs (Fig 3B). As in naïve ESCs, IDH2 levels were high following dm‐αKG supplementation during the EpiLC stimulation, which is consistent with an active TCA cycle (Fig EV3A and D). Accordingly, dm‐αKG treatment during the EpiLC differentiation promoted expression of the naïve pluripotency regulators Esrrb, Klf4 and Tfcp2l1, while Dnmt3b, Fgf5 and Lin28b, marker genes of epiblast, remained low (Figs 3C and EV3E). Moreover, the colony‐forming ability was strongly enhanced following EpiLC stimulation in the presence of dm‐αKG (Figs 3D and EV3F). The functional similarity of cells subsequently to dm‐αKG supplementation during the 48 h EpiLC induction to naïve ESCs was also reflected in the mitochondrial morphology. Super‐resolution imaging of immune‐stained outer mitochondrial membrane protein TOM‐20 (Huang et al, 2016) showed that, in the presence of dm‐αKG, mitochondria maintained a naïve ESC‐like oval morphology and did not form elongated shapes, as observed in control EpiLCs (Figs 3E and EV3G).
The effect of dm‐αKG was reversible and did not compromise ESC pluripotency and differentiation potential (Fig EV3H). Dm‐αKG pre‐treatment of naïve ESCs in 2i/Lif culture conditions, however, led to the dose‐dependent retention of cells in a Rex1‐GFPd2‐positive state during transition to EpiLCs (Fig EV3I), proposing that the intracellular αKG levels might need to diminish for an exit from naïve pluripotent state.
Together, our molecular, functional and morphological characterizations suggest that αKG sustains an ESC‐like state during EpiLC induction.
The naïve pluripotency‐promoting effect is specific to the TCA cycle metabolite αKG
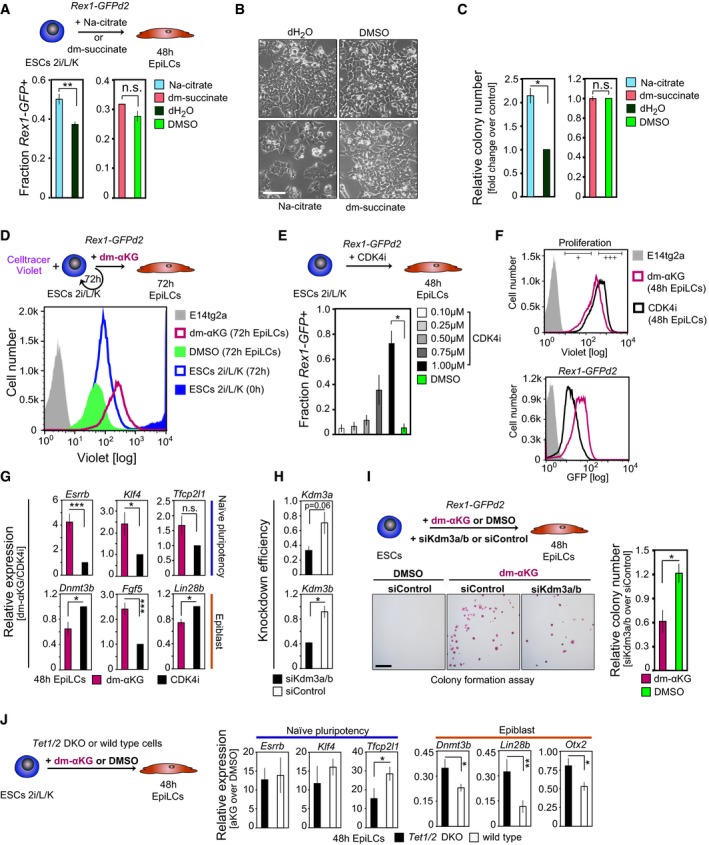
We then asked whether TCA cycle metabolites other than αKG might support a naïve pluripotent state. Supplementation of citrate, a key metabolite upstream of αKG in the mitochondrial TCA cycle (Fig 3A), during the EpiLC induction resulted in a moderate increase in the fraction of Rex1‐GFPd2‐positive cells (Fig EV4A and B) and colony‐forming ability (Fig EV4C). Addition of the downstream metabolite succinate, however, led to the loss of Rex1‐GFPd2 expression and colony formation, comparable to control EpiLCs (Fig EV4A–C). Together, these results suggest a highly specific function for αKG in the maintenance of an ESC‐like state. We thus propose that αKG relays the effect of enhanced oxidative metabolism and TCA cycle activity on naïve pluripotency.
Figure EV4. The effect of αKG on naïve pluripotency is specific and mediated via cell cycle and epigenetic effects (related to Fig 3).
-
AFlow cytometer analysis of Rex1‐GFPd2 cells following 48 h EpiLC stimulation in the presence of 4 mM sodium citrate dehydrate (Na‐citrate; graphs represent averages from quadruplicate assays) and 4 mM dimethyl succinate (dm‐succinate; graphs show averages from duplicate assays). Error bars signify ± SE. **P = 0.0058 (unpaired 1‐tailed Student's t‐test).
-
BRepresentative bright‐field images after 48 h EpiLC induction with 4 mM Na‐citrate and dm‐succinate, respectively. Scale bar, 10 μm.
-
CColony‐forming ability following addition of 4 mM Na‐citrate and dm‐succinate, respectively, during the EpiLC induction. Graphs represent colony formation normalized to control culture conditions, averaged over duplicate experiments each. Error bars denote ± SE. *P = 0.0459 (unpaired 1‐tailed Student's t‐test).
-
D, EInvestigating the impact of proliferation rate on cell state. (D) Cell proliferation analysis through CellTrace Violet labelling of Rex1‐GFPd2 ESCs in 2i/Lif/KSR culture conditions (t = 0 h) followed by flow cytometry‐based evaluation of dye dilution in the presence of 4 mM dm‐αKG and DMSO, respectively, at t = 72 h. (E) Flow cytometer‐based quantification of Rex1‐GFPd2 cells following EpiLC stimulation in the presence of increasing concentrations of CDK4 inhibitor (CDK4i). Graphs represent the average fractions of Rex1‐GFPd2‐positive (Rex1‐GFP+) cells from duplicate experiments. Error bars indicate ± SE. *P = 0.0375 (unpaired 1‐tailed Student's t‐test).
-
FFACS profiles of CellTrace Violet‐labelled Rex1‐GFPd2 cells at t = 48 h, following supplementation of 4 mM dm‐αKG and 1 μM CDK4i, respectively, during the ESC‐to‐EpiLC transition. Cells are gated based on CellTrace Violet intensities (+++, CellTrace Violet‐high; +, CellTrace Violet‐low) and collected for transcript profiling (see G).
-
GqRT–PCR analysis of FACS‐sorted CellTrace Violet‐labelled Rex1‐GFPd2 cells of matching CellTrace Violet intensities. Transcript levels are normalized to levels in CDK4i‐treated cells, averaged over both CellTrace Violet‐high (+++) and CellTrace Violet‐low (+) fractions, and represent duplicate experiments. Error bars denote ± SE. *P ≤ 0.05; ***P ≤ 0.005 (unpaired 1‐tailed Student's t‐test, see Appendix Table S3 for all P‐values).
-
HExpression analysis by qRT–PCR confirms the small‐interfering RNA (siRNA)‐mediated knockdown of Kdm3a and Kdm3b in ESCs in 2i/Lif conditions. Knockdown efficiencies represent expression levels at t = 48 h after siRNA transfection normalized to levels prior to siRNA transfection (t = 0 h) and are averaged over duplicate experiments. Error bars signify ± SE. *P = 0.0327 (unpaired 1‐tailed Student's t‐test).
-
IColony‐forming abilities of cells subsequent to the combinatorial knockdown of Kdm3a and Kdm3b and EpiLC differentiation in the presence of 4 mM dm‐αKG and DMSO, respectively. Representative images of AP‐positive colonies are displayed. Scale bar, 250 μm. Graphs show relative colony formation following Kdm3a/b knockdown, normalized to non‐targeting control siRNA‐treated cells derived under identical culture conditions, averaged over duplicate assays. Error bars denote ± SE. *P = 0.0438 (unpaired 1‐tailed Student's t‐test).
-
JExpression analysis by qRT–PCR of naïve pluripotency and epiblast marker genes in Tet1/2 wild‐type and double‐knockout (DKO) cells following 4 mM dm‐αKG and DMSO, respectively, supplementation during the 48 h EpiLC induction. Transcript levels are normalized to levels in the respective control‐treated cells. Averages of five independent biological assays are shown. Error bars indicate ± SE. *P ≤ 0.05; **P ≤ 0.01 (unpaired 1‐tailed Student's t‐test, see Appendix Table S3 for all P‐values).
αKG promotes naïve pluripotency over multiple passages in the absence of 2i inhibitors
Next, we explored whether αKG can replace 2i inhibitors in sustaining naïve pluripotency. Addition of dm‐αKG to N2B27 media supplemented with Lif and KSR, which on its own rapidly induces differentiation, supported round, dome‐shaped colony morphology, similar to naïve ESCs, over at least 10 days and four passages, respectively (Fig 3F). A minor fraction of cells differentiated in the presence of dm‐αKG, as judged by their elongated, flat shape, reminiscent of feeder cells forming a support layer. Flow cytometry analysis of Rex1‐GFPd2 reporter cells confirmed observations from visual inspection; following 10 days of culture with dm‐αKG, a large proportion of cells were Rex1‐GFPd2‐positive (Fig 3G). Transcript levels of the ESC marker genes Esrrb and Tet2 remained elevated in the presence of dm‐αKG, further supporting maintenance of naïve pluripotency (Fig 3H). Together, these data suggest that αKG can, at least partially, replace 2i inhibitors in the culture media to sustain an ESC‐like state over multiple passages.
αKG supports naïve pluripotency via cell cycle‐dependent and independent mechanisms
We then asked whether the effect of αKG was due to a decrease in cellular proliferation (Fig EV4D). We thus assessed whether the naïve pluripotency‐promoting effect specific to dm‐αKG was conferred through its direct impact on proliferation, or whether it was mediated primarily via cell cycle‐independent mechanisms. Slowing down proliferation rates by treatment with a cyclin‐dependent kinase 4 (CDK4) cell cycle inhibitor (CDK4i; Zhu et al, 2003; Roccio et al, 2013) during the ESC‐to‐EpiLC transition led to the dose‐dependent retention of cells in a Rex1‐GFPd2‐positive state (Fig EV4E), demonstrating that slowing down of the cell cycle delayed exit from naïve pluripotency. However, at equivalent proliferation rates, the fraction of Rex1‐GFPd2‐positive cells following dm‐αKG supplementation exceeded the fraction of Rex1‐GFPd2‐positive cells following CDK4 inhibition (Fig EV4F). Furthermore, at matching proliferation rates, expression levels of marker genes for naïve pluripotency were significantly higher in dm‐αKG‐treated cells, as compared to CDK4‐inhibited cells (Fig EV4G). Thus, by revealing an enhanced effect of dm‐αKG treatment on naïve pluripotency over merely reduced proliferation rates, our data point to additional, cell cycle‐independent effects underlying the impact of αKG on pluripotent state.
αKG supports ESC pluripotency via maintenance of a naïve epigenetic state
αKG is a known co‐factor for a multitude of αKG‐dependent dioxygenases, many of which play central roles in the regulation of chromatin structure, such as the histone H3 lysine 9 dimethyl (H3K9me2) demethylases KDM3A and KDM3B, and the ten‐eleven translocation (TET) enzymes TET1 and TET2 (Klose et al, 2006; Kaelin, 2011; Losman & Kaelin, 2013). Consistently, combinatorial knockdown of the H3K9me2 demethylases Kdm3a and Kdm3b resulted in the reduced colony formation following EpiLC induction in the presence of dm‐αKG (Fig EV4H and I). Accordingly, differences in expression levels of selected ESC and epiblast marker genes were minimized between dm‐αKG‐ and control‐treated EpiLCs in Tet1/Tet2 double‐knockout (DKO; Dawlaty et al, 2013) cells (Fig EV4J). This suggests that αKG supports naïve pluripotency, at least in part, through increasing the efficiency of KDM3A and KDM3B, and TET1 and TET2, respectively.
αKG promotes germ cell fate
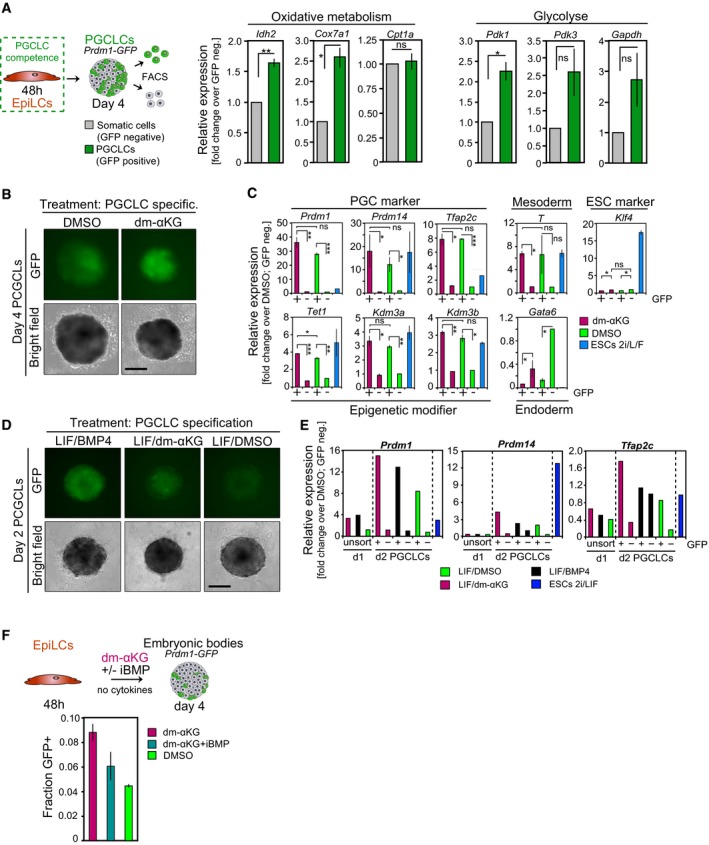
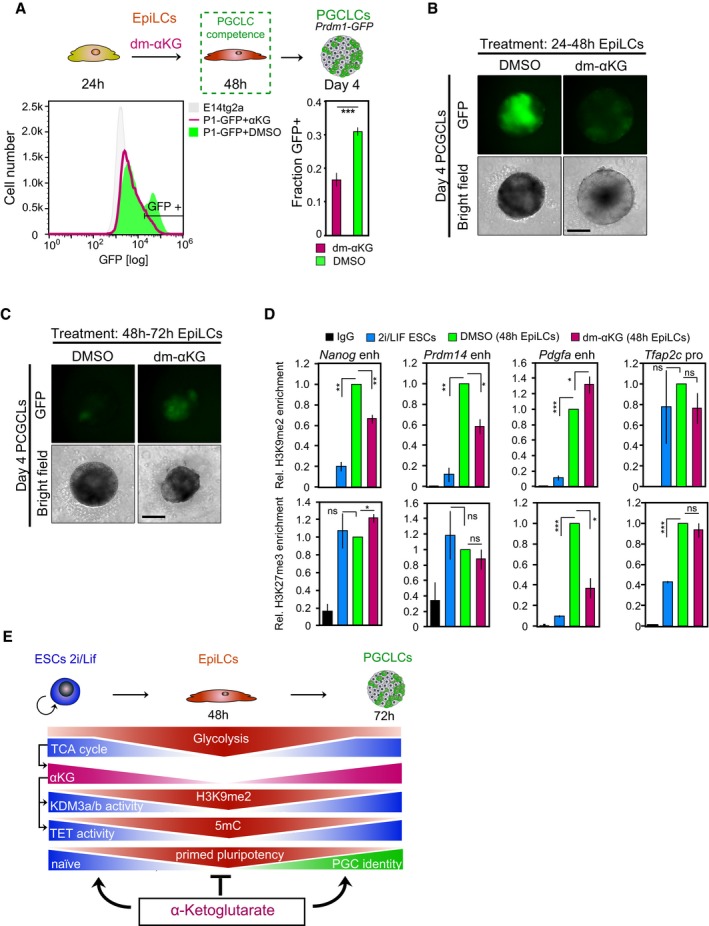
Expression of naïve pluripotency genes in primordial germ cells (PGCs), the precursors of sperm and eggs, indicates that they have a role in a different context (Saitou et al, 2003). Remarkably, as in naïve ESCs, the genes encoding for COX7A1, a central regulator of mitochondrial oxidative metabolism, and the αKG‐producing enzyme IDH2 are upregulated in PGC‐like cells (PGCLCs) generated from EpiLCs via embryoid body formation in the presence of cytokines (Hayashi et al, 2011; Fig EV5A). This suggests that oxidative metabolism and αKG synthesis are enhanced during PGC development. We also note increased expression of Pdk1/3 in PGCLCs, which merits further investigation in the future. Thus, to examine the impact of αKG on PGC fate, we induced PGCLCs from Prdm1‐GFP (Ohinata et al, 2005) EpiLCs. PGCLC stimulation under addition of dm‐αKG led to a roughly 50% increase in the proportion of Prdm1‐GFP‐positive cells by day 4 (Figs 4A and EV5B), albeit with a slightly reduced PGCLC embryoid size, likely due to αKG's impact on cellular proliferation. The key PGC regulators Prdm1, Prdm14, Tfap2c and Brachyury (T) were highly expressed, while the ESC‐specific gene Klf4 was repressed in Prdm1‐GFP‐positive PGCLCs induced in the presence of dm‐αKG (Fig EV5C). Transcript levels of the endoderm‐specific gene Gata6 were low, suggesting that dm‐αKG was specifically enhancing PGC fate. Moreover, robust expression of the αKG‐dependent methylcytosine dioxygenase 1, Tet1, and the H3K9me2 demethylases Kdm3a and Kdm3b is noteworthy, as these changes allow for the loss of DNA methylation in PGCs. Collectively, our data suggest that dm‐αKG supports specification of Prdm1‐GFP‐positive PGCLCs.
Figure EV5. αKG promotes PGC fate (related to Fig 4).
-
AqRT–PCR analysis of key regulators implicated in oxidative (Cox7a1, Cpt1a), glycolytic (Pdk1, Pdk3, Gapdh) and αKG (Idh2) metabolism, respectively, in FACS‐purified Prdm1‐GFP‐positive (GFP+) and Prdm1‐GFP‐negative (GFP−) cells of day‐4 PGCLC embryoids. Transcript levels are normalized to levels in GFP− fractions of control‐treated embryoids. Graphs represent triplicate experiments. Error bars indicate ± SE. *P ≤ 0.05; **P ≤ 0.01 (unpaired 1‐tailed Student's t‐test, see Appendix Table S3 for all P‐values).
-
B, CPGCLC induction in the presence of PGC cytokines and 4 mM dm‐αKG. (B) Characteristic bright‐field and corresponding fluorescence images of day‐4 Prdm1‐GFP PGCLC aggregates are shown. Scale bar, 20 μm. Fluorescent image intensity scales (in units of counts) are adjusted equally. (C) Expression analysis by qRT–PCR in FACS‐purified Prdm1‐GFP‐positive (GFP+) and Prdm1‐GFP‐negative (GFP−) cells at day 4 of PGCLC induction. Transcript levels are normalized to levels in GFP− fractions of control‐treated embryoids. Graphs represent duplicate experiments. Error bars indicate ± SE. *P ≤ 0.05; **P ≤ 0.01; ***P ≤ 0.005 (unpaired 1‐tailed Student's t‐test, see Appendix Table S3 for all P‐values).
-
D, EPGCLC differentiation upon addition of 4 mM dm‐αKG, without cytokines. (D) Characteristic bright‐field and fluorescence images of Prdm1‐GFP embryoids after 2 days of aggregation with LIF (10 ng ml−1) and BMP4 (500 ng ml−1) or dm‐αKG (4 mM) are presented. Scale bar, 20 μm. Fluorescent image intensity scales (in units of counts) are adjusted equally. (E) Expression analysis by qRT–PCR of the key PGC regulators Prdm1, Prdm14 and Tfap2c in FACS‐purified Prdm1‐GFP‐positive (GFP+) and Prdm1‐GFP‐negative (GFP−) embryoids following 2 days of aggregation in the presence of LIF (10 ng ml−1) and BMP4 (500 ng ml−1) or dm‐αKG (4 mM). Transcript levels are normalized to levels in GFP− cells from BMP4‐stimulated embryoids.
-
FFlow cytometer‐based quantification of Prdm1‐GFP‐positive (GFP+) cells following 4 days of aggregation in the presence of 4 mM dm‐αKG and 500 nM inhibitor of BMP signalling (iBMP), without external BMP4/8 supplementation. Average fractions of GFP+ cells are quantified from duplicate assays. Error bars denote ± SE.
Figure 4. αKG promotes PGC fate.
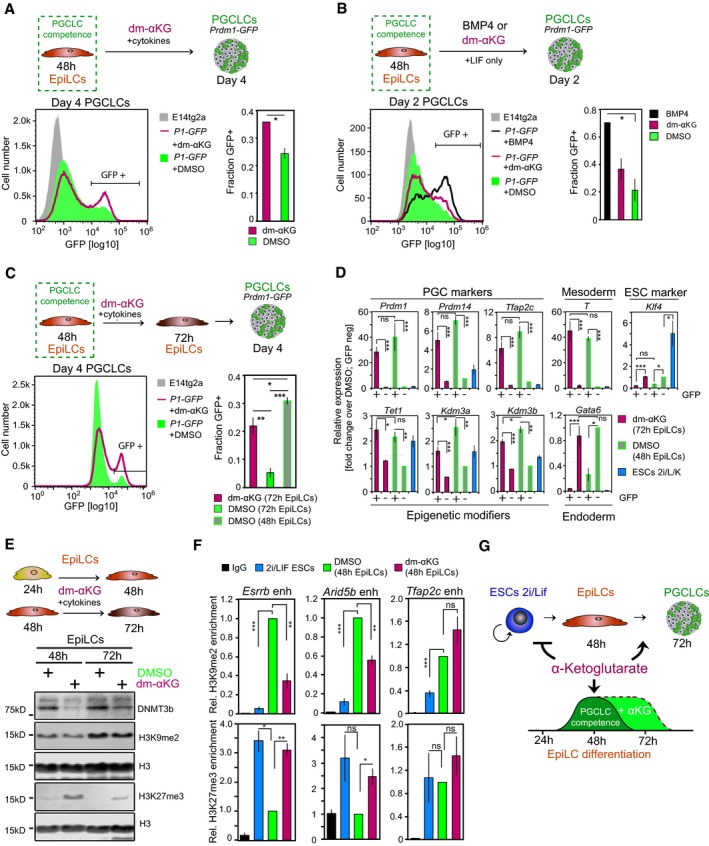
- FACS analysis of Prdm1‐GFP‐positive (GFP+) cells in day‐4 embryoids specified in the presence of 4 mM dm‐αKG and PGC cytokines. Representative flow cytometer profiles are depicted. Graphs show the average fractions of GFP+ cells from duplicate experiments. Error bars denote ± SE. *P = 0.0526 (unpaired 1‐tailed Student's t‐test). P1‐GFP, Prdm1‐GFP.
- FACS analysis of Prdm1‐GFP‐positive (GFP+) cells in day‐2 embryoids aggregated under addition of LIF (10 ng ml−1) and BMP4 (500 ng ml−1), dm‐αKG (4 mM) or DMSO. Representative flow cytometer profiles are displayed. Average fractions of GFP+ cells are calculated from duplicate assays. Error bars denote ± SE. *P = 0.0526. P1‐GFP, Prdm1‐GFP.
- FACS analysis of Prdm1‐GFP‐positive (GFP+) cells in day‐4 PGCLC aggregates specified from 4 mM dm‐αKG‐treated (t = 48 to t = 72 h) EpiLCs. Representative flow cytometer profiles are depicted. The average fractions of GFP+ cells, quantified from triplicate experiments, are shown. Error bars signify ± SE. *P ≤ 0.05; **P ≤ 0.01; ***P ≤ 0.005 (unpaired 1‐tailed Student's t‐test, see Appendix Table S3 for precise P‐values). P1‐GFP, Prdm1‐GFP.
- Transcript analysis by qRT–PCR of PGC specifiers, demethylating enzymes, mesoderm, endoderm and ESC regulators in FACS‐sorted day‐4 Prdm1‐GFP embryoids induced from 4 mM dm‐αKG‐treated 72 h EpiLCs. Expression levels are normalized to Prdm1‐GFP‐negative cells from control embryoids. Graphs represent averages from triplicate experiments. Error bars indicate ± SE. *P ≤ 0.05; **P ≤ 0.01; ***P ≤ 0.005 (unpaired 1‐tailed Student's t‐test, see Appendix Table S3 for precise P‐values). +, Prdm1‐GFP‐positive cells; −, Prdm1‐GFP‐negative cells.
- Western blot analysis for H3K9me2, H3K27me3 and DNMT3b in 4 mM dm‐αKG‐treated EpiLCs. H3 is used as a loading control.
- ChIP‐qPCR analysis of H3K9me2 and H3K27me3 in putative enhancer regions of genes associated with the naïve pluripotent state (Esrrb, Arid5b) and PGC fate (Tfap2c), respectively, in naïve ESCs and at t = 48 h following EpiLC induction in the presence of 4 mM dm‐αKG and DMSO, respectively. Graphs show enrichment of H3K9me2, H3K27me3 and IgG control, respectively, relative to DMSO‐treated EpiLCs. Averages represent triplicate independent experiments. Error bars signify ± SE. *P ≤ 0.05; **P ≤ 0.01; ***P ≤ 0.005 (unpaired 1‐tailed Student's t‐test, see Appendix Table S3 for precise P‐values).
- Model illustrating the extension of the transient developmental competence for the PGC fate through αKG.
Stimulation with BMP4 alone is sufficient to drive PGC development within 2 days (Aramaki et al, 2013). We next explored the impact of dm‐αKG without BMP4/8 in inducing PGC fate. Indeed, dm‐αKG increased the proportion of Prdm1‐GFP‐positive cells within 2–4 days by almost twofold over controls (Figs 4B, and EV5D and F), with pronounced expression of Prdm1, Prdm14 and Tfap2c (Fig EV5E). These data indicate that dm‐αKG alone is sufficient to stimulate PGC development from EpiLCs, albeit with reduced efficiency. This increase was partially reversed by treatment with LDN‐193189, a small molecule inhibitor of BMP type I receptors (Loh et al, 2014; Fig EV5F), suggesting that αKG acts in concert with endogenous BMP signalling to promote PGCLC differentiation.
αKG safeguards the transient state of developmental competence for the PGC fate
Next, we investigated the impact of αKG on the PGC specification competency. Addition of dm‐αKG from 24 to 48 h after the initiation of EpiLC differentiation significantly reduced the number of Prdm1‐GFP‐positive cells in day‐4 PGCLC aggregates (Fig EV6A and B), conceivably through retaining cells in an ESC‐like state. Dm‐αKG supplementation at 48 h, however, during the course of PGCLC induction, resulted in a robust proportion of Prdm1‐GFP‐expressing cells in day‐4 PGCLC embryoids (Figs 4A and EV5B). Remarkably, the addition of dm‐αKG at 48 h during the EpiLC differentiation also markedly prolonged the transient state of competence from its peak at 48 h, up to 72 h (Figs 4C and EV6C). Thus, the induction efficiency of Prdm1‐GFP‐positive PGCLCs from dm‐αKG‐treated 72 h EpiLCs was comparable to those specified from control‐treated 48 h EpiLCs. These cells showed appropriate expression of the key germ cell regulators Prdm1, Prdm14, Tfap2c and Brachyury (T) (Fig 4D). Accordingly, Tet1, Kdm3a and Kdm3b were robustly expressed, while the ESC‐specific regulator Klf4 and the endoderm‐specific marker gene Gata6 were repressed (Fig 4D). Of note, in the control EpiLCs, the competent state for the specification of Prdm1‐GFP‐positive PGCLCs largely declines after 48 h (Figs 4C and EV6C).
Figure EV6. αKG prolongs the developmental competence for the PGC fate (related to Fig 4).
-
A, BDay‐4 Prdm1‐GFP aggregates induced from 48 h EpiLCs following dm‐αKG supplementation from t = 24 to t = 48 h during the EpiLC differentiation. (A) Characteristic flow cytometer profiles are presented. Average proportions of Prdm1‐GFP‐positive (GFP+) cells are quantified from triplicate experiments. Error bars indicate ± SE. ***P = 0.0035 (unpaired 1‐tailed Student's t‐test). (B) Representative bright‐field and fluorescent images of day‐4 Prdm1‐GFP aggregates are shown. Scale bar, 20 μm. Fluorescent image intensity scales (in units of counts) are adjusted equally.
-
CCharacteristic bright‐field and fluorescent images of day‐4 Prdm1‐GFP aggregates specified from 72 h EpiLCs following dm‐αKG supplementation from t = 48 to t = 72 h during the EpiLC differentiation are presented. Scale bar, 20 μm. Fluorescent image intensity scales (in units of counts) are adjusted equally.
-
DChIP‐qPCR analysis of H3K9me2 and H3K27me3 in selected cis‐regulatory regions in naïve ESCs and at t = 48 h following EpiLC induction in the presence of 4 mM dm‐αKG and DMSO, respectively. Graphs show enrichment of H3K9me2, H3K27me3 and IgG control, respectively, relative to DMSO‐treated EpiLCs. Averages represent triplicate independent experiments. Error bars indicate ± SE. *P ≤ 0.05; **P ≤ 0.01; ***P ≤ 0.005 (unpaired 1‐tailed Student's t‐test, see Appendix Table S3 for all P‐values).
-
EModel illustrating the effect of αKG on the epigenetic state and, in turn, cell fate competency.
Acquisition of competence for the PGC fate is associated with dynamic changes in activities of epigenetic regulators (Surani et al, 2007; Hayashi et al, 2011; Hackett & Surani, 2013; Kurimoto et al, 2015), which include those that are modulated by αKG (Klose et al, 2006; Kaelin, 2011; Losman & Kaelin, 2013). Global H3K9me2 levels rose and H3K27me3 levels declined during the EpiLC differentiation (Fig EV3A), which recapitulates the known histone methylation dynamics during early mouse development (Kurimoto et al, 2015; Zylicz et al, 2015). Notably, dm‐αKG treatment preceding the acquisition of developmental competence for the PGC fate prevented cells from attaining the high H3K9me2 and, conversely, low H3K27me3 levels detected in the control 48 h EpiLCs (Fig 4E), in line with the characteristic epigenetic state of a relatively naïve cell state (Fig EV3A). Similarly, dm‐αKG supplementation beyond the time of acquisition of developmental competence broadly sustained H3K9me2 and H3K27me3 levels of PGC‐competent 48 h control EpiLCs (Fig 4E). Likewise, in dm‐αKG‐treated EpiLCs, the levels of the de novo DNA methyltransferase, DNMT3b, were maintained unlike in controls, which showed an increase between 48 and 72 h (Fig 4E). These results suggest that αKG stabilizes the transient developmental potential for the PGC fate through preserving the particular epigenetic state of competent EpiLCs.
Notably, locus‐specific analysis of H3K9me2 and H3K27me3 by ChIP‐qPCR revealed that dm‐αKG counteracts the accumulation of H3K9me2, particularly on some enhancer elements associated with the genes for the naïve pluripotent state (Zylicz et al, 2015), such as Esrrb, Nanog, Prdm14 and Arid5b (Figs 4F and EV6D). Consistently, levels for the H3K27me3 mark were higher on these loci, except for Prdm14, where we detected no change. However, on loci, such as in the enhancer region of the PGC regulator Tfap2c, both repressive marks are increased. This is in line with a general repression of germline genes during epiblast development (Kurimoto et al, 2015). We reason that this locus‐specific effect might reflect the selective recruitment of αKG‐dependent H3K9me2 demethylases, which is consistent with the subtle changes in global H3K9me2 levels.
In summary, αKG enhances PGCLC differentiation potential via synergistic action with BMP signalling and prolongs the time of developmental competence for PGC specification, at least partially, through maintaining H3K9me2, H3K27me3 and DNMT3b largely at levels of PGC‐competent 48 h EpiLCs. We also uncover a locus‐specific effect of dm‐αKG; we find that low levels of H3K9me2 mark a subset of cis‐regulatory regions, in particular enhancers of pluripotency‐associated genes. In contrast, other regulatory regions, such as enhancers of germ cell‐associated genes, show an increase in their H3K9me2 levels, irrespective of dm‐αKG treatment. Through safeguarding a permissive epigenetic state for the PGC fate, αKG might recruit a larger proportion of cells into the competent state, which, in turn, increases the number of Prdm1‐GFP‐positive PGCLCs. Together, our findings extend the interrelation between an oxidative metabolic state, the central TCA cycle metabolite αKG, methylation status and naïve pluripotency, to germ cell development (Figs 4G and EV6E).
Discussion
Single‐cell RNA‐seq during the in vitro transition of naïve mouse embryonic stem cells (ESCs) into primordial germ cell (PGC)‐competent epiblast‐like cells (EpiLCs) and quantitative data analysis support a metabolic switch from an oxidative to an exceedingly glycolytic state (Zhou et al, 2012; Zhang et al, 2016). Correspondingly, we reveal dynamic upregulation of Lin28b, which plays a crucial role in the suppression of genes involved in oxidative metabolism and the regulation of mammalian glucose metabolism (Zhu et al, 2011; Zhang et al, 2016). Pseudotime trajectories also recapitulate other known metabolic regulatory dynamics, such as high expression of threonine dehydrogenase (Tdh) in naïve ESCs, with a sharp decline during EpiLC differentiation (Fig EV1D, Appendix Table S1), consistent with the requirement of threonine metabolism for maintaining ESC pluripotency (Shyh‐Chang et al, 2013). A shift to a predominantly glycolytic metabolism in the post‐implantation epiblast (Zhou et al, 2012; Zhang et al, 2016) seems important for the competent state and PGC fate.
We propose a critical function for an active mitochondrial oxidative metabolism in the replenishing of intracellular αKG levels, which, in turn, promotes demethylating enzymes central to naïve pluripotency and PGC fate. Transcript and protein dynamics of the TCA cycle enzyme IDH2 suggest that αKG levels accumulate in the naïve pluripotent state and decline during EpiLC differentiation (Fig 3I). Consistently, recent studies measured intracellular αKG concentrations to be lower in primed (serum/Lif‐cultured) or differentiated cells as compared to naïve ESCs (Carey et al, 2015; Hwang et al, 2016). However, in contrast to these reports, which link regulation of intracellular αKG production to glycolysis‐coupling pathways (Hwang et al, 2016) and glutamine metabolism (Carey et al, 2015), respectively, our results show negligible changes in expression levels of enzymes implicated in the conversion of αKG from glutamine and glutamate (Gls, Gls2, Glul, Glud1) or the glycolysis‐branched transaminases Psat1 and Psph, during the ESC‐to‐EpiLC transition (Fig EV1D, Appendix Table S1). Instead, we propose that enhanced mitochondrial oxidative metabolism and TCA cycle stimulate αKG production from citrate through mitochondrial IDH2 in naïve ESCs. Accordingly, our analysis reveals binding of the key pluripotency factors OCT4, SOX2 and NANOG (OSN) in the promoter region of Idh2 (Appendix Fig S1). No OSN binding by our criterion is observed in the promoter regions of Dlst and Idh1, encoding for cytosolic IDH, further supporting a link between mitochondrial oxidative metabolism, IDH2‐mediated αKG synthesis and naïve pluripotency. Transition to a predominantly glycolytic metabolism during EpiLC differentiation in turn limits IDH2‐mediated conversion of mitochondrial citrate to αKG, leading to a gradual decrease in intracellular αKG levels. Correspondingly, we ascribe a moderate pluripotency‐promoting effect of citrate to IDH2‐activity in ESCs, likely resulting in αKG synthesis at the onset of EpiLC induction, before Idh2 is downregulated. Reduction or depletion of intracellular αKG during EpiLC differentiation conceivably curbs the activity of demethylating enzymes with key roles in preserving a naïve epigenetic state, such as the H3K9me2 demethylases KDM3A and KDM3B (Ko et al, 2006; Loh et al, 2007) and the TET family enzymes TET1 and TET2 (Costa et al, 2013; Hackett & Surani, 2014). Interaction with additional αKG‐dependent dioxygenases might further contribute to the naïve pluripotency‐promoting effect of αKG.
Collectively, we propose that release from an oxidative metabolic state and diminution of αKG levels are a pre‐requisite for the exit from naïve pluripotency and its unique epigenetic state, and successively the acquisition of developmental competence for the germ cell fate. Importantly, we uncouple cell cycle‐dependent from cell cycle‐independent effects of αKG. To our knowledge, this study is the first to show that limiting cellular proliferation rates during EpiLC induction sustains an ESC‐like state. Critically, we demonstrate that αKG can largely replace 2i inhibitors (Ying et al, 2008) in maintaining a naïve pluripotent state, suggesting that culture in 2i‐conditions may stimulate intracellular αKG production and accumulation. Carey et al (2015) recently proposed metabolic re‐wiring in 2i culture conditions as a potential mechanism for enabling glutamine‐independent growth of naïve ESCs. However, the molecular basis underlying the re‐routing of metabolic flux to increase intracellular αKG levels upon 2i culture remains to be explored. The precise regulatory mechanisms linking 2i culture conditions to mitochondrial respiration merit further investigation into the potential crosstalk between signalling pathways and metabolic state.
While mitochondrial oxidative metabolism declines during the ESC‐to‐EpiLC transition, super‐resolution imaging reveals that, as in EpiSCs (Zhou et al, 2012), mitochondria are more elongated and hence likely more developed in EpiLCs than in ESCs, most probably to meet the metabolic requirements of enhanced oxidative metabolism during later stages of development (Folmes et al, 2012). Consistently, we find that PGCLCs express higher levels of Cox7a1 and Idh2 transcripts, suggesting a boost in mitochondrial oxidative metabolism. Accordingly, activation of mitochondrial oxidative metabolism by 2‐DG supplementation results in enhanced PGCLC induction (Hayashi et al, 2017). The molecular mechanisms underlying the promotion of PGC fate through stimulation of oxidative metabolism, however, remain to be discovered. Here, we show that αKG largely preserves the histone methylation state underlying the developmental competence for the PGC fate, and extend the interrelation between mitochondrial oxidative metabolism, αKG and epigenetic control from the naïve pluripotent state to PGC development.
Notably, the cellular response to αKG changes during the developmental transition from naïve pluripotency to PGC competency; within the first 24 h of EpiLC differentiation, αKG retains cells in a Rex1‐high pluripotent state, with low competency for the PGC fate. By contrast, addition of αKG once EpiLCs have acquired PGCLC competency significantly extends the narrow time window of developmental competence for the PGC fate, without affecting the efficiency of the PGCLC induction.
We propose an appropriate balance between H3K9me2 acquisition and H3K27me3 depletion as being a key to the developmental competence for the PGC fate, which is sustained by dm‐αKG. Of note, dm‐αKG supplementation at the time of competence does not restore the very low H3K9me2 levels as found in naïve ESCs. Instead, through activating αKG‐dependent H3K9me2 demethylases, αKG opposes the differentiation‐induced H3K9me2 accumulation on certain loci and consequently prevents the genome‐wide reduction of H3K27me3 levels. Low levels of DNA demethylation induced by αKG might further promote the spreading of H3K27me3 at high CpG regions (Zylicz et al, 2015).
In summary, we suggest that αKG prolongs fleeting developmental states, such as naïve pluripotency and the transient potential for PGC fate, respectively, through safeguarding their particular epigenetic states. It is conceivable that αKG also stabilizes transitory cellular states in other contexts and might potentially provide a universal tool for capturing and expanding short‐lived cell states in vitro through metabolic modulation.
Materials and Methods
Cell lines
C57BL/6 wild‐type mouse embryonic stem cells (ESCs; clone C8 was used in this study; Grabole et al, 2013) were derived in 2i conditions as described previously (Nichols et al, 2009). For Prdm1‐GFP ESCs (clone BG5 was used in this study), morula‐stage embryos were harvested from uteri of female mice (129 strain) crossed with Prdm1‐GFP transgene male mice (Ohinata et al, 2005). Following 24 h culture in KSOM (Merck) and removal of zona pellucida, blastocyst‐stage embryos were harvested on mouse embryonic fibroblasts and cultured in 2i/Lif conditions in GMEM with 10% foetal calf serum (FCS; Gibco). Rex1‐GFPd2 ESCs were a gift from Tuzer Kalkan (Wray et al, 2011; Kalkan et al, 2017). Tet1/2 wild‐type and double‐knockout (DKO) ESCs (wild‐type clone 4 and DKO clone 51) were received from Rudolf Jaenisch (Dawlaty et al, 2013). Bill Skarnes and Peri Tate provided E14tg2a wild‐type ESCs.
Cell culture and differentiation
Mouse ESCs were maintained in N2B27, supplemented with 1 μM PD0325901 (Miltenyi Biotec), 3 μM CHIR99021 (Miltenyi Biotec) and 10 ng ml−1 LIF (Stem Cell Institute, University of Cambridge (SCI); “2i/Lif” culture conditions; Ying et al, 2008) on 0.1% gelatine‐coated Nunc cell culture dishes (Thermo Fisher Scientific). For maintaining Prdm1‐GFP ESCs, foetal calf serum (FCS; Gibco) was added to a final concentration of 5% to 2i/Lif culture medium. Cells were passaged every 2–3 days using TrypLE Express or Accutase (for Rex1‐GFPd2 ESCs), with media exchange on alternate days. ESCs were grown for at least one passage on dishes coated with 16.67 μg ml−1 human plasma fibronectin (FC010; Millipore) in 2i/Lif with 1% knockout serum replacement (KSR, Thermo Fisher Scientific; “2i/Lif/K”) before inducing epiblast‐like cells (EpiLCs). For differentiation experiments, approximately 25,000 cells per cm2 were plated in fibronectin‐coated dishes in EpiLC‐inducing culture conditions (N2B27 supplemented with 20 ng ml−1 activin A (SCI), 12 ng ml−1 bFGF (SCI) and 1% KSR), with daily media change (Hayashi et al, 2011; Hayashi & Saitou, 2013). Cells were harvested at t = 48 ± 5 h for downstream assays. For EpiLC differentiation experiments exceeding t = 48 ± 5 h, the initial plating density was adjusted accordingly. For primordial germ cell‐like cell (PGCLC) specification, 48 h EpiLCs were aggregated as embryoid bodies in Corning Costar ultra‐low attachment 96‐well plates (Sigma) at 2,000 cells in 100 μl droplets per well in GMEM BHK‐21 (Gibco) with 15% KSR, 0.1 mM NEAA (Thermo Fisher Scientific), 1 mM sodium‐pyruvate (Sigma), 2 mM l‐glutamine (Sigma), 0.1 mM 2‐mercaptoethanol (Thermo Fisher Scientific), 100 U ml−1 penicillin and 0.1 mg ml−1 streptomycin (Sigma), supplemented with 500 ng ml−1 BMP4 (R&D Systems), 500 ng ml−1 BMP8a (R&D Systems), 100 ng ml−1 SCF (R&D Systems), 50 ng ml−1 EGF (R&D Systems) and 10 ng ml−1 LIF (SCF; Hayashi et al, 2011; Hayashi & Saitou, 2013).
Single‐cell transcriptome profiling
For highly parallel processing of single cells from differentiation time points t = 0 (ESCs 2i/Lif/K), t = 24 and t = 48 h, EpiLCs were induced staggered from C57BL/6 wild‐type ESCs (clone C8). Cells were harvested by trypsinization and stained with 2 μg ml−1 Hoechst 33342 (Invitrogen, 917368; ESCs 2i/Lif/K), 2.5 μg ml−1 CellMask Deep Red plasma membrane stain (Molecular Probes, Life Technologies, C10046; 24 h EpiLCs), and 4 μM ethidium homodimer‐1 and 2 μM calcein (LIVE/DEAD Viability/Cytotoxicity Kit for mammalian cells, Molecular Probes, Life Technologies, L3224; 48 h EpiLCs), respectively, for 20 min at 37°C in 5% CO2 in 1 ml N2B27 with 1% KSR (N2B27/K) each. Labelled cells were washed twice in 500 μl N2B27/K, before combining cells from all three time points in equal numbers for single‐cell capture and simultaneous processing using the C1 Single‐Cell AutoPrep System (C1 Integrated Fluidic Circuits for mRNA‐seq (10–17 μm), Fluidigm, 100‐5760; C1 Single‐Cell AutoPrep Reagent Kit for mRNA‐seq, Fluidigm, 100‐6201). Cell identities of single captured cells were deconvoluted based on fluorescent dye labels, using an inverted Olympus fluorescence microscope, before single‐cell cDNAs were generated on‐chip by SMARTer technology (SMARTer Ultra Low RNA Kit for Illumina Sequencing, Clontech, 634936; Advantage 2 PCR Kit, Clontech, 639206; Ramskold et al, 2012). Multiplexed cDNA libraries of single cells were prepared using the Nextera XT DNA Sample Preparation Kit (Illumina, FC‐131‐1096 and FC‐131‐1002) and sequenced on the Illumina HiSeq 2000 platform. Extensive quality control analysis was performed, and only 67 single cells that met the following criteria were included for further analysis:
Cells that could be uniquely identified via fluorescence microscopy and
Cells with equal or greater than 6 million uniquely mapping reads.
Mapping of sequencing reads
Fastq files were filtered for low‐quality reads (< Q20), and low‐quality bases were trimmed from read ends (< Q20) using the FASTX‐Toolkit. Adaptors were removed using CutAdapt (Martin, 2011). The resulting filtered files were mapped to the mouse genome (UCSC mm9) using TopHat 2.0.6 (Trapnell et al, 2009; Kim et al, 2013) with the UCSC mm9 junction file. BAM files generated from multiple sequencing runs were merged with samtools 0.1.18 (Li et al, 2009). Transcript counts and RPKMs were calculated using custom R scripts based on the GenomicRanges Bioconductor library and annotation from the UCSC mm9 junction file. Scripts are available upon request.
Derivation of pseudotime trajectories
Single‐cell transcript counts from time points t = 0, t = 24 and t = 48 h during the ESC‐to‐EpiLC transition were combined, transcripts with no variation removed, and data transformed by log10(count + 1). Forty‐eight hours EpiLCs with high Tfcp2l1 expression (log10(count + 1) > 1.5) were excluded. This left us with 56 out of 67 cells. The R method DESeq2::estimateSizeFactorsForMatrix was used for normalization. To fit the pseudotime model, genes encoding for 135 transcripts, including central regulators of pluripotency, genes associated with epiblast development, epigenetic regulators, transcripts encoding for enzymes within key metabolic pathways and those with the highest ratio of variance between capture time to variance within capture time were chosen (Appendix Table S2). The DeLorean pseudotime method was applied, using the following hyperparameters: στ = 8 h, l = 48 h. The DeLorean model was fit with the No‐U‐Turn‐Sample (NUTS). The null hypothesis (cells were ordered no better than randomly) was rejected by The DeLorean permutation roughness test with P < 10−15.
Quantification of single‐cell transcript level changes
For a comprehensive quantification of expression level changes of 478 transcripts encoding for metabolic regulators and control genes, a representative pseudotime for the start and end, respectively, of the ESC‐to‐EpiLC differentiation was estimated as the median pseudotime for naïve ESCs in 2i/Lif culture conditions and EpiLCs captured at 48 h, respectively: a Gaussian process pseudotime trajectory was fit to each transcript using the cells’ pseudotimes inferred from fitting the DeLorean model (see “Derivation of pseudotime trajectories” above). The Kullback–Leibler (KL) divergence between the posterior distributions of the expression trajectory at the representative naïve ESCs and 48 h EpiLCs pseudotimes was calculated as a quantitative measure of change in gene expression. The KL divergence has several properties that make it suitable for this purpose: it is invariant to shifting and scaling of the data; however, it is sensitive to changes in the variance of the pseudotime trajectory. Transcripts were ranked by their KL divergences (Appendix Table S1); higher divergences indicate genes whose distribution of expression has changed the most between the onset and the end point of the ESC‐to‐EpiLC differentiation.
Metabolic modulation
For metabolic modulation, 1–10 mM 2‐deoxy‐D‐glucose (2‐DG, Sigma‐Aldrich, D6134) in dH2O, 5–20 mM sodium dichloroacetate (DCA, Santa Cruz Biotechnology, Inc., sc‐203275) in dH2O, 1–4 mM dimethyl alpha‐ketoglutarate (dm‐αKG, Sigma‐Aldrich, 349631), 4 mM sodium citrate dehydrate (Na‐citrate, Sigma‐Aldrich, W302600) in dH2O and 4 mM dimethyl succinate (dm‐succinate, Sigma‐Aldrich, W239607), respectively, were added to cell culture media at the time of plating, with daily media change. For pharmacological modulation during PGCLC differentiation, 4 mM dm‐αKG and 500 nM small molecule inhibitor of bone morphogenetic protein (BMP) type I receptors ALK2 and ALK3, LDN‐193189 (“iBMP”, Stemgent, 04‐0074) in DMSO, respectively, were added once at the time of embryoid body aggregation.
Colony formation assays
Following 48 h culture in EpiLC‐inducing conditions in the presence of metabolic modulators (2‐DG, DCA, dm‐αKG, Na‐citrate, dm‐succinate), 2,000 cells were plated in fibronectin‐coated 6‐well plates in 2i/Lif medium with 3% FCS. The next day, cells were rinsed once with 1×PBS and replenished with fresh culture medium. On day 6, cells were fixed with 4% formaldehyde (Thermo Fisher Scientific, PN28906) for 15 min at room temperature and stained for alkaline phosphatase (AP) using Leukocyte Alkaline Phosphatase Kit (Sigma‐Aldrich, 86R) according to manufacturer's instructions. AP‐positive colonies were quantified and imaged on an upright Zeiss microscope (Stemi SV11), using Leica Application Suite software (v4.1).
Quantifying cellular proliferation rates
To assess cellular proliferation, ESCs were stained with CellTrace Violet Cell Proliferation Kit (Molecular Probes, Life Technologies, C34557) following manufacturer's instructions for labelling of adherent cells, before EpiLC induction and subsequent quantification of remaining dye levels by flow cytometry. For benchmarking of proliferation rates, dye dilution in the presence of increasing doses (0.1 μm–1 μM) of the cell‐permeable cyclin‐dependent kinase 4 (CDK4) inhibitor 2‐Bromo‐12,13‐dihydro‐5H‐indolo[2,3‐a]pyrrolocarbazole‐5,7(6H)‐dione (“CDK4i”, Calbiochem, 219476) in DMSO was compared to dye dilution following 4 mM dm‐αKG treatment. For gene expression analysis, cells were gated based on CellTrace Violet intensities and collected by fluorescence‐activated cell sorting (FACS).
Flow cytometry
For flow cytometry, cells were re‐suspended in 1×PBS with 3% FCS. Flow cytometer analysis was performed on a BD FACScan; data were analysed using BD CellQuest software. FACS sorting was performed on a Moflo (for dye dilution experiments) and SONY SH800 cell sorter (for PGCLC experiments). FACS data were evaluated using FlowJo software.
Quantitative real‐time PCR
RNA was extracted using the RNeasy Mini Kit (Qiagen, 74104; for ESCs and EpiLCs) and Arcturus PicoPure RNA Isolation Kit (Applied Biosystems, Thermo Fisher Scientific, 12204‐01; for ESCs and PGCLCs), with on‐column DNase digestion (Qiagen, 79254). cDNAs were generated using SuperScript III Reverse Transcriptase (Thermo Fisher Scientific, 18080‐044), according to manufacturer's instructions. Quantitative real‐time PCR was performed on a QuantStudio 6 Flex Real‐Time PCR System (Applied Biosystems), with SYBR Green JumpStart Taq ReadyMix (Sigma‐Aldrich, S4438), in triplicate for each condition. For each independent biological experiment, data were averaged over technical triplicates and analysed using the comparative Ct method (Schmittgen & Livak, 2008), with transcript levels internally normalized to ActB expression levels. Primer pairs used were as follows: ActB, forward, 5′‐CCCTAAGGCCAACCGTGAAA‐3′, reverse, 5′‐AGCCTGGATGGCTACGTACA‐3′; Esrrb, forward, 5′‐GGCGTTCTTCAAGAGAACCA‐3′, reverse, 5′‐CTCCGTTTGGTGATCTCACA‐3′; Klf4, forward, 5′‐GGGGTCTGATACTGGATGGA‐3′, reverse, 5′‐CCCCCAAGCTCACTGATTTA‐3′; Tfcp2l1, forward, 5′‐AGGTGCTGACCTCCTGAAGA‐3′, reverse, 5′‐GTTTTGCTCCAGCTCCTGAC‐3′; Dnmt3b, forward, 5′‐GACGTCCGGAAAATCACCAA‐3′, reverse, 5′‐GATCATTGCATGGGCTTCCA‐3′; Fgf5, forward, 5′‐TACCCGGATGGCAAAGTCAA‐3′, reverse, 5′‐ATCCCCTGAGACACAGCAAA‐3′; Lin28b, forward, 5′‐CGAGAGGGAAATCCCTTGGATA‐3′, reverse, 5′‐CCACTGGCTCTCCTTCTTTCA‐3′; Prdm1, forward, 5′‐GAGGATCTGACCCGAATCAA‐3′, reverse, 5′‐CTCAACACTCTCATGTAAGAGGC‐3′; Prdm14, forward, 5′‐GCCTGAACAAGCACATGAGA‐3′, reverse, 5′‐TGCACTTGAAGGGCTTCTCT‐3′; Tfap2c, forward, 5′‐CGCGGAAGAGTATGTTGTTG‐3′, reverse, 5′‐CGATCTTGATGGAGAAGGTCA‐3′; Klf2, forward, 5′‐ACCAAGAGCTCGCACCTAAA‐3′, reverse, 5′‐GTGGCACTGAAAGGGTCTGT‐3′; Nanog, forward, 5′‐ACCTGAGCTATAAGCAGGTTAAGAC‐3′, reverse, 5′‐GTGCTGAGCCCTTCTGAATCAGAC‐3′; T, forward, 5′‐TCCCGAGACCCAGTTCATAG‐3′, reverse, 5′‐TTCTTTGGCATCAAGGAAGG‐3′; Gata6, forward, 5′‐AACCCATTCATCCCCGACCAC‐3′, reverse, 5′‐CTCCTCTCCACGAACGCTTGT‐3′; Sox7, forward, 5′‐AAACGTCTGGCAGTGCAGAAC‐3′, reverse, 5′‐CAGCGCCTTCCATGACTTTCC‐3′; Tet1, forward, 5′‐AGATGGCTCCAGTTGCTTATCA‐3′, reverse, 5′‐ACGCCCCTCTTCATTTCCAA‐3′; Kdm3a, forward, 5′‐ATTCGAGCTGTTTCCCACAC‐3′, reverse, 5′‐TTTCTCCAAGACTCCCCATCA‐3′; Kdm3b, forward, 5′‐CCATGACCCCAGCAACAAAA‐3′, reverse, 5′‐TGCACCCCTGAAACTAGCA‐3′; Cox7a1, forward, 5′‐CGAAGAGGGGAGGTGACTC‐3′, reverse, 5′‐AGCCTGGGAGACCCGTAG‐3′; Cpt1a, forward, 5′‐GACTCCGCTCGCTCATTC‐3′, reverse, 5′‐TCTGCCATCTTGAGTGGTGA‐3′; Idh2, forward, 5′‐GGATGTACAACACCGACGAGT‐3′, reverse, 5′‐CGGCCATTTCTTCTGGATAG‐3′; Pdk1, forward, 5′‐GTTGAAACGTCCCGTGCT‐3′, reverse, 5′‐GCGTGATATGGGCAATCC‐3′; Pdk3, forward, 5′‐AAGCAGATCGAGCGCTACTC‐3′, reverse, 5′‐TTCACATGCATTATCCCTTCC‐3′; Gapdh, forward, 5′‐CCCCAACACTGAGCATCTCC‐3′, reverse, 5′‐ATTATGGGGGTCTGGGATGG‐3′.
Small‐interfering RNA‐mediated knockdown
For combinatorial knockdown via small‐interfering RNAs (siRNAs), 275,000 ESCs cultured in 2i/Lif were reverse‐transfected with 12.5 nM each of ON‐TARGETplus Kdm3a siRNA (GE Healthcare Lifesciences, L‐056510‐00‐0005) and ON‐TARGETplus Kdm3b siRNA (GE Healthcare Lifesciences, L‐065381‐00‐0005), and 25 nM ON‐TARGETplus Non‐targeting Pool (GE Healthcare Lifesciences, D‐001810‐10‐05) as control, respectively, using DharmaFECT 1 Transfection Reagent (Dharmacon, T‐2001‐02) according to manufacturer's instructions. For each condition, all cells were plated in one 6‐well plate coated with fibronectin in 2i/Lif/K medium. The following day, cells were replenished with fresh 2i/Lif/K medium and induced into EpiLCs 1 day later. Knockdown efficiencies were derived by normalizing Kdm3a and Kdm3b, respectively, expression levels in ESCs in 2i/Lif culture conditions at t = 48 h after siRNA transfection to levels prior to siRNA transfection (t = 0 h).
Mitochondria labelling
For staining mitochondria, cells grown on ethanol‐cleaned, fibronectin‐coated microscope cover glasses (Marienfeld, 0107052) were washed three times with 1×PBS warmed to 37°C, before 15‐min fixation in 37°C pre‐warmed 3% formaldehyde (Thermo Fisher Scientific, PN28906) and 0.1% aqueous glutaraldehyde (Thermo Fisher Scientific, 50‐262‐10) in 1×PBS at room temperature, followed by three rinses in 1×PBS. Cells were permeabilized and blocked for 1 h at room temperature in 3% BSA and 0.2% Triton X‐100 in 1×PBS, before incubating overnight with primary antibody (rabbit anti‐TOM20, FL‐145, Santa Cruz Biotechnology, sc‐11415) at a 1:1,000 dilution in 1% BSA and 0.2% Triton X‐100 in 1×PBS in a humid chamber at 4°C. Cells were rinsed three times in 0.05% Triton X‐100 in 1×PBS and incubated with secondary antibody (anti‐rabbit‐IgG‐Atto 647N, Sigma‐Aldrich, 40839) diluted 1:500 in 1% BSA and 0.2% Triton X‐100 in 1×PBS for 1 h at room temperature in a humid chamber protected from light. Following three washes in 0.05% Triton X‐100 in 1×PBS, antibody‐stained cells were fixed for 10 min in 3% formaldehyde (Thermo Fisher Scientific, PN28906) and 0.1% aqueous glutaraldehyde (Thermo Fisher Scientific, 50‐262‐10) in 1×PBS at room temperature. Cell membranes were labelled with 5 μg ml−1 wheat germ agglutinin, Alexa Fluor 488 conjugate (WGA‐488, Thermo Fisher Scientific, W11261) in 1×PBS for 10 min at room temperature and rinsed three times in 1×PBS, before mounting onto SuperFrost Plus microscope slides (VWR, 631‐0108) in ProLong Gold antifade reagent (Thermo Fisher Scientific, P36930). Slides were sealed with nail varnish and stored at 4°C prior to imaging.
Imaging and analysis
Super‐resolution imaging was performed on a custom‐built STED microscope featuring three excitation lines, one fixed depletion wavelength, fast beam scanning and gated detection. The custom STED microscope follows closely to the microscope described in Bottanelli et al (2016) (hardware is identical, optical arrangement differs slightly). All images were acquired with a 100× oil immersion objective lens (Olympus, UPLSAPO 100XO/PSF). Either a 30 × 30 μm field of view with an image format of 2,048 × 2,048 (14 nm square pixel size) or a 10 × 10 μm field of view (“zoom‐in”) with a 1,024 × 1,024 image format (9.8 nm square pixel size) was used. Unidirectional beam scanning was performed at 16 kHz with synchronized beam blanking to reduce light exposure. Excitation laser intensity was approximately 10–20 μW at the microscope side‐port and STED depletion power was 110–120 mW at the microscope side‐port. TOM‐20 (Atto 647N) and membrane WGA (Alexa‐488) were imaged simultaneously although the STED depletion beam only acts on the Atto 647N. Thus, one super‐resolved STED mitochondria image and one confocal membrane image membrane were acquired simultaneously. For each line of an image, each line was scanned either 600 times (10 × 10 μm case) or 650 times (30 × 30 μm case). For 10 × 10 μm images, acquisition time was 38 s. For the larger 30 × 30 μm images, acquisition time was 83 s.
To aid visualization, intensity scales (in units of counts) were adjusted using Fiji software as follows:
ESC2 2i/Lif/K: TOM‐20 (mitochondria, magenta): 0–5 (30 × 30 μm). 0–9 (10 × 10 μm).
WGA‐488 (membrane, green): 0–86 (30 × 30 μm).
48 h EpiLCs + DMSO: TOM‐20 (mitochondria, magenta): 0–4 (30 × 30 μm). 0–8 (10 × 10 μm).
WGA‐488 (membrane, green): 0–10 (30 × 30 μm).
48 h EpiLCs + dm‐αKG: TOM‐20 (mitochondria, magenta): 0–5 (30 × 30 μm). 0–9 (10 × 10 μm).
WGA‐488 (membrane, green): 2–48 (30 × 30 μm).
Bright‐field and epifluorescence images of cells were acquired on an inverted Olympus microscope with Leica Application Suite software (v4.1) and processed using Fiji software. Fluorescent image intensity scales (in units of counts) were adjusted equally.
Western blot analysis
Cells were harvested, re‐suspended in 50 mM Tris–HCl (pH 8.0) supplemented with 1% SDS, 10 mM EDTA, 1× protease inhibitor cocktail (Roche) and lysed by 10 min of incubation on ice. Cell lysates were cleared through 15 min of centrifugation at 13,000 g, protein concentrations (determined using the Bicinchoninic Acid Kit, Sigma‐Aldrich) were adjusted, and samples were incubated for 5 min at 95°C following addition of Laemmli buffer. Proteins were separated on 12% polyacrylamide gels using the Mini‐PROTEAN system (Bio‐Rad) and transferred to an Immobilon‐P transfer membrane (Millipore). Following 2 h of blocking in 5% skimmed milk, the membranes were incubated with primary antibodies, diluted in 5% BSA, 0.01% TBST overnight at 4°C. Primary antibodies used in this study were as follows: rabbit anti‐H3K27me3 (Cell Signaling Technology, C36B11; 1:5,000), mouse anti‐H3K9me2 (Abcam, ab1220; 1:5,000), rabbit anti‐H3 (Abcam, ab1791; 1:10,000), goat anti‐DNMT3b (Santa Cruz Biotechnology, sc‐10235; 1:1,000) and rabbit anti‐IDH2 [Abcam, ab129180 (EPR7576); 1:1,000].
Histone antibody binding was visualized using IRDye 680RD, goat anti‐mouse IgG IRDye 680RD, goat anti‐rabbit IgG IRDye 800CW and goat anti‐mouse IgG IRDye 800CW, respectively, secondary antibodies (LI‐COR; 1:2,000 in 5% skimmed milk, 0.01% TBST) and the LI‐COR Odyssey CLx system. DNMT3b and IDH2, respectively, antibody binding was detected by horseradish peroxidase‐conjugated anti‐goat IgG (Dako; 1: 2,000 in 5% skimmed milk, 0.01% TBST) and anti‐rabbit IgG (Dako; 1: 5,000 in 5% skimmed milk, 0.01% TBST), respectively, in conjunction with the Western Detection System (GE Healthcare).
ChIP‐qPCR analysis
Native ChIP (nChIP) was performed as previously described (Brind'Amour et al, 2015). Briefly, cells were washed, dissociated and stored in nuclear storage buffer (Nuclei Isolation Kit; Sigma‐Aldrich) at −80°C prior to lysis in digestion buffer [1× MNase buffer (NEB); 2.5 mM DTT, 6.25% PEG‐6000, 2.5 U MNase (NEB)]. Following chromatin pre‐clearance through protein A/G Dynabeads (Thermo Fisher Scientific), the antibody–bead complex was formed by 2‐h incubation with antibody in IP buffer (20 mM Tris–HCl pH 8.0; 2 mM EDTA; 150 mM NaCl; 0.1% Triton X‐100), with protein inhibitor cocktail (Roche) at 4°C. Chromatin and antibody‐bead complex were then inculcated overnight at 4°C and washed, and purified DNA was quantified by qPCR on a QuantStudio 6 Flex Real‐Time PCR System (Applied Biosystems). Antibodies used for nChIP experiments were as follows: anti‐H3K27me3 (Cell Signaling Technology; C36B11; lot 8); anti‐H3K9me2 (Abcam; ab1220; lot GR212253‐7); rabbit IgG (Santa Cruz Biotechnology; sc‐2027; lot H2615); mouse IgG (Santa Cruz Biotechnology; sc‐2025; lot G2314). H3K9me2 and H3K27me3, respectively, occupancy was investigated in putative enhancer regions of candidate genes, based on three published datasets (Ma et al, 2011; Buecker et al, 2014; Zylicz et al, 2015). Primer pairs used were as follows: Esrrb enhancer, forward, 5′‐AGGTTTGAATGGGACAGGAG‐3′, reverse, 5′‐GATTGCACATCAAGGACTGG‐3′; Arid5b enhancer, forward, 5′‐GGATTCAGAGAGCAAGCACA‐3′, reverse, 5′‐TGCTTCTGCAGGAATCTCAG‐3′; Tfap2c enhancer, forward, 5′‐GCGCTTAGGTCGCTTGGATA‐3′, reverse, 5′‐CTCGAACACTTGGAGTCGGG‐3′; Nanog enhancer, forward, 5′‐TTCAGTCAGGCTGGGCAATG‐3′, reverse, 5′‐CCTCAACTGCTGCCACACTA‐3′; Prdm14 enhancer, forward, 5′‐AAGCAGCAGGGTGGAGATAA‐3′, reverse, 5′‐AAATGGGCTGCTAAGTGCAT‐3′; Pdgfa enhancer, forward, 5′‐CCTCATCTTCCTCCTTCCAC‐3′, reverse, 5′‐AAATCAGACAGGCAGGGTGT‐3′; Tfap2c promoter, forward, 5′‐CAGCCAGATACAGCTTCGGG‐3′, reverse, 5′‐GATTCCGAGAAGGAGTCCGC‐3′.
OSN binding site analysis
For transcription factor occupancy analysis, binding of OCT4, SOX2 and NANOG (OSN) within a region of 20 kb upstream to 4 kb downstream of the transcriptional start sites of genes of interest was investigated, based on ChIP‐seq summary data from three separate publications (Chen et al, 2008; Marson et al, 2008; Whyte et al, 2013). A gene was defined as occupied by OSN if all three factors bound the region in the summary data from at least two of the three publications.
Quantification and statistical analysis
Microsoft Excel was used for statistical evaluation of gene expression (qRT–PCR), flow cytometer analysis and colony formation assays. Data were analysed using unpaired (heteroscedastic) 1‐tailed Student's t‐tests. For comparing fold changes in gene expression levels, statistical analysis was performed on log10‐transformed data. Statistical details of the experiments, such as the number of independent biological replicates, definition of centre, dispersion and significance are reported in the figure legends. Data are represented as mean ± 1 SEM. Significance levels are denoted as follows: *P ≤ 0.05; **P ≤ 0.01; ***P ≤ 0.005. P‐values for all statistically evaluated experiments are listed in Appendix Table S3.
Data availability
The single‐cell RNA‐seq data reported here have been deposited in GEO under accession number GSE107761.
Author contributions
JT designed the experiments; performed cell culture, single‐cell processing for RNA‐seq, flow cytometry, qRT–PCR, immunofluorescence, imaging, data analysis and graphical representations; and wrote the paper. WHG performed Western blot and ChIP‐qPCR analyses, qRT–PCR, data analysis and graphical representations of the experimental results. JR and LW performed pseudotime, statistical and binding site analyses. EA built the STED microscope and helped with super‐resolution imaging. FB, CM and FT performed the GPLVM analysis. BDS provided experimental support. MAS supervised the study.
Conflict of interest
The authors declare that they have no conflict of interest.
Supporting information
Appendix
Expanded View Figures PDF
Review Process File
Acknowledgements
We thank M. Lynch for help with single‐cell processing on the Fluidigm platform; S. Leigh‐Brown for generating single‐cell RNA‐seq libraries; J. Hadfield and D. Bentley for single‐cell RNA‐sequencing; N. Miller for EpiLC FACS sorting; C. Lee for preparing N2B27 stem cell media; G. Sirinakis for help with super‐resolution imaging; T. Kalkan, T. Kobayashi, P. Tate and W. Skarnes for ESC lines; C. Bradshaw, G. Allen and S. Dietmann for mapping sequencing reads; B. Goettgens and S. Teichmann for discussion on single‐cell expression analysis; M. Mueschen for discussion on cellular metabolism; U. Gunesdogan, C. Penfold, J. van den Ameele and S.J. Maerkl for critically reading the manuscript and for discussion; and T. Bollenbach and all members of the Surani laboratory for input. JT was supported by the Austrian Academy of Sciences, the Wellcome Trust and the Swiss National Fund for Science; WHG by EMBO and the Wellcome Trust; JR and LW by the UK Medical Research Council; and EA and BDS by the Wellcome Trust. MAS is a Wellcome Senior Investigator. Work at the Gurdon Institute is supported by a core grant from The Wellcome Trust and Cancer Research UK.
The EMBO Journal (2019) 38: e99518
See also: V Lu & MA Teitell (January 2019)
References
- Aramaki S, Hayashi K, Kurimoto K, Ohta H, Yabuta Y, Iwanari H, Mochizuki Y, Hamakubo T, Kato Y, Shirahige K, Saitou M (2013) A mesodermal factor, T, specifies mouse germ cell fate by directly activating germline determinants. Dev Cell 27: 516–529 [DOI] [PubMed] [Google Scholar]
- Bottanelli F, Kromann EB, Allgeyer ES, Erdmann RS, Baguley SW, Sirinakis G, Schepartz A, Baddeley D, Toomre DK, Rothman JE, Bewersdorf J (2016) Two‐colour live‐cell nanoscale imaging of intracellular targets. Nat Commun 7: 10778 [DOI] [PMC free article] [PubMed] [Google Scholar]
- Brind'Amour J, Liu S, Hudson M, Chen C, Karimi MM, Lorincz MC (2015) An ultra‐low‐input native ChIP‐seq protocol for genome‐wide profiling of rare cell populations. Nat Commun 6: 6033 [DOI] [PubMed] [Google Scholar]
- Buecker C, Srinivasan R, Wu ZX, Calo E, Acampora D, Faial T, Simeone A, Tan MJ, Swigut T, Wysocka J (2014) Reorganization of enhancer patterns in transition from naive to primed pluripotency. Cell Stem Cell 14: 838–853 [DOI] [PMC free article] [PubMed] [Google Scholar]
- Buettner F, Theis FJ (2012) A novel approach for resolving differences in single‐cell gene expression patterns from zygote to blastocyst. Bioinformatics 28: i626–i632 [DOI] [PMC free article] [PubMed] [Google Scholar]
- Cahan P, Daley GQ (2013) Origins and implications of pluripotent stem cell variability and heterogeneity. Nat Rev Mol Cell Biol 14: 357–368 [DOI] [PMC free article] [PubMed] [Google Scholar]
- Carey BW, Finley LW, Cross JR, Allis CD, Thompson CB (2015) Intracellular alpha‐ketoglutarate maintains the pluripotency of embryonic stem cells. Nature 518: 413–416 [DOI] [PMC free article] [PubMed] [Google Scholar]
- Chen X, Xu H, Yuan P, Fang F, Huss M, Vega VB, Wong E, Orlov YL, Zhang WW, Jiang JM, Loh YH, Yeo HC, Yeo ZX, Narang V, Govindarajan KR, Leong B, Shahab A, Ruan YJ, Bourque G, Sung WK et al (2008) Integration of external signaling pathways with the core transcriptional network in embryonic stem cells. Cell 133: 1106–1117 [DOI] [PubMed] [Google Scholar]
- Costa Y, Ding JJ, Theunissen TW, Faiola F, Hore TA, Shliaha PV, Fidalgo M, Saunders A, Lawrence M, Dietmann S, Das S, Levasseur DN, Li Z, Xu MJ, Reik W, Silva JCR, Wang JL (2013) NANOG‐dependent function of TET1 and TET2 in establishment of pluripotency. Nature 495: 370–374 [DOI] [PMC free article] [PubMed] [Google Scholar]
- Dawlaty MM, Breiling A, Le T, Raddatz G, Barrasa MI, Cheng AW, Gao Q, Powell BE, Li Z, Xu MJ, Faull KF, Lyko F, Jaenisch R (2013) Combined deficiency of Tet1 and Tet2 causes epigenetic abnormalities but is compatible with postnatal development. Dev Cell 24: 310–323 [DOI] [PMC free article] [PubMed] [Google Scholar]
- Folmes CD, Dzeja PP, Nelson TJ, Terzic A (2012) Metabolic plasticity in stem cell homeostasis and differentiation. Cell Stem Cell 11: 596–606 [DOI] [PMC free article] [PubMed] [Google Scholar]
- Grabole N, Tischler J, Hackett JA, Kim S, Tang FC, Leitch HG, Magnusdottir E, Surani MA (2013) Prdm14 promotes germline fate and naive pluripotency by repressing FGF signalling and DNA methylation. EMBO Rep 14: 629–637 [DOI] [PMC free article] [PubMed] [Google Scholar]
- Hackett JA, Surani MA (2013) DNA methylation dynamics during the mammalian life cycle. Philos Trans R Soc Lond B Biol Sci 368: 20110328 [DOI] [PMC free article] [PubMed] [Google Scholar]
- Hackett JA, Surani MA (2014) Regulatory principles of pluripotency: from the ground state up. Cell Stem Cell 15: 416–430 [DOI] [PubMed] [Google Scholar]
- Hayashi K, Ohta H, Kurimoto K, Aramaki S, Saitou M (2011) Reconstitution of the mouse germ cell specification pathway in culture by pluripotent stem cells. Cell 146: 519–532 [DOI] [PubMed] [Google Scholar]
- Hayashi K, Saitou M (2013) Generation of eggs from mouse embryonic stem cells and induced pluripotent stem cells. Nat Protoc 8: 1513–1524 [DOI] [PubMed] [Google Scholar]
- Hayashi Y, Otsuka K, Ebina M, Igarashi K, Takehara A, Matsumoto M, Kanai A, Igarashi K, Soga T, Matsui Y (2017) Distinct requirements for energy metabolism in mouse primordial germ cells and their reprogramming to embryonic germ cells. Proc Natl Acad Sci USA 114: 8289–8294 [DOI] [PMC free article] [PubMed] [Google Scholar]
- Huang F, Sirinakis G, Allgeyer ES, Schroeder LK, Duim WC, Kromann EB, Phan T, Rivera‐Molina FE, Myers JR, Irnov I, Lessard M, Zhang Y, Handel MA, Jacobs‐Wagner C, Lusk CP, Rothman JE, Toomre D, Booth MJ, Bewersdorf J (2016) Ultra‐high resolution 3D imaging of whole cells. Cell 166: 1028–1040 [DOI] [PMC free article] [PubMed] [Google Scholar]
- Hwang IY, Kwak S, Lee S, Kim H, Lee SE, Kim JH, Kim YA, Jeon YK, Chung DH, Jin X, Park S, Jang H, Cho EJ, Youn HD (2016) Psat1‐dependent fluctuations in alpha‐ketoglutarate affect the timing of ESC differentiation. Cell Metab 24: 494–501 [DOI] [PubMed] [Google Scholar]
- Kaelin WG Jr (2011) Cancer and altered metabolism: potential importance of hypoxia‐inducible factor and 2‐oxoglutarate‐dependent dioxygenases. Cold Spring Harb Symp Quant Biol 76: 335–345 [DOI] [PMC free article] [PubMed] [Google Scholar]
- Kalkan T, Olova N, Roode M, Mulas C, Lee HJ, Nett I, Marks H, Walker R, Stunnenberg HG, Lilley KS, Nichols J, Reik W, Bertone P, Smith A (2017) Tracking the embryonic stem cell transition from ground state pluripotency. Development 144: 1221–1234 [DOI] [PMC free article] [PubMed] [Google Scholar]
- Kim D, Pertea G, Trapnell C, Pimentel H, Kelley R, Salzberg SL (2013) TopHat2: accurate alignment of transcriptomes in the presence of insertions, deletions and gene fusions. Genome Biol 14: R36 [DOI] [PMC free article] [PubMed] [Google Scholar]
- Klose RJ, Kallin EM, Zhang Y (2006) JmjC‐domain‐containing proteins and histone demethylation. Nat Rev Genet 7: 715–727 [DOI] [PubMed] [Google Scholar]
- Ko SY, Kang HY, Lee HS, Han SY, Hong SH (2006) Identification of Jmjd1a as a STAT3 downstream gene in mES cells. Cell Struct Funct 31: 53–62 [DOI] [PubMed] [Google Scholar]
- Kurimoto K, Yabuta Y, Hayashi K, Ohta H, Kiyonari H, Mitani T, Moritoki Y, Kohri K, Kimura H, Yamamoto T, Katou Y, Shirahige K, Saitou M (2015) Quantitative dynamics of chromatin remodeling during germ cell specification from mouse embryonic stem cells. Cell Stem Cell 16: 517–532 [DOI] [PubMed] [Google Scholar]
- Lawrence ND (2004) Gaussian process latent variable models for visualisation of high dimensional data. Adv Neural Inf Process Syst 16: 329–336 [Google Scholar]
- Li H, Handsaker B, Wysoker A, Fennell T, Ruan J, Homer N, Marth G, Abecasis G, Durbin R, Proc GPD (2009) The sequence alignment/map format and SAMtools. Bioinformatics 25: 2078–2079 [DOI] [PMC free article] [PubMed] [Google Scholar]
- Loh YH, Zhang WW, Chen X, George J, Ng HH (2007) Jmjd1a and Jmjd2c histone H3 Lys 9 demethylases regulate self‐renewal in embryonic stem cells. Gene Dev 21: 2545–2557 [DOI] [PMC free article] [PubMed] [Google Scholar]
- Loh KM, Ang LT, Zhang JY, Kumar V, Ang J, Auyeong JQ, Lee KL, Choo SH, Lim CYY, Nichane M, Tan JR, Noghabi MS, Azzola L, Ng ES, Durruthy‐Durruthy J, Sebastiano V, Poellinger L, Elefanty AG, Stanley EG, Chen QF et al (2014) Efficient endoderm induction from human pluripotent stem cells by logically directing signals controlling lineage bifurcations. Cell Stem Cell 14: 237–252 [DOI] [PMC free article] [PubMed] [Google Scholar]
- Losman JA, Kaelin WG (2013) What a difference a hydroxyl makes: mutant IDH, (R)‐2‐hydroxyglutarate, and cancer. Gene Dev 27: 836–852 [DOI] [PMC free article] [PubMed] [Google Scholar]
- Ma ZY, Swigut T, Valouev A, Rada‐Iglesias A, Wysocka J (2011) Sequence‐specific regulator Prdm14 safeguards mouse ESCs from entering extraembryonic endoderm fates. Nat Struct Mol Biol 18: 120–127 [DOI] [PubMed] [Google Scholar]
- Marson A, Levine SS, Cole MF, Frampton GM, Brambrink T, Johnstone S, Guenther MG, Johnston WK, Wernig M, Newman J, Calabrese JM, Dennis LM, Volkert TL, Gupta S, Love J, Hannett N, Sharp PA, Bartel DP, Jaenisch R, Young RA (2008) Connecting microRNA genes to the core transcriptional regulatory circuitry of embryonic stem cells. Cell 134: 521–533 [DOI] [PMC free article] [PubMed] [Google Scholar]
- Martin M (2011) Cutadapt removes adapter sequences from high‐throughput sequencing reads. EMBnet J 17: 10–12 [Google Scholar]
- Moussaieff A, Rouleau M, Kitsberg D, Cohen M, Levy G, Barasch D, Nemirovski A, Shen‐Orr S, Laevsky I, Amit M, Bomze D, Elena‐Herrmann B, Scherf T, Nissim‐Rafinia M, Kempa S, Itskovitz‐Eldor J, Meshorer E, Aberdam D, Nahmias Y (2015) Glycolysis‐mediated changes in acetyl‐CoA and histone acetylation control the early differentiation of embryonic stem cells. Cell Metab 21: 392–402 [DOI] [PubMed] [Google Scholar]
- Murakami K, Gunesdogan U, Zylicz JJ, Tang WWC, Sengupta R, Kobayashi T, Kim S, Butler R, Dietmann S, Surani MA (2016) NANOG alone induces germ cells in primed epiblast in vitro by activation of enhancers. Nature 529: 403–407 [DOI] [PMC free article] [PubMed] [Google Scholar]
- Ng HH, Surani MA (2011) The transcriptional and signalling networks of pluripotency. Nat Cell Biol 13: 490–496 [DOI] [PubMed] [Google Scholar]
- Nichols J, Jones K, Phillips JM, Newland SA, Roode M, Mansfield W, Smith A, Cooke A (2009) Validated germline‐competent embryonic stem cell lines from nonobese diabetic mice. Nat Med 15: 814–818 [DOI] [PubMed] [Google Scholar]
- Ohinata Y, Payer B, O'Carroll D, Ancelin K, Ono Y, Sano M, Barton SC, Obukhanych T, Nussenzweig M, Tarakhovsky A, Saitou M, Surani MA (2005) Blimp1 is a critical determinant of the germ cell lineage in mice. Nature 436: 207–213 [DOI] [PubMed] [Google Scholar]
- Ramskold D, Luo S, Wang YC, Li R, Deng Q, Faridani OR, Daniels GA, Khrebtukova I, Loring JF, Laurent LC, Schroth GP, Sandberg R (2012) Full‐length mRNA‐Seq from single‐cell levels of RNA and individual circulating tumor cells. Nat Biotechnol 30: 777–782 [DOI] [PMC free article] [PubMed] [Google Scholar]
- Reid JE, Wernisch L (2016) Pseudotime estimation: deconfounding single cell time series. Bioinformatics 32: 2973–2980 [DOI] [PMC free article] [PubMed] [Google Scholar]
- Roccio M, Schmitter D, Knobloch M, Okawa Y, Sage D, Lutolf MP (2013) Predicting stem cell fate changes by differential cell cycle progression patterns. Development 140: 459–470 [DOI] [PubMed] [Google Scholar]
- Saitou M, Payer B, Lange UC, Erhardt S, Barton SC, Surani MA (2003) Specification of germ cell fate in mice. Philos Trans R Soc Lond B Biol Sci 358: 1363–1370 [DOI] [PMC free article] [PubMed] [Google Scholar]
- Schmittgen TD, Livak KJ (2008) Analyzing real‐time PCR data by the comparative C‐T method. Nat Protoc 3: 1101–1108 [DOI] [PubMed] [Google Scholar]
- Seki Y, Hayashi K, Itoh K, Mizugaki M, Saitou M, Matsui Y (2005) Extensive and orderly reprogramming of genome‐wide chromatin modifications associated with specification and early development of germ cells in mice. Dev Biol 278: 440–458 [DOI] [PubMed] [Google Scholar]
- Shyh‐Chang N, Locasale JW, Lyssiotis CA, Zheng Y, Teo RY, Ratanasirintrawoot S, Zhang J, Onder T, Unternaehrer JJ, Zhu H, Asara JM, Daley GQ, Cantley LC (2013) Influence of threonine metabolism on S‐adenosylmethionine and histone methylation. Science 339: 222–226 [DOI] [PMC free article] [PubMed] [Google Scholar]
- Sone M, Morone N, Nakamura T, Tanaka A, Okita K, Woltjen K, Nakagawa M, Heuser JE, Yamada Y, Yamanaka S, Yamamoto T (2017) Hybrid cellular metabolism coordinated by Zic3 and Esrrb synergistically enhances induction of naive pluripotency. Cell Metab 25: 1103–1117 e6 [DOI] [PubMed] [Google Scholar]
- Sperber H, Mathieu J, Wang Y, Ferreccio A, Hesson J, Xu Z, Fischer KA, Devi A, Detraux D, Gu H, Battle SL, Showalter M, Valensisi C, Bielas JH, Ericson NG, Margaretha L, Robitaille AM, Margineantu D, Fiehn O, Hockenbery D et al (2015) The metabolome regulates the epigenetic landscape during naive‐to‐primed human embryonic stem cell transition. Nat Cell Biol 17: 1523–1535 [DOI] [PMC free article] [PubMed] [Google Scholar]
- Stacpoole PW (1989) The pharmacology of dichloroacetate. Metabolism 38: 1124–1144 [DOI] [PubMed] [Google Scholar]
- Surani MA, Hayashi K, Hajkova P (2007) Genetic and epigenetic regulators of pluripotency. Cell 128: 747–762 [DOI] [PubMed] [Google Scholar]
- TeSlaa T, Chaikovsky AC, Lipchina I, Escobar SL, Hochedlinger K, Huang J, Graeber TG, Braas D, Teitell MA (2016) alpha‐Ketoglutarate accelerates the initial differentiation of primed human pluripotent stem cells. Cell Metab 24: 485–493 [DOI] [PMC free article] [PubMed] [Google Scholar]
- Trapnell C, Pachter L, Salzberg SL (2009) TopHat: discovering splice junctions with RNA‐Seq. Bioinformatics 25: 1105–1111 [DOI] [PMC free article] [PubMed] [Google Scholar]
- Trapnell C, Cacchiarelli D, Grimsby J, Pokharel P, Li SQ, Morse M, Lennon NJ, Livak KJ, Mikkelsen TS, Rinn JL (2014) The dynamics and regulators of cell fate decisions are revealed by pseudotemporal ordering of single cells. Nat Biotechnol 32: 381–386 [DOI] [PMC free article] [PubMed] [Google Scholar]
- Whitehouse S, Cooper RH, Randle PJ (1974) Mechanism of activation of pyruvate‐dehydrogenase by dichloroacetate and other halogenated carboxylic‐acids. Biochem J 141: 761–774 [DOI] [PMC free article] [PubMed] [Google Scholar]
- Whyte WA, Orlando DA, Hnisz D, Abraham BJ, Lin CY, Kagey MH, Rahl PB, Lee TI, Young RA (2013) Master transcription factors and mediator establish super‐enhancers at key cell identity genes. Cell 153: 307–319 [DOI] [PMC free article] [PubMed] [Google Scholar]
- Wick AN, Drury DR, Nakada HI, Wolfe JB (1957) Localization of the primary metabolic block produced by 2‐deoxyglucose. J Biol Chem 224: 963–969 [PubMed] [Google Scholar]
- Wray J, Kalkan T, Gomez‐Lopez S, Eckardt D, Cook A, Kemler R, Smith A (2011) Inhibition of glycogen synthase kinase‐3 alleviates Tcf3 repression of the pluripotency network and increases embryonic stem cell resistance to differentiation. Nat Cell Biol 13: 838–845 [DOI] [PMC free article] [PubMed] [Google Scholar]
- Ying QL, Wray J, Nichols J, Batlle‐Morera L, Doble B, Woodgett J, Cohen P, Smith A (2008) The ground state of embryonic stem cell self‐renewal. Nature 453: 519–523 [DOI] [PMC free article] [PubMed] [Google Scholar]
- Young RA (2011) Control of the embryonic stem cell state. Cell 144: 940–954 [DOI] [PMC free article] [PubMed] [Google Scholar]
- Zhang J, Ratanasirintrawoot S, Chandrasekaran S, Wu Z, Ficarro SB, Yu C, Ross CA, Cacchiarelli D, Xia Q, Seligson M, Shinoda G, Xie W, Cahan P, Wang L, Ng SC, Tintara S, Trapnell C, Onder T, Loh YH, Mikkelsen T et al (2016) LIN28 regulates stem cell metabolism and conversion to primed pluripotency. Cell Stem Cell 19: 66–80 [DOI] [PubMed] [Google Scholar]
- Zhou W, Choi M, Margineantu D, Margaretha L, Hesson J, Cavanaugh C, Blau CA, Horwitz MS, Hockenbery D, Ware C, Ruohola‐Baker H (2012) HIF1alpha induced switch from bivalent to exclusively glycolytic metabolism during ESC‐to‐EpiSC/hESC transition. EMBO J 31: 2103–2116 [DOI] [PMC free article] [PubMed] [Google Scholar]
- Zhu GX, Conner SE, Zhou X, Shih C, Li TC, Anderson BD, Brooks HB, Campbell RM, Considine E, Dempsey JA, Faul MM, Ogg C, Patel B, Schultz RM, Spencer CD, Teicher B, Watkins SA (2003) Synthesis, structure‐activity relationship, and biological studies of indolocarbazoles as potent cyclin D1‐CDK4 inhibitors. J Med Chem 46: 2027–2030 [DOI] [PubMed] [Google Scholar]
- Zhu H, Shyh‐Chang N, Segre AV, Shinoda G, Shah SP, Einhorn WS, Takeuchi A, Engreitz JM, Hagan JP, Kharas MG, Urbach A, Thornton JE, Triboulet R, Gregory RI, DIAGRAM Consortium , MAGIC Investigators , Altshuler D, Daley GQ (2011) The Lin28/let‐7 axis regulates glucose metabolism. Cell 147: 81–94 [DOI] [PMC free article] [PubMed] [Google Scholar]
- Zylicz JJ, Dietmann S, Gunesdogan U, Hackett JA, Cougot D, Lee C, Surani MA (2015) Chromatin dynamics and the role of G9a in gene regulation and enhancer silencing during early mouse development. Elife 4: e09571 [DOI] [PMC free article] [PubMed] [Google Scholar]
Associated Data
This section collects any data citations, data availability statements, or supplementary materials included in this article.
Supplementary Materials
Appendix
Expanded View Figures PDF
Review Process File
Data Availability Statement
The single‐cell RNA‐seq data reported here have been deposited in GEO under accession number GSE107761.