

SUMMARY:
Internal N6-methyladenosine (m6A) modification is widespread in messenger RNAs (mRNAs) and catalyzed by heterodimers of methyltransferase-like protein 3 (Mettl3) and Mettl14. To understand the role of m6A in development, we deleted Mettl14 in embryonic neural stem cells (NSCs) in a mouse model. Phenotypically, NSCs lacking Mettl14 display markedly decreased proliferation and premature differentiation, suggesting m6A modification enhances NSC self-renewal. Decreased NSC pool led to decreased number of late-born neurons during cortical neurogenesis. Mechanistically, we discovered a genome- wide increase in specific histone modifications in Mettl14 knockout vs. control NSCs. These changes correlated with altered gene expression and observed cellular phenotypes, suggesting their functional significance. Finally, we showed that m6A regulates histone modification in part by destabilizing transcripts encoding histone-modifying enzymes. Our study demonstrated an essential role of m6A in development and revealed m6A-regulated histone modifications as a novel gene regulatory mechanism in mammalian cells.
Keywords: N6-methyladenosine, m6A, RNA methylation, neural stem cells, self-renewal, histone modifications, H3K27–3me, H3K27-acetylation, CBP/P300
INTRODUCTION
Post-transcriptional modification of mRNA has emerged as a key gene regulatory mechanism. Among internal mRNA modifications, m6A is by far the most abundant, tagging over 10,000 mRNAs and long non-coding RNAs1,2. It is a reversible modification, and both methyltranferases and demethylases have been reported. In 2014, we and others reported that methyltransferase-like protein 3 (Mettl3) and methyltransferase-like protein 14 (Mettl14) formed a heterodimer and served as core components of m6A methyltransferase3,4 Both Mettl3 and Mettl14 are required for m6A formation: within the heterodimer, Mettl3 is the enzymatic subunit and Mettl14 is required for RNA substrate recognition and maintenance of proper Mettl3 conformation5–7.
While the functional role of m6A in gene expression regulation has been studied extensively8, its importance in development at organismal levels remains largely unknown. Recently, two studies reported that children born with homozygous missense mutations in the FTO (Fat mass and obesity-associated protein) gene, which encodes a m6A demethylase9, display severe neurodevelopmental disorders, including microcephaly, functional brain deficits, and psychomotor delay, suggesting an essential, yet unexplored, role of m6A RNA modification in brain development10,11. To investigate potential m6A function in early neuronal development, we deleted Mettl14 in mouse embryonic neural stem cells, since self-renewing and multipotent NSCs give rise to the entire brain, and defects in NSC activities underlie various neurodevelopmental disorders12. In vitro, NSCs lacking Mettl14 displayed robust decreases in proliferation, accompanied by premature differentiation, suggesting that m6A is required for NSC self-renewal. In agreement, in vivo analysis in Mettl14-deficient embryos indicated that NSCs, also known as Radial Glial Cells (RGCs), in the ventricular zone (VZ) showed a decrease in number relative to those seen in control mice, and this reduction was accompanied by fewer late-born cortical neurons. Mechanistically, we observed a genome-wide increase in specific histone modifications in Mettl14 KO NSCs. Importantly, gene-by-gene analysis suggested that those changes were correlated with changes in gene expression and observed developmental phenotypes, suggesting m6A-regulated histone modification underlies altered NSC gene expression and activity. Finally, we present evidence that m6A regulation of histone modification alters stability of mRNAs encoding histone modifiers. Overall, our study, for the first time, reveals a key role for mRNA modification in NSCs and brain development.
RESULTS:
Mettl14 deficiency decreases NSC proliferation and promotes premature NSC differentiation in vitro
To assess Mettl14 loss of function in vivo, we generated Mettl14 conditional knockout mice (Mettl14f/f) by flanking Mettl14 exon 2 with loxP sites. Cre-mediated exon 2 excision results in out-of-frame mutation, hence abolishing Mettl14 function (Supplementary Figs. 1a,b). To assess whether the KO strategy deleted Mettl14 in vivo, we evaluated mice in which Mettl14 was deleted globally using Ella-cre transgenic mice, which express Cre at zygotic stages (Supplementary Figs. 1c,d). Mettl14+/− heterozygotes were viable and fertile and exhibited no discernible morphological or growth abnormalities, while no Mettl14−/− offspring were observed following crosses of Mettl14+/− mice (Supplementary Table 1). We then collected embryos resulting from crosses of heterozygotes at E7.5, E8.5, and E9.5 for genotyping. Mettl14−/− embryos were identified at Mendelian ratios when we combined genotyping results from all three stages (Supplementary Table 2). But most Mettl14−/− embryos were dead and many had regressed (Supplementary Fig. 1e), indicating that Mettl14 activity is required for early embryogenesis, a phenotype similar to that of global Mettl3 KO13. Of 7 Mettl14−/− embryos identified at either E7.5 or E8.5, four were male and three were female, suggesting that phenotypes were not gender-specific (Supplementary Fig. 1f).
We then assessed potential effects of Mettl14 deletion in NSCs. To do so, we crossed Mettll4f/f mice with a Nestin-Cre transgenic line to generate Mettl14f/f:Nestin-Cre (Mettl14 cKO) mice and littermate controls, including Mettl14f/+:Nestin-cre (heterozygous) and Mettl14f/f (non-deleted). Newborn pups were alive and showed no overt morphologic phenotypes (Supplementary Fig. 1g) and normal body weight (Supplementary Fig. 1h). However, all Mettl14 cKO mice were dead within the first neonatal week (Supplementary Fig. 1i). When we examined brains of postnatal day 0 (P0) Mettl14 cKO pups, we observed no anomalies in gross anatomy but their brains showed moderately reduced cortical length (Figs. 1a,b). H&E staining of coronal sections of P0 mouse brain revealed enlargement of the ventricle and a 23% decrease in cortical thickness in Mettl14 cKO brains relative to littermate Mettl14f/f controls (Figs. 1c,d). We next examined Mettl14 expression in RGCs by carrying out Mettl14 and Pax6 co-immunostaining on coronal sections of E17.5 brain from nondeleted, cKO, and heterozygous mice. Mettl14 was readily detectible in Pax6+ cells in cortex of nondeleted and heterozygous controls, but not in cKO mice (Fig. 1e). Together, these results suggest that Mettl14 is required for normal function of NSCs that serve as cortical progenitors.
Figure 1: Mettl14 regulates the size of mouse cerebral cortex.
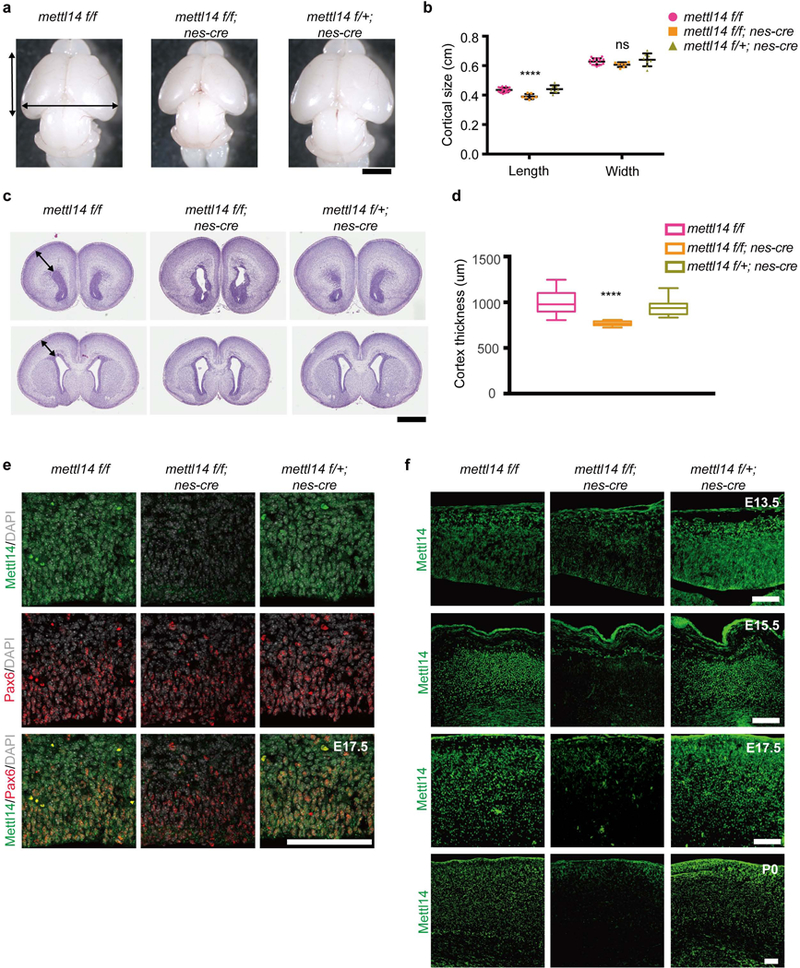
(a) Representative images of whole brains from Mettl14f/f (WT, left), Mettl14f/f;nes-cre (KO, middle) or Mettl14 f/+;nes-cre (Het, right) mice pups at postnatal day 0 (P0); black arrows indicate cortex length and width. Scale bar: 2 mm. (b) Quantification of cortical length and width at P0, one-way ANOVA (WT: n = 16, KO: n = 7, and Het: n = 8 P0 brains; Length, P = 2.559E-05, F (2, 28) = 15.79; Width, P = 0.0869, F (2, 28) = 2.669) followed by Bonferroni’s post hoc test (Length, WT vs. KO, P = 4.358E-05, 95% confidence interval (C.I.) = 0.02383 to 0.06534, WT vs. Het, P = 0.9999, 95% C.I. = −0.02521 to 0.01446; Width, WT vs. KO, P = 0.2141, 95% C.I. = −0.008986 to 0.05154, WT vs. Het, P = 0.6633, 95% C.I. = −0.04098 to 0.01686). (c) Representative images of coronal sections of P0 brains stained with hematoxylin/eosin (H&E); black arrows indicate cortical thickness. Section shown in upper panel is from the same brain as the one below but ~1800 anterior to it. Scale bar: 1 mm. (d)Quantification of H&E staining, one-way ANOVA (n = 26 brain sections for all experimental groups; P = 2.9E-14, F (2, 75) = 48.61) followed by Bonferroni’s post hoc test (WT vs. KO, P = 4.9E-14, 95% C.I. = 170.1 to 279.4, WT vs. Het, P = 0.0678, 95% C.I. = −3.027 to 106.2). (e) Coronal sections of E17.5 brains stained with antibodies against Mettl14 and Pax6. Similar results were obtained from three independent experiments. (f) Coronal sections of E13.5, E15.5, E17.5, and P0 brains stained with anti-Mettl14 antibody. Similar results were obtained from three independent experiments. Scale bars: 100 μM. Graphs represent the mean ± SD. Dots represent data from individual data points. The horizontal lines in the boxplots indicate medians; the box limits indicate first and third quantiles; and the vertical whisker lines indicate minimum and maximum values. ns = non-significant. **** P < 0.0001.
Next, we evaluated m6A function in isolated embryonic NSCs cultured in vitro. To determine embryonic stages appropriate to select Mettl14-deficient NSCs, we examined Mettl14 protein expression in coronal sections prepared from embryonic (E) day 13.5, E15.5, E17.5 and P0 brain from cKO, heterozygous and nondeleted control mice. Immunostaining revealed residual Mettl14 staining in cerebral cortex at E13.5 in Mettl14 cKO brain, while Mettl14 signals in cortex were absent from E15.5 onward (Fig. 1f). Heterozygous mice showed comparable Mettl14 signals to those of nondeleted control. Thus, for further analysis we chose E14.5 and E17.5 cortical NSCs and cultured them as neurospheres for 7 days before harvesting for analysis.
We observed comparable phenotypes in subsequent in vitro analysis of E14.5 and E17.5 NSCs. Thus, below we report results of experiments conducted in E14.5 NSCs, unless otherwise stated. Following confirmation of Mettl14 loss in KO NSCs by western blot (Supplementary Fig. 2a), we assessed m6A levels from E14.5 neurospheres. Thin-layer chromatography (TLC) analysis demonstrated an almost total loss of m6A in polyA RNA isolated from Mettl14 KO vs. nondeleted NSCs, while heterozygous cells displayed m6A levels comparable to those seen in non-deleted controls (Fig. 2a), suggesting the knockout system we generated is ideal to study m6A function in NSCs.
Figure 2: Mettl14 regulates self-renewal of cortical NSCs from E14.5 brain in neurosphere culture.
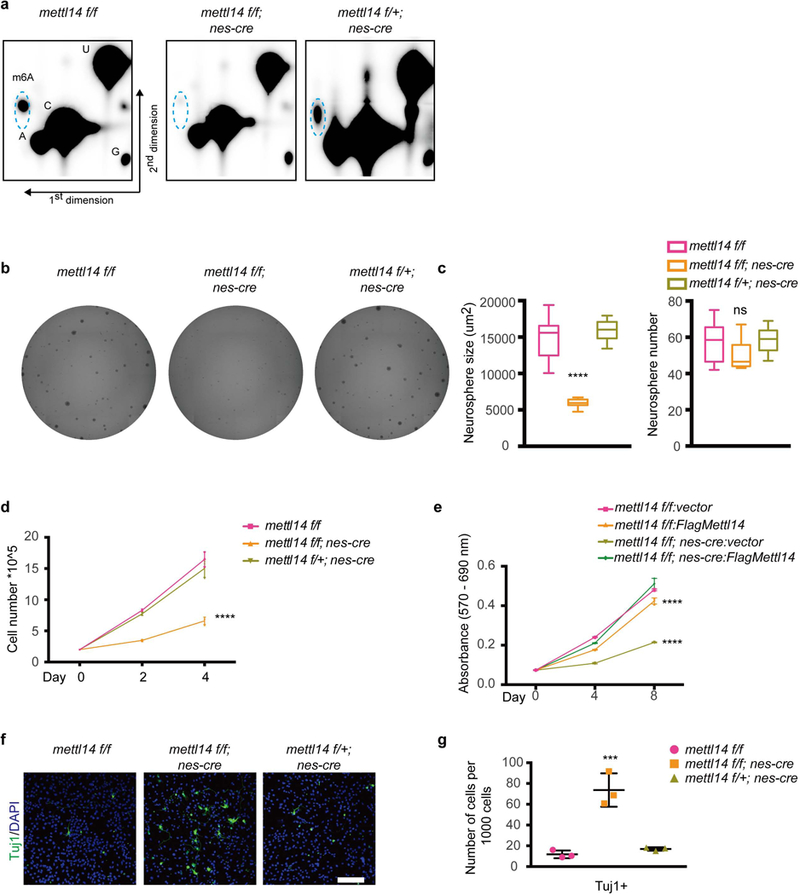
(a) Two dimensional thin-layer chromatography (2D-TLC) analysis of m6A levels in Ribosome- depleted (Ribo-) PolyA RNAs isolated from in E14.5 NSCs after 7 days of neurosphere culture. Dashed blue circles indicate m6A spots. Similar results were obtained from three independent experiments. (b) Representative images of neurospheres formed from isolated E14.5 NSCs. (c) Quantification of neurosphere number and area, one-way ANOVA (n = 12 cell cultures for all experimental groups; area, P = 9.15E-13, F (2, 33) = 80.21; number, P = 0.0313, F (2, 33) = 3.853) followed by Bonferroni’s post hoc test (area, WT vs. KO, P = 3.2475E-11, 95% C.I. = 6781 to 10737, WT vs. Het, P = 0.2855, 95% C.I. = −2999 to 663.1; number, WT vs. KO, P = 0.0724, 95% C.I. = −0.5596 to 15.39, WT vs. Het, P = 0.9999, 95% C.I. = −9.31 to 6.643). (d) NSC growth curve. NSCs were plated at 200,000/well in 6-well plates and counted 2 and 4 days later, two-way ANOVA (n = 3 cell cultures for all experimental groups; P = 8.644E-12, F (2, 18) = 143.6) followed by Bonferroni’s post hoc test (WT vs. KO, P = 1.2905E-11, 95% C.I. = 4.133 to 5.666, WT vs. Het, P = 0.091, 95% C.I. = −0.09277 to 1.44). (e) Growth curve of Mettl14 KO and nondeleted control NSCs transduced with indicated vectors. NSCs were plated in 96-well plates, and numbers determined by MTT assay, two-way ANOVA (n = 3 cell cultures for all experimental groups; P = 1.413E-20, F (3, 24) = 396.9) followed by Bonferroni’s post hoc test (WT-vector vs. WT-FlagMettl14, P = 1.162E-08, 95% C.I. = 0.02849 to 0.0514, WT-vector vs. KO-vector, P = 1.77094E-20, 95% C.I. = 0.1213 to 0.1442, WT-vector vs. KO-FlagMettl14, P = 0.9999, 95% C.I. = −0.01183 to 0.01107). (f) Immunostaining for anti-Tuj1 in NSCs cultured 7 days in vitro. Scale bar: 100 μM. (g) Quantification of immunostaining, one-way ANOVA (n = 3 fields for all experimental groups; P = 0.0004, F (2, 6) = 38.49) followed by Bonferroni’s post hoc test (WT vs. KO, P = 0.0004, 95% C.I. = −85.13 to −38.65, WT vs. Het, P = 0.9999, 95% C.I. = −28.37 to 18.11). Graphs represent the mean ± SD. Dots represent data from individual data points. The horizontal lines in the boxplots indicate medians; the box limits indicate first and third quantiles; and the vertical whisker lines indicate minimum and maximum values. ns = non-significant. *** P < 0.001, **** P < 0.0001.
To characterize KO vs. control NSCs, we used a Celigo image cytometer and software to image neurospheres and assess their number and size. Although Mettl14 KO, heterozygous, and nondeleted control NSCs derived from E14.5 embryos formed a similar number of neurospheres, neurosphere size, as reflected by neurosphere area in this system, decreased by ~55% in KO vs. nondeleted control cells, while neurosphere size from heterozygous cells were comparable to those seen in non-deleted controls (Figs. 2b,c). Consistently, those same Mettl14 KO NSCs exhibited significantly decreased proliferation based on cell counting analysis (Fig. 2d). Similar proliferation defects were detected in NSCs taken from E17.5 Mettl14 cKO mice (Supplementary Fig. 2b). Annexin V flow cytometry (Supplementary Figs. 2c,d) and TUNEL (Terminal deoxynucleotidyl transferase (TdT) dUTP Nick-End Labeling) analysis (Supplementary Fig. 2e) of E14.5 NSCs confirmed that effects were not due to increased apoptosis. To ensure that proliferation defects were due to Mettl14 deletion, we performed rescue experiments by overexpressing flag-tagged Mettl14 in E14.5 KO NSCs. Western and dot blot analysis confirmed Mettl14 transgene expression (Supplementary Fig. 2f) and restoration of m6A (Supplementary Fig. 2g). Importantly, Mettl14 overexpression did not increase proliferation of non-deleted NSC controls (Fig. 2e) but increased proliferation of Mettl14 KO NSCs to rates comparable to controls (Fig. 2e). These results suggest that Mettl14 and concomitant m6A RNA modification regulate NSC proliferation, at least in vitro.
It is well-established that decreased NSC proliferation is coupled with premature NSC differentiation14. Therefore, we checked for the presence of cells positive for the neuronal marker Tuj1 in E14.5 NSCs cultured for 7 days as neurospheres. Immunostaining analysis revealed a 6.2-fold increase in the number of Tuj1+ cells in KO vs. control NSCs (Figs. 2f,g), while number of Tuj1+ cells was comparable between heterozygous and nondeleted controls, suggesting that Mettl14 loss leads to premature neuronal differentiation. Together, these results suggest Mettl14 regulates NSC self-renewal.
To determine whether loss of an m6A demethylase would have the opposite effect on NSC proliferation, we knocked down two reported m6A demethylases, Fto and Alkbh59,15 separately in wildtype NSCs. RT-qPCR analysis showed high knockdown efficiency in each case, and western blots revealed a marked decrease in Fto and Alkbh5 protein levels in respective knockdown cells (Supplementary Figs. 2h,i,k,l). Nonetheless, NSC proliferation in vitro was not altered by loss of either protein (Supplementary Figs. 2j,m). Some reports suggest that changes in expression of either Fto or Alkbh5 have only moderate effects on m6A levels and that both factors likely regulate m6A modification of a subset of transcripts 15–17 Our results suggest that mRNAs that function in NSC proliferation are not regulated by either FTO- or Alkbh5.
The size of the cortical RGC pool is reduced in Mettl14 cKO mouse brain
We next examined the effect of Mettl14 on proliferation of primary cortical stem cells or RGCs in vivo. To do so, we determined the number of S-phase cells in cortex of E13.5, E15.5 or E17.5 Mettl14 cKO, heterozygous, and nondeleted control embryos by injecting pregnant females with BrdU (Bromodeoxyuridine) and harvesting embryos 0.5 h later, enabling us to detect only cells undergoing DNA replication at that time point. Immunostaining showed that the number of BrdU+ cells decreased by 19% in at E15.5 Mettl14 cKO vs. nondeleted control brain (Supplementary Figs. 3a,d), and that number was reduced to 40% when analysis was conducted at E17.5 (Figs. 3a,d). Similarly, we also observed a 44% and 45% decrease in the number of cells expressing the mitotic marker phospho-histone H3 (PH3) at the apical membrane of the cortical VZ in cKO vs. noncdeleted control brain at E15.5 and E17.5, respectively (Supplementary Figs. 3b,d and Figs. 3b,d). To determine RGC number, we assessed brain coronal sections at all three stages with the RGC marker Pax6. Consistently, we detected a 45% decrease in the number of Pax6+ RGCs in the VZ of E17.5 Mettl14 cKO brain vs. controls (Figs. 3c,d) and a 14% decrease at E15.5 (Supplementary Figs. 3c,d). All experiments showed highly comparable results between heterozygous and nondeleted control RGCs (Figs. 3a-d and Supplementary Figs. 3a-d). We did not detect differences in BrdU, PH3, or Pax6 staining relative to nondeleted controls in the cortex of E13.5 Mettl14 cKO brains (Supplementary Figs. 3e-g), in accord with the finding that residual Mettl14 is present in cortex at E13.5 (Fig. 1f). Immunostaining with the apoptosis marker cleaved-caspase3 indicated no change in the number of apoptotic cells in the cortex of E17.5 and E15.5 Mettl14 cKO brains relative to nondeleted controls (Supplementary Figs. 3h,i). To understand how Mettl14 loss might affect RGC proliferation, we examined cell cycle progression and cell cycle exit of RGCs from brains of E15.5 and E17.5 Mettl14 cKO vs control mice. Sequential IdU (5-Iodo-2’-deoxyuridine) and BrdU injection was performed to evaluate cell cycle progression, followed by IdU/BrdU double-staining of cortical sections18. We then determined the percentage of IdU+/BrdU- cells, which represent cells that have progressed past S-phase, versus all IdU+ cells, a group that includes both proliferating cells and cells that have left S-phase. We detected a 38% and 43% decrease in respective E15.5 and E17.5 Mettl14 cKO embryos compared to the nondeleted control, suggesting that Mettl14 loss disrupts normal RGC cell cycle progression (Figs. 3e-g). Heterozygous and nondeleted control RGCs showed results comparable to each other (Figs. 3e-g). To determine whether Mettl14 loss alters cell cycle exit, we performed BrdU-Ki67 double-staining of cortical sections from brains of mice pulsed with BrdU and analyzed 24 hrs later. Mettl14 loss resulted in a 50% and 39% decrease in cells exiting the cell cycle from respective E15.7 and E17.5 Mettl14 cKO embryos versus nondeleted controls, suggesting that Mettl14 is required for normal RGC cell cycle exit (Figs. 3h-j). Heterozygous and nondeleted control RGCs showed results comparable to each other (Figs. 3h-j). Together, these data strongly suggest that Mettl14 regulates the RGC cell cycle and that the RGC pool in cortex is significantly reduced in Mettl14 cKO mice.
Figure 3: Mettl14 deficiency decreases RGC proliferation in vivo.
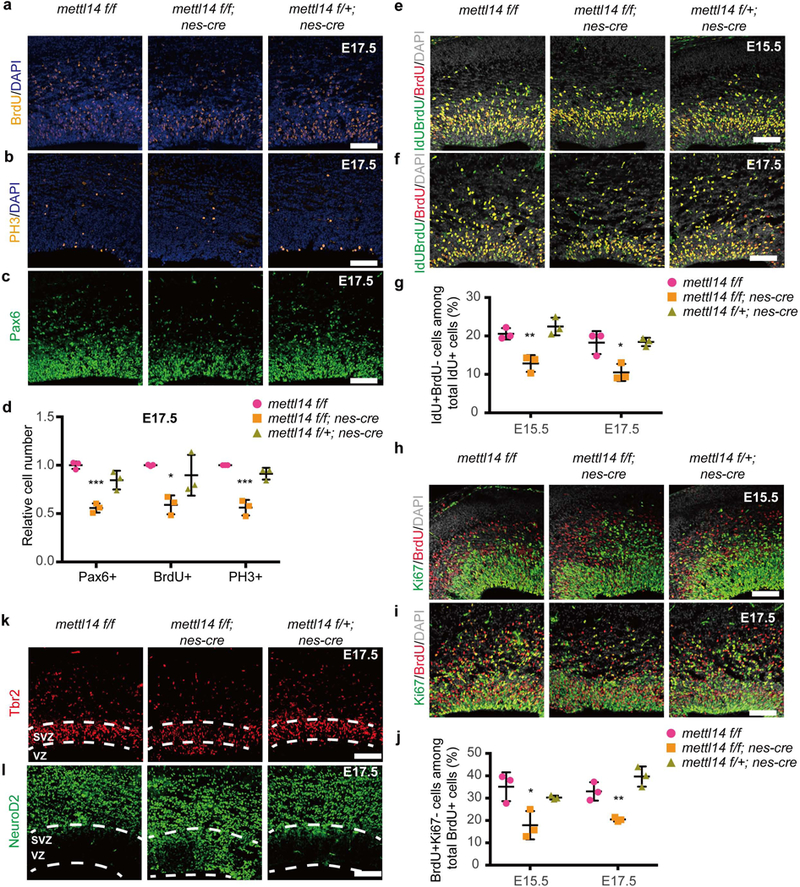
(a-c) Coronal sections of E17.5 brains stained with antibodies recognizing BrdU, PH3, and PAX6. Pregnant mothers received a BrdU pulse 30 min prior to embryo collection. (d) Quantification of immunostaining from E17.5 sections. Numbers of Pax6+, BrdU+ and PH3+ cells were determined and normalized to comparable sections from nondeleted mice, one-way ANOVA (n = 3 brain sections for all experimental groups; Pax6+, P = 0.0005, F (2, 6) = 34.41; BrdU+, P = 0.0231, F (2, 6) = 7.531; PH3+, P = 0.0002, F (2, 6) = 47.73) followed by Bonferroni’spost hoc test (Pax6+, WT vs. KO, P = 0.0004, 95% C.I. = 0.2814 to 0.6025, WT vs. Het, P = 0.0584, 95% C.I. = −0.006443 to 0.3146; BrdU+, WT vs. KO, P = 0.0194, 95% C.I. = 0.08378 to 0.7348, WT vs. Het, P = 0.7612, 95% C.I. = −0.2218 to 0.4292; PH3+, WT vs. KO, P = 0.0002, 95% C.I. = 0.2976 to 0.5796, WT vs. Het, P = 0.2287, 95% C.I. = −0.05332 to 0.2288). (e,f) Coronal sections of E15.5 (E) and E17.5 (F) brains stained with both anti-BrdU antibody that recognize BrdU only and anti-IdU antibody that also recognize BrdU. Pregnant mothers received one IdU injection, followed by one BrdU injection 1.5 hr later. After another 0.5 hr, the embryonic brains were collected for analysis. (g) Quantification of the percentage of IdU+BrdU- cells, representing cells left S phase during the 1.5 hr chase, among total IdU+ cells. One-way ANOVA (n = 3 brain sections for all experimental groups; E15.5, P = 0.0025, F (2, 6) = 19.21; E17.5, P = 0.0075, F (2, 6) = 12.35) followed by Bonferroni’s post hoc test (E15.5, WT vs. KO, P = 0.0067, 95% C.I. = 2.835 to 12.6, WT vs. Het, P = 0.5802, 95% C.I. = −6.787 to 2.973; E17.5, WT vs. KO, P = 0.0107, 95% C.I. = 2.347 to 13.19, WT vs. Het, P = 0.9999, 95% C.I. = −5.598 to 5.244). (h,i) Coronal sections of E15.5 (H) and E17.5 (I) brains stained with antibodies recognizing Ki67 and BrdU. Pregnant mothers received one BrdU injection 24 hour prior to embryo collection. (j) Quantification of the percentage of BrdU+Ki67- cells, representing cells exited cell cycle during 24 hour, among total BrdU+ cells. One-way ANOVA (n = 3 brain sections for all experimental groups; E15.5, P = 0.0173, F (2, 6) = 8.589; E17.5, P = 0.0016, F (2, 6) = 22.51) followed by Bonferroni’s post hoc test (E15.5, WT vs. KO, P = 0.014, 95% C.I. = 4.493 to 29.92, WT vs. Het, P = 0.6051, 95% C.I. = −7.885 to 17.54; E17.5, WT vs. KO, P = 0.01, 95% C.I. = 3.932 to 21.2, WT vs. Het, P = 0.1249, 95% C.I. = −15.28 to 1.99). (k,l) Immunostaining of coronal sections of E17.5 brain with antibodies to the intermediate progenitor marker anti-Tbr2 and the proneural marker anti-Neurod2. Dashed white lines indicate border of VZ/SVZ area. Similar results were obtained from three independent experiments. Scale bars: 100 μM. Graphs represent the mean ± SD. Dots represent data from individual data points. ns = non-significant. * P < 0.05, ** P < 0.01, *** P < 0.001.
We then examined RGC premature differentiation in the cortical VZ of E15.5 and E17.5 Mettl14 cKO brains using Eomes (Tbr2), a marker of intermediate progenitor cells located at sub-ventricular zone (SVZ), and the proneural marker Neurod2 (ND2). Notably, patches of ND2+ and Tbr2+ cells were seen consistently at E15.5 and E17.5 in areas close to the apical surface of cortical VZ of Mettl14 cKO brain but were absent in comparably-staged littermate controls (Supplementary Figs. 3j,k and Figs. 3k,l). Together, these data suggest that Mettl14 is required to prevent NSC premature differentiation and maintain NSC pool in vivo.
Mettl14 deletion results in reduced numbers of late-born neurons.
We next evaluated effects of Mettl14 loss on cortical neurogenesis. In P0 mice, neurons differentiated from RGCs are found in six distinct cortical layers containing neuronal subtypes identifiable by specific markers. Thus we stained coronal sections from cKO and comparably- staged littermate controls at P0 with the following markers: Cux1, expressed in late-born neurons and a marker of upper neuronal layers II-IV; Sox5, expressed in early-born neurons and a marker of layer V; and Tbr1, expressed in post-mitotic neurons and a marker of layer VI to the subplate. Overall, layer organization was comparable in cKO and control mice. When we assessed layer thickness, thickness of layers marked by Sox5 and Tbr1 did not differ significantly between genotypes (Figs. 4a,b). However, we observed a 70% decrease in thickness of Cux1-positive layers (II-IV) (Figs. 4a,b). To confirm loss of neurons from these layers, we stained sections from P0 embryos with a different layer II-IV marker, Satb2 and observed an ~34% decrease in the number of Satb2-positive neurons in cKO vs. littermate controls (Figs. 4c,d). When we examined cortical Cux1 staining at E17.5, we detected a 22% reduction in thickness of Cux1+ layers and a 50% reduction in the number of newly generated Cux1+ cells residing between a region lies between the VZ and layer IV in Mettl14 cKO vs. controls (Figs. 4e,f). These results suggest that Mettl14 loss may deplete the progenitor pool in a way reflected by loss of late-born neurons.
Figure 4: Mettl14 deficiency decreases number of late-born neurons.
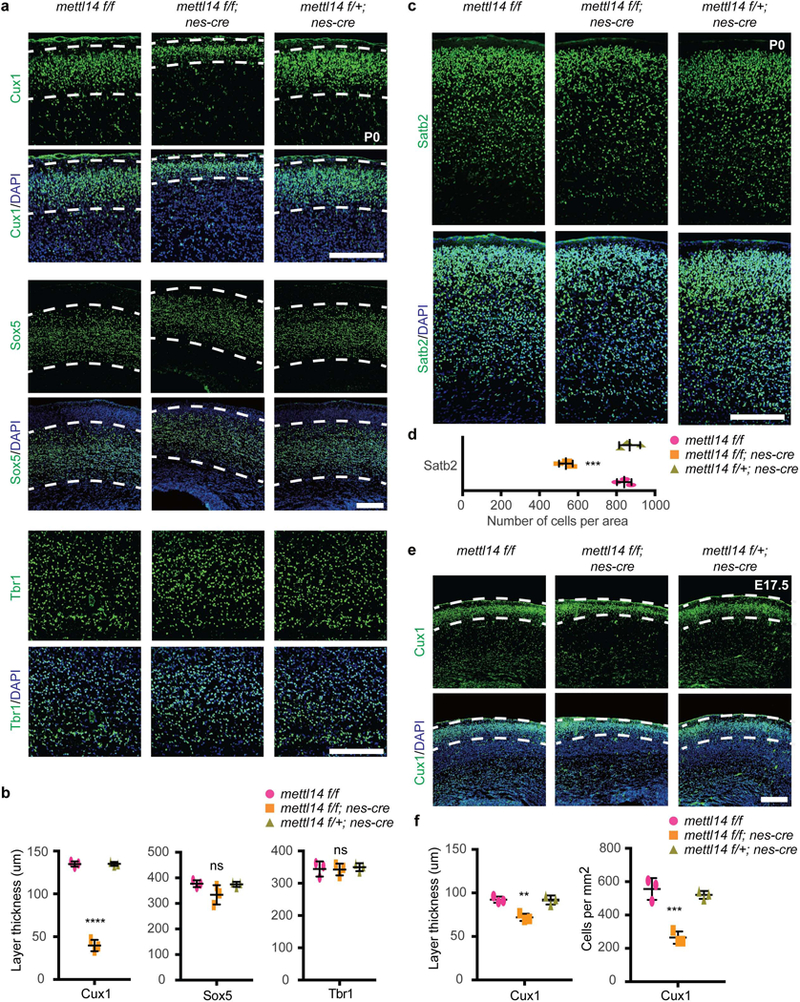
(a) Coronal sections of P0 brains stained with the layer II-IV marker Cux1, the layer V marker Sox5, and the layer VI/subplate (SP) marker Tbr1. Dashed white lines mark borders of Cux1+ and Sox5+ neuronal layers. (b) Quantification of thickness of Cux1+, Sox5+, or Tbr1+ neuronal layers, one-way ANOVA (n = 3 brain sections for all experimental groups; Cux1+, P = 2.689E-07, F (2, 6) = 461.8; Sox5+, P = 0.115, F (2, 6) = 3.169; Tbr1+, P = 0.8865, F (2, 6) = 0.1229) followed by Bonferroni’spost hoc test (Cux1+, WT vs. KO, P = 4E-07, 95% C.I. = 84.39 to 105.9, WT vs. Het, P = 0.9999, 95% C.I. = −10.97 to 10.52; Sox5+, WT vs. KO, P = 0.1329, 95% C.I. = −14.18 to 101.2, WT vs. Het, P = 0.9999, 95% C.I. = −55.32 to 60.06; Tbr1+, WT vs. KO, P = 0.9999, 95% C.I. = −43.31 to 46.59, WT vs. Het, P = 0.9999, 95% C.I. = −50.47 to 39.42). (c) Coronal sections of P0 brains stained with the layer II-IV marker Satb2. (d) Quantification of number of Satb2+ cells, one-way ANOVA (n = 3 brain sections for all experimental groups; P = 0.00015, F (2, 6) = 53.83) followed by Bonferroni’s post hoc test (WT vs. KO, P = 0.0003, 95% C.I. = 198.2 to 408.5, WT vs. Het, P = 0.9186, 95% C.I. = −133.1 to 77.14). (e) Coronal sections of E17.5 brains stained with Cux1; dashed white lines mark border of Cux1+ neuronal layer. (f) Quantification of Cux1+ layer thickness within dashed white lines and of the average number of newly generated Cux1+ cells within 1 mm2, as measured from the VZ to the lower dashed white lines, at E17.5. One-way ANOVA (n = 3 brain sections for all experimental groups; thickness, P = 0.0019, F (2, 6) = 21.36; number, P = 0.0004, F (2, 6) = 36.75) followed by Bonferroni’s post hoc test (thickness, WT vs. KO, P = 0.0025, 95% C.I. = 9.765 to 30.85, WT vs. Het, P = 0.9999, 95% C.I. = −10.13 to 10.96; number, WT vs. KO, P = 0.0004, 95% C.I. = 181.5 to 401.9, WT vs. Het, P = 0.7499, 95% C.I. = −74.64 to 145.8). Scale bars: 200 μM. Graphs represent the mean ± SD. Dots represent data from individual data points. ns = non-significant. ** P < 0.01, *** P < 0.001, **** P < 0.0001.
Mettl14 deficiency leads to genome-wide changes in histone modification that perturb gene expression
To assess molecular mechanisms underlying m6A-regulated NSC activity, we cultured NSCs from E14.5 Mettl14 cKO, heterozygous, and nondeleted control embryos for 7 days and performed RNA-seq. Mettl14 KO NSCs exhibited distinct gene expression profiles relative to non-deleted and heterozygous controls (which showed comparable profiles) (Fig. 5a, Supplementary Table 3). Gene Ontology analysis (GO) suggested that the most significantly upregulated genes function in NSC differentiation, while downregulated genes are associated with cell proliferation (Figs. 5b,c), changes reflective of observed phenotypes. We then evaluated potential mechanisms underlying these changes in gene expression. It is well-established that m6A destabilizes transcripts4,13,19,20. However, we only detected a weak correlation between m6A loss and changes in transcript abundance (Supplementary Fig. 4a, Supplementary Table 3 and Supplementary Table 4), suggesting that different m6A-related mechanisms modulate mRNA levels. Given that modification of histone tails is a critical gene regulatory mechanism in mammalian cells21, we asked whether m6A RNA modification may also change histone modifications by performing western blots on acid-extracted histones from KO vs. control NSCs isolated at both E14.5 and E17.5. For that analysis, we evaluated a panel of well-studied histone modifications reported to regulate stem cell activities, including histone H3 phosphorylation, histone H2A and H2B ubiquitination, 3 types of histone acetylation, and 4 types of histone methylation22–33. These histone marks are associated with either gene activation or repression. Representative western blots on E14.5 NSC were shown in Fig. 5d and we quantified western blots from E14.5 and E17.5 by calculating ratios of respective histone modifications to total H3 protein in KO, heterozygous, and nondeleted control NSCs. While we observed no significant change in any histone modification tested between heterozygous and nondeleted control samples (Figs. 5d,e), we detected a significant increase in histone H3 lysine 27 acetylation (H3K27-ac) (111% increase), lysine 4 trimethylation (H3K4–3me) (43% increase), and lysine 27 trimethylation (H3K27–3me) (71% increase) in Mettl14 KO NSCs vs. nondeleted controls (Figs. 5d,e). These results suggest that m6A regulates specific histone modifications.
Figure 5: m6A regulates NSC gene expression through histone modifications.
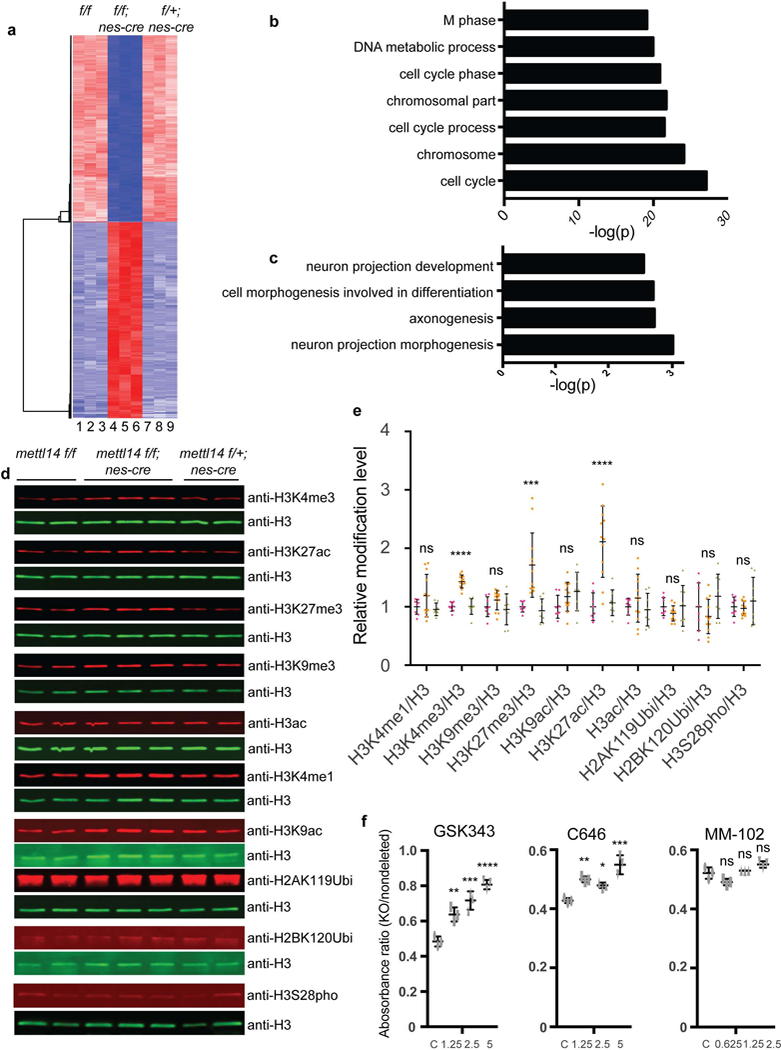
(a) Heat map analysis based on RNA-seq analysis in Mettl14 KO vs. nondeleted control NSCs. (b,c) Gene ontology (GO) analysis of genes down- and up-regulated in Mettl14 KO vs. nondeleted control E14.5 NSCs. GO analysis were performed by DAVID. Differentially expressed genes had an adjusted P < 0.01 and a 2-fold or greater expression difference. Among differentially expressed genes, 1099 are up-regulated and 1487 are down -regulated. Numbers of gene counts and exact P values for each GO term are listed in Supplementary Fig. 4a. (e) Representative western blots of acid-extracted histones from E14.5 NSCs using antibodies recognizing H3K4–1me, H3K4–3me, H3K27–3me, H3K9–3me, H3K27-ac, H3K9-ac, pan-acetyl- H3, uH2AK119, uH2BK120, and H3S28 phosphorylation. The band sizes range from 17 to 23 KD as expected for modified histones. For uncropped images, see Supplementary Fig. 6a. (f) Quantitation of western blots from E14.5 and E17.5 NSCs, one-way ANOVA (WT: n = 8, KO: n = 12, and Het: n = 8 independent NSCs cultures; H3K4me1, P = 0.1123, F (2, 25) = 2.39; H3K4me3, P = 1.06442E-09, F (2, 25) = 52.77; H3K9me3, P = 0.2096, F (2, 25) = 1.664; H3K27me3, P = 0.00013, F (2, 25) = 13.07; H3K9ac, P = 0.1461, F (2, 25) = 2.08; H3K27ac, P = 4.796E-06, F (2, 25) = 20.8; H3ac, P = 0.3676, F (2, 25) = 1.042; H2AK119Ubi, P = 0.3592, F (2, 25) = 1.067; H2BK120Ubi, P = 0.1192, F (2, 25) = 2.319; H3S28pho, P = 0.5347, F (2, 25) = 0.642) followed by Bonferroni’ spost hoc test (H3K4me1, WT vs. KO, P = 0.2376, 95% C.I. = - 0.4713 to 0.09065, WT vs. Het, P = 0.9999, 95% C.I. = −0.2629 to 0.3527; H3K4me3, WT vs. KO, P = 1.157E-08, 95% C.I. = −0.5518 to −0.3128, WT vs. Het, P = 0.9999, 95% C.I. = −0.134 to 0.1278; H3K9me3, WT vs. KO, P = 0.4574, 95% C.I. = −0.3314 to 0.1054, WT vs. Het, P = 0.9999, 95% C.I. = −0.1942 to 0.2842; H3K27me3, WT vs. KO, P = 0.0008, 95% C.I. = −1.131 to −0.2956, WT vs. Het, P = 0.9999, 95% C.I. = −0.3891 to 0.5256; H3K9ac, WT vs. KO, P = 0.321, 95% C.I. = −0.4577 to 0.1121, WT vs. Het, P = 0.1141, 95% C.I. = −0.5732 to 0.05098; H3K27ac, WT vs. KO, P = 1.769E-05, 95% C.I. = −1.591 to −0.6358, WT vs. Het, P = 0.9999, 95% C.I. = −0.5908 to 0.4556; H3ac, WT vs. KO, P = 0.6463, 95% C.I. = −0.4945 to 0.2007, WT vs. Het, P = 0.9999, 95% C.I. = −0.3309 to 0.4307; H2AK119Ubi, WT vs. KO, P = 0. 5288, 95% C.I. = −0.1242 to 0.3523, WT vs. Het, P = 0.9999, 95% C.I. = −0.2759 to 0.2459; H2BK120Ubi, WT vs. KO, P = 0.6171, 95% C.I. = −0.2165 to 0.5511, WT vs. Het, P = 0.6457, 95% C.I. = - 0.5982 to 0.2426; H3S28pho, WT vs. KO, P = 0.9999, 95% C.I. = −0.2407 to 0.2961, WT vs. Het, P = 0.8731, 95% C.I. = −0.3915 to 0.1965). (f) Cell growth analysis based on an MTT assay of NSCs treated with vehicle/DMSO or the MLL1 inhibitor MM-102, the CBP/P300 inhibitor C646, or the Ezh2 inhibitor GSK343. Shown is the absorbance ratio of KO to non-deleted controls at each drug dose. One-way ANOVA (n = 3 independent experiments for all experimental groups; GSK343, P = 4.232E-05, F (3, 8) = 38.47; C646, P = 0.0003, F (3, 8) = 23.43; MM-102, P = 0.0025, F (3, 8) = 11.91) followed by Bonferroni’s post hoc test (GSK343, c vs. 1.25, P = 0.0035, 95% C.I. = −0.2477 to −0.05943, c vs. 2.5, P = 0.0002, 95% C.I. = −0.3265 to −0.1383, c vs. 5, P = 1.979E-05, 95% C.I. = −0.4169 to - 0.2287; C646, c vs. 1.25, P = 0.0036, 95% C.I. = −0.1158 to −0.02744, c vs. 2.5, P = 0.0236, 95% C.I. = −0.09574 to −0.007344, c vs. 5, P = 0.000103, 95% C.I. = −0.1654 to −0.07702; MM-102, c vs. 0.0625, P = 0.0507, 95% C.I. = −8.591E-05 to 0.06086, c vs. 1.25, P = 0.9999, 95% C.I. = - 0.03858 to 0.02237, c vs. 2.5, P = 0.0615, 95% C.I. = −0.05958 to 0.001368). Graphs represent the mean ± SD. Dots represent data from individual data points. ns = nonsignificant. * P < 0.05, ** P < 0.01, *** P < 0.001, **** P < 0.0001.
To determine whether these changes alter NSC proliferation, we searched for chemical inhibitors antagonize activities associated with upregulated histone modifications to determine whether inhibitor treatment of E14.5 KO NSCs would rescue cell proliferation defects. Three inhibitors were commercially available; they include MM102, which inhibits MLL (Mixed- Lineage Leukemia) function and H3K4–3me formation; C646, which inhibits the H3K27 acetyltransferase Crebbp (CBP)/p300 activity; and GSK343, which inhibits Ezh2-dependent H3K27–3me formation. We then seeded comparable numbers of NSCs of all three genotypes, added inhibitor or DMSO vehicle at day 0, and determined cell number based on MTT assays 4 days later. Following DMSO treatment, the number of KO NSCs was ~50% that of non-deleted controls, reflecting slower proliferation, as anticipated (Fig. 5f). GSK343 treatment at 1.25, 2.5, and 5nM increased ratios of KO to non-deleted control NSCs to 64%, 71%, and 80%, respectively (Fig. 5f), while percentages of heterozygous to non-deleted control NSCs were unchanged by GSK343 treatment (Supplementary Fig. 4b). These observations suggest that blocking formation of H3K27–3me rescues growth defects of KO NSCs. Increased ratios of KO vs nondeleted control NSCs were also seen following C646 treatment (Fig. 5f and Supplementary Fig. 4b), suggesting that blocking H3K27-ac also blocks proliferation defects of KO NSCs. By contrast, treatment of E14.5 NSCs with MM102 had no effect (Fig. 5f and Supplementary Fig. 4b). These results overall suggest that m6A regulates NSC proliferation, at least in part, through H3K27–3me and H3K27-ac modifications.
H3K27–3me marks gene promoters and is associated with silencing34,35, while H3K27-ac, which is enriched at promoters and enhancers, is associated with gene activation36,37. Thus, we asked whether increased promoter H3K27–3me was associated with gene down-regulation, while increased promoter/enhancer H3K27-ac was associated with gene up-regulation in E14.5 Mettl14 KO vs. control NSCs. To do so, we performed H3K27–3me and H3K27-ac ChlP-seq analysis on E14.5 KO vs. nondeleted NSCs (Supplementary Tables 5 and Supplementary Tables 6) and correlated changes in gene expression with altered histone modification. In total, the intensity of 1610 promoter/enhancer H3K27-ac peaks, defined as peaks within a 10 Kb region up- or downstream of a transcriptional start site (TSS), was significantly altered in KO vs. control cells. Pearson correlation analysis showed a positive correlation between changes in peak intensity and changes in gene expression (r=0.06195, p=0.01292) in KO vs. control NSCs, suggesting H3K27- ac functions in m6A-regulated gene activation. We also detected 434 altered H3K27–3me promoter peaks, defined as peaks within 2Kb upstream of a TSS, in KO vs. control NSCs. Although in this case we did not detect a significant correlation between changes in peak intensity and gene expression (p=0.05784) using all 434 genes, we detected a strongly negative Pearson correlation (r=−0.38804, p<0.02) when we analyzed only downregulated genes (log2 fold change < −0.6) in KO vs. control NSCs, suggesting among genes showing decreased expression, H3K27–3me levels are positively correlated to their repression.
To further assess the relevance of altered H2K27ac and H3K27–3me modifications to NSC gene expression, we asked whether altered transcript abundance seen in KO vs. control NSCs could be rescued by treating cells with inhibitors of H2K27ac (C646) or of H3K27–3me (GSK343). By overlaying ChlP-seq and RNA-seq data and coupling that to IPA (Ingenuity Pathway Analysis), we picked 5 differentiation-related genes showing increased H3K27-ac and increased expression and 5 cell-proliferation related genes showing increased H3K27–3me but decreased expression for rescue experiment. Indeed, C646 treatment resulted in significantly decreased expression of the neuritogenesis regulators Kif26a38, Gas739, and Pdgfrb40, in KO NSCs when compared to nondeleted NSCs (Figs. 6a-c), while GSK343 treatment increased expression of Egr2 and Egr3 transcription factors known to promote proliferation41 (Figs. 6d-f). These results suggest that m6A-regulated histone modification functions in NSC gene expression.
Figure 6: H3K27-ac inhibitor C646 and H3K27-me3 inhibitor GSK343 rescue aberrant gene expression in KO vs. nondeleted NSCs.
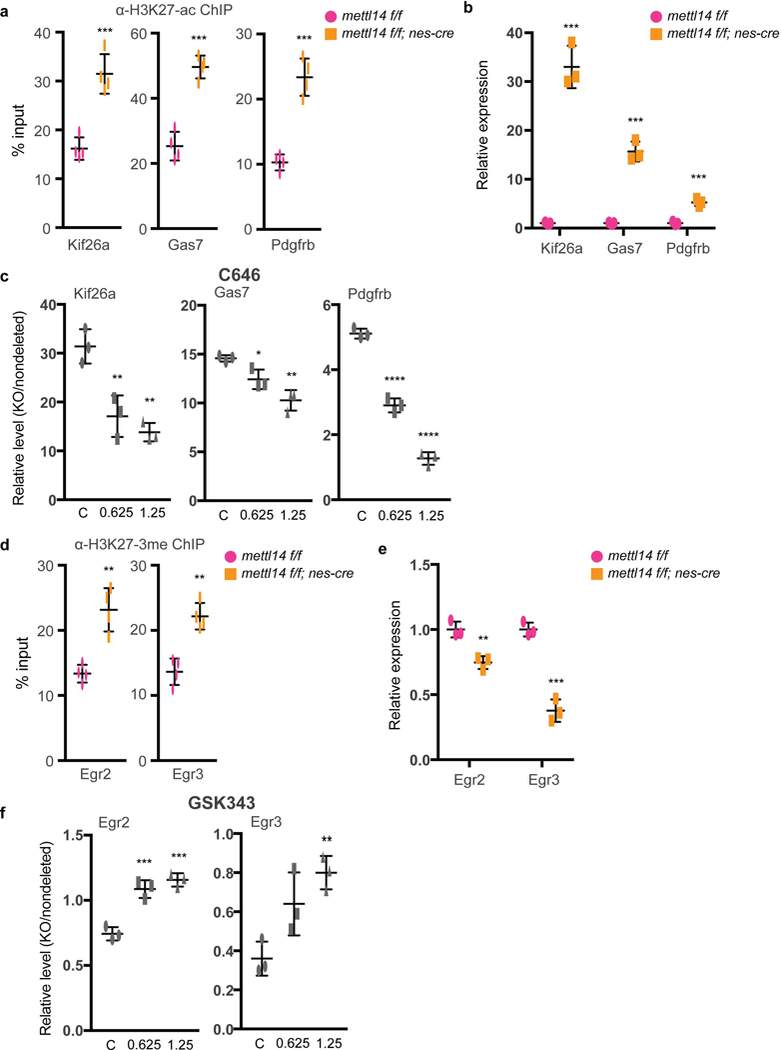
(a) H3K27ac ChIP-qPCR showing increased promoter / enhancer H3K27ac of Kif26a, Gas7, and Pdgfrb genes in E14.5 Mettl14 KO vs. nondeleted NSCs. n = 4 independent experiments for all experimental groups, two-tailed unpaired t-test (Kif26a, P = 0.0006, t = 6.568, df = 6, 95% C.I. = 9.594 to 20.99; Gas7, P = 0.00013, t = 8.638, df = 6, 95% C.I. = 17.41 to 31.16; Pdgfrb, P = 0.0002, t = 8.395, df = 6, 95% C.I. = 9.27 to 16.9). (b) RT-qPCR showing increased expression of Kif26a, Gas7, and Pdgfrb genes in E14.5 Mettl14 KO vs. nondeleted NSCs. n = 3 independent experiments for all experimental groups, two-tailed unpaired t-test (Kif26a, P = 0.0002, t = 12.71, df = 4, 95% C.I. = 25.01 to 38.99; Gas7, P = 0.0002, t = 12.46, df = 4, 95% C.I. = 11.41 to 17.95; Pdgfrb, P = 0.0008, t = 9.08, df = 4, 95% C.I. = 2.957 to 5.563). (c) RT-qPCR showing decreased expression of Kif26a, Gas7, and Pdgfrb genes in E14.5 Mettl14 KO vs. nondeleted NSCs treated with H3K27ac inhibitor C646. One-way ANOVA (n = 3 independent experiments for all experimental groups; Kif26a, P = 0.0015, F (2, 6) = 23.04; Gas7, P = 0.0027, F (2, 6) = 18.67; Pdgfrb, P = 8.449E-07, F (2, 6) = 314.3) followed by Bonferroni’ spost hoc test (Kif26a, c vs. 0.625, P = 0.0041, 95% C.I. = 6.126 to 22.47, c vs. 1.25, P = 0.0014, 95% C.I. = 9.393 to 25.73; Gas7, c vs. 0.625, P = 0.045, 95% C.I. = 0.05735 to 4.229, c vs. 1.25, P = 0.0018, 95% C.I. = 2.207 to 6.379; Pdgfrb, c vs. 0.625, P = 1.431E-05, 95% C.I. = 1.75 to 2.663, c vs. 1.25, P = 5.418E-07, 95% C.I. = 3.384 to 4.296). (d) H3K27–3me ChIP-qPCR showing increased H3K27–3me at promoters of Egr2 and Egr3 genes in E14.5 Mettl14 KO vs. nondeleted NSCs. n = 4 independent experiments for all experimental groups, two-tailed unpaired t-test (Egr2, P = 0.0016, t = 5.463, df = 6, 95% C.I. = 5.412 to 14.19; Egr3, P = 0.0010, t = 5.928, df = 6, 95% C.I. = 5.007 to 12.05). (e) RT-qPCR showing decreased expression of Egr2 and Egr3 genes in E14.5 Mettl14 KO vs. nondeleted NSCs. n = 3 independent experiments for all experimental groups, two-tailed unpaired t-test (Egr2, P = 0.0052, t = 5.603, df = 4, 95% C.I. = −0.3789 to −0.1278; Egr3, P = 0.0009, t = 10.67, df = 4, 95% C.I. = −0.7855 to −0.4612). (f) RT-qPCR showing increased expression of Egr2 and Egr3 genes in E14.5 Mettl14 KO vs. nondeleted NSCs treated with H3K27–3me inhibitor GSK343. One-way ANOVA (n = 3 independent experiments for all experimental groups; Egr2, P = 0.0003, F (2, 6) = 44.49; Egr3, P = 0.01, F (2, 6) = 10.94) followed by Bonferroni’spost hoc test (Egr2, c vs. 0.625, P = 0.0007, 95% C.I. = −0.4826 to −0.2041, c vs. 1.25, P = 0.0002, 95% C.I. = −0.5526 to −0.2741; Egr3, c vs. 0.625, P = 0.0519, 95% C.I. = −0.5627 to 0.002676, c vs. 1.25, P = 0.0072, 95% C.I. = −0.7227 to −0.1573). Graphs represent the mean ± SD. Dots represent data from individual data points. ns = non-significant. * P < 0.05, ** P < 0.01, *** P < 0.001, **** P < 0.0001.
m6A regulates stability of CBP and p300 transcripts
We then asked how m6A might regulate histone modifications. To do so, we first evaluated the presence of m6A on transcripts encoding the H3K27 acetyltransferases CBP and P300 and the PRC2 (Polycomb Repressive Complex) subunits Ezh2/Suz12/Eed, which catalyze H3k27–3me methylation, by methylated RNA immunoprecipitation (meRIP). We detected a 20– 30% m6A enrichment over input in CBP and p300 mRNAs, which was lost in E14.5 Mettl14 KO NSCs (Fig. 7a). In contrast, only a 0.4–0.6% m6A enrichment was seen on Ezh2, Eed, and Suz12 mRNAs, and extremely low levels seen on Ezh2 and Eed persisted in KO Cells (Supplementary Fig. 5), suggesting that signals detected are due to IP background.
Figure 7: m6A regulates mRNA stability of CBP and p300.
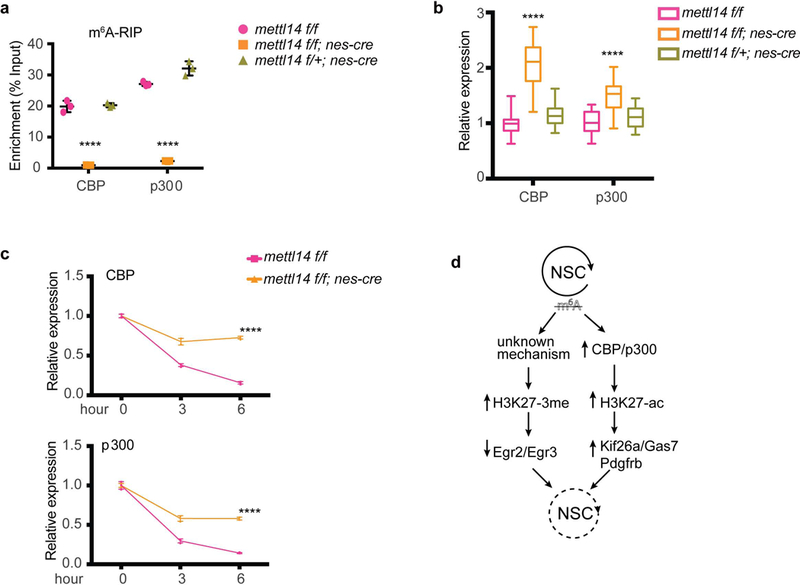
(a) m6A-meRIP-qPCR of CBP and p300 in Mettl14 KO vs. control E14.5 NSCs. One-way ANOVA (n = 3 independent experiments for all experimental groups; CBP, P = 1.08E-06, F (2, 6) = 289.4; p300, P = 3.961E-07, F (2, 6) = 405.5) followed by Bonferroni’ spost hoc test (CBP, WT vs. KO, P = 1.697E-06, 95% C.I. = 16.18 to 21.63, WT vs. Het, P = 0.9999, 95% C.I. = - 3.13 to 2.316; p300, WT vs. KO, P = 1.113E-06, 95% C.I. = 21.47 to 28.12, WT vs. Het, P = 0.0086, 95% C.I. = −8.32 to −1.667). (b) RT-qPCR of CBP and p300 transcripts in E14.5 NSCs cultured for 7 days in vitro, one-way ANOVA (WT: n = 21, KO: n = 33, and Het: n = 21 independent experiments for all experimental groups; CBP, P = 2.380E-21, F (2, 72) = 98.64; p300, P = 2.751E-09, F (2, 72) = 26.24) followed by Bonferroni’ spost hoc test (CBP, WT vs. KO, P = 1.306E-19, 95% C.I. = - 1.252 to −0.8628, WT vs. Het, P = 0.3029, 95% C.I. = −0.3512 to 0.07886; p300, WT vs. KO, P = 5.254E-09, 95% C.I. = −0.6356 to −0.3153, WT vs. Het, P = 0.2011, 95% C.I. = −0.3058 to 0.04839). (c) RT-qPCR of CBP and p300 transcripts in Actinomycin D-treated E14.5 NSCs. P values are generated by two-way ANOVA (n = 3 independent experiments for all experimental groups; CBP, P = 1.262E-11, F (1, 12) = 602.5; p300, P = 8.738E-10, F (1, 12) = 291.7) followed by Bonferroni’ spost hoc test (CBP, 0 h, P = 0.9999, 95% C.I. = −0.05658 to 0.05658, 3 h, P = 1.714E-08, 95% C.I. = −0.3518 to −0.2386, 6 h, P = 7.954E-12, 95% C.I. = −0.6268 to −0.5136; p300, 0 h, P = 0.9999, 95% C.I. = −0.06777 to 0.06777, 3 h, P = 1.988E-07, 95% C.I. = −0.3522 to −0.2167, 6 h, P = 1.50564E-09, 95% C.I. = −0.5046 to −0.3691). (d) A model whereby m6A loss alters histone modifications partly through regulating mRNA stability of histone modifiers, and altered histone modifications aberrantly repress proliferation- related genes and activate differentiation-related genes resulting in loss of NSC ground state. Graphs represent the mean ± SD. Dots represent data from individual data points. The horizontal lines in the boxplots indicate medians; the box limits indicate first and third quantiles; and the vertical whisker lines indicate minimum and maximum values. **** P < 0.0001.
We then evaluated potential changes in stability of CBP and p300 mRNAs. We observed a significant increase in both CBP and p300 mRNA levels in E14.5 Mettl14 KO vs. control NSCs (Fig. 7b). We then assayed mRNA stability by treating E14.5 cultured KO and control NSCs with actinomycin D (ActD) to block transcription and harvesting cells 3 and 6 hs later. Both CBP and p300 showed significantly increased mRNA stability in Mettl14 KO NSCs compared to nondeleted control NSCs (Fig. 7c), suggesting that m6A may regulate histone modification by destabilizing transcripts encoding histone modifiers.
DISCUSSION:
By conditionally inactivating Mettl14 in embryonic NSCs, we discovered that Mettl14 is required for NSC proliferation and maintains NSCs in an undifferentiated state (Figs. 1–3). Thus, our findings reveal a previously unknown but essential function of m6A RNA methylation in regulating NSC self-renewal. We also observed decreased numbers of late-born neurons, which are generated from RGC after E15.5, in cortex ofMettl14 cKO animals at E17.5 and P0 (Fig. 4), consistent with the loss of Mettl14 expression and a decrease in size of the RGC pool. Interestingly, although Mettl14 loss promoted premature NSC differentiation, the identity of subtype of neurons in each neuronal layer was not obviously affected in cortex of Mettl14 cKO brain. Thus, we conclude that RGCs lacking Mettl14 remain capable of differentiation and migration and propose that cortical defects seen in Mettl14-deficient mice are due primarily to perturbed NSC self-renewal. Overall, our results provide a benchmark to further explore mechanisms underlying perturbed m6A RNA methylation in neurodevelopmental disorders. We note that we also detected Mettl14 expression in post-mitotic cortical neurons (Fig. 1e); hence a Mettl14 function in these cells cannot be excluded. However, since Mettl14 cKO mice in our study die shortly after birth, examination of potential Mettl14 function in neurons at later postnatal or adult stages was not possible. We also note that although our study shows a specific reduction in the number of upper layer projection neurons in the cortex of Mettl14 cKO versus control mice, we do not exclude the possibility that Mettl14 regulates production of neurons in other cortical layers. Analysis of that effect will likely require use of a Cre-driver to delete Mettl14 earlier than E13.5.
Significantly, our data for the first time suggests the existence of cross-talk between RNA and histone modification. While m6A reportedly regulates gene expression through diverse mechanisms, such as mRNA stability4,13,19,20, splicing15,42–44, and translation45,46, an interaction between m6A modification and epigenetic mechanisms has not been explored. Therefore, our finding that m6A RNA methylation regulates specific histone modifications, including H3K27– 3me, H3K27-ac, and H3K4–3me, represents a novel gene regulatory mechanism. Among these modifications, H3K27-ac and H3K4–3me are associated with gene activation and H3K27–3me with repression, consistent with our observations that there is no marked bias towards gene activation or repression in Mettl14 KO NSCs compared to controls (Fig. 5a). Importantly, our data shows that in Mettl14 KO cells, different m6A-regulated histone marks regulate expression of genes of different function (Fig. 6), suggesting m6A-regulated active and repressive histone modifications work synergistically to ensure an NSC ground state. Synergy is also evident by our observation that treatment of cells with either H3K27–3me or H3K27-ac inhibitors can, at least partially, restore cell proliferation in Mettl14 KO NSCs (Fig. 5). We did not observe any effects of the H3K4–3me inhibitor MM-102 on NSC proliferation. However, unlike H3K27-ac and H3K27–3me, which are regulated by distinct enzymes, H3K4–3me modification is catalyzed by a panel of SET domain proteins47. Although MM-102 is widely used to test H3K4–3me function, it inhibits formation of a MLL1/WDR5 complex and thus targets only the subset of H3K4–3me modifications dependent on MLL148. As yet, there are no inhibitors available that inhibit activities of most H3K4–3me methyltransferases and thus sufficiently abolish H3K4–3me. Therefore, we cannot exclude the possibility that m6A-regulated H3K4–3me regulates NSC proliferation. Future studies may reveal that m6A regulates levels of histone modifications other than H3K27-ac, H3K27–3me, and H3K4–3me.
We further showed that m6A regulates histone modifications directly by destabilizing transcripts encoding histone modifiers. It is evident that such a mechanism is applicable to the H3K27 acetyltransferase CBP/p300 but not to subunits in the PRC2 complex, suggesting that m6A regulates histone modifications through distinct mechanisms. Identification of those mechanisms warrants future investigations.
In summary, we propose a model (Fig. 7d) whereby m6A loss alters histone modifications partly through regulating mRNA stability of histone modifiers, and altered histone modifications aberrantly repress proliferation-related genes and activate differentiation-related genes resulting in loss of NSC ground state. Our study provides the first in-depth analysis of m6A in brain neural stem cells and suggests interaction between m6A and histone modification as a novel gene regulatory mechanism.
Experimental procedures
Mettl14 gene targeting
Mettl14 gene targeting vector was created by E. coli bacterial recombination as described49. NotI-ApaI fragment including intron 1 to 5 of Mettl14 in the fosmid WI1–205L1 (CHORI) was cloned into pGEM11-DTA2L vector50, yielding pGEM-Mettl14(1–5)-DTA. Two primer pairs (M14-L50F and M14- L50R, the left arm for bacterial recombination; LoxP-LF and LoxP-LR) were annealed and cloned into XhoI/HindIII of pBS-2xFRT-Zeo, derivative of pBS-2xF5-Zeo51. The PCR fragment including Mettl14 intron 1 to 2 with LoxP site (primer pair, M14-ex2F and M14-ex2R-LoxP) digested by BstBI-MluI and right arm adaptor (annealed primer pair, Mettl14-R50F and Mettl14-R50R) were cloned into the vector with the left arm. The splice acceptor (SA)-internal ribosomal entry site (Ires)-hygromycin resistance gene (Hyg)-tandem polyadenylation signals (tpA) cassette of pGEM-SA-Ires-Hyg-tpA was cloned into NheI-PmlI of the vector with left and right arms51. The bacterial targeting vector was digested by AgeI- NotI to remove vector backbone and was transfected into E.coli strain SW106 containing pGEM- Mettl14(1–5)-DTA for bacterial recombination, yielding Mettl14 targeting vector for mouse ES cells.
Mettl14 ES targeting vector was linearized by NotI and transfected into G4 male ES cells as described52, 53. 24 hours after transfection, 150 μg/ml Hygromycin was added to the ES medium. Hygromycin-resistant ES colonies were picked 10 days after transfection. Targeting of Mettl14 was confirmed by genomic PCR analysis using primer pairs: M14cF and SA-R for 5’-end; UptpA-F and M14-cR for 3’-end.
Generation of Mettl14 conventional and conditional knockout mice
Positive ES clones were used for injection into c57 blastocysts and generation of chimerical mice. To produce Mettl14 f/+ mice, the chimeras were crossed with wild-type c57 for germ line transmission and then crossed with Atcb-Flpe transgenic mice (The Jackson Laboratory, # 003800) to remove FRT flanked selection cassette. Male Mettl14 f/+ were crossed to female EIIa-Cre transgenic mice (The Jackson Laboratory, # 003724) to obtain Mettl14 +/− and Mettl14 +/− mice were intercrossed to obtain Mettl14 conventional knockout mice. Sex of embryos was determined.
To conditional knockout Mettl14 in brain, floxed Mettl14 mice were bred with nestin-Cre transgenic mice (The Jackson Laboratory, # 003771) to generate Mettl14 f/f;nes-cre. Sex of embryos was not determined. Mice were maintained at the SANFORD BURNHAM PREBYS Medical Discovery Institute Institutional animal facility, and experiments were performed in accordance with experimental protocols approved by local Institutional Animal Care and Use Committees (IACUC).
Genotyping
Genotyping was performed using MyTaq Extract-PCR kit (Bioline) with primer sets corresponding to the primer list table (Table S7).
Injection of S-phase tracer
IdU/BrdU double labeling was performed as previously described18. Briefly, pregnant females were injected intraperitoneally with Iododeoxyuridine (IdU, Sigma) (100mg/Kg body weight) and 1.5 hour later with the same dose of Bromodeoxyuridine (BrdU, Sigma) and sacrificed after 0.5 hour.
For BrdU single labeling, pregnant females were injected intraperitoneally with BrdU (100mg/Kg body weight) and sacrificed after 0.5 or 24 hours.
Immunohistochemistry
Frozen sections were boiled in citrate buffer, pH 6.0 (Sigma), penetrated in 0.25% Triton X-100 in PBS for 30 minutes at room temperature and blocked in PBST (PBS with 0.2% Tween-20) containing 10% normal goat serum (Abcam). Sections were incubated with primary antibody at 4 °C overnight. Secondary antibodies were applied to sections for 2 hours at room temperature. The primary antibodies used were as follows: rabbit anti-Mettl14 (1:500; Sigma, Cat. # HPA038002; immunohistochemistry validation and peer-reviewed citations at https://www.sigmaaldrich.com/catalog/product/sigma/hpa038002?lang=en®ion=US), Rabbit anti- Satb2 (1:500, Abcam, Cat. # Ab92446; immunohistochemistry validation and peer-reviewed citations at http://www.abcam.com/satb2-antibody-epncir130a-ab92446.html), Rabbit anti-Tbr1 (1:200, Abcam, Cat. # Ab31940; immunohistochemistry validation and peer-reviewed citations at http://www.abcam.com/tbr1-antibody-ab31940.html ), rabbit anti-Sox5 (1:200; Abcam, Cat. # Ab94396; immunohistochemistry validation and peer-reviewed citations at http://www.abcam.com/sox5-antibody-chip-grade-ab94396.html ), rabbit anti-Cux1 (1:100; Santa Cruz, Cat. # sc-13024; immunohistochemistry validation and peer-reviewed citations at https://www.scbt.com/scbt/product/cdp-antibody-m-222), rabbit anti-Pax6 (1:300; Biolegend, Cat. # PRB-278P; immunohistochemistry validation and peer-reviewed citations at https://www.biolegend.com/en-us/products/purified-anti-pax-6-antibody-11511), rat anti- BrdU (1:200; Abcam, Cat. # Ab6326; immunohistochemistry validation and peer-reviewed citations at http://www.abcam.com/brdu-antibody-bu_175-icr1-ab6326.html), mouse anti-IdU/BrdU (1:50; BD bioscience, Cat. # 347580; immunohistochemistry validation and peer-reviewed citations at https://www.bioz.com/result/mouse_anti_brdu/product/BD_Biosciences/?r=4.31&cf=0&uq=BrdU_clone_B44), rabbit anti-Ki67 (1:400, Cell Signaling, Cat. # 12202; immunohistochemistry validation and peer-reviewed citations at https://www.cellsignal.com/products/primary-antibodies/ki-67-d3b5-rabbit-mab-mousc-prcfcrrcd-ihc-formulated/12202). rat anti-phospho histone 3 (1:300; Abcam, Cat. # Ab10543; immunohistochemistry validation and peer-reviewed citations at http://www.abcam.com/histonce-h3-phospho-s28-antibody-hta28-ab10543.html). rabbit anti-Cleaved Caspase-3 (1:600; Ccll Signaling. Cat. # 9661; immunohistochemistry validation and peer-reviewed citations at https://www.ccllsignal.com/products/primary-antibodics/clcavcd-caspase-3-asp175-antibody/9661). rabbit anti-NeuroD2 (1:1.000; Abcam. Cat. # Ab104430; immunohistochemistry validation and peer- reviewed citations at http://www.abcam.com/neurod2-antibody-ab104430.html). rabbit anti-Tbr2 (1:500. Abcam. Cat. # Ab23345; immunohistochemistry validation and peer-reviewed citations at http://www.abcam.com/tbr2-comcs-antibody-chip-grade-ab23345.html). mouse anti-Tuj1 (1:1.000; Stemeell Tech.. Cat. # 01409; immunohistochemistry validation at https://www.stcmccll.com/anti-bcta-tubulin-iii-antibody-clone-tuj1.html and peer-reviewed citations at https://www.bioz.com/result/tuj 1/product/STEMCELL Technologies Inc/?r=3.00&cf=0&uq=StemcellTech tuj1). Secondary antibodies were Alexa Fluor 488 Goat anti-Rabbit IgG (Thermo Fisher Scientific. Cat. # A-11008; 1:1.000; immunohistochemistry validation and peer-reviewed citations at https://www.thermofisher.com/antibody/product/Goat-anti-Rabbit-IgG-H-L-Cross-Adsorbed-Secondarv-Antibody-Polyclonal/A-11008). Alexa Fluor 488 Goat anti-Mouse IgG (Thermo Fisher Scientific. Cat. # A-11001; 1:1.000; immunohistochemistry validation and peer-reviewed citations at https://www.thermofisher.com/antibody/product/Goat-anti-Mouse-IgG-H-L-Cross-Adsorbed-Secondary-Antibody-Polyclonal/A-11001). Texas Rcd-X Goat anti-Rat IgG (Thermo Fisher Scientific. Cat. # T- 6392; 1:1.000; immunohistochemistry validation and peer-reviewed citations at https://www.thermofisher.com/antibody/product/Goat-anti-Rat-IgG-H-L-Cross-Adsorbed-Secondary-Antibody-Polyclonal/T-6392). DAPI (Thermo Fisher Scientific. Cat. # 62248; 1:1.000) was used as nuclear counterstaining and slides were mounted in FluroSave rcagcnt (Millipore. Cat. # 345789).
For BrdU staining. sections were treatcd with 2N HCl at 37 °C for 30 min and 0.1M borate buffer. pH 8.5 for 10 min at room temperature.
Pax6-Tbr2 and Pax6-Mcttl14 co-staining were performed following previous paper54. In brief sections were incubatcd with highly diluted (1:30.000) primary antibody overnight at 4 °C and biotinylated goat anti-rabbit sccondary antibody for 1h at room temperature. The signal was amplified by using horseradish peroxidasc-based Vectastain ABC Kit (Vector Laboratories. Cat. # PK-6101) and Cyanine 3 Tyramide System (Perkin Elmer. Cat. # NEL704A001KT).
Fluorescence images were acquired by Zeiss LSM 710 confocal microscope and analyzed in ImageJ software.
NPC isolation and culture
Cortex region was dissected out from embryonic brains and triturated by pipetting. Dissociated cells were cultured as neurospheres with NeuroCult Proleferation Medium (Stemcell Tech.) following manufacturer’s protocols. Lentiviral constructs harboring shRNAs against Alkbh5 or Fto were purchased from Sigma-Aldrich (See “ shRNA sequences” section for details). Stable knockdown lines were generated using standard viral infection and puromycin selection (2□μg/mL).
shRNA RNA sequences
shAlkbh5 −1: 5’ - CCTATGAGTCCTCGGAAGATT-3’
shAlkbh5 −1: 5’ - GATCCTGGAAATGGACAAAGA-3’
shFto-1: 5’- GTCTCGTTGAAATCCTTTGAT-3’
shFto-1: 5’- TAGTCTGACTTGGTGTTAAAT-3’
Purification of mRNA
Total RNA was isolated using TRIZOL (Invitrogen) and treated with DNasel (Roche). Polyadenylated mRNA was purified using GenElute™ mRNA Miniprep Kit (Sigma-Aldrich) and residual ribosomal RNA was depleted with RiboMinus™ Eukaryote System v2 (Life Technologies).
Thin layer chromatography (2D-TLC)
2D-TLC was performed similarly as described55. Briefly, 500 ng purified polyA+/ribo- RNA was digested with 20 U RNase T1 (Thermo Fisher Scientific) in 20 ul 1×PNK buffer for 2 h at 37 °C. The digested RNA was labeled using 10 U T4 PNK (Thermo Fisher Scientific) and 1 ul γ−32P-ATP (6000 Ci/mmol, 150 mCi/ml, Perkin-Elmer) and for 1 h at 37 °C and precipitated. The RNA pellet was resuspended in 5 ul buffer containing 25 mM NaCl, 2.5 mM ZnSO4 and 1 U nuclease P1 (Sigma) and incubated at 37 °C overnight. 1 ul product was loaded onto a PEI-Cellulose TLC plate (Millipore) and developed in isobutyric acid: 0.5M NH4OH (5:3, v/v) as first dimension and isopropanol:HCl:water (70:15:15, v/v/v) as second dimension. After development, the plate was exposed to a phosphor screen and scanned using a FujiFilm FLA-5100 imager.
m6A dot-blot
Purified polyA+ RNA was blotted to a nylon membrane (Millipore) using Bio-Dot Microfiltration Apparatus (Bio-Rad). After crosslinking with a UV crosslinker (Spectroline), the membrane was blocked with non-fat milk in TBST and then incubated with antibody against m6A (Synaptic Systems, Cat. # 202 003, 1:1,000; dot blot validation at and peer-reviewed citations at https://www.bioz.com/result/affinitypurified/anti/m6/a/polyclonal/antibodv/product/Svnaptic/Svstems/?r=4.95&cf=0&uq=Svnaptic/Systems/methyladenosine) then an HRP-conjugated antibody against rabbit IgG (SouthernBiotech, Cat # 4030–05, 1:5,000; Immunoblotting validation and peer-reviewed citations at https://www.southembiotech.com/%3Fcatno=4030–05%26tvpe=Polvclonal%23%26panel1–1’). After incubation with the Immobilon Western Chemiluminescent HRP Substrate (Millipore), the membrane was exposed to autoradiography film (Kodak).
Neurosphere formation assay
Dissociated NPCs were seeded into 96-well plate at 400 cells per well and cultured for 7 days, then the 96-well plate was scanned using Celigo Imaging Cytometer (Nexcelom Bioscience) and the number and size of neurospheres were measured.
Immunostaing of cultured NPCs and TUNEL assay
NPCs cultured for 7 days in vitro were dissociated and plated into chamber slides. The slides were stained with antibody against Tuj1 (1:1000; Stemcell Tech., Cat. # 01409). TUNEL assay was performed using Click-iT Plus kit (Thermo Fisher Scientific) following manufacturer’s protocols.
Apoptosis FACS
Dissociated NPCs were incubated with Dead Cell Apoptosis Kit with Annexin V Alexa Flour-488 & Propidium Iodide (Thermo Fisher Scientific) following manufacturer’s protocols and analyzed by LSRFortessa Cell Analyzer (BD Biosciences).
MTT assay
Dissociated NPCs were seeded into 96-well plate. Cell numbers were measured using Cell Growth Determination Kit (Sigma) following manufacturer’s protocols at different time points.
Western blot Analysis
Proteins were separated on SDS-PAGE gel, blotted onto PVDF membrane and detected with primary antibodies against Gapdh (Cell Signaling, Cat. # 5174, 1:20,000; western blot validation and peer-reviewed citations at https://www.cellsignal.com/products/primarv-antibodies/gapdh-d16h11-xp-rabbit-mab/5174), Mettl14 (Sigma-Aldrich, Cat. # HPA038002, 1:5,000; western blot validation and peer-reviewedcitationsat https://www.sigmaaldrich.com/catalog/product/sigma/hpa038002?lang=en®ion=US), Flag (Sigma-Aldrich, Cat. # 1804. 1:10.000; western blot validation and peer-reviewed citations at https://www.sigmaaldrich.com/catalog/prodiict/sigma/f1804?lang=en®ion=US). Alkhb5 (Sigma- Aldrich, Cat. # HPA007196, 1:2,000; western blot validation and peer-reviewed citations at https://www.sigmaaldrich.com/catalog/product/sigma/hpa007196?lang=en®ion=US’) and Fto (PhosphoSolutions, Cat. # 597-FTO, 1:1,000; western blot validation and peer-reviewed citations at https://www.phosphosolutions.com/shop/fto-antibody/). Secondary antibodies were Goat Anti-Rabbit IgG-HRP (SouthernBiotech, Cat. # 4030–05; 1:10,000; western blot validation and peer-reviewed citations at https://www.southernbiotech.com/%3Fcatno=4030–05%26type=Polyclonal%23%26panel1–1) and Rabbit Anti-Mouse IgG-HRP (SouthernBiotech, Cat. # 6170–05; 1:10,000; western blot validation and peer-reviewed citations at https: //www.southernbiotech.com/%3F catno=6170– 05%26type=Polyclonal).
Histone extraction and quantitative western blot analysis
Histones were extracted from NPCs cultured for 7 days in vitro using Histone Extraction Kit (Abcam) following manufacturer’s protocols. Histone lysates were separated on SDS-PAGE gel, blotted onto Immobilon-FL PVDF membrane (Millipore, Cat. # IPFL00010) and incubated with primary antibodies including rat anti-H3 (Active Motif, Cat. # 61647; 1:2000; western blot validation and peer-reviewed citations at https://www.activemotif.com/catalog/details/61647/histone-h3-antibody-mab-clone-1c8b2), rabbit anti-H3K4me1 (Abcam, Cat. # Ab8895; 1:4000; western blot validation and peer-reviewed citations at http://www.abcam.com/histone-h3-mono-methyl-k4-antibody-chip-grade-ab8895.html), rabbit anti-H3K4me3 (Abcam, Cat. # Ab8580; 1:2000; western blot validation and peer-reviewed citations at http://www.abcam.com/histone-h3-tri-methyl-k4-antibody-chip-grade-ab8580.html), rabbit anti- H3K9me3 (Abcam, Cat. # Ab8898; 1:2000; western blot validation and peer-reviewed citations at http://www.abcam.com/histone-h3-tri-methyl-k9-antibody-chip-grade-ab8898.html), rabbit anti- H3K27me3 (Millipore, Cat. # 07–449; 1:2000; western blot validation at http://www.emdmillipore.com/US/en/product/Anti-trimethyl-Histone-H3-Lys27-Antibody,MM NF-07– 449 and peer-reviewed citations at https://www.bioz.com/result/antih3k27me3/product/Millipore/?r=4.88&cf=0&uq=Millipore, Cat. - 07%252D449), rabbit anti-H3K9ac (Active Motif, Cat. # 39917; 1:2000; western blot validation at http://www.activemotif.com/catalog/details/39917 and peer-reviewed citations at https://www.bioz.com/result/h3k9ac/product/Active Motif/?r=4.14&cf=0&uq=Active Motif, Cat. - 39917), rabbit anti-H3K27ac (Abcam, Cat. # Ab4729; 1:2000; western blot validation and peer-reviewed citations at http://www.abcam.com/histone-h3-acetyl-k27-antibody-chip-grade-ab4729.html), and rabbit anti-H3ac (Active Motif, Cat. # 39139; 1:2000; western blot validation at http://www.activemotif.com/catalog/details/39139/histone-h3ac-pan-acetvl-antibodv-pab-1 and peer- reviewed citations at https://www.bioz.com/result/chip validated antibodies h3 pan acetyl/product/Active Motif/?r=3.00&cf=0&uq=Active Motif, Cat. - 39139), rabbit anti-H2AK119Ubi (Cell Signaling, Cat. # 8240; 1:4000; western blot validation and peer-reviewed citations at https://www.cellsignal.com/products/primarv-antibodies/ubiquitvl-histone-h2a-lvs119-d27c4-xp-rabbit- mab/8240), mouse anti-H2BK120Ubi (Active Motif, Cat. # 39623; 1:2000; western blot validation at http://www.activemotif.com/catalog/details/39623/histone-h2b-ubiquitvl-lvs120-antibodv-mab-clone-56 and peer-reviewed citations at https://www.bioz.com/result/h2bub1/product/Active Motif/?r=3.00&cf=0&uq=Active Motif, Cat. - 39623), rabbit anti-H3S28pho (Abcam, Cat. # Ab10543; 1:2000; western blot validation at http://www.abcam.com/histone-h3-phospho-s28-antibodv-hta28- ab10543.html and peer-reviewed citations at https://www.bioz.com/result/ab10543/product/Abcam/?r=3.00&cf=0&uq=Abcam, Cat. - Ab10543). Secondary antibodies were IRDye 800CW Goat anti-Rat IgG (LI-COR Biosciences, Cat. # 925–32219; 1:20000; western blot validation and peer-reviewed citations at https://www.bioz.com/result/irdve 800 goat anti rat igg/product/LI-COR/?r=3.42&cf=Q&uq=IRDve 800 Goat anti-Rat IgG), IRDye 680RD Goat anti-Rabbit IgG (LI-COR Biosciences, Cat. # 925–68071; 1:20000; western blot validation and peer- reviewed citations at https://www.bioz.com/result/irdve 680rd conjugated goat anti rabbit igg secondary antibodv/product/LI-COR/?r=3.53&cf=0&uq=IRDve 680RD Goat anti-Rabbit IgG), IRDye 680RD Goat anti-Mouse IgG (LI-COR Biosciences, Cat. # 925–68070; 1:20000; western blot validation and peer- reviewed citations at https://www.bioz.com/result/irdve 680rd goat anti mouse igg/product/LI- CQR/?r=4.95&cf=0&uq=IRDve 680RD Goat anti-Mouse IgG). Membranes were scanned by Odyssey Imager (LI-COR Biosciences) and quantified using Image Studio Lite (LI-COR Biosciences).
Reverse transcription coupled with quantitative PCR (RT-qPCR)
DNase I-treated total RNA was used to synthesize cDNA using an iScript cDNA synthesis kit (Bio-Rad) according to the manufacturer’s protocols. qPCR was performed with primer sets corresponding to the primer list table (Table S3) and using iTaq Universal SYBR Green Supermix (Bio-Rad) on a BioRad CFX96 Touch™ Real-Time PCR Detection.
RNA-seq analysis
RNA-seq alignment.
Tuxedo-suite was used for the entire RNA-seq analyses56. Specifically, TopHat2 (v2.1.0) was used to align RNA-seq reads to the mouse genome (mm10). To ensure correct alignment especially for assigning the spliced reads to the correct transcripts, we supplied the software with an existing transcript reference annotations from RefSeq with option --GTF. The RefSeq annotation is available as the iGenome project at the TopHat website (https://ccb.jhu.edu/software/tophat/igenomes.shtml). Other settings of the aligner were left to the default.
Transcript assembly.
We then supplied the alignment BAM files from TopHat2 to Cufflinks to perform transcript assembly and expression estimation. The assembly was guided by the above RefSeq annotations with option --GTF-guide. We also turn on the multi-read correction (--multi-read-correct) and fragment bias correction options (--frag-bias-correct $genome) to correct for the sequencing biases. Other settings of the assembler were left to the default.
Differential analysis.
We assembled transcripts in each sample library and biological replicate separately. In the end, we ran Cuffmerge to combine all assembled transcripts into a merged custom annotation file (merged.gtf) for the differential expression analysis. In particular, we ran Cuffdiff to compare between M14 knockout mutant and wild-type libraries using the read alignment files from TopHat2 as input and the above custom annotation file as reference. The 3 biological replicates per condition were used to estimate the dispersion in the negative binomial likelihood function modeled by Cuffdiff. We also enabled --multi-read-correct and --frag-bias-correct to improve estimation. The main output from Cuffdiff that were used for downstream analysis in this paper were the “gene_exp.diff’ and “genes.read_group_tracking” (default output names from the software), which provide the differential expression statistical results and the actual expression estimate in terms of FPKM, respectively. Significant fold-change was determined based on FDR < 0.05 (as the default threshold of the Cuffdiff program).
ChIP-seq analysis
Chromatin Immunoprecipitation (ChIP):
For ChIP experiments, NPCs cultured for 7 days in vitro were harvested and cross-linked for 5 min at room temperature using 1% formaldehyde. Cells were lysed for by rotating for 10 min at 4 °C in cell lysis buffer (20mM Tris pH8, 85mM KCl, 0.5% NP-40, protease inhibitor cocktail). Nuclei were pelleted and re-suspended in nuclei lysis buffer (50mM Tris pH8, 10mM EDTA, 0.25% SDS, protease inhibitor cocktail). Chromatin was sheared by Covaris S2 using AFA microtube and a low cell chromatin shearing protocol for 12 min. Lysates were cleared by centrifugation at 20,000×g at 4 °C for 5 min and used as IP inputs. IP was done using MAGnify™ Chromatin Immunoprecipitation System (Thermo Fisher Scientific) following manufacturer’s protocols. The antibodies used were as follows: rabbit anti-H3K27ac (Abcam, Cat. # Ab4729, Lot. # GR312658–1; ChIP validation and peer-reviewed citations at http://www.abcam.com/histone-h3-acetyl-k27-antibody-chip-gradc-ab4729.html). rabbit anti-H3K27me3 (Millipore, Cat. # 07–449, Lot. # 2686928; ChIP validation at http://www.emdmillipore.com/US/en/product/Anti-trimethvl-Histone-H3-Lvs27-Antibodv.MM NF-07– 449 and peer-reviewed citations at https://www.bioz.com/result/antih3k27me3/product/Millipore/?r=4.88&cf=0&uq=Millipore. Cat. - 07%252D449). Chromatin samples were sent for high throughput sequencing.
ChIP-seq Alignment, peak calling, and comparison:
To align ChIP-seq DNA reads to the reference mm10 genome, we used Bowtie2 (v2.3.1)57 with the default options except that “--broad” was turned on for calling broad peaks. Each ChIP library in each biological replicate was compared against the DNA input background library in the corresponding cell type + condition. Specifically, histone marks H3K4me3 and H3K27ac in wild-type and M14 knockout (KO) mutant of mouse neural progenitor cell (NPC) were compared with the DNA input in wild-type and M14 KO NPC, respectively. Default cutoff of FDR < 0.05 were used to determine ChIP-seq peaks relative to the input libraries. The main outputs from MACS2 were the broadPeak files in BED format, which we used for downstream comparison among the experimental conditions and with other cognate genome-wide results (i.e., RNA-seq and RIP-seq).
meRIP-seq analysis
Methylated RNA immunoprecipitation (meRIP):
meRIP was performed as previously described4. Briefly total RNA was extracted using Trizol reagent (Invitrogen). RNA was treated with RNAse-free DNAse I (Roche) to deplete DNA contamination. PolyA RNA was purified using a GenElute mRNA Miniprep Kit (Sigma-Aldrich) as per the manufacturer’s instructions and fragmented using a RNA fragmentation kit (Ambion). Two hundred micrograms of fragmented RNA was incubated with 3 μg anti-m6A antibody (Synaptic Systems, catalogue number 202 003; RIP validation and peer-reviewed citations at https://www.bioz.com/result/affmity purified anti m6 a polyclonal antibody/product/Synaptic Systems/?r=4.95&cf=0&uq=Synaptic Systems methyladenosine) in RIP buffer (150mM NaCl, 10mM Tris and 0.1% NP40) for 2 h at 4 °C, followed by the addition of washed protein A/G magnetic beads (Millipore) and incubation at 4 °C for a further 2 h. Beads were washed 6 times in RIP buffer and incubated with 50 μl immunoprecipitation buffer containing 0:5 mg ml−1 m6AMP (Sigma-Aldrich) to elute RNA. Immunoprecipitated RNA was extracted with phenol/chloroform and RNA samples were sent for high-throughput sequencing.
meRIP -seq Alignment and peak calling:
we used Tophat2 to align reads to the mouse reference mm10 genome with default setting and RefSeq annotations as guide (i.e., the same method as in the RNA-seq analysis). To call RIP-seq peaks, we used MACS2 with default settings except for enabling the --broad option (i.e., the same as in the ChIP-seq analysis).
RNA stability assay
Actinomycin D (Sigma-Aldrich) at 5 μg/ml was added to NPCs culture. After 0, 3 or 6 hrs of incubation, cells were collected and RNAs were isolated for qPCR.
Statistical analysis
All data were expressed as mean ± SD, as indicated in the figure legends. Statistical analyses were completed with Prism GraphPad 7. Data comparing WT vs. Mettl14 heterzygous (Het) and knockout (KO) phenotypes and data of inhibitors treatment were analyzed using one-way ANOVA followed by Bonferroni’s multiple comparisons test. Data comparing WT vs. Mettl14 KO were analyzed using unpaired t-test. NSC growth curve were analyzed using two-way ANOVA followed by Bonferroni’s multiple comparisons test. RNA stability data comparing WT vs. Mettl14 KO NSCs were analyzed using two-way ANOVA. The association between m6A targets and differential gene expression in Mettl14 KO vs. nondeleted control NSCs were determined by Fisher’s Exact Test. Correlation analyses between changes in ChIP peak intensity and changes in gene expression were done using Pearson correlation analysis. No statistical methods were used to pre-determine sample sizes but our sample sizes are similar to those reported in previous publications1, 2, 4, 13, 16, 18. Data distribution was assumed to be normal but this was not formally tested. There was no randomization in the organization of the experimental conditions. Data collection and analysis were not performed blind to the conditions of the experiments. We did not exclude any animals for data point from the analysis.
Life Sciences Reporting Summary
Further information on experimental design and reagents is available in the Life Sciences Reporting Summary.
Supplementary Material
Generation of conditional Mettl14 knockout mice. (a) Schematic diagram showing strategy used to create conditional Mettl14 knockout. (b-d) Representative genotyping PCR results using different primer sets for the targeted Mettl14 allele (b), the floxed Mettl14 allele (c), or the exon 2-deleted Mettl14 allele (d). Similar results were obtained from three independent experiments. (e) Representative images of wildtype and Mettl14 null embryos at E7.5. Similar results were obtained from three independent experiments. (f) Representative PCR results for sex determination. Similar results were obtained from three independent experiments. (g) Representative images of pups at P0. Scale bar: 5 mM. (h) Quantification of pup body weight at P0, one-way ANOVA (WT: n = 16, KO: n = 7, and Het: n = 8 P0 pups; P = 0.1719, F (2, 28) = 1.877) followed by Bonferroni’s post hoc test (WT vs. KO, P = 0.4198, 95% C.I. = −0.09762 to 0.3285, WT vs. Het, P = 0.6836, 95% C.I. = −0.2867 to 0.1205). (i) Survival curve of newborn mice with or without brain-specific Mettl14 deletion (Mettl14 f/f: n = 12, Mettl14 f/+: n = 10,Mettl14 f/+;nes-cre: n = 12,Mettl14f/f;nes-cre: n = 14 animals). Graphs represent mean ± SD. Dots represent data from individual data points. ns = non-significant.
Mettl14 regulates self-renewal of cortical NSCs in vitro. (a) Western blots showing Mettl14 depletion in Mettl14 KO NSCs. Similar results were obtained from three independent experiments. For uncropped images, see Supplementary Fig. 6b. (b) Growth curve of cortical NSCs isolated from E17.5 brain. Two-way ANOVA (n = 3 cell cultures for all experimental groups; P = 3E-15, F (2, 18) = 357.5) followed by Bonferroni’spost hoc test (WT vs. KO, P = 2.5E-14, 95% C.I. = 0.09616 to 0.1196, WT vs. Het, P = 0.4346, 95% C.I. = −0.01786 to 0.005595). (c,d) Assessment of apoptosis in Mettl14 KO and nondeleted control NSCs. The number of apoptotic cells was determined by FACS analysis via Annexin V-FITC and PI-staining. Representative results are shown in (c) and results from 3 independent experiments are summarized in (d). One-way ANOVA (n = 3 cell cultures for all experimental groups; P = 0.6882, F (2, 6) = 0.3979) followed by Bonferroni’s post hoc test (WT vs. KO, P = 0.8321, 95% C.I. = −1.999 to 3.666, WT vs. Het, P = 0.9999, 95% C.I. = −2.266 to 3.399). (e) Quantification of TUNEL assays in Mettl14 KO and control NSCs. One-way ANOVA (n = 3 fields for all experimental groups; P = 0.7572, F (2, 6) = 0.2915) followed by Bonferroni’s post hoc test (WT vs. KO, P = 0.9999, 95% C.I. = −50.16 to 32.35, WT vs. Het, P = 0.9999, 95% C.I. = −40.71 to 41.81). (f) Western blots showing expression of Flag-tagged Mettl14 in WT and Mettl14 KO NSCs transduced by lentivirus containing empty or Flag-Mettl14 vectors. Similar results were obtained from three independent experiments. For uncropped images, see Supplementary Fig. 6c. (g) m6A dot-blots of Ribo- polyA RNAs isolated from Mettl14 KO and nondeleted NSCs transduced with lentivirus containing empty or Flag-Mettl14 vectors. Similar results were obtained from three independent experiments. (h) RT-qPCR of Alkbh5 transcripts in NSCs expressing scramble (scr) shRNA or shRNAs against Alkbh5, one-way ANOVA (n = 3 independent experiments for all experimental groups; P = 7.511E-08, F (2, 6) = 708) followed by Bonferroni’spost hoc test (Scr vs. shAlkbh5–1, P = 1.06113E-07, 95% C.I. = 0.8453 to 1.013, Scr vs. shAlkbh5–2, P = 1.164E-07, 95% C.I. = 0.831 to 0.9991). (i) Western blots showing Alkbh5 depletion in NSCs expressing scramble (scr) shRNA or shRNAs against Alkbh5. Similar results were obtained from two independent experiments. For uncropped images, see Supplementary Fig. 6d. (j) Growth curve of NSCs expressing scr shRNA or shRNAs against Alkbh5. Two-way ANOVA (n = 4 cell cultures for all experimental groups; P = 0.0626, F (2, 27) = 3.075) followed by Bonferroni’s post hoc test (Scr vs. shAlkbh5–1, P = 0.0928, 95% C.I. = −0.2273 to 3.548, Scr vs. shAlkbh5–2, P = 0.0726, 95% C.I. = −0.1353 to 3.64). (k) RT-qPCR of Fto transcripts in NSCs expressing scramble (scr) shRNA or shRNAs against Fto, one-way ANOVA (n = 3 independent experiments for all experimental groups; P = 1.324E-06), F (2, 6) = 270.2) followed by Bonferroni’s post hoc test (Scr vs. shFto-1, P = 2.396E-06, 95% C.I. = 0.6521 to 0.887, Scr vs. shFto-2, P = 1.629E-06, 95% C.I. = 0.6521 to 0.887). (l) Western blots showing Fto depletion in NSCs expressing scramble (scr) shRNA or shRNAs against Fto. Similar results were obtained from two independent experiments. For uncropped images, see Supplementary Fig. 6e. (m) Growth curve of NSCs expressing scr shRNA or shRNAs against Fto. Two-way ANOVA (n = 4 cell cultures for all experimental groups; P = 0.0005, F (2, 27) = 10.1) followed by Bonferroni’s post hoc test (Scr vs. shFto-1, P = 0.0538, 95% C.I. = −1.604 to 0.01121, Scr vs. shFto, P = 0.0809, 95% C.I. = −0.07525 to 1.54). Graphs represent mean ± SD. Dots represent data from individual data points. ns = non-significant. **** P < 0.0001.
Mettl14 deficiency decreases RGC proliferation in vivo. (a-c) Coronal sections of E15.5 brains stained with antibodies recognizing BrdU, PH3, and PAX6. Pregnant mothers received a BrdU pulse 30 min prior to embryo collection. (d) Quantification of immunostaining from E15.5 sections. Numbers of Pax6+, BrdU+ and PH3+ cells were determined and normalized to comparable sections from nondeleted mice, one-way ANOVA (n = 3 brain sections for all experimental groups; Pax6+, P = 0.5647, F (2, 6) = 0.6296; BrdU+, P = 0.0159, F (2, 6) = 8.942; PH3+, P = 0.016, F (2, 6) = 8.912) followed by Bonferroni’spost hoc test (Pax6+, WT vs. KO, P = 0.8495, 95% C.I. = −0.342 to 0.6193, WT vs. Het, P = 0.9999, 95% C.I. = −0.5131 to 0.4483; BrdU+, WT vs. KO, P = 0.0442, 95% C.I. = 0.007399 to 0.4702, WT vs. Het, P = 0.7184, 95% C.I. = −0.3088 to 0.154; PH3+, WT vs. KO, P = 0.0134, 95% C.I. = 0.1228 to 0.7966, WT vs. Het, P = 0.7164, 95% C.I. = −0.224 to 0.4498). (e,f) Coronal sections of E13.5 brain stained with anti-Pax6, anti-BrdU, or anti-PH3 antibodies. Pregnant mothers were pulsed with BrdU 30 min prior to embryo collection. (g) Quantification of immunostaining from E13.5 sections. Numbers of Pax6+, BrdU+ and PH3+ cells were determined and normalized to comparable sections from nondeleted mice, one-way ANOVA (n = 3 brain sections for all experimental groups; Pax6+, P = 0.7735, F (2, 6) = 0.2682; BrdU+, P = 0.6595, F (2, 6) = 0.4466; PH3+, P = 0.9675, F (2, 6) = 0.03325) followed by Bonferroni’s post hoc test (Pax6+, WT vs. KO, P = 0.9999, 95% C.I. = −0.364 to 0.403, WT vs. Het, P = 0.9999, 95% C.I. = −0.454 to 0.3131; BrdU+, WT vs. KO, P = 0.8695, 95% C.I. = - 0.2011 to 0.359, WT vs. Het, P = 0.9999, 95% C.I. = −0.2765 to 0.2836; PH3+, WT vs. KO, P = 0.9999, 95% C.I. = −0.1804 to 0.2045, WT vs. Het, P = 0.9999, 95% C.I. = −0.1764 to 0.2086). (h) Immunostaining of coronal sections of E17.5 and E15.5 brain using Cleaved-Caspase-3 antibody. (i) Quantification of Cleaved-Caspase-3+ cell number, based on immunostaining. One-way ANOVA (n = 3 brain sections for all experimental groups; E17.5, P = 0.1834, F (2, 6) = 2.28; E15.5, P = 0.6596, F (2, 6) = 0.4463) followed by Bonferroni’s post hoc test (E17.5, WT vs. KO, P = 0.5745, 95% C.I. = −11.83 to 27.16, WT vs. Het, P = 0.744, 95% C.I. = −25.83 to 13.16; E15.5, WT vs. KO, P = 0.9999, 95% C.I. = −36.44 to 32.44, WT vs. Het, P = 0.9991, 95% C.I. = −26.11 to 42.77). (j,k) Immunostaining of coronal sections of E15.5 brain with antibodies to the intermediate progenitor marker anti-Tbr2 and the proneural marker anti-Neurod2. Dashed white lines indicate border of VZ/SVZ area. Similar results were obtained from three independent experiments. Scale bars: 100 μM. Graphs represent mean ± SD. Dots represent data from individual data points. ns = non-significant. * P < 0.05.
m6A regulates NSC gene expression through histone modifications. (a) Numbers of gene counts and exact P values for each GO term displayed in Fig. 5b and 5c. (b) The association between m6A targets and differential gene expression in Mettl14 KO vs. nondeleted control NSCs determined by two-tailed Fisher’s Exact Test. A transcript is defined as an m6A target when a m6A peak is detected from either one of the two biological replicates in m6A meRIP-seq experiment. The numbers of genes in each category and exact P value are shown in the graph. (c) MTT cell growth assay of NSCs treated with vehicle/DMSO or the MLL1 inhibitor MM-102, the CBP/P300 inhibitor C646, or the Ezh2 inhibitor GSK343. Shown is the absorbance ratio of heterozygous to non-deleted controls at each dose. One-way ANOVA (n = 3 independent experiments for all experimental groups; GSK343, P = 0.1352, F (3, 8) = 2.482; C646, P = 0.0528, F (3, 8) = 3.971; MM-102, P = 0.5055, F (3, 8) = 0.8478) followed by Bonferroni’spost hoc test (GSK343, c vs. 1.25, P = 0.9999, 95% C.I. = −0.2624 to 0.1392, c vs. 2.5, P = 0.0932, 95% C.I. = −0.3746 to 0.02694, c vs. 5, P = 0.3732, 95% C.I. = −0.3151 to 0.08651; C646, c vs. 1.25, P = 0.3132, 95% C.I. = −0.1995 to 0.04874, c vs. 2.5, P = 0.4435, 95% C.I. = −0.0582 to 0.1901, c vs. 5, P = 0.9999, 95% C.I. = −0.1164 to 0.1319; MM-102, c vs. 0.0625, P = 0.9999, 95% C.I. = −0.1997 to 0.3001, c vs. 1.25, P = 0.9999, 95% C.I. = −0.3251 to 0.1747, c vs. 2.5, P = 0.9999, 95% C.I. = −0.2263 to 0.2734). Graphs represent the mean ± SD. Dots represent data from individual data points.
Low enrichment of m6A on mRNAs encoding Ezh2, Suz12, and Eed. m6A-meRIP-qPCR of Ezh2, Suz12, and Eed in Mettl14 KO vs. control E14.5 NSCs. One-way ANOVA (n = 3 independent experiments for all experimental groups; Ezh2, P = 0.0812, F (2, 6) = 3.928; Suz12, P = 5.055E-06, F (2, 6) = 171.8; Eed, P = 0.00012, F (2, 6) = 57.32) followed by Bonferroni’s post hoc test (Ezh2, WT vs. KO, P = 0.0739, 95% C.I. = −0.004323 to 0.08219, WT vs. Het, P = 0.1679, 95% C.I. = −0.0131 to 0.07341; Suz12, WT vs. KO, P = 3.125E-05, 95% C.I. = 0.2091 to 0.3387, WT vs. Het, P = 0.0029, 95% C.I. = −0.1855 to −0.05595; Eed, WT vs. KO, P = 9.828E-05, 95% C.I. = 0.02144 to 0.03883, WT vs. Het, P = 0.0823, 95% C.I. = - 0.001105 to 0.01628). Graphs represent the mean ± SD. Dots represent data from individual data points. ns = non-significant. **** P < 0.0001.
Uncropped western blot images (a) Corresponding uncropped images of western blots shown in Fig. 5d. (b) Corresponding uncropped images of western blots shown in Supplementary Fig. 2a. (c) Corresponding uncropped images of western blots shown in Supplementary Fig. 2f. (d) Corresponding uncropped images of western blots shown in Supplementary Fig. 2i. (e) Corresponding uncropped images of western blots shown in Supplementary Fig. 2l. The protein standards are depicted to the left of the images.
Genotypes of born pups from Mettl14 +/− x Mettl14 +/− crosses
Genotypes of E7.5, E8.5, and E9.5 embryos from Mettl14 +/− x Mettl14 +/− crosses.
RNA-seq analysis of E14.5 Mettl14 KO NSC vs. nondeleted control from 3 independent experiments.
Peaks detected from methylated RIP-seq experiments. Results from the biological replicates were listed in two separately spreadsheets.
H3K27ac ChIP-seq peaks located within 10 Kb up- or down-stream of transcription start sites
H3K27–3me ChIP-seq peaks located within 2 Kb up-stream of transcription start sites
List of PCR primers used in this study.
ACKNOWLEDGEMENTS
We thank Ling Wang and Viridiana Ylis from the SBP (Sanford-Burnham-Prebys Medical Discovery Institute) Animal Resources Facility for blastocyst injection and mouse maintenance; Guillermina Garcia from the SBP Histopathology core for preparing coronal sections from frozen and paraffin-embedded mouse brains; the SBP Cell Imaging core for confocal microscopy; the SBP flow cytometry core for apoptosis analysis; Brian James from the Genomics DNA Analysis Facility at SBP for high throughput sequencing analysis; Anne Bang for critical reading of the manuscript. This work is supported by a CIHR Operating Grant (No. 115194) and an NSERC Discovery Grant (327612) for Z.Z., a NCI grant (CA159859) and a CIRM (California Institute for Regenerative Medicine) Leadership Award (LA1–01747) for R.W.R, a NIGMS grant (GM062848) for G.D., NIH R01 awards (MH109978 and HG008155), an NIH RF1 award (AG054012), and an NIH U01 award (HG007610) for M.K, a CIRM Training Grant for Y.W., a NIH R01 award (R01 GM110090) and a SBP Cancer Center Pilot grant (5P30 CA030199) for J.C. Z.
Footnotes
COMPETING FINANCIAL INTERESTS
The authors declare no competing financial interests.
ACCESSION CODES
The data discussed in this publication have been deposited in NCBI’s Gene Expression Omnibus and are accessible through GEO Series accession number GEO: GSE104686.
Data availability
RNA-seq and ChIP-seq data are accessible at NCBI GEO: GSE104686. The remaining data that support the findings of this study are available from the corresponding author upon reasonable request.
REFERENCES:
- 1.Meyer KD et al. Comprehensive analysis of mRNA methylation reveals enrichment in 3’ UTRs and near stop codons. Cell 149, 1635–46 (2012). [DOI] [PMC free article] [PubMed] [Google Scholar]
- 2.Dominissini D et al. Topology of the human and mouse m6A RNA methylomes revealed by m6A-seq. Nature 485, 201–6 (2012). [DOI] [PubMed] [Google Scholar]
- 3.Liu J et al. A METTL3-METTL14 complex mediates mammalian nuclear RNA N6- adenosine methylation. Nat Chem Biol 10, 93–5 (2014). [DOI] [PMC free article] [PubMed] [Google Scholar]
- 4.Wang Y et al. N6-methyladenosine modification destabilizes developmental regulators in embryonic stem cells. Nature cell biology 16, 191–8 (2014). [DOI] [PMC free article] [PubMed] [Google Scholar]
- 5.Sledz P & Jinek M Structural insights into the molecular mechanism of the m(6)A writer complex. Elife 5(2016). [DOI] [PMC free article] [PubMed] [Google Scholar]
- 6.Wang X et al. Structural basis of N-adenosine methylation by the METTL3-METTL14 complex. Nature (2016). [DOI] [PubMed] [Google Scholar]
- 7.Wang P, Doxtader KA & Nam Y Structural Basis for Cooperative Function of Mettl3 and Mettl14 Methyltransferases. Mol Cell 63, 306–17 (2016). [DOI] [PMC free article] [PubMed] [Google Scholar]
- 8.Wang Y & Zhao JC Update: Mechanisms Underlying N6-Methyladenosine Modification of Eukaryotic mRNA. Trends Genet 32, 763–773 (2016). [DOI] [PMC free article] [PubMed] [Google Scholar]
- 9.Jia G et al. N6-methyladenosine in nuclear RNA is a major substrate of the obesity- associated FTO. Nat Chem Biol 7, 885–7 (2011). [DOI] [PMC free article] [PubMed] [Google Scholar]
- 10.Caglayan AO et al. A patient with a novel homozygous missense mutation in FTO and concomitant nonsense mutation in CETP. J Hum Genet 61, 395–403 (2016). [DOI] [PMC free article] [PubMed] [Google Scholar]
- 11.Boissel S et al. Loss-of-function mutation in the dioxygenase-encoding FTO gene causes severe growth retardation and multiple malformations. Am JHum Genet 85, 106–11 (2009). [DOI] [PMC free article] [PubMed] [Google Scholar]
- 12.Hu WF, Chahrour MH & Walsh CA The diverse genetic landscape of neurodevelopmental disorders. Annu Rev Genomics Hum Genet 15, 195–213 (2014). [DOI] [PMC free article] [PubMed] [Google Scholar]
- 13.Geula S et al. Stem cells. m6A mRNA methylation facilitates resolution of naive pluripotency toward differentiation. Science 347, 1002–6 (2015). [DOI] [PubMed] [Google Scholar]
- 14.Hardwick LJ & Philpott A Nervous decision-making: to divide or differentiate. Trends Genet 30, 254–61 (2014). [DOI] [PMC free article] [PubMed] [Google Scholar]
- 15.Zheng G et al. ALKBH5 is a mammalian RNA demethylase that impacts RNA metabolism and mouse fertility. Molecular cell 49, 18–29 (2013). [DOI] [PMC free article] [PubMed] [Google Scholar]
- 16.Hess ME et al. The fat mass and obesity associated gene (Fto) regulates activity of the dopaminergic midbrain circuitry. Nat Neurosci 16, 1042–8 (2013). [DOI] [PubMed] [Google Scholar]
- 17.Mauer J et al. Reversible methylation of m6Am in the 5’ cap controls mRNA stability. Nature 541, 371–375 (2017). [DOI] [PMC free article] [PubMed] [Google Scholar]
- 18.Martynoga B, Morrison H, Price DJ & Mason JO Foxg1 is required for specification of ventral telencephalon and region-specific regulation of dorsal telencephalic precursor proliferation and apoptosis. Dev Biol 283, 113–27 (2005). [DOI] [PubMed] [Google Scholar]
- 19.Batista PJ et al. m(6)A RNA modification controls cell fate transition in mammalian embryonic stem cells. Cell stem cell 15, 707–19 (2014). [DOI] [PMC free article] [PubMed] [Google Scholar]
- 20.Wang X et al. N6-methyladenosine-dependent regulation of messenger RNA stability. Nature 505, 117–20 (2014). [DOI] [PMC free article] [PubMed] [Google Scholar]
- 21.Bannister AJ & Kouzarides T Regulation of chromatin by histone modifications. Cell Res 21, 381–95 (2011). [DOI] [PMC free article] [PubMed] [Google Scholar]
- 22.Avgustinova A & Benitah SA Epigenetic control of adult stem cell function. Nat Rev Mol Cell Biol 17, 643–58 (2016). [DOI] [PubMed] [Google Scholar]
- 23.Castelo-Branco G et al. Neural stem cell differentiation is dictated by distinct actions of nuclear receptor corepressors and histone deacetylases. Stem Cell Reports 3, 502–15 (2014). [DOI] [PMC free article] [PubMed] [Google Scholar]
- 24.Qiao Y, Wang R, Yang X, Tang K & Jing N Dual roles of histone H3 lysine 9 acetylation in human embryonic stem cell pluripotency and neural differentiation. J Biol Chem 290, 2508–20 (2015). [DOI] [PMC free article] [PubMed] [Google Scholar]
- 25.Roman-Trufero M et al. Maintenance of undifferentiated state and self-renewal of embryonic neural stem cells by Polycomb protein Ring1B. Stem Cells 27, 1559–70 (2009). [DOI] [PubMed] [Google Scholar]
- 26.Voncken JW et al. Rnf2 (Ring1b) deficiency causes gastrulation arrest and cell cycle inhibition. Proc Natl Acad Sci U S A 100, 2468–73 (2003). [DOI] [PMC free article] [PubMed] [Google Scholar]
- 27.Ishino Y et al. Bre1a, a histone H2B ubiquitin ligase, regulates the cell cycle and differentiation of neural precursor cells. JNeurosci 34, 3067–78 (2014). [DOI] [PMC free article] [PubMed] [Google Scholar]
- 28.Pereira JD et al. Ezh2, the histone methyltransferase of PRC2, regulates the balance between self-renewal and differentiation in the cerebral cortex. Proc Natl Acad Sci U S A 107, 15957–62 (2010). [DOI] [PMC free article] [PubMed] [Google Scholar]
- 29.Mohn F et al. Lineage-specific polycomb targets and de novo DNA methylation define restriction and potential of neuronal progenitors. Mol Cell 30, 755–66 (2008). [DOI] [PubMed] [Google Scholar]
- 30.Nakashima K et al. Synergistic signaling in fetal brain by STAT3-Smad1 complex bridged by p300. Science 284, 479–82 (1999). [DOI] [PubMed] [Google Scholar]
- 31.Wang J et al. CBP histone acetyltransferase activity regulates embryonic neural differentiation in the normal and Rubinstein-Taybi syndrome brain. Dev Cell 18, 114–25 (2010). [DOI] [PubMed] [Google Scholar]
- 32.Lim DA et al. Chromatin remodelling factor Mll1 is essential for neurogenesis from postnatal neural stem cells. Nature 458, 529–33 (2009). [DOI] [PMC free article] [PubMed] [Google Scholar]
- 33.Roopra A, Qazi R, Schoenike B, Daley TJ & Morrison JF Localized domains of G9a-mediated histone methylation are required for silencing of neuronal genes. Mol Cell 14, 727–38 (2004). [DOI] [PubMed] [Google Scholar]
- 34.Boyer LA et al. Polycomb complexes repress developmental regulators in murine embryonic stem cells. Nature 441, 349–53 (2006). [DOI] [PubMed] [Google Scholar]
- 35.Bernstein BE et al. A bivalent chromatin structure marks key developmental genes in embryonic stem cells. Cell 125, 315–26 (2006). [DOI] [PubMed] [Google Scholar]
- 36.Creyghton MP et al. Histone H3K27ac separates active from poised enhancers and predicts developmental state. Proc Natl Acad Sci U S A 107, 21931–6 (2010). [DOI] [PMC free article] [PubMed] [Google Scholar]
- 37.Wang Z et al. Combinatorial patterns of histone acetylations and methylations in the human genome. Nat Genet 40, 897–903 (2008). [DOI] [PMC free article] [PubMed] [Google Scholar]
- 38.Zhou R, Niwa S, Homma N, Takei Y & Hirokawa N KIF26A is an unconventional kinesin and regulates GDNF-Ret signaling in enteric neuronal development. Cell 139, 802–13 (2009). [DOI] [PubMed] [Google Scholar]
- 39.Ju YT et al. gas7: A gene expressed preferentially in growth-arrested fibroblasts and terminally differentiated Purkinje neurons affects neurite formation. Proc Natl Acad Sci US A 95, 11423–8 (1998). [DOI] [PMC free article] [PubMed] [Google Scholar]
- 40.Williams BP et al. A PDGF-regulated immediate early gene response initiates neuronal differentiation in ventricular zone progenitor cells. Neuron 18, 553–62 (1997). [DOI] [PubMed] [Google Scholar]
- 41.Li S et al. The transcription factors Egr2 and Egr3 are essential for the control of inflammation and antigen-induced proliferation of B and T cells. Immunity 37, 685–96 (2012). [DOI] [PMC free article] [PubMed] [Google Scholar]
- 42.Alarcon CR et al. HNRNPA2B1 Is a Mediator of m(6)A-Dependent Nuclear RNA Processing Events. Cell 162, 1299–308 (2015). [DOI] [PMC free article] [PubMed] [Google Scholar]
- 43.Xiao W et al. Nuclear m(6)A Reader YTHDC1 Regulates mRNA Splicing. Molecular cell 61, 507–19 (2016). [DOI] [PubMed] [Google Scholar]
- 44.Ben-Haim MS, Moshitch-Moshkovitz S & Rechavi G FTO: linking m6A demethylation to adipogenesis. Cell research 25, 3–4 (2015). [DOI] [PMC free article] [PubMed] [Google Scholar]
- 45.Meyer KD et al. 5’ UTR m(6)A Promotes Cap-Independent Translation. Cell 163, 999–1010 (2015). [DOI] [PMC free article] [PubMed] [Google Scholar]
- 46.Wang X et al. N(6)-methyladenosine Modulates Messenger RNA Translation Efficiency. Cell 161, 1388–99 (2015). [DOI] [PMC free article] [PubMed] [Google Scholar]
- 47.Greer EL & Shi Y Histone methylation: a dynamic mark in health, disease and inheritance. Nat Rev Genet 13, 343–57 (2012). [DOI] [PMC free article] [PubMed] [Google Scholar]
- 48.Karatas H et al. High-affinity, small-molecule peptidomimetic inhibitors of MLL1/WDR5 protein-protein interaction. JAm Chem Soc 135, 669–82 (2013). [DOI] [PMC free article] [PubMed] [Google Scholar]
REFERENCES:
- 49.Lee EC, et al. A highly efficient Escherichia coli-based chromosome engineering system adapted for recombinogenic targeting and subcloning of BAC DNA. Genomics 73, 56–65 (2001). [DOI] [PubMed] [Google Scholar]
- 50.Ogawa Y & Lee JT Xite, X-inactivation intergenic transcription elements that regulate the probability of choice. Mol Cell 11, 731–743 (2003). [DOI] [PubMed] [Google Scholar]
- 51.Yamada N, et al. Xist Exon 7 Contributes to the Stable Localization of Xist RNA on the Inactive X-Chromosome. PLoS Genet 11, e1005430 (2015). [DOI] [PMC free article] [PubMed] [Google Scholar]
- 52.Daikoku T, et al. Lactoferrin-iCre: a new mouse line to study uterine epithelial gene function. Endocrinology 155, 2718–2724 (2014). [DOI] [PMC free article] [PubMed] [Google Scholar]
- 53.George SH, et al. Developmental and adult phenotyping directly from mutant embryonic stem cells. Proc Natl Acad Sci U S A 104, 4455–4460 (2007). [DOI] [PMC free article] [PubMed] [Google Scholar]
- 54.Arai Y, et al. Neural stem and progenitor cells shorten S-phase on commitment to neuron production. Nat Commun 2, 154 (2011). [DOI] [PMC free article] [PubMed] [Google Scholar]
- 55.Bodi Z, Button JD, Grierson D & Fray RG Yeast targets for mRNA methylation. Nucleic Acids Res 38, 5327–5335 (2010). [DOI] [PMC free article] [PubMed] [Google Scholar]
- 56.Trapnell C, et al. Differential gene and transcript expression analysis of RNA-seq experiments with TopHat and Cufflinks. Nat Protoc 7, 562–578 (2012). [DOI] [PMC free article] [PubMed] [Google Scholar]
- 57.Langmead B & Salzberg SL Fast gapped-read alignment with Bowtie 2. Nat Methods 9, 357–359 (2012). [DOI] [PMC free article] [PubMed] [Google Scholar]
Associated Data
This section collects any data citations, data availability statements, or supplementary materials included in this article.
Supplementary Materials
Generation of conditional Mettl14 knockout mice. (a) Schematic diagram showing strategy used to create conditional Mettl14 knockout. (b-d) Representative genotyping PCR results using different primer sets for the targeted Mettl14 allele (b), the floxed Mettl14 allele (c), or the exon 2-deleted Mettl14 allele (d). Similar results were obtained from three independent experiments. (e) Representative images of wildtype and Mettl14 null embryos at E7.5. Similar results were obtained from three independent experiments. (f) Representative PCR results for sex determination. Similar results were obtained from three independent experiments. (g) Representative images of pups at P0. Scale bar: 5 mM. (h) Quantification of pup body weight at P0, one-way ANOVA (WT: n = 16, KO: n = 7, and Het: n = 8 P0 pups; P = 0.1719, F (2, 28) = 1.877) followed by Bonferroni’s post hoc test (WT vs. KO, P = 0.4198, 95% C.I. = −0.09762 to 0.3285, WT vs. Het, P = 0.6836, 95% C.I. = −0.2867 to 0.1205). (i) Survival curve of newborn mice with or without brain-specific Mettl14 deletion (Mettl14 f/f: n = 12, Mettl14 f/+: n = 10,Mettl14 f/+;nes-cre: n = 12,Mettl14f/f;nes-cre: n = 14 animals). Graphs represent mean ± SD. Dots represent data from individual data points. ns = non-significant.
Mettl14 regulates self-renewal of cortical NSCs in vitro. (a) Western blots showing Mettl14 depletion in Mettl14 KO NSCs. Similar results were obtained from three independent experiments. For uncropped images, see Supplementary Fig. 6b. (b) Growth curve of cortical NSCs isolated from E17.5 brain. Two-way ANOVA (n = 3 cell cultures for all experimental groups; P = 3E-15, F (2, 18) = 357.5) followed by Bonferroni’spost hoc test (WT vs. KO, P = 2.5E-14, 95% C.I. = 0.09616 to 0.1196, WT vs. Het, P = 0.4346, 95% C.I. = −0.01786 to 0.005595). (c,d) Assessment of apoptosis in Mettl14 KO and nondeleted control NSCs. The number of apoptotic cells was determined by FACS analysis via Annexin V-FITC and PI-staining. Representative results are shown in (c) and results from 3 independent experiments are summarized in (d). One-way ANOVA (n = 3 cell cultures for all experimental groups; P = 0.6882, F (2, 6) = 0.3979) followed by Bonferroni’s post hoc test (WT vs. KO, P = 0.8321, 95% C.I. = −1.999 to 3.666, WT vs. Het, P = 0.9999, 95% C.I. = −2.266 to 3.399). (e) Quantification of TUNEL assays in Mettl14 KO and control NSCs. One-way ANOVA (n = 3 fields for all experimental groups; P = 0.7572, F (2, 6) = 0.2915) followed by Bonferroni’s post hoc test (WT vs. KO, P = 0.9999, 95% C.I. = −50.16 to 32.35, WT vs. Het, P = 0.9999, 95% C.I. = −40.71 to 41.81). (f) Western blots showing expression of Flag-tagged Mettl14 in WT and Mettl14 KO NSCs transduced by lentivirus containing empty or Flag-Mettl14 vectors. Similar results were obtained from three independent experiments. For uncropped images, see Supplementary Fig. 6c. (g) m6A dot-blots of Ribo- polyA RNAs isolated from Mettl14 KO and nondeleted NSCs transduced with lentivirus containing empty or Flag-Mettl14 vectors. Similar results were obtained from three independent experiments. (h) RT-qPCR of Alkbh5 transcripts in NSCs expressing scramble (scr) shRNA or shRNAs against Alkbh5, one-way ANOVA (n = 3 independent experiments for all experimental groups; P = 7.511E-08, F (2, 6) = 708) followed by Bonferroni’spost hoc test (Scr vs. shAlkbh5–1, P = 1.06113E-07, 95% C.I. = 0.8453 to 1.013, Scr vs. shAlkbh5–2, P = 1.164E-07, 95% C.I. = 0.831 to 0.9991). (i) Western blots showing Alkbh5 depletion in NSCs expressing scramble (scr) shRNA or shRNAs against Alkbh5. Similar results were obtained from two independent experiments. For uncropped images, see Supplementary Fig. 6d. (j) Growth curve of NSCs expressing scr shRNA or shRNAs against Alkbh5. Two-way ANOVA (n = 4 cell cultures for all experimental groups; P = 0.0626, F (2, 27) = 3.075) followed by Bonferroni’s post hoc test (Scr vs. shAlkbh5–1, P = 0.0928, 95% C.I. = −0.2273 to 3.548, Scr vs. shAlkbh5–2, P = 0.0726, 95% C.I. = −0.1353 to 3.64). (k) RT-qPCR of Fto transcripts in NSCs expressing scramble (scr) shRNA or shRNAs against Fto, one-way ANOVA (n = 3 independent experiments for all experimental groups; P = 1.324E-06), F (2, 6) = 270.2) followed by Bonferroni’s post hoc test (Scr vs. shFto-1, P = 2.396E-06, 95% C.I. = 0.6521 to 0.887, Scr vs. shFto-2, P = 1.629E-06, 95% C.I. = 0.6521 to 0.887). (l) Western blots showing Fto depletion in NSCs expressing scramble (scr) shRNA or shRNAs against Fto. Similar results were obtained from two independent experiments. For uncropped images, see Supplementary Fig. 6e. (m) Growth curve of NSCs expressing scr shRNA or shRNAs against Fto. Two-way ANOVA (n = 4 cell cultures for all experimental groups; P = 0.0005, F (2, 27) = 10.1) followed by Bonferroni’s post hoc test (Scr vs. shFto-1, P = 0.0538, 95% C.I. = −1.604 to 0.01121, Scr vs. shFto, P = 0.0809, 95% C.I. = −0.07525 to 1.54). Graphs represent mean ± SD. Dots represent data from individual data points. ns = non-significant. **** P < 0.0001.
Mettl14 deficiency decreases RGC proliferation in vivo. (a-c) Coronal sections of E15.5 brains stained with antibodies recognizing BrdU, PH3, and PAX6. Pregnant mothers received a BrdU pulse 30 min prior to embryo collection. (d) Quantification of immunostaining from E15.5 sections. Numbers of Pax6+, BrdU+ and PH3+ cells were determined and normalized to comparable sections from nondeleted mice, one-way ANOVA (n = 3 brain sections for all experimental groups; Pax6+, P = 0.5647, F (2, 6) = 0.6296; BrdU+, P = 0.0159, F (2, 6) = 8.942; PH3+, P = 0.016, F (2, 6) = 8.912) followed by Bonferroni’spost hoc test (Pax6+, WT vs. KO, P = 0.8495, 95% C.I. = −0.342 to 0.6193, WT vs. Het, P = 0.9999, 95% C.I. = −0.5131 to 0.4483; BrdU+, WT vs. KO, P = 0.0442, 95% C.I. = 0.007399 to 0.4702, WT vs. Het, P = 0.7184, 95% C.I. = −0.3088 to 0.154; PH3+, WT vs. KO, P = 0.0134, 95% C.I. = 0.1228 to 0.7966, WT vs. Het, P = 0.7164, 95% C.I. = −0.224 to 0.4498). (e,f) Coronal sections of E13.5 brain stained with anti-Pax6, anti-BrdU, or anti-PH3 antibodies. Pregnant mothers were pulsed with BrdU 30 min prior to embryo collection. (g) Quantification of immunostaining from E13.5 sections. Numbers of Pax6+, BrdU+ and PH3+ cells were determined and normalized to comparable sections from nondeleted mice, one-way ANOVA (n = 3 brain sections for all experimental groups; Pax6+, P = 0.7735, F (2, 6) = 0.2682; BrdU+, P = 0.6595, F (2, 6) = 0.4466; PH3+, P = 0.9675, F (2, 6) = 0.03325) followed by Bonferroni’s post hoc test (Pax6+, WT vs. KO, P = 0.9999, 95% C.I. = −0.364 to 0.403, WT vs. Het, P = 0.9999, 95% C.I. = −0.454 to 0.3131; BrdU+, WT vs. KO, P = 0.8695, 95% C.I. = - 0.2011 to 0.359, WT vs. Het, P = 0.9999, 95% C.I. = −0.2765 to 0.2836; PH3+, WT vs. KO, P = 0.9999, 95% C.I. = −0.1804 to 0.2045, WT vs. Het, P = 0.9999, 95% C.I. = −0.1764 to 0.2086). (h) Immunostaining of coronal sections of E17.5 and E15.5 brain using Cleaved-Caspase-3 antibody. (i) Quantification of Cleaved-Caspase-3+ cell number, based on immunostaining. One-way ANOVA (n = 3 brain sections for all experimental groups; E17.5, P = 0.1834, F (2, 6) = 2.28; E15.5, P = 0.6596, F (2, 6) = 0.4463) followed by Bonferroni’s post hoc test (E17.5, WT vs. KO, P = 0.5745, 95% C.I. = −11.83 to 27.16, WT vs. Het, P = 0.744, 95% C.I. = −25.83 to 13.16; E15.5, WT vs. KO, P = 0.9999, 95% C.I. = −36.44 to 32.44, WT vs. Het, P = 0.9991, 95% C.I. = −26.11 to 42.77). (j,k) Immunostaining of coronal sections of E15.5 brain with antibodies to the intermediate progenitor marker anti-Tbr2 and the proneural marker anti-Neurod2. Dashed white lines indicate border of VZ/SVZ area. Similar results were obtained from three independent experiments. Scale bars: 100 μM. Graphs represent mean ± SD. Dots represent data from individual data points. ns = non-significant. * P < 0.05.
m6A regulates NSC gene expression through histone modifications. (a) Numbers of gene counts and exact P values for each GO term displayed in Fig. 5b and 5c. (b) The association between m6A targets and differential gene expression in Mettl14 KO vs. nondeleted control NSCs determined by two-tailed Fisher’s Exact Test. A transcript is defined as an m6A target when a m6A peak is detected from either one of the two biological replicates in m6A meRIP-seq experiment. The numbers of genes in each category and exact P value are shown in the graph. (c) MTT cell growth assay of NSCs treated with vehicle/DMSO or the MLL1 inhibitor MM-102, the CBP/P300 inhibitor C646, or the Ezh2 inhibitor GSK343. Shown is the absorbance ratio of heterozygous to non-deleted controls at each dose. One-way ANOVA (n = 3 independent experiments for all experimental groups; GSK343, P = 0.1352, F (3, 8) = 2.482; C646, P = 0.0528, F (3, 8) = 3.971; MM-102, P = 0.5055, F (3, 8) = 0.8478) followed by Bonferroni’spost hoc test (GSK343, c vs. 1.25, P = 0.9999, 95% C.I. = −0.2624 to 0.1392, c vs. 2.5, P = 0.0932, 95% C.I. = −0.3746 to 0.02694, c vs. 5, P = 0.3732, 95% C.I. = −0.3151 to 0.08651; C646, c vs. 1.25, P = 0.3132, 95% C.I. = −0.1995 to 0.04874, c vs. 2.5, P = 0.4435, 95% C.I. = −0.0582 to 0.1901, c vs. 5, P = 0.9999, 95% C.I. = −0.1164 to 0.1319; MM-102, c vs. 0.0625, P = 0.9999, 95% C.I. = −0.1997 to 0.3001, c vs. 1.25, P = 0.9999, 95% C.I. = −0.3251 to 0.1747, c vs. 2.5, P = 0.9999, 95% C.I. = −0.2263 to 0.2734). Graphs represent the mean ± SD. Dots represent data from individual data points.
Low enrichment of m6A on mRNAs encoding Ezh2, Suz12, and Eed. m6A-meRIP-qPCR of Ezh2, Suz12, and Eed in Mettl14 KO vs. control E14.5 NSCs. One-way ANOVA (n = 3 independent experiments for all experimental groups; Ezh2, P = 0.0812, F (2, 6) = 3.928; Suz12, P = 5.055E-06, F (2, 6) = 171.8; Eed, P = 0.00012, F (2, 6) = 57.32) followed by Bonferroni’s post hoc test (Ezh2, WT vs. KO, P = 0.0739, 95% C.I. = −0.004323 to 0.08219, WT vs. Het, P = 0.1679, 95% C.I. = −0.0131 to 0.07341; Suz12, WT vs. KO, P = 3.125E-05, 95% C.I. = 0.2091 to 0.3387, WT vs. Het, P = 0.0029, 95% C.I. = −0.1855 to −0.05595; Eed, WT vs. KO, P = 9.828E-05, 95% C.I. = 0.02144 to 0.03883, WT vs. Het, P = 0.0823, 95% C.I. = - 0.001105 to 0.01628). Graphs represent the mean ± SD. Dots represent data from individual data points. ns = non-significant. **** P < 0.0001.
Uncropped western blot images (a) Corresponding uncropped images of western blots shown in Fig. 5d. (b) Corresponding uncropped images of western blots shown in Supplementary Fig. 2a. (c) Corresponding uncropped images of western blots shown in Supplementary Fig. 2f. (d) Corresponding uncropped images of western blots shown in Supplementary Fig. 2i. (e) Corresponding uncropped images of western blots shown in Supplementary Fig. 2l. The protein standards are depicted to the left of the images.
Genotypes of born pups from Mettl14 +/− x Mettl14 +/− crosses
Genotypes of E7.5, E8.5, and E9.5 embryos from Mettl14 +/− x Mettl14 +/− crosses.
RNA-seq analysis of E14.5 Mettl14 KO NSC vs. nondeleted control from 3 independent experiments.
Peaks detected from methylated RIP-seq experiments. Results from the biological replicates were listed in two separately spreadsheets.
H3K27ac ChIP-seq peaks located within 10 Kb up- or down-stream of transcription start sites
H3K27–3me ChIP-seq peaks located within 2 Kb up-stream of transcription start sites
List of PCR primers used in this study.