

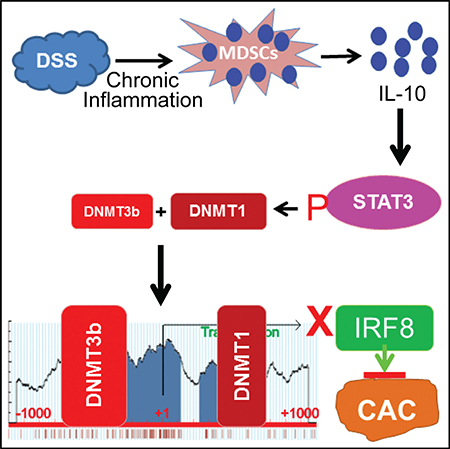
SUMMARY
IL-10 functions as a suppressor of colitis and colitis-associated colon cancer, but it is also a risk locus associated with ulcerative colitis. The mechanism underlying the contrasting roles of IL-10 in inflammation and colon cancer is unknown. We report here that inflammation induces the accumulation of CD11b+Gr1+ myeloid-derived suppressor cells (MDSCs) that express high levels of IL-10 in colon tissue. IL-10 induces the activation of STAT3 that directly binds to the Dnmt1 and Dnmt3b promoters to activate their expression, resulting in DNA hypermethylation at the Irf8 promoter to silence IRF8 expression in colon epithelial cells. Mice with Irf8 deleted in colonic epithelial cells exhibit significantly higher inflammation-induced tumor incidence. Human colorectal carcinomas have significantly higher DNMT1 and DNMT3b and lower IRF8 expression, and they exhibit significantly higher IRF8 promoter DNA methylation than normal colon. Our data identify the MDSC-IL-10-STAT3-DNMT3b-IRF8 pathway as a link between chronic inflammation and colon cancer initiation.
In Brief
Ibrahim et al. report that chronic inflammation induces colonic accumulation of myeloid-derived suppressor cells (MDSCs) that upregulates IL-10. IL-10 directly regulates STAT3 activation to upregulate DNMT3b to silence tumor suppressor IRF8 in colonic epithelial cells. The MDSC-IL-10-STAT3-DNMT3b-IRF8 pathway links chronic inflammation to colon cancer initiation.
Graphical Abstract
INTRODUCTION
Patients with inflammatory bowel disease (IBD), particularly ulcerative colitis (UC), have a significantly higher risk of developing colorectal cancer (CRC). Colitis-associated colorectal cancer (CAC) is considered the most serious complication of IBD (Lasry et al., 2016). Interferon regulatory factor 8 (IRF8) is a transcription factor of the interferon (IFN) regulatory factor family, which plays an essential role in lineage-specific hematopoietic differentiation (Feng et al., 2011; Holtschke et al., 1996; Kim et al., 2015). IRF8 is also expressed and functional in non-hematopoietic epithelial cells (Yan et al., 2016). Genome-wide association studies (GWASs) have implied that IRF8 plays a role in IBD (Barrett et al., 2008; Elding et al., 2013; Jostins et al., 2012). More recently, IRF8 has been shown to function as a critical regulator of inflammation through regulating cytokine production and pyroptosis (Karki et al., 2018). However, the mechanism underlying IRF8 function in CAC is unknown.
Interleukin 10 (IL-10) is historically considered to be an anti-inflammatory cytokine that functions to suppress chronic inflammation and CAC (Lee et al., 2016b; Moschen et al., 2016; Murata et al., 2015). However, IL-10 also plays a key role in the modulation of host cancer immune surveillance (Dennis et al., 2015; Mumm et al., 2011). Overexpression of IL-10 or treatment with a pegylated IL-10 led to tumor rejection and long-lasting tumor immunity in tumor-bearing mice (Oft, 2014). IL-10 suppresses tumor development through inducing cytotoxic T lymphocyte (CTL) activation (Mumm et al., 2011) and inhibiting inflammatory cytokine production to hamper Treg and myeloid-derived suppressor cells (MDSCs) (Tanikawa et al., 2012). IL-10 is also identified by GWASs as being associated with IBD (Jostins et al., 2012). Inconsistent with GWAS observations, IL-10 also has been shown to act as a tumor promoter. An IL-10 autocrine or paracrine loop enhances tumor cell survival and escape from host immune surveillance (Gonzalez-Aparicio et al., 2011; Ruffell et al., 2014). However, the molecular mechanisms underlying the complex functions of IL-10 as an anti-inflammatory cytokine and an IBD-associated risk factor and the contrasting roles of IL-10 in cancer immune surveillance and tumor evasion have not been identified.
We aimed at determining the mechanistic link between IL-10 and IRF8 in the context of chronic colonic inflammation and to test the hypothesis that IRF8 is a CAC suppressor. To this end, we determined that the MDSC-IL-10-signal transducer and activator of transcription 3 (STAT3)-DNA methyltransferase (DNMT) 3b-IRF8 pathway links chronic inflammation to colon cancer initiation.
RESULTS
IRF8 Functions as a Suppressor of Spontaneous Colon Cancer
Mice with IRF8 deficiency only in colon epithelial cells (termed IRF8cKO) were created by crossing Irf8-floxed mice with villincre mice (Figures S1A and S1B) with the deletion of exon 2 (Figure S1C). As reported in the literature, we observed that IRF8KO mice exhibit elevated levels of CD11b+Gr1+ MDSCs as compared to wild-type (WT) mice. However, IRF8cKO mice exhibit similar levels of CD11b+Gr1+ MDSCs to WT mice (Figures S2A and S2C). The profiles of CD4+ and CD8+ T cells in IRF8cKO mice are also similar to those of WT mice (Figures S2B and S2C). IRF8cKO mice are more susceptible to chronic inflammation because dextran sodium sulfate (DSS) treatment resulted in significant greater weight loss and higher mortality as compared to C57BL/6, heterogenous Irf8-floxed (Irf8f+/−), and heterogenous villin-cre (Vil1-cre+/−) control mice (Figure 1A). IRF8 deficiency also results in significantly increased numbers of Ki67+ colon epithelial cells in the stem cell and amplifying proliferating cell zones of the crypt as compared to WT mice (Figures 1B and 1C). Epithelial cells in the differentiating cell zone of the colon exhibit high levels of spontaneous apoptosis. IRF8 deficiency results in significantly decreased spontaneous apoptosis of these differentiating cells (Figures 1D and 1E). The Ki67 mRNA level is also significantly higher in the colon of IRF8cKO mice as compared to WT mice (Figure 1F). The IRF8 WT control mice and IRF8cKO mice were then treated with three cycles of azoxymethane (AOM)-DSS, and the colon tissues were analyzed for tumor nodules. Significantly more tumor nodules were observed in the colon tissues of IRF8cKO mice as compared to the C57BL/6, Irf8f+/−, and Vil1-cre+/− control mice (Figure 1G). Analysis of IRF8 mRNA levels in normal human colon and colorectal carcinoma revealed that IRF8 is downregulated in the tumor tissues as compared to normal tissues (Figure 1H). We therefore conclude that IRF8 is a suppressor of inflammationinduced spontaneous colon cancer.
Figure 1. IRF8 Is a Tumor Suppressor of Chronic Inflammation-Induced Colon Cancer.

(A) WT C57BL/6 (n = 6), heterogenous villin-cre (Vil-cre+/−) (n = 8), heterogenous Irf8-floxed (Irf8f+/−) (n = 10), and IRF8cKO (n = 13) mice were injected with AOM and then treated with 2% DSS-water cycles, as described in the Method Details. Mice were weighed every 2 days for 28 days. For survival analysis, WT C57BL/6 (n = 16), Vil-cre+/− (n = 8), Irf8f+/− (n = 10), and IRF8cKO (n = 33) mice were injected with AOM and then treated with the 2% DSS-water cycles. Mice survival was recorded and plotted against days.
(B and C) Colon tissue from 3-month-old male WT (n = 3) and IRF8cKO (n = 3) mice without any treatment were sectioned and stained with the Ki67-specific antibody. Shown are representative images of one of the three mice (B). Scale bar, 50 μm. (B) Ki67+ cells were quantified in 20 crypts per mouse and presented in (C).
(D and E) Colon tissue from 3-month-old male WT (n = 3) and IRF8cKO (n = 3) mice without any treatment were sectioned and stained by TUNEL. Shown are representative images of one of the three mice (D). Scale bar, 50 μm. TUNEL+ cells were quantified in 20 crypts per mouse and presented in (E).
(F) Colon tissues were collected from WT (n = 5) and IRF8cKO (n = 5) mice and analyzed by qPCR using mouse Ki67 cDNA-specific primers. β-Actin was used as an internal control. Each column represents the mean of triplicates of one mouse. Five mice were used in each group.
(G) WT C57BL/6 (n = 20), Vil1-cre+/− (n = 8), Irf8f+/− (n = 10), and IRF8cKO (n = 13) mice were treated with the AOM/DSS-water cycles, as described in the Method Details. Shown are representative images of tumor-bearing colon tissues from WT and IRF8cKO mice (left). The tumor nodule numbers were quantified (right).
(H) IRF8 mRNA expression datasets of human colon carcinoma (n = 380) and normal colon tissues (n = 51) were extracted from TCGA database and compared.
Chronic Inflammation Silences IRF8 Expression
An IRF8-GFP reporter mouse was used to monitor IRF8 expression (Wang et al., 2014). IRF8 is expressed in the colon crypt in a gradient pattern, with the highest IRF8 protein levels in the differentiating and differentiated cell zones and relatively low levels in the amplifying proliferating and stem cell zones of tumor-free mice. However, IRF8 expression is silenced in the AOM-DSS-treated mice with colon cancer (Figure 2A). RT-PCR and western blotting analysis validated that IRF8 mRNA and protein levels are higher in colon tissues from tumor-free mice than in tumorbearing colon tissues from AOM-DSS-treated mice (Figure 2B). The IRF8 protein level in normal colon tissue is as high as it is in myeloid cells (Figure 2C). IRF-GFP reporter mice were then treated with DSS only, followed by water recovery. DSS treatment alone is sufficient to diminish IRF8 protein levels in colon epithelial cells, and IRF8 is silenced approximately 21 days after DSS treatment (Figure 2D). RT-PCR and western blotting analysis of the colon tissues validated that Irf8 expression is silenced 21 days after treatment with DSS (Figure 2E). These observations demonstrate that chronic inflammation silences IRF8 expression in colon epithelial cells.
Figure 2. Chronic Inflammation Silences IRF8 Expression in Colonic Epithelial Cells.

(A) IRF8-GFP reporter mice were treated with the AOM-DSS cycle to induce colitis-associated colon cancer. Colon tissues from normal (negative control, n = 3), untreated IRF8-GFP reporter (normal colon, n = 3), and AOM-DSS-treated GFP-reporter (colon cancer, n = 3) mice were fixed and frozen. The frozen sections were stained with DAPI and analyzed for GFP fluorescence intensity using a confocal microscope. Shown are representative images. Scale bar, 50 μm.
(B) RNA was extracted from the colon tissues of tumor-free (colon, n = 4) and tumor-bearing (tumor, n = 4) mice and cultured RAW264 cells and analyzed for IRF8 mRNA expression levels by qPCR using IRF8-specific primers. β-Actin was used as an internal control. Each column represents the mean of triplicates from one mouse. Four mice were included in each group. Bar, SD. RAW264 was used as a positive control for IRF8 expression.
(C) Colon tissues of tumor-free (colon, n = 3) and tumor-bearing (tumor, n = 3) mice and cultured RAW264 cells were lysed and analyzed by western blotting analysis using IRF8-specific antibody. β-Actin was used as a normalization control.
(D) IRF8-GFP reporter mice were treated with DSS in drinking water for 7 days, followed by drinking water for 14 days, then DSS again for 7 days. Colon tissues were collected at days 0, 7, 14, 21, and 28 and analyzed for GFP fluorescence intensity. Normal mice were used as negative controls. Scale bar, 50 μm.
(E) Total protein lysate was prepared from the colon tissue of mice as in (C) at days 0, 7, 14, 21, and 28 and analyzed for IRF8 protein level by western blotting. β-Actin was used as a normalization control.
Chronic Inflammation Induces the Irf8 Promoter DNA Hypermethylation in Colon Carcinoma Cells
Because IRF8 is silenced in colon carcinoma cells by DNA methylation (McGough et al., 2008), we hypothesized that DSS-induced inflammation silences IRF8 expression in colon epithelial cells. To test this hypothesis, we analyzed DNA methylation in the Irf8 promoter in normal colon and tumor-bearing colon tissues. The Irf8 promoter contains a CpG island (Figure 3A). Bisulfite DNA sequencing revealed no methylated CpG in normal colon tissues. However, the majority of CpGs were methylated in the AOM-DSS-induced colon tumor tissues (Figure 3A). Methylation-sensitive PCR validated that the Irf8 promoter DNA is hypermethylated (Figure 3B). The Irf8 promoter CpG island is partially methylated in the human colon epithelial CCD841 cells but heavily methylated in human colon carcinoma HCT116 cells (Figure 3C). Analysis of The Cancer Genome Atlas (TCGA) datasets revealed the Irf8 promoter DNA has significantly higher methylation levels in tumors than in normal colon tissue (Figure 3D). Knocking out DNMT1 alone results in no demethylation of the Irf8 promoter and a minimal increase in IRF8 expression, whereas knocking out DNMT3b alone results in demethylation of the Irf8 promoter and upregulation of IRF8 expression in HCT116 cells. However, knocking out both DNMT1 and DNMT3b leads to demethylation of the Irf8 promoter and upregulation of IRF8 expression in HCT116 cells (Figures 3E and 3F). We therefore conclude that DSS-induced chronic inflammation upregulates DNMT1 and DNMT3b to methylate the Irf8 promoter.
Figure 3. The Irf8 Promoter Is Hypermethylated in Chronic Inflammation-Induced Colon Tumor.

(A) The mouse Irf8 promoter structure. The CpG islands are indicated by blue, transcription initiation site is indicated by +1. The numbers above the bar indicate the nucleotide location relative to the Irf8 transcription initiation site. Bottom: genomic DNA was extracted from the colon tissues of normal tumor-free mice (n = 3) and the colon tumor tissues of AOM-DSS-treated mice (n = 3) and modified with bisulfite. The modified genomic DNA was then amplified with bisulfite-modified DNA-specific primers to amplify a CpG island region, as indicated under the CpG island (–348 to +156). The amplified DNA fragments were cloned and sequenced. Each circle represents a CpG dinucleotide. Open circles indicate unmethylated CpG, and closed circles represent methylated CpG.
(B) The bisulfite-modified genomic DNA as in (A) was also analyzed by methylation-specific (MS)-PCR. U, unmethylated; M, methylated.
(C) Bisulfite-sequencing analysis of the CpG island region in the Irf8 promoter of colon epithelial CCD841 and colon carcinoma HCT116 cells. Each circle represents a CpG dinucleotide. Open circles indicate unmethylated CpG, and closed circles represent methylated CpG.
(D) The Irf8 promoter DNA methylation datasets of normal human colon tissues and colorectal carcinoma tissues were extracted from TCGA database and compared.
(E) MS-PCR analysis of the Irf8 promoter region in WT, DNMT1−/−, DNMT3b−/− and DKO of HCT116 cells. U, unmethylated; M, methylated.
(F) RNA was extracted from WT, DNMT1−/−, DNMT3b−/−, and DKO of HCT116 cells and analyzed for IRF8 mRNA expression levels by semiquantitative RT-PCR (right top) and qPCR (left) using β-actin as an internal control. Bar, SD. Bottom right: the IRF8 protein level was analyzed by western blotting using IRF8-specific antibody. β-Actin was used as a normalization control.
Chronic Inflammation Induces Upregulation of DNMT1 and DNMT3b in Colon Epithelial Cells
DNMT1 and DNMT3b protein and transcript levels are significantly higher in tumor tissues as compared to normal colon tissues, whereas DNMT3a expression levels are not significantly different between the normal and the tumor-bearing colon tissues (Figure 4A). DNMT1 and DNMT3b expression levels are also significantly higher in human colorectal carcinoma tissues as compared to normal colon tissues (Figure 4B). DSS treatment induces inflammation in the mouse colon, and the degree of inflammation increases with time, with the highest inflammation grade observed 21 days after DSS treatment (Figure 4C). DNMT3a is constitutively expressed in colon tissues, and the expression of DNMT1 and DNMT3b is upregulated approximately 21 days after DSS treatment (Figure 4D). We therefore conclude that DSS-induced chronic inflammation upregulates DNMT1 and DNMT3b in the colon.
Figure 4. Chronic Inflammation Upregulates DNMT1 and DNMT3b Expression in Colonic Epithelial Cells.

(A) RNA was isolated from colon tissues of tumor-free control mice (n = 3) and tumor tissues of AOM-DSS-treated mice (n = 3) and analyzed for the expression levels of DNMT1, DNMT3a, and DNMT3b by semiquantitative RT-PCR (left) and qPCR (right) using β-actin as an internal control. Each column represents the mean of triplicates from one mouse. Bar, SD. Three mice are included in each group.
(B) DNMT1 and DNMT3b mRNA expression datasets in normal human colon tissues (n = 51) and human colorectal carcinoma tissues (n = 380) were extracted from TCGA database and compared.
(C) WT C57BL/6 mice were treated with the 2% DSS-water cycle, as described in the STAR Methods. Colon tissues were collected at the indicated time points (n = 3) and sectioned and stained by H&E. The stained sections were analyzed for the inflammation scores based on the grades, as described in STAR Methods. Scale bar, 100 μm.
(D) RNA was extracted from the colon tissues of mice treated with the 2% DSS-water cycle, as described in STAR Methods at the indicated time points, and analyzed for Dnmt1, Dnmt3a, and Dnmt3b mRNA levels by RT-PCR.
MDSCs and IL-10 Are Increased in the Inflamed Colon
DSS treatment increased the expression levels of IL-6, IL-10, IL-22, IFNγ, and CD11b in the colon (Figures 5A and S3). The upregulation kinetics of IL-10 and CD11b correlate with IRF8 silencing in the colon tissue (Figures 2 and 5A). CD11b and IL-10 are elevated in tumor-bearing tissues as compared to normal colon tissues (Figure 5B), and IL-10 is elevated in CD11b+ cells upon DSS-induced inflammation (Figure S4). Consistent with increased CD11b expression, analysis of spleen cells from DSS-treated mice validated that CD11b+Gr1+ MDSCs are significantly increased after DSS treatment (Figures 5C and 5D). CD4+ and CD8+ T cell frequencies only decreased 21 days after DSS treatment but recovered at day 28 (Figure S5). Cells were then extracted from the lamina propria of colon tissues and analyzed for MDSC frequencies. It is clear that DSS treatment also significantly increased MDSC frequencies in the lamina propria (Figure 5E). DSS treatment significantly increased the frequencies of IL-10+ cells in the spleen (Figures 5F and 5G) and the lamina propria (Figures 5H and 5I). Furthermore, the majority of IL-10+ cells in both spleen and the lamina propria are also CD11b+Gr1+ (Figures 5F–5I). We therefore conclude that DSS-induced inflammation increases CD11b+Gr1+ MDSCs that produce IL-10.
Figure 5. Chronic Inflammation Induces IL-10+ MDSC Accumulation in Colon Lamina Propria.

(A) RNA was isolated from colon tissues from mice treated with DSS at days 0, 7,14,21, and 28 and analyzed for IL-10 and CD11b mRNA expression levels by RT-PCR.
(B) RNA was isolated from colon tissues from tumor-free control mice (n = 3) and from tumor tissues of AOM/DSS-treated mice (n = 3) and analyzed for the expression levels of IL-10 and CD11b by semiquantitative RT-PCR (left) and q-RT-PCR (right) using β-actin as an internal control. Each column represents the mean of triplicates of one mouse. Bar, SD.
(C) CD11b+Gr1+ MDSC profiles in the spleen cells of mice at days 0, 7, 14, 21, and 28 after DSS treatment, as in (A). Shown are representative results from one of three mice.
(D) Quantitation of CD11b+Gr1+, as shown in (C). Bar, SD.
(E) CD11b+Gr1+ MDSC levels in the lamina propria of colon tissues from control mice (n = 3) and DSS-treated mice (n = 3). Shown are representative results. The percentage of CD11b+ Gr1+ cells was quantified (right). Bar, SD.
(F) Spleen cells were stained with CD11b- and Gr1-specific antibodies, followed by intracellular staining with IL-10-specific antibody. The IL-10+ cells were then gated and analyzed for CD11b+Gr1+ cells. Shown are representative results from one of three mice.
(G) Quantification of the percentage of IL10+ spleen cells (left) and the percentage of CD11b+Gr1+ in the IL-10+ spleen cells (right). Bar, SD.
(H) Lamina propria cells were extracted from colon tissues and stained with CD11b- and Gr1-specific antibodies, followed by intracellular staining with IL-10-specific antibody. The IL-10+ cells were then gated and analyzed for CD11b+Gr1+ cells. Shown are representative results from one of three mice.
(I) Quantification of the percentage of IL-10+ lamina propria cells (left) and the percentage of CD11b+Gr1+ in the IL-10+ lamina propria cells (right). Bar, SD.
IL-10 Upregulates DNMT1 and DNMT3b Expression in Colon Epithelial Cells
To determine whether IL-10 regulates DNMT1 and DNMT3b expression, we treated CCD841 and HT29 cells with recombinant IL-10 protein. RT-PCR analysis revealed that IL-10 stimulated DNMT1 and DNMT3b expression in a dose-dependent manner (Figure 6A). Western blot analyses show that DNMT1 and DNMT3b protein levels are increased and the IRF8 protein level is decreased in IL-10-treated cells (Figure 6B). To validate the above findings that IL-10 regulates DNMT1 and DNMT3b expression in colon epithelial cells, we treated WT and IL-10 KO mice with DSS and analyzed colon tissues for DNMT1 and DNMT3b protein levels. Western blot analyses indicate high DNMT1 protein levels in the colon tissues from DSS-treated mice. However, DSS failed to induce DNMT3b in the colon tissues of IL-10 KO mice (Figure 6C). Furthermore, colon tissues from IL-10 KO mice exhibited significantly higher IRF8 expression levels after DSS treatment (Figure 6D). Luciferase reporter assay with methylated IRF8 promoter indicated that methylation silences Irf8 promoter activity (Figure 6E). These observations indicate that IL-10 upregulates DNMT3b expression in colon epithelial cells to silence IRF8 expression in vivo.
Figure 6. IL-10 Upregulates DNMT1 and DNMT3b Expression in Colon Epithelial and Carcinoma Cells.

(A) Colonic epithelial CCD841 and colon carcinoma HT29 cells were treated with recombinant IL-10 at the indicated doses for 24 hr and analyzed for DNMT1 and DNMT3b mRNA expression levels by semiquantitative RT-PCR (top) and qPCR (bottom) using β-actin as an internal control. Bar, SD.
(B) CCD841 and HT29 cells were treated with recombinant IL-10 (100 ng/mL) for 24 hr and analyzed by western blotting analysis of DNMT1, DNMT3b (left), and IRF8 (right) protein levels.
(C) WT (n = 4) and IL-10 KO (n = 5) mice were treated with the DSS-water cycle, as described in STAR Methods for 28 days. Colon tissues were collected and analyzed by western blotting for DNMT1 and DNMT3b protein levels.
(D) WT (n = 3) and IL-10 KO (n = 3) mice were treated with the 2% DSS-water cycle, as described in STAR Methods. Colon tissues were collected at day 28 and analyzed by qPCR for the IRF8 mRNA level with β-actin as an internal control. Bar, SD.
(E) The pGL3 vector containing the human IRF8 promoter was treated with methylase in vitro and transfected to CCD841 cells overnight. Cells were lysated and analyzed for luciferase activity, as described in STAR Methods.
IL-10 Upregulates DNMT1 and DNMT3b Expression through the Activation of STAT3
DSS treatment induced the activation of both STAT1 and STAT3 (Figure 7A). STAT3 activation kinetics correlate with DNMT1 and DNMT3b upregulation (Figures 4D and 7A). IL-10 has been implicated in the induction of STAT3 activation in fibroblasts (Albrengues et al., 2015). We therefore sought to test the hypothesis that IL-10 activates STAT3 to upregulate the expression of DNMT1 and DNMT3b in colon epithelial cells. We observed that IL-10 treatment induced STAT3 activation in both normal colon epithelial cells and colon carcinoma cells (Figure 7B). IFNγ treatment activated STAT1 and increased IRF8 expression in HT29 and CCD841 cells in vitro (Figure S6A). IL-6 and IL-22 treatments did not induce STAT1 activation (Figure S6A), but they did induce STAT3 activation, the upregulation of DNMT1 and DNMT3b, and the downregulation of IRF8 (Figures S6A and S6B).
Figure 7. IL-10 Induces the Activation of STAT3 that Binds to the dnmt1 and dnmt3b Promoters in Colon Epithelial and Carcinoma Cells.

(A) WT C57BL/6 mice were treated with the 2% DSS-water cycle, as described in STAR Methods. Colon tissues were collected from mice at the indicated time points and analyzed by western blotting for STAT1 and STAT3 protein levels. β-Actin was used as a normalization control.
(B) CCD841 and HT29 cells were treated with recombinant IL-10 (100 ng/mL) for 2 hr and analyzed for the indicated proteins by western blotting.
(C) Top: structure of the Dnmt1 promoter region. The number below the bar indicates nucleotide locations relative to the Dnmt1 transcription initiation site. The ChIP PCR primer regions are indicated under the bar. Bottom: CCD841 and HT29 cells were stimulated with recombinant IL-10 protein (100 ng/mL) for 16 hr, then analyzed by ChIP using immunoglobulin G (IgG) control antibody and pSTAT3-specific antibody, respectively, followed by qPCR analysis with Dnmt1 promoter DNA-specific PCR primers, as shown at top. Input DNA was used as a normalization control. The input of each ChIP primer set was arbitrarily set at 1, and the pSTAT3 was normalized to the input DNA level. Column, mean; bar, SD.
(D) Top: structure of the Dnmt3b promoter region. The number below the bar indicates nucleotide locations relative to the Dnmt3b transcription initiation site. The ChIP PCR primer regions are indicated under the bar. Bottom: CCD841 and HT29 cells were stimulated with recombinant IL-10 protein (100 ng/mL) for 16 hr, then analyzed by ChIP using IgG control antibody and pSTAT3-specific antibody, respectively, followed by qPCR analysis with Dnmt3b promoter DNA-specific PCR primers, as shown at top. Input DNA was used as a normalization control. The input of each ChIP primer set was arbitrarily set at 1, and the pSTAT3 was normalized to the input DNA level. Column, mean; bar, SD.
(E and F) The human DNMT1 (E) and DNMT3b (F) promoter DNA fragments were amplified by PCR from the two indicated regions (top: P1 and P2 for DNMT1, and P3 and P4 for DNMT3b) and cloned to the pGL3 vector. pGL3 vectors containing the P1, P2, P3, or P4 DNA fragments were transiently transfected to CCD841 and HT29 cells, respectively, overnight. Cells were either untreated (control) or treated with IL-10 (100 ng/mL) for 4 hr. Cells were lysated and analyzed for luciferase activity. Bar, SD.
To determine whether the activated STAT3 directly regulates DNMT1 and DNMT3b expression, CCD841 and HT29 cells were treated with IL-10 and analyzed for phospho-STAT3 (pSTAT3) protein binding to the Dnmt1 and Dnmt3b promoter chromatin. Chromatin immunoprecipitation (ChIP) analysis revealed that pSTAT3 binds to the Dnmt1 promoter region downstream of the Dnmt1 transcription initiation site (Figure 7C), whereas pSTAT3 binds to the Dnmt3b promoter region upstream of the Dnmt3b transcription initiation site (Figure 7D). The DNMT1 (P2 fragment, Figure 7E) and DNMT3b (P4 fragment, Figure 7F) promoter DNA regions that contain the pSTAT3-binding sites were cloned to the luciferase reporter, respectively. The adjacent DNA fragments (P1 fragment, Figure 7E, and P3 fragment, Figure 7F) were also cloned to the luciferase reporter plasmid. While insertion of the pSTAT3-binding site DNA fragments did not increase DNMT1 or DNMT3b promoter activity in CCD841 and HT29 cells, IL-10 treatment induces significantly higher reporter activity in both CCD841 and HT29 cells transfected with the pSTAT3-binding site DNA fragments as compared to cells transfected with the negative control DNA fragments (Figures 7E and 7F). Our data determine that IL-10 activates STAT3 to upregulate DNMT1 and DNMT3b expression in colon epithelial cells.
DISCUSSION
A molecular connection between proinflammatory pathways and CAC came from a study using a colitis mouse model with deficiency in nuclear factor κB (NF-κB) activation, and it was determined that NF-κB acts as an oncogene for CAC (Greten et al., 2004). IBD susceptibility genes such as NOD2 may suppress CAC through the inhibition of NF-κB activation (Udden et al., 2017). Here, we determined that the newly identified UC susceptibility gene IRF8 functions as a CAC suppressor, and chronic inflammation promotes CAC through silencing IRF8 expression by an epigenomic mechanism.
IRF8 expression is regulated by promoter methylation in a tissue-dependent manner. In osteoclast progenitors, thymidine phosphorylase activated the phosphoinositide 3-kinase (PI3K)/ Akt signaling pathway to increase the expression of DNMT3a, but not DNMT1 and DNMT3b, to hypermethylate the Irf8 promoter (Liu et al., 2016). Consistent with the roles for DNMT1 and DNMT3b in genome-wide DNA methylation in human colon carcinoma cells (Rhee et al., 2002), we observed that the expression levels of DNMT1 and DNMT3b, but not DNMT3a, are upregulated in CAC as compared to normal colon tissues. Furthermore, DSS-induced chronic inflammation is sufficient to upregulate DNMT1 and DNMT3b and the Irf8 promoter methylation in colonic epithelial cells. Aberrant DNA methylation of CpG islands has been widely observed in human colorectal carcinoma and is significantly associated with gene silencing through gene-specific mechanisms (Klett et al., 2018; Weisenberger et al., 2006). CpG island methylator phenotype-positive colorectal tumors represent a distinct subset of colorectal tumors, including almost all cases of tumors with the BRAF mutation. Methylation of MLH1 often links to sporadic cases of colorectal tumor mismatch repair deficiency (Weisenberger et al., 2006). Therefore, DNA methylation is a key mechanism that colorectal tumors use to promote the disease. Our data point to a previously uncharacterized mechanism underlying the chronic colonic inflammation promotion of CAC: chronic inflammation induces the upregulation of DNMT1 and DNMT3b to hypermethylate the irf8 promoter CpG island and silence the tumor suppressor gene Irf8 in colonic epithelial cells.
Although IL-10 acts as an anti-inflammatory cytokine to suppress inflammation and CAC (Lee et al., 2016b; Moschen et al., 2016; Murata et al., 2015), GWAS has identified Il10 as a susceptibility locus associated with IBD (Jostins et al., 2012).It is generally believed that IL-10 suppresses inflammation-mediated colorectal cancer by inhibiting the production of proinflammatory cytokines, including IFNγ, tumor necrosis factor α (TNF-α), IL-1β, IL-6, and IL-12 (Moore et al., 2001). Many of the proinflammatory cytokines are abundantly expressed in chronic inflammatory lesions and the tumor tissues, but it was reported that, unlike these proinflammatory cytokines, IL-10 is not expressed in tumor tissues (Mumm et al., 2011). It is well known that IL-10 is expressed in B and T cells (Dambuza et al., 2017; Mion et al., 2017; Yu et al., 2013). IL-10 is also expressed in myeloid cells such as MDSCs (Hardbower et al., 2017; Shvedova et al., 2015) to promote tumor growth. MDSCs are induced by inflammatory factors that crosstalk with tumor cells in the tumor microenvironment to promote tumor growth through immunological and non-immunological mechanisms (Beury et al., 2014; Danelli et al., 2015a, 2015b; Katoh et al., 2013). In this study, we observed that IL-10 is abundantly expressed in MDSCs in colon tissues and second lymphoid organs under conditions of chronic inflammation. We further demonstrated that IL-10 activates STAT3, which directly binds to the Dnmt1 and Dnmt3b promoter regions to regulate DNMT1 and DNMT3b expression in colonic epithelial and colon carcinoma cells. The molecular link between IL-10 and DNMT3b is further validated by our observation in inflamed colon tissues that the deletion of IL-10 results in the loss of DNMT3b expression. Since it is known that IL-10 inhibits the IL-6-mediated STAT3 activation in MDSCs (Lee et al., 2016a), it is possible that IL-10 KO colon tissues express a high level of DNMT1 because IL-10 deficiency likely leads to increased IL-6 and resultant DNMT1 upregulation under conditions of chronic inflammation (Li et al., 2012). Therefore, in contrast to IL-10 functioning as a suppressor of CAC, our data indicate that IL-10 plays a promoting role in chronic inflammation-mediated CAC. These contrasting roles of IL-10 in CAC may be due to the timing and sequence of IL-10 activation and function. IL-10 is an inhibitor of NF-κB (Stayrook et al., 1997), and NF-κB is essential for CAC (Greten et al., 2004). Therefore, it is expected that chronic inflammation induces a higher and earlier incidence of colon tumors in Il0KO mice since loss of IL-10 function occurs before the start of inflammation. However, in the AOM-DSS WT mouse model, IL-10-producing MDSCs accumulate only at a late stage of inflammation, and therefore IL-10 inhibition of NF-κB activation may not be relevant for the initiation of NF-κB-dependent epithelial cell transformation. Instead, higher levels of IL-10 in the colon lamina propria activate the STAT3 pathway to promote tumor growth through DNMT3b-mediated IRF8 silencing. Evaluations of these contrasting roles of IL-10 in CAC require further study. Nevertheless, our data demonstrate that the MDSC-IL-10-STAT3-DNMT3b-IRF8 circuit represents another pathway linking chronic inflammation and CAC.
STAR★METHODS
CONTACT FOR REAGENT AND RESOURCE SHARING
Further information and requests for resources and reagents should be directed to and will be fulfilled by the Lead Contact, Kebin Liu (Kliu@augusta.edu)
EXPERIMENTAL MODEL AND SUBJECT DETAILS
Mice
C57BL/6J, loxp-flanked Irf8 [B6(Cg)-Irf8tm1.1Hm/J], villin-cre [B6.Cg-Tg(Vil1-cre)1000Gum/J], Il10KO mice [B6.129P2-Il10tm1Cgn/J], and IRF8-GFP reporter mice [B6(Cg)-Irf8tm2.1Hm/J] were obtained from the Jackson Laboratory (Bar Harbor, ME). Mice with a conditional IRF8 knock out were created by crossing the loxp-flanked Irf8 mouse with the villin-cre mouse. IRF8KO mice were kindly provided by Dr. Keiko Ozato (National Institutes of Health, Bethesda, MD). All mice used in this study were aged between 2–3 months old at the start of the experiment, fed ad libitum, and maintained on a 12-hour light/dark cycle at the animal facility of Augusta University. All animal studies are approved in advance by Augusta University Institutional Animal Care and Use Committee (Protocol# 2008–0162).
Cell lines
The human colon epithelial cell line CCD841 and human colon carcinoma HT29 and HCT116 cell lines were obtained from American Type Culture (Manassas, VA). HCT116DNMT1−/−, HCT116DNMT3b−/−, and HCT116DNMT1−/− DNMT3b−/− (DKO) were kindly provided by Dr. Bert Vogelstein (Johns Hopkins University, Baltimore, MD). CCD841 and HT29 Cells were treated with recombinant IL10, IL6 or IL22 (Biolegend, San Deigo, CA), or recombinant IFNγ (R&D, Minneapolis, MN) for 2 or 24 h and analyzed by western blotting or/and RT-PCR.
METHOD DETAILS
AOM injection and DSS administration (colitis associated cancer mouse model)
Mice were injected with azoxymethane (AOM, Sigma-Aldrich, 10 mg/kg body weight) intraperitoneally once, followed by administration of 2% dextran sulfate sodium (DSS, MP Biomedicals, Santa Ana, CA) through the drinking water one day later for one week. DSS was replaced with water for two weeks. The DSS/water cycle was repeated two more times. Mice were maintained with regular drinking water for one more week after the 3rd cycle and then sacrificed for analysis. Colon tissues were dissected from the mice, flushed and cleaned with PBS, cut open longitudinally to examine tumor nodules. Both male and female mice were used in all AOM-DSS model experiments. DSS-model experiments were conducted on male mice.
Mouse body weight and mortality analysis
Mice were weight at the start day of the above AOM-DSS treatment procedure and weighed every two days. The survival percentage of mice throughout the AOM/DSS treatment procedures was assessed from day 0 (AOM injected) to days 70 (day of scarification). For DSS-induced colitis mouse model, Mice were administered 2% dextran sulfate sodium through the drinking water for one week, followed by two weeks with regular water then one more week of 2% DSS drinking water.
GFP fluorescence visualization
Colon tissues were dissected from sacrificed mice, flushed and cleaned with PBS, and cut open longitudinally. The tissues were then fixed in 4% paraformaldehyde (ACROS organic, Waltham, MA) for 24 hr, washed with PBS, incubated in 20% sucrose in PBS for another 24 hr. Tissues were then flash-frozen in optimal cutting temperature compound (OCT-Sakura, Torrance, CA) in dried ice-chilled 100% ethanol. The frozen tissue blocks were stored in –80°C until use. Six mm-thick frozen sections were cut with a cryostat and allowed to dry overnight at room temperature. Sections were then washed with PBS, rinse briefly with water, and then mounted with VECTASHIELD mounting medium containing anti-fading agents with DAPI (Vector laboratories, Burlingame, CA). The tissues were examined under a LSM780 Meta confocal laser microscope (Carl Zeiss, Germany). The captured images were viewed and analyzed using Zeiss Zen Meta imaging 2012 software. Scale bar was calculated with ZEN software then extrapolated to all images with the same magnification power.
DNA methylation analysis
Genomic DNA was extracted from colon tissues, colon tumor and colon carcinoma cell lines using Quick-DNA Miniprep Plus Kit (Zymo Research, Irvine, CA). Sodium bisulfite modification of the genomic DNA was carried out using CpGenome Universal DNA Modification Kit (Millipore, Burlington, MA) according to manufacture instructions. The bisulfite modified genomic DNA was used as a template for PCR amplification of IRF8 promoter region using Platinum II Taq Hot-Start DNA Polymerase (Invitrogen, Carlsbad, CA) with bisulfite PCR primer pairs designed by MethPrimer program. The PCR amplicon was then cloned to pCR2.1 vector using TA cloning kit (Invitrogen, San Deigo, CA), transformed into One Shot TOP10 Chemically Competent E. coli cells (Invitrogen, Carlsbad, CA). Single colonies were grown in 5 mL LB medium and plasmid DNA was purified with Zyppy Plasmid Miniprep Kit (Zymo Research, Irvine, CA). Purified plasmid DNA from individual clones were then sent to Genewiz (South Plainfield, NJ) for sequencing. The methylation status of cytosine was analyzed using Quma program. Methyl-specific (MS-PCR) was carried out on the bisulfite modified genomic DNA using MS-PCR primers designed by MethPrimer program for methylated and unmethylated irf8 promoter. All primer sequences are listed in Table S1.
Flow cytometry
Single cells were prepared from spleens and stained with the following fluorescent dye-conjugated antibodies: FITC-CD11b, PE-Gr1, PE-CD4 and FITC-CD8 (Biolegend, San Deigo, CA). The stained cells were analyzed in a LSR Fortessa (BD Biosciences, San Jose, CA).
Lamina propria cells extraction and Intracellular staining
Colon tissue were dissected from mice, flushed and cleaned with PBS, cut open longitudinally, cut into small pieces and agitated in 1 mM EDTA at 37°C for 30 min. Epithelial cells were filtered away through a 100 μM cell strainer. Colon fragments were then washed with PBS, minced and digested in collagenase/hyaluronidase/DNase mixture at 37°C for 45 min with agitation. The digests were then homogenized, filtered through 100 μm cell strainer. The flow through was then centrifuged at > 300 g for 10 min and the cells were resuspended in PBS. Cells were first stained with FITC-CD11b- and PE-Gr1-specific antibodies, then fixed and permeabilized with Fixation/Permeabilization Solution Kit (BD Biosciences, San Jose, CA), followed by staining with APC-anti-mouse IL10 antibody (Biolegend, San Deigo, CA). The stained cells were analyzed in a FACS Calibur (BD Biosciences, San Jose, CA) or LSR Fortessa (BD Biosciences, San Jose, CA).
RT-PCR analysis
Total RNA was isolated from cells or tissue using Trizol (Invitrogen, San Diego, CA) according to the manufacturer’s instructions, and used for the first strand cDNA synthesis using the MMLV reverse transcriptase (Promega, Madison, WI). The cDNA was then used as template for semiquantitative or real-time PCR analysis with Power SYBR Green PCR Master Mix (ThermoFisher, Waltham, MA) using the StepOne Plus Real Time PCR System (Applied Biosystems, Foster City, CA). The sequences of primers are listed in Table S1.
Western blot analysis
Colon tissues and tumors were collected and homogenized into single cell suspension in PBS using an electric homogenizer. Subsequently, cells were lysed in total cell lysis buffer (20 mM HEPES, pH 7.4, 20mM NaCl, 10% glycerol, 1% Triton X-100). Lysates were subjected to standard SDS-polyacrylamide gel electrophoresis (10μg protein/lane) and western blotting procedures using the following primary antibodies: Anti-IRF8 (Cell Signaling, Danvers, MA), Anti-STAT3, anti-pSTAT3, anti-STAT1 and anti-pSTAT1 (BD Biosciences, San Diego, CA), Anti-DNMT1 and Anti-DNMT3b (Abcam, Cambridge, MA). Anti-β-actin (Sigma-Aldrich, St Louis, MO). Anti-Rabbit-HRP (1:5000), Anti-Mouse-HRP (1:5000) secondary antibodies (Cell Signaling, Danvers, MA). Signal was detected using the enhanced chemiluminescence system (ECL; Perkin Elmer, Waltham, MA) and the Xray Film Processor Konica SRX-101A (Konica Minolta, Tokyo, Japan).
Chromatin Immunoprecipitation (ChIP)
ChIP was performed using anti-pSTAT3 (Cell Signaling, Danvers, MA) and the Chromatin Immunoprecipitation (ChIP) Assay Kit (Millipore, Burlington, MA) according to the manufacturer’s instructions. Normal rabbit IgG-AC (Santa Cruz Biotechnology, Dallas, TX) was used as negative control for the antibody. The immunoprecipitated genomic DNA was amplified by qPCR using 3 pairs of PCR primers (Table S1) covering the region of the DNMT1 and DNMT3b promoter regions.
Luciferase Reporter Assay
Luciferase reporter assay was performed to assess the transcriptional activation of DNMT1 and DNMT3b via the STAT3 bound DNA elements in two different regions of their promoters. For the DNMT1 P1 promoter region (−2535 to −1629), the DNMT1 promoter region was amplified from genomic DNA isolated from CCD841 cell line with primers designed from ENSEMBLE GenBank sequence: forward: GTACTCGAGTCCAGGCACACACTACCATTC and reverse: CATAAGCTTCGGGTTCAAGCGATTCTTCTG. Extra nucleotides were added to both ends to generate Xho1 and HindIII unique restriction sites, respectively. The resultant 987-bp PCR product was gel purified and cloned into the pGL3-basic luciferase reporter construct (Promega, Madison, WI) to generate the DNMT1-promoter P1-pGL3 construct. For DNMT3b P3 promoter region (−3289 to −2364), the DNMT3b promoter region was amplified from genomic DNA isolated from CCD841 cell line with primers designed from ENSEMBLE GenBank sequence. Forward: ACTCGG TACCTGTAAAGAAAGGCTGGACGGC and reverse: CATAAGCTTAAATAAACAGGTCTATGGGGAGGG. Extra nucleotides were added to both ends to generate KpnI and HindIII unique restriction sites, respectively. The resultant 926-bp PCR product was gel purified and cloned into the pGL3-basic luciferase reporter construct (Promega, Madison, WI) to generate the DNMT3b-promoter P3-pGL3 construct. DNMT1 P2 (−1304 to +179) Promoter-PGL3 construct and DNMT3b P4 (−1263 to +210) promoter-PGL3 construct were obtained from Genecopoeia (Rockville, MD). CCD841 and HT29 were transiently transfected with each of these plasmids or basic PGL3 vector using Lipofectamine 2000 (Invitrogen, Carlsbad, CA) according to manufacturer’s directions. Twenty-four hr after transfection, the cells were untreated or treated with recombinant human IL10 (Biolegend, San Deigo, CA) at 100 ng/mL for 4 hr. Cells were then washed and lysed. The cell lysates were incubated with luciferon (Promega, Madison, WI) and analyzed for luciferase activity in a Cytation5 imaging reader (Biotek, Winooski, VT). The IRF8 Promoter PGL3 construct was kindly provided by Dr. Scott Abrams (Roswell Park Comprehensive Cancer Center, Buffalo, NY). To methylate the DNA, the IRF8 promoter-PGL3 was incubated with M.SssI (New England Biolabs, Ipswich, MA) at 37°C for 1 h. The reaction was stopped by incubation at 65°C for 20 min. The DNA was purified using the PCR purification kit (QIAGEN, Helden, Germany) according to manufacturer’s directions. CCD841 and HT29 were transiently transfected with methylated or unmethylated IRF8 Promoter-PGL3 plasmid using Lipofectamine 2000 (Invitrogen, Carlsbad, CA) according to manufacturer’s directions. 24 hr after transfection, cells were lysed and incubated with luciferon (Promega, Madison, WI), analyzed for luciferase activity in a Cytation5 imaging reader (Biotek, Winooski, VT).
Immunohistochemistry
Colon tissues were prepared as SWISS rolls and fixed in 10% formalin overnight. The fixed tissues were processed into paraffin blocks and cut into sections. Sections were dewaxed with Xylene and hydrated in 100%, 90%, 70% and 50% ethanol sequentially. Antigen retrieval was performed using Antigen Unmasking Solution (Vector Lab, Burlingame, CA). Slides were then incubated in 0.3% hydrogen peroxidase for 20 min at room temperature, washed in water, blocked with 2.5% Normal Horse Serum (Vector Lab, Burlingame, CA) for 1 hr, then probed with Anti-Ki67 antibody (Novus, Littleton, CO) overnight at 4°C. Slides were washed three times with PBS-Tween and incubated with HRP Universal Anti-Mouse IgG/Anti-Rabbit IgG Antibody (Vector Lab, Burlingame, CA) for 1 hr. Sections were exposed to ImmPACT DAB Peroxidase Substrate (Vector Lab, Burlingame, CA) for 5 min, washed and counterstained with Harris Hematoxylin (Sigma Aldrich, St. Louis, MO), and incubated for 1 min with 0.1% Sodium Bicarbonate as a bluing reagent. Slides were mounted in VectaMount Permanent Mounting Medium (Vector Lab, Burlingame, CA) and examined under microscope. Ki67+ cells at the bottom of crypts were counted. In situ TUNEL staining was performed using ApopTag® Plus Peroxidase In Situ Apoptosis Kit (Millipore, Burlington, MA) according to the manufacturer’s instructions. For each quantification, at least 20 crypts per mouse and at least 3 experimental mice per condition were analyzed. For inflammation score of H&E stained slides, each grade represent the following: Grade 0: Normal colonic mucosa, Grade 1: Loss of one-third of the crypts, Grade 2: Loss of two-thirds of the crypts, Grade 3: The lamina propria is covered with a single layer of epithelium and mild inflammatory cell infiltration is present, Grade 4: Erosions and marked inflammatory cell infiltration are present. Scale bar has been calculated with LAS V4.1 software then extrapolated to all images with the same magnification power.
TCGA database analysis
Human datasets of DNMT1, DNMT3b and IRF8 expression in human primary tumor and normal solid tissue was extracted from TCGA Colon and Rectal Cancer (COADREAD) ploy A+ IlluminaHiSeq pancan normalized RNA seq dataset using UCSC Xena Cancer Genomics Browser. Human clinical datasets of the IRF8 promoter methylation level in human primary tumor and normal solid tissue was extracted from TCGA Colon Cancer (COAD) dataset using MethHC database of DNA Methylation and gene expression in Human Cancer Browser.
QUANTIFICATION AND STATISTICAL ANALYSIS
Statistical and graphical analyses was performed using Graphpad Prism and Microsoft Excel 2016. Statistical comparisons between any two groups were conducted using unpaired two-tailed Student’s t test and p values were indicated in their corresponding graphs. p < 0.05 were considered as statistically significant, and Error bars are indicated as mean ± SD. The immunofluorescence and immunohistochemistry analysis were conducted on mouse tissues for at least 3 sections of at least 3 mice per experimental condition. For each quantification, at least 20 crypts per mouse, and at least 3 experimental mice per condition were analyzed. All flow cytometry data were obtained from at least 3 mice per experimental condition.
Supplementary Material
KEY RESOURCES TABLE.
| REAGENT or RESOURCE | SOURCE | IDENTIFIER |
|---|---|---|
| Antibodies | ||
| Rabbit monoclonal anti-Irf8 | Cell Signaling Technology | Cat# 5628; RRID: AB_10828231 |
| Mouse monoclonal anti-Stat1 (pY701) | BD Biosciences | Cat# 612133; RRID: AB_399504 |
| Mouse monoclonal anti-Stat1 | BD Biosciences | Cat# 610186; RRID: AB_397585 |
| Mouse monoclonal anti-Stat3 (pY705) | BD Biosciences | Cat# 612357; RRID: AB_399646 |
| Mouse monoclonal anti-Stat3 | BD Biosciences | Cat# 610190; RRID: AB_397589 |
| Mouse monoclonal anti-Dnmt1[60B1220.1]-ChIP Grade | Abcam | Cat# ab13537; RRID: AB_300438 |
| Mouse monoclonal anti-Dnmt3b[52A1018]-ChIP Grade | Abcam | Cat# ab13604; RRID: AB_300494 |
| Mouse monoclonal anti- beta-Actin [Clone AC-74] | Sigma-Aldrich | Cat# A2228; RRID: AB_476697 |
| Rat monoclonal FITC anti-mouse CD8a[Clone 53–6.7] | BioLegend | Cat# 100706; RRID: AB_312745 |
| Rat monoclonal PE anti-mouse CD4[Clone RM4–5] | BioLegend | Cat# 100512; RRID: AB_312715 |
| Rat monoclonal FITC anti-mouse/human CD11b[Clone M1/70] |
BioLegend | Cat# 101206; RRID: AB_312789 |
| Rat monoclonal PE anti-mouse Ly-6G/Ly-6C (Gr-1)[Clone RB6–8C5] |
BioLegend | Cat# 108408; RRID: AB_313373 |
| Rat monoclonal APC anti-mouse IL10[Clone JES5–16E3] | BioLegend | Cat# 505009; RRID: AB_315363 |
| Rabbit polyclonal anti-ki67 | Novus | Cat# NB500–170; RRID: AB_10001977 |
| Horse Anti-mouse IgG, HRP-linked | Cell Signaling Technology | Cat# 7076; RRID: AB_330924 |
| Goat Anti-rabbit IgG, HRP-linked | Cell Signaling Technology | Cat# 7074; RRID: AB_2099233 |
| InVivo monoclonal anti-mouse/human CD11b [clone M1/70] |
BioxCell | Cat# BE0007; RRID: AB_1107582 |
| Rabbit monoclonal anti-Phospho-Stat3 (Ser727) (D4X3C) |
Cell Signaling Technology | Cat# 34911, RRID: AB_2737598 |
| normal rabbit IgG-AC | Santa Cruz Biotechnology | Cat# sc-2345; RRID: AB_737183 |
| Chemicals, Peptides, and Recombinant Proteins | ||
| Dextran sulfate sodium (colitis grade) | MP Biomedicals | 0216011050 |
| Azoxymethane | Sigma-Aldrich | A5486 |
| Recombinant Human IL-10 (carrier-free) | BioLegend | 571002 |
| Recombinant Human IL-6 (carrier-free) | BioLegend | 570802 |
| Recombinant Human IL-22 (carrier-free) | BioLegend | 571302 |
| Recombinant Human IFN-gamma | R&D Systems | 285-IF-CF |
| Beetle Luciferin, Potassium Salt | Promega | E1601 |
| TRIzol Reagent | Invitrogen | 15596018 |
| Hydrogen peroxide solution | Sigma-Aldrich | 216763 |
| VectaMount Permanent Mounting Medium | Vector Laboratories | H-5000 |
| Hematoxylin Solution, Harris Modified | Sigma-Aldrich | HHS16 |
| VECTOR Methyl Green | Vector Laboratories | H-3402 |
| Lipofectamine 2000 Transfection Reagent | Invitrogen | 11668019 |
| Opti-MEM Reduced Serum Medium, GlutaMAX Supplement |
Invitrogen | 51985034 |
| HyClone Fetal Bovine Serum | ThermoFisher | SH3039603 |
| issue-Tek O.C.T. Compound | Sakura | 4583 |
| Isopropanol, Molecular Biology Grade | ThermoFisher | BP2618500 |
| 1-Butanol,anhydrous, 99.8% | Sigma-Aldrich | 281549 |
| Xylenes, histological grade | Sigma-Aldrich | 534056 |
| Chloroform | Sigma-Aldrich | C2432 |
| Blotting-Grade Blocker | Bio-Rad | 1706404 |
| Antigen Unmasking Solution, Citrate Based | Vector Laboratories | H-3300 |
| ImmPACT DAB Peroxidase (HRP) Substrate | Vector Laboratories | SK-4105 |
| S.O.C. Medium | Invitrogen | 15544034 |
| Paraformaldehyde, 96% | ACROS Organics | 416785000 |
| Sucrose, 99+% | Sigma-Aldrich | S0389 |
| Formalin, 10% (Phosphate Buffer). | ThermoFisher | SF100–4 |
| Universal-Agarose, peqGOLD | Peqlab | 351020 |
| 3M Sodium Acetate, pH 5.2 ± 0.1 | Corning | 46–033-CI |
| EDTA (0.5 M), pH 8.0 | Invitrogen | 15575038 |
| Formaldehyde | ThermoFisher | BP531 |
| Protein A Agarose/Salmon Sperm DNA | Millipore | 16–157 |
| BioMag® Goat anti-Rat IgG | PolySciences | 84330 |
| Phenol:Chloroform:Isoamyl Alcohol | Sigma-Aldrich | P2069 |
| Corning® Trypsin EDTA 1X | Corning | 25–052-CI |
| VECTASHIELD Antifade Mounting Medium with DAPI | Vector Laboratories | H-1200 |
| DNase I, RNase-free | ThermoFisher | EN0521 |
| Collagenase from Clostridium histolyticum | Sigma-Aldrich | C0130 |
| Hyaluronidase from bovine testes | Sigma-Aldrich | H3506 |
| Platinum II Taq Hot-Start DNA Polymerase | Invitrogen | 14966001 |
| CpG Methyltransferase (M.SssI) | New England Biolabs | M0226S |
| M-MLV Reverse Transcriptase | Promega | M170A |
| Taq DNA Polymerase | GenScript | E00007 |
| FastDigest KpnI | Fermentas | FD0524 |
| FastDigest HindIII | Fermentas | FD0505 |
| FastDigest XhoI | Fermentas | FD0694 |
| X-Gal | Sigma-Aldrich | 3117073001 |
| Corning 10% SDS | Corning | MT-46040-CI |
| Yeast tRNA | ThermoFisher | AM7119 |
| Corning® 500 mL RPMI 1640 | Corning | 10–040-CV |
| HEPES Buffer | Corning | MT-25060-CI |
| Corning® 100 mL Penicillin-Streptomycin Solution, 100x | Corning | 30–002-CI |
| Sodium Pyruvate (100 mM) | GIBCO | 11360070 |
| MEM Non-Essential Amino Acids Solution (100X) | HyClone | SH3023801 |
| Critical Commercial Assays | ||
| ImmPRESS HRP Universal Antibody (Anti-Mouse IgG/Anti-Rabbit IgG) |
Vector Laboratories | MP-7500 |
| Mini-PROTEAN® TGX Gels | Bio-Rad | 4561096 |
| Power SYBR Green PCR Master Mix | ThermoFisher | 4367659 |
| Chromatin Immunoprecipitation (ChIP) Assay Kit | Millipore | 17295 |
| TA Cloning Kit, with pCR2.1 Vector and One Shot TOP10 Chemically Competent E. coli |
Invitrogen | K204001 |
| ApopTag® Plus Peroxidase In Situ Apoptosis Kit | Millipore | S7101 |
| CpGenome Universal DNA Modification Kit | Millipore | S7820 |
| QIAEX II Gel Extraction Kit | QIAGEN | 20021 |
| Fixation/Permeabilization Solution Kit with BD GolgiPlug | BD Biosciences | 555028 |
| Zyppy Plasmid Miniprep Kit | Zymo Research | D4019 |
| Quick-DNA Miniprep Plus Kit | Zymo Research | D4069 |
| Western Lightning Plus-ECL, Enhanced Chemiluminescence Substrate | PerkinElmer | NEL105001EA |
| Experimental Models: Cell Lines | ||
| Cell Line: CCD 841 CoN (ATCC CRL-1790) | American Type Culture Collection | www.atcc.org/Products/All/CRL-1790.aspx |
| Cell Line: HT-29 (ATCC HTB-38) | American Type Culture Collection | atcc.org/Products/All/HTB-38.aspx |
| Cell Line: HCT 116 (ATCC CCL-247) | American Type Culture Collection | www.atcc.org/products/all/CCL-247.aspx |
| Cell Line: RAW 264.7 (ATCC TIB-71) | American Type Culture Collection | www.atcc.org/Products/All/TIB-71.aspx |
| Cell Line: HCT116DNMT1−/− | Dr. Bert Vogelstein (Johns Hopkins University, Baltimore, MD) | Rhee et al., 2002 |
| Cell Line: HCT116DNMT3b−/− | Dr. Bert Vogelstein (Johns Hopkins University, Baltimore, MD) |
Rhee et al., 2002 |
| Cell Line: HCT116DNMT1−/−DNMT3b−/− (DKO) | Dr. Bert Vogelstein (Johns Hopkins University, Baltimore, MD) |
Rhee et al., 2002 |
| Mouse: B6(Cg)-Irf8tm1.1Hm/J | Jackson Laboratory | www.jax.org/strain/014175 |
| Mouse: B6.Cg-Tg(Vil1-cre)1000Gum/J | Jackson Laboratory | www.jax.org/strain/021504 |
| Mouse: B6.129P2-Il10tm1Cgn/J | Jackson Laboratory | www.jax.org/strain/002251 |
| Mouse: B6(Cg)-Irf8tm2.1Hm/J | Jackson Laboratory | www.jax.org/strain/027084 |
| Mouse: Irf8KO Mice | Dr. Keiko Ozato – (NIH, Bethesda, MD) | Holtschke et al., 1996 |
| Mouse: JAX C57BL/6J Mice | Charles River | www.jax.org/strain/000664 |
| All Primers, see Table S1 | This paper | N/A |
| Recombinant DNA | ||
| pGL3 Luciferase Reporter Vector (Basic) | Promega | E1751 |
| MethHC | Huang et al., 2015 | academic.oup.com/nar/article/43/D1/D856/2438401 |
| UCSC Xena Browser | University of California Santa Cruz | xenabrowser.net/heatmap |
Highlights.
Chronic inflammation increases colonic myeloid-derived suppressor cells (MDSCs)
The majority of IL-10+ cells are MDSCs in the inflamed colon
IL-10 activates STAT3 to upregulate DNMT3b to methylate the Irf8 promoter
IRF8 is a suppressor of inflammation-induced colon cancer
ACKNOWLEDGMENTS
We thank Dr. Kimya Jones at Georgia Esoteric Molecular Labs, LLC, for the excellent technical assistance in immunohistochemical staining of mouse colon tissues. Grant support came from the NIH, United States (CA133085, CA182518, and CA227433 to K.L) and a Veterans Affairs Merit Review Award, United States (BX001962 to K.L.). This work was supported in part by the Intramural Research Program of the National Institute of Allergy and Infectious Diseases, United States (to H.C.M.).
Footnotes
DECLARATION OF INTERESTS
The authors declare no competing interests.
SUPPLEMENTAL INFORMATION
Supplemental Information includes six figures and one table and can be found with this article online at https://doi.org/10.1016/j.celrep.2018.11.050
REFERENCES
- Albrengues J, Bertero T, Grasset E, Bonan S, Maiel M, Bourget I, Philippe C, Herraiz Serrano C, Benamar S, Croce O, et al. (2015). Epigenetic switch drives the conversion of fibroblasts into proinvasive cancer-associated fibroblasts. Nat. Commun 6, 10204. [DOI] [PMC free article] [PubMed] [Google Scholar]
- Barrett JC, Hansoul S, Nicolae DL, Cho JH, Duerr RH, Rioux JD, Brant SR, Silverberg MS, Taylor KD, Barmada MM, et al. ; NIDDK IBD Genetics Consortium; Belgian-French IBD Consortium; Wellcome Trust Case Control Consortium (2008). Genome-wide association defines more than 30 distinct susceptibility loci for Crohn’s disease. Nat. Genet 40, 955–962. [DOI] [PMC free article] [PubMed] [Google Scholar]
- Beury DW, Parker KH, Nyandjo M, Sinha P, Carter KA, and Ostrand-Rosenberg S (2014). Cross-talk among myeloid-derived suppressor cells, macrophages, and tumor cells impacts the inflammatory milieu of solid tumors. J. Leukoc. Biol 96, 1109–1118. [DOI] [PMC free article] [PubMed] [Google Scholar]
- Dambuza IM, He C, Choi JK, Yu CR, Wang R, Mattapallil MJ, Wingfield PT, Caspi RR, and Egwuagu CE (2017). IL-12p35 induces expansion of IL-10 and IL-35-expressing regulatory B cells and ameliorates autoimmune disease. Nat. Commun 8, 719. [DOI] [PMC free article] [PubMed] [Google Scholar]
- Danelli L, Frossi B, Gri G, Mion F, Guarnotta C, Bongiovanni L, Tripodo C, Mariuzzi L, Marzinotto S, Rigoni A, et al. (2015a). Mast cells boost myeloid-derived suppressor cell activity and contribute to the development of tumor-favoring microenvironment. Cancer Immunol. Res 3, 85–95. [DOI] [PubMed] [Google Scholar]
- Danelli L, Frossi B, and Pucillo CE (2015b). Mast cell/MDSC a liaison immunosuppressive for tumor microenvironment. OncoImmunology 4, e1001232. [DOI] [PMC free article] [PubMed] [Google Scholar]
- Dennis KL, Saadalla A, Blatner NR, Wang S, Venkateswaran V, Gounari F, Cheroutre H, Weaver CT, Roers A, Egilmez NK, and Khazaie K (2015). T-cell expression of IL10 is essential for tumor immune surveillance in the small intestine. Cancer Immunol. Res 3, 806–814. [DOI] [PMC free article] [PubMed] [Google Scholar]
- Elding H, Lau W, Swallow DM, and Maniatis N (2013). Refinement in localization and identification of gene regions associated with Crohn disease. Am. J. Hum. Genet 92, 107–113. [DOI] [PMC free article] [PubMed] [Google Scholar]
- Feng J, Wang H, Shin DM, Masiuk M, Qi CF, and Morse HC 3rd. (2011). IFN regulatory factor 8 restricts the size of the marginal zone and follicular B cell pools. J. Immunol 186, 1458–1466. [DOI] [PMC free article] [PubMed] [Google Scholar]
- Gonzalez-Aparicio M, Alzuguren P, Mauleon I, Medina-Echeverz J, Hervas-Stubbs S, Mancheno U, Berraondo P, Crettaz J, Gonzalez-Aseguinolaza G, Prieto J, and Hernandez-Alcoceba R (2011). Oxaliplatin in combination with liver-specific expression of interleukin 12 reduces the immunosuppressive microenvironment of tumours and eradicates metastatic colorectal cancer in mice. Gut 60, 341–349. [DOI] [PubMed] [Google Scholar]
- Greten FR, Eckmann L, Greten TF, Park JM, Li ZW, Egan LJ, Kagnoff MF, and Karin M (2004). IKKbeta links inflammation and tumorigenesis in a mouse model of colitis-associated cancer. Cell 118, 285–296. [DOI] [PubMed] [Google Scholar]
- Hardbower DM, Coburn LA, Asim M, Singh K, Sierra JC, Barry DP, Gobert AP, Piazuelo MB, Washington MK, and Wilson KT (2017). EGFR-mediated macrophage activation promotes colitis-associated tumorigenesis. Oncogene 36, 3807–3819. [DOI] [PMC free article] [PubMed] [Google Scholar]
- Holtschke T, Löhler J, Kanno Y, Fehr T, Giese N, Rosenbauer F, Lou J, Knobeloch KP, Gabriele L, Waring JF, et al. (1996). Immunodeficiency and chronic myelogenous leukemia-like syndrome in mice with a targeted mutation of the ICSBP gene. Cell 87, 307–317. [DOI] [PubMed] [Google Scholar]
- Huang WY, Hsu SD, Huang HY, Sun YM, Chou CH, Weng SL, and Huang HD (2015). MethHC: a database of DNA methylation and gene expression in human cancer. Nucleic Acids Res. 43, D856–D861. [DOI] [PMC free article] [PubMed] [Google Scholar]
- Jostins L, Ripke S, Weersma RK, Duerr RH, McGovern DP, Hui KY, Lee JC, Schumm LP, Sharma Y, Anderson CA, et al. ; International IBD Genetics Consortium (IIBDGC) (2012). Host-microbe interactions have shaped the genetic architecture of inflammatory bowel disease. Nature 491, 119–124. [DOI] [PMC free article] [PubMed] [Google Scholar]
- Karki R, Lee E, Place D, Samir P, Mavuluri J, Sharma BR, Balakrishnan A, Malireddi RKS, Geiger R, Zhu Q, et al. (2018). IRF8 regulates transcription of Naips for NLRC4 inflammasome activation. Cell 173, 920–933.e13. [DOI] [PMC free article] [PubMed] [Google Scholar]
- Katoh H, Wang D, Daikoku T, Sun H, Dey SK, and Dubois RN (2013). CXCR2-expressing myeloid-derived suppressor cells are essential to promote colitis-associated tumorigenesis. Cancer Cell 24, 631–644. [DOI] [PMC free article] [PubMed] [Google Scholar]
- Kim SH, Burton J, Yu CR, Sun L, He C, Wang H, Morse HC 3rd, and Egwuagu CE (2015). Dual function of the IRF8 transcription factor in autoimmune uveitis: loss of IRF8 in T cells exacerbates uveitisi, whereas Irf8 deletion in the retina confers protection. J. Immunol 195, 1480–1488. [DOI] [PMC free article] [PubMed] [Google Scholar]
- Klett H, Balavarca Y, Toth R, Gigic B, Habermann N, Scherer D, Schrotz-King P, Ulrich A, Schirmacher P, Herpel E, et al. (2018). Robust prediction of gene regulation in colorectal cancer tissues from DNA methylation profiles. Epigenetics 13, 386–397. [DOI] [PMC free article] [PubMed] [Google Scholar]
- Lasry A, Zinger A, and Ben-Neriah Y (2016). Inflammatory networks underlying colorectal cancer. Nat. Immunol 17, 230–240. [DOI] [PubMed] [Google Scholar]
- Lee BR, Kwon BE, Hong EH, Shim A, Song JH, Kim HM, Chang SY, Kim YJ, Kweon MN, Youn JI, and Ko HJ (2016a). Interleukin-10 attenuates tumour growth by inhibiting interleukin-6/signal transducer and activator of transcription 3 signalling in myeloid-derived suppressor cells. Cancer Lett. 381, 156–164. [DOI] [PubMed] [Google Scholar]
- Lee JJ, Rothenberg ME, Seeley ES, Zimdahl B, Kawano S, Lu WJ, Shin K, Sakata-Kato T, Chen JK, Diehn M, et al. (2016b). Control of inflammation by stromal Hedgehog pathway activation restrains colitis. Proc. Natl. Acad. Sci. USA 113, E7545–E7553. [DOI] [PMC free article] [PubMed] [Google Scholar]
- Li Y, Deuring J, Peppelenbosch MP, Kuipers EJ, de Haar C, and van der Woude CJ (2012). IL-6-induced DNMT1 activity mediates SOCS3 promoter hypermethylation in ulcerative colitis-related colorectal cancer. Carcinogenesis 33, 1889–1896. [DOI] [PubMed] [Google Scholar]
- Liu H, Liu Z, Du J, He J, Lin P, Amini B, Starbuck MW, Novane N, Shah JJ, Davis RE, et al. (2016). Thymidine phosphorylase exerts complex effects on bone resorption and formation in myeloma. Sci. Transl. Med 8, 353ra113. [DOI] [PMC free article] [PubMed] [Google Scholar]
- McGough JM, Yang D, Huang S, Georgi D, Hewitt SM, Röcken C, Tänzer M, Ebert MP, and Liu K (2008). DNA methylation represses IFN-gamma-induced and signal transducer and activator of transcription 1-mediated IFN regulatory factor 8 activation in colon carcinoma cells. Mol. Cancer Res 6, 1841–1851. [DOI] [PMC free article] [PubMed] [Google Scholar]
- Mion F, Vetrano S, Tonon S, Valeri V, Piontini A, Burocchi A, Petti L, Frossi B, Gulino A, Tripodo C, et al. (2017). Reciprocal influence of B cells and tumor macro and microenvironments in the ApcMin/+ model of colorectal cancer. OncoImmunology 6, e1336593. [DOI] [PMC free article] [PubMed] [Google Scholar]
- Moore KW, de Waal Malefyt R, Coffman RL, and O’Garra A (2001). Interleukin-10 and the interleukin-10 receptor. Annu. Rev. Immunol 19, 683–765. [DOI] [PubMed] [Google Scholar]
- Moschen AR, Gerner RR, Wang J, Klepsch V, Adolph TE, Reider SJ, Hackl H, Pfister A, Schilling J, Moser PL, et al. (2016). Lipocalin 2 protects from inflammation and tumorigenesis associated with gut microbiota alterations. Cell Host Microbe 19, 455–469. [DOI] [PubMed] [Google Scholar]
- Mumm JB, Emmerich J, Zhang X, Chan I, Wu L, Mauze S, Blaisdell S, Basham B, Dai J, Grein J, et al. (2011). IL-10 elicits IFNγ-dependent tumor immune surveillance. Cancer Cell 20, 781–796. [DOI] [PubMed] [Google Scholar]
- Murata Y, Kotani T, Supriatna Y, Kitamura Y, Imada S, Kawahara K, Nishio M, Daniwijaya EW, Sadakata H, Kusakari S, et al. (2015). Protein tyrosine phosphatase SAP-1 protects against colitis through regulation of CEACAM20 in the intestinal epithelium. Proc. Natl. Acad. Sci. USA 112, E4264–E4271. [DOI] [PMC free article] [PubMed] [Google Scholar]
- Oft M (2014). IL-10: master switch from tumor-promoting inflammation to antitumor immunity. Cancer Immunol. Res 2, 194–199. [DOI] [PubMed] [Google Scholar]
- Rhee I, Bachman KE, Park BH, Jair KW, Yen RW, Schuebel KE, Cui H, Feinberg AP, Lengauer C, Kinzler KW, et al. (2002). DNMT1 and DNMT3b cooperate to silence genes in human cancer cells. Nature 416, 552–556. [DOI] [PubMed] [Google Scholar]
- Ruffell B, Chang-Strachan D, Chan V, Rosenbusch A, Ho CM, Pryer N, Daniel D, Hwang ES, Rugo HS, and Coussens LM (2014). Macrophage IL-10 blocks CD8+ T cell-dependent responses to chemotherapy by suppressing IL-12 expression in intratumoral dendritic cells. Cancer Cell 26, 623–637. [DOI] [PMC free article] [PubMed] [Google Scholar]
- Shvedova AA, Kisin ER, Yanamala N, Tkach AV, Gutkin DW, Star A, Shurin GV, Kagan VE, and Shurin MR (2015). MDSC and TGFb are required for facilitation of tumor growth in the lungs of mice exposed to carbon nanotubes. Cancer Res. 75, 1615–1623. [DOI] [PMC free article] [PubMed] [Google Scholar]
- Stayrook KR, McKinzie JH, Burke YD, Burke YA, and Crowell PL (1997). Induction of the apoptosis-promoting protein Bak by perillyl alcohol in pancreatic ductal adenocarcinoma relative to untransformed ductal epithelial cells. Carcinogenesis 18, 1655–1658. [DOI] [PubMed] [Google Scholar]
- Tanikawa T, Wilke CM, Kryczek I, Chen GY, Kao J, Núñez G, and Zou W (2012). Interleukin-10 ablation promotes tumor development, growth, and metastasis. Cancer Res. 72, 420–429. [DOI] [PMC free article] [PubMed] [Google Scholar]
- Udden SMN, Peng L, Gan JL, Shelton JM, Malter JS, Hooper LV, and Zaki MH (2017). NOD2 suppresses colorectal tumorigenesis via downregulation of the TLR pathways. Cell Rep 19, 2756–2770. [DOI] [PMC free article] [PubMed] [Google Scholar]
- Wang H, Yan M, Sun J, Jain S, Yoshimi R, Abolfath SM, Ozato K, Coleman WG Jr., Ng AP, Metcalf D, et al. (2014). A reporter mouse reveals lineage-specific and heterogeneous expression of IRF8 during lymphoid and myeloid cell differentiation. J. Immunol 193, 1766–1777. [DOI] [PMC free article] [PubMed] [Google Scholar]
- Weisenberger DJ, Siegmund KD, Campan M, Young J, Long TI, Faasse MA, Kang GH, Widschwendter M, Weener D, Buchanan D, et al. (2006). CpG island methylator phenotype underlies sporadic microsatellite instability and is tightly associated with BRAF mutation in colorectal cancer. Nat. Genet 38, 787–793. [DOI] [PubMed] [Google Scholar]
- Yan M, Wang H, Sun J, Liao W, Li P, Zhu Y, Xu C, Joo J, Sun Y, Abbasi S, et al. (2016). Cutting edge: expression of IRF8 in gastric epithelial cells confers protective innate immunity against Helicobacter pylori infection. J. Immunol 196, 1999–2003. [DOI] [PMC free article] [PubMed] [Google Scholar]
- Yu CR, Dambuza IM, Lee YJ, Frank GM, and Egwuagu CE (2013). STAT3 regulates proliferation and survival of CD8+ T cells: enhances effector responses to HSV-1 infection, and inhibits IL-10+ regulatory CD8+ T cells in autoimmune uveitis. Mediators Inflamm. 2013, 359674. [DOI] [PMC free article] [PubMed] [Google Scholar]
Associated Data
This section collects any data citations, data availability statements, or supplementary materials included in this article.