

Abstract
Modularity is a fundamental property of megasynthases such as polyketide synthases (PKSs). In this study, we exploit the close resemblance between PKSs and animal fatty acid synthase (FAS) to re‐engineer animal FAS to probe the modularity of the FAS/PKS family. Guided by sequence and structural information, we truncate and dissect animal FAS into its components, and reassemble them to generate new PKS‐like modules as well as bimodular constructs. The novel re‐engineered modules resemble all four common types of PKSs and demonstrate that this approach can be a powerful tool to deliver products with higher catalytic efficiency. Our data exemplify the inherent plasticity and robustness of the overall FAS/PKS fold, and open new avenues to explore FAS‐based biosynthetic pathways for custom compound design.
Keywords: multidomain protein, modularity of megasynthases, polyketide synthase, protein engineering, fatty acid synthase
Abbreviations
- ACP
acyl carrier protein
- AT
acyltransferase
- CMN
Corynebacteria, Mycobacteria and Nocardia
- DH
dehydratase
- ER
enoylreductase
- FAS
fatty acid synthase
- KR
ketoreductase
- KS
ketosynthase
- LD
linker domain
- MAT
malonyl‐/acetyltransferase
- PKS
polyketide synthases
- TE
thioesterase
- ψKR
truncated structural KR fold
- ψME
truncated structural methyltransferase fold
Introduction
Fatty acid synthesis is an essential process in living cells that contains characteristics of non‐modular as well as modular systems (Fig. 1). In plants, bacteria and in mitochondria, the biosynthesis is conducted by separate enzymes known as the Type II synthesis. Defining an individual enzymatic function as a unit of the overall system, this reflects a fine‐tuned non‐modular organization embedded in the metabolism of the cell. It is tempting to speculate here that every single active site and the interactions between the separate enzymes have evolved toward a high performance in the specific task of de novo fatty acid synthesis. In Corynebacterium, Mycobacterium, and Nocardia (CMN) group bacteria, fungi and higher eukaryotes essentially the same enzymatic functions [Fig. 2(A)] have clustered to form modules creating multidomain (Type I) proteins of up to megadalton sizes.1 During the course of evolution, genes that lined up on genome level fused to form the Type I systems, supported by the insertion of scaffolding domains that stabilize the partly elaborate architectures.2, 3, 4 The origin of fatty acid biosynthesis in large complexes (CMN bacteria and eukaryotes) is still a matter of speculation. A benefit of Type I FAS mediated synthesis lies in the kinetic efficiency of the compartmentalized reaction and a coordinated expression and regulation of multidomain proteins.5
Figure 1.
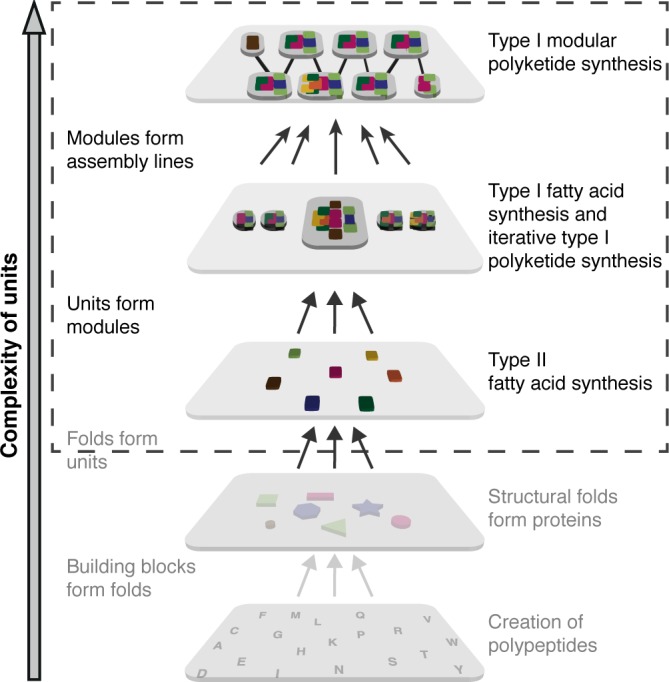
Modular versus non‐modular organization of systems. Simplified cartoon representation of Type I and Type II fatty acid and polyketide synthesis. Whereas the Type II fatty acid synthesis contains major aspects of a non‐modular system, modular Type I PKSs have evolved modularity. A unit is defined as an enzymatic function provided by an alone‐standing enzyme or a domain. Modularity can be applied at several organizational levels, as e.g., the individual amino acids as building blocks of folds.
Figure 2.
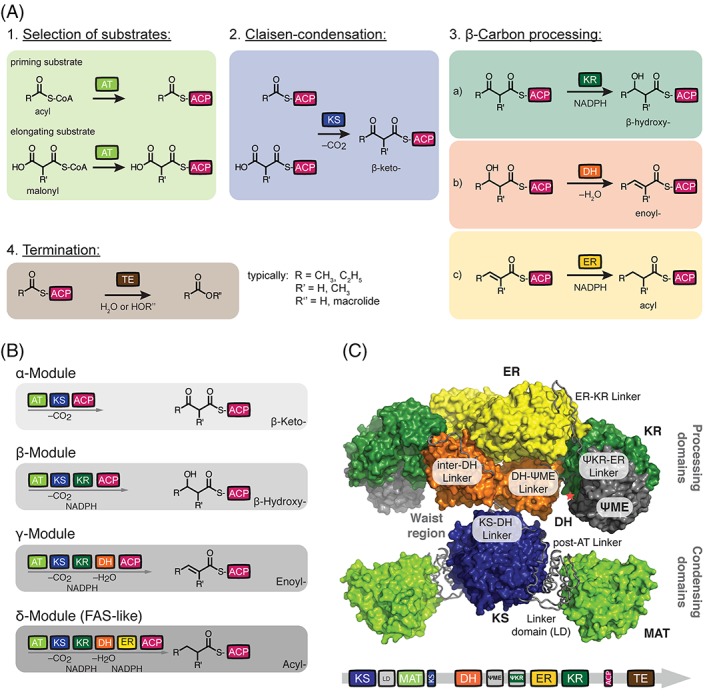
Architecture of animal FAS and PKS. (A) Commonly used domains of FASs and PKSs. Domain nomenclature: MAT, malonyl‐/acetyltransferase; AT, acyltransferase; KS, ketosynthase; KR, ketoreductase; DH, dehydratase; ER, enoylreductase; TE, thioesterase; ACP, acyl carrier protein; LD, linker domain; ψKR; truncated structural KR fold; ψME; truncated structural methyltransferase fold. (B) Domains are covalently connected in modules of FAS/PKS proteins. Essentially four module types appear in the FAS/PKS (cis‐AT PKS) family, and are termed α‐ (KS‐AT‐ACP), β‐ (KS‐AT‐KR‐ACP), γ‐ (KS‐AT‐DH‐KR‐ACP), and δ‐modules (KS‐AT‐DH‐ER‐KR‐ACP). The different modules elongate and modify the polyketide intermediate. In a first of putatively several elongation cycles, R and R’ refer to typically CH3 and C2H5 as well as H and CH3, respectively. Color code as introduced in (a). (C) X‐ray structure of animal FAS with domains and inter‐domain linkers in surface and tube representation, respectively (porcine FAS, PDB accession code 2vz9).12 Red asterisk indicates the C‐terminus of the KR domain, where the ACP and TE domains are flexibly tethered. TE and ACP could not be traced in electron density in the X‐ray structure. Color code as introduced in (a).
The phenomenon of modularity is clearly manifested in the modular polyketide synthase (PKS) system creating compounds of vast diversity and remarkable complexity.6, 7 Polyketides are mainly produced in microorganisms to provide an advantage in a challenging environment, and serve as a rich source of pharmaceutically relevant chemical entities. This enzyme class shows many characteristics of a modular system, since the units carrying the enzymatic functions are tightly clustered in modules [Fig. 2(B)], while the modules are solely connected via few linkages (Fig. 1). The modular character makes these enzymes highly interesting for rational protein design,8, 9 and computational analysis suggests that employing modularity, modular PKSs can potentially produce hundreds of millions of polyketide compounds.10
In this study, we use an animal FAS, which is evolutionary related to modules from PKSs, to investigate aspects of modularity of this protein class on the protein level. Animal FAS is a suited model protein for this type of study, since it is well known in structure and function [Fig. 2(C)], contains the full set of commonly used enzymatic functionalities occurring in PKSs and is catalytically highly efficient.11, 12, 13 By truncating and dissecting the animal FAS fold into its functional units, we probe the robustness and functional integrity of separated domains, which we then rewire to new modules and bimodular assemblies.
Results
Recombinant expression of human FAS
Escherichia coli is a valuable heterologous host for recombinant protein production owing to low costs for cell culturing and fast and simple mutagenesis cycles. The decision to work with E. coli was supported by an early study on the purification of human FAS (hFAS) from recombinant expression in E. coli,14 and the previously reported successful production of the 320 kDa Type I bacterial and fungal FAS in E. coli.15, 16 A successful production and subsequent understanding of hFAS would be of immense importance as it represents a potential drug target in the treatment of cancer and obesity.17, 18 But attempts to access hFAS from E. coli expressions were either unsuccessful or yielded aggregated material, as also stated elsewhere.19 For detailed information on the expression of the hFAS encoding gene in E. coli, see Supporting note and Figures S1–S4.
Expression and characterization of recombinant mFAS
On the other hand, the homologue from mouse (mFAS) sharing 81% sequence identity to hFAS (Fig. S5) could be obtained as soluble protein.13 We established a protocol to purify mFAS by a double‐tagging, dual‐affinity chromatographic procedure, yielding 1.5–2 mg of purified protein from 1 L of E. coli culture [Fig. 3(A)]. As E. coli is not capable of performing the essential post‐translational modification of the ACP domain of mFAS, the phosphopantetheine transferase Sfp from Bacillus subtilis was co‐expressed to obtain fully‐activated protein (for quantification, see cited reference).13 The integrity of the protein and its oligomeric state were monitored by size exclusion chromatography (SEC) [Fig. 3(B)]. Based on earlier studies on rat FAS,20 samples were incubated in high ionic strength buffer at 37°C to facilitate complete dimer reassociation without significant aggregation. The dimer fraction from SEC was subjected to a NADPH consumption assay with substrates malonyl‐ and acetyl‐CoA to determine fatty acid synthesis activity photometrically and steady‐state kinetic parameters fluorometrically [Fig. 3(C) and (D)].21 We determined a specific malonyl consumption rate of 282 ± 16 nmol min−1 mg protein−1, which was similar to previously reported values for recombinantly produced human FASs (hFAS from insect cells: 220 ± 30 nmol min−1 mg protein−1 and from HepG2 cells: 231 nmol min−1 mg protein−1).14, 22 In comparison to this, significantly higher activities (3–5‐fold) have been reported for other animal FASs purified from native tissues and recombinant rat FAS from insect cells sharing 91% sequence identity to mFAS.23, 24
Figure 3.
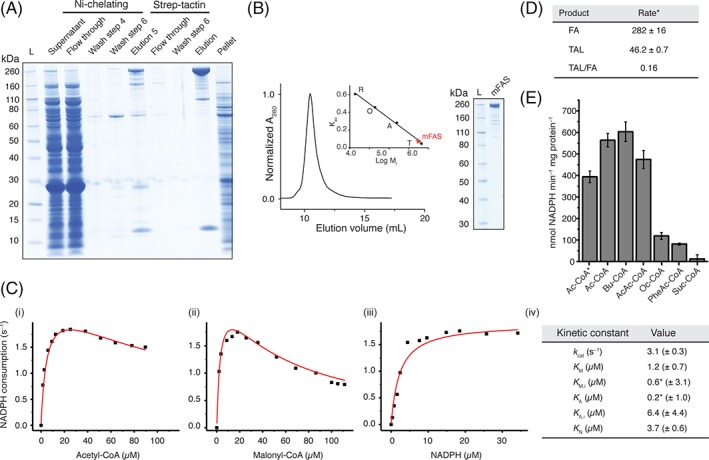
Purification and quality control of mFAS. (A) SDS‐PAGE (NuPAGE 4–12% Bis‐Tris) of tandem affinity purification of mFAS, co‐expressed with Sfp, using Ni‐chelating and subsequent Strep‐Tactin chromatography. mFAS has only little tendency to aggregate, compared to hFAS (see also Figs. S2–S4). (B) SEC of purified mFAS with absorbance normalized to the highest peak. mFAS elutes at an apparent molecular weight of 601 kDa (theoretical weight: 554 kDa). Calibration shown in inset: T, thyroglobulin; a, aldolase; O, ovalbumin; R, ribonuclease. (C) Typical plots of the initial velocity divided by the total enzyme concentration versus the concentration of (i) acetyl‐CoA (19 μM malonyl‐CoA and 30 μM NADPH), (ii) malonyl‐CoA (13 μM acetyl‐CoA and 30 μM NADPH) and (iii) NADPH (13 μM acetyl‐CoA and 19 μM malonyl‐CoA). NADPH consumption was monitored fluorometrically. For curve fitting see Methods section. The asterisk indicates that the ratio of K A/K M,I is well defined, but the absolute value of either is not.21 (D) comparison of the consumption rate of malonyl‐CoA of mFAS for fatty acid (FA) and triacetic acid lactone (TAL) synthesis. The rate is given in nmol malonyl‐CoA consumed per minute and mg protein. Data were collected in biological replicates (n = 3). For FA synthesis, the rate of NADPH consumption was divided by two (one elongation requires two NADPH molecules) and the rate of TAL production was multiplied by two (two elongations deliver one TAL molecule). (E) Specificity of mFAS for different starter units. NADPH consumption assay was performed as described in the Methods section. Substrate concentrations were 100 μM X‐CoA, 100 μM malonyl‐CoA, and 40 μM NADPH, respectively. Ac, acetyl‐CoA; Bu, butyryl‐CoA; AcAc, acetoacetyl‐CoA; Oc, octanoyl‐CoA; PheAc, phenylacetyl‐CoA; Suc, succinyl‐CoA. The asterisk indicates usage of a higher concentration of potassium phosphate (350 mM). Data were collected in biological replicates (n = 3).
Under non‐reducing conditions in the absence of NADPH, mFAS produced triacetic acid lactone (TAL) with an averaged malonyl consumption rate of 46 ± 0.7 nmol min−1 mg protein−1, which refers to 16% of the rate for fatty acid synthesis. Different priming substrates were also accepted [Fig. 3(E)], including butyryl‐CoA, which showed the highest rate of fatty acid synthesis, but other substrates as acetoacetyl‐ and octanoyl‐CoA led to reduced turnover rates. Unusual substrates such as phenylacetyl‐CoA and succinyl‐CoA were also tested to investigate the ability to produce modified fatty acids or possibly dicarboxylic acids like adipic acid in vitro. Only phenylacetyl‐CoA was accepted as a substrate with relatively low efficiency.
Deconstruction of the multi‐domain architecture of mFAS
The approach of dissecting the animal FAS fold into its functional components was initiated by breaking up mFAS into condensing, processing and terminating parts [Fig. 4(A)]. The design of the condensing KS‐MAT didomain part was guided by available structural data.12, 19 The construct comprises the native N‐terminus and C‐terminally ends at the waist region of mFAS. The condensing part construct expressed with typical yields of 12–15 mg purified protein from a 1 L E. coli culture, which corresponds to a roughly 10‐fold increase in yield as compared to full‐length mFAS. The processing part, starting at the waist region and extending to the C‐terminal end of the KR domain, was obtained at even higher yields of 38 mg from 1 L cell culture (Fig. S6). Expression of the domains TE and ACP, both as separate proteins, was achieved at about 100 mg and 20 mg per liter culture [Fig. 4(B)], respectively. For a sequence alignment of animal FAS with domain borders highlighted, see Figure S5.
Figure 4.
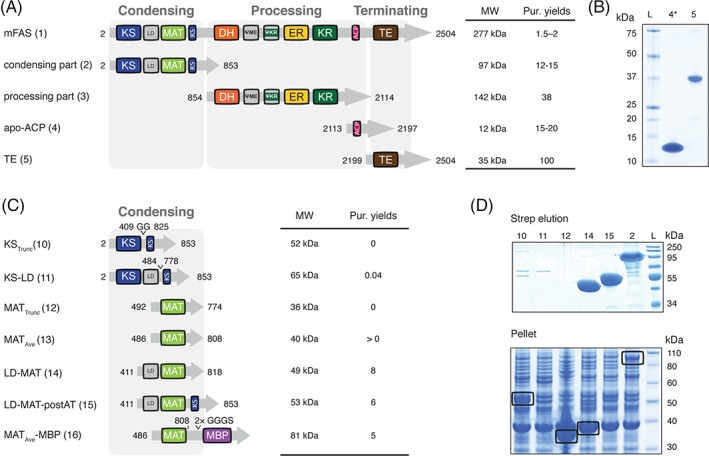
Deconstruction of the mFAS fold. All amino acid positions/numbers refer to the wild type mFAS. Molecular weights refer to proteins without the N‐terminal methionine. (A) Domain organization of mFAS and first engineered mFAS constructs. Construct number are given in brackets. Constructs design was guided by sequence alignments of animal FAS (Fig. S5) and the crystal structure of porcine FAS (PDB: 2vz9).12 (B) Coomassie‐stained SDS‐PAGE gels (NuPAGE 4–12% Bis‐Tris) of constructs comprising domains TE and ACP. Star [*] indicates phosphopantheteinylated ACP received in co‐expression with Sfp.13 (C) domain organization of different constructs containing KS or MAT. The design is based on the crystal structures of the mFAS KS‐MAT substructure (PDB: 5my0) and the avermectin loading AT (PDB: 4rl1).13, 26 (D) Coomassie‐stained SDS‐PAGE gels (NuPAGE 4–12% Bis‐Tris) of constructs comprising domains of the condensing part. Aggregated protein is highlighted by black boxes. Purification yields refer to mg of protein after tandem purification from 1 L cell culture, except for ACP and TE, which were purified only via Ni‐chelating chromatography.
Engineering of the mFAS condensing part
The condensing part of the mFAS fold composed of the KS and MAT domains perform the substrate loading and condensation [Fig. 1(A)]. Since KS‐independent acyl transferases (ATs) appear in PKSs as loading ATs or as trans‐ATs,25 we aimed at liberating the MAT from the intertwined KS‐MAT fold within the mFAS [Fig. 4(C) and (D)].
The separated MAT‐domain was accessible in E. coli in two construct designs, which both contain the linker domain (LD), but optionally include the post‐AT linker [Fig. 4(C): Constructs 14 and 15] yielding about 5–10 mg of purified protein from a 1 L culture. These constructs were further truncated by removing LD, based on the X‐ray crystal structure of the avermectin loading AT.26 A minimal MAT construct (492–774; 12) lacking a part of a β‐sheet (780–783) and the long C‐terminal α‐helix (792–806) was not stably folded in E. coli as detected in the insoluble fraction [Fig. 4(D)]. A slightly elongated construct (486–806; 13; termed MATAve) matching the avermectin loading AT fold was then sufficiently expressed when attaching a maltose binding protein (MBP; 16) to the C‐terminal helix. The integrity of Construct 16 was confirmed by SEC and by a comparable transacylation rate as for the MAT domain in the wild type mFAS as previously reported.13 The KS‐domain in constructs with (11) or without LD (10) could not be expressed as a discrete protein in E. coli [Fig. 4(C) and (D)].
Engineering of PKS‐like reducing modules
Essentially, four common module types are observed in modular Type I PKSs (cis‐AT PKSs); α‐ (KS–AT–ACP), β‐ (KS–AT–KR–ACP), γ‐ (KS–AT–DH–KR–ACP) and δ‐modules (KS–AT–DH–ER–KR–ACP), which differ in the presence of modifying domains [Fig. 2(B)].27 To probe the structural tolerance of the processing part of mFAS, we aimed at reconstructing PKS‐like β‐ to δ‐modules. The deletion of the minimally connected TE domain from mFAS yielded about 3 mg of purified δ‐module (6; 2–2195) from 1 L cell culture [Fig. 5(B) and (C)]. The γ‐module (7; 2–1517 + 1870–2195) was purified at similar yields and was designed by directly bridging P1517 and S1870 (Cα–Cα distance of 5.7 Å) to exclude the ER domain.12 Finally, the β‐module (8; 2–858 + 1104–1517 + 1870–2195) was created by deleting the DH domain, which was achieved by linking the waist region of mFAS to the full DH‐ψME linker (connecting residue S858 with S1104). Construct 8 expressed marginally better than Construct 7 with a typical protein yield of about 3.5 mg from 1 L cell culture [Fig. 5(B) and (C)]. All these PKS‐like modules were subjected to SEC [Fig. 5(D)]. The δ‐module showed a distinct dimer peak similar to that observed with full‐length mFAS. Deletion of the ER domain, reducing the dimeric interface, led to predominantly monomeric β and γ‐module.
Figure 5.
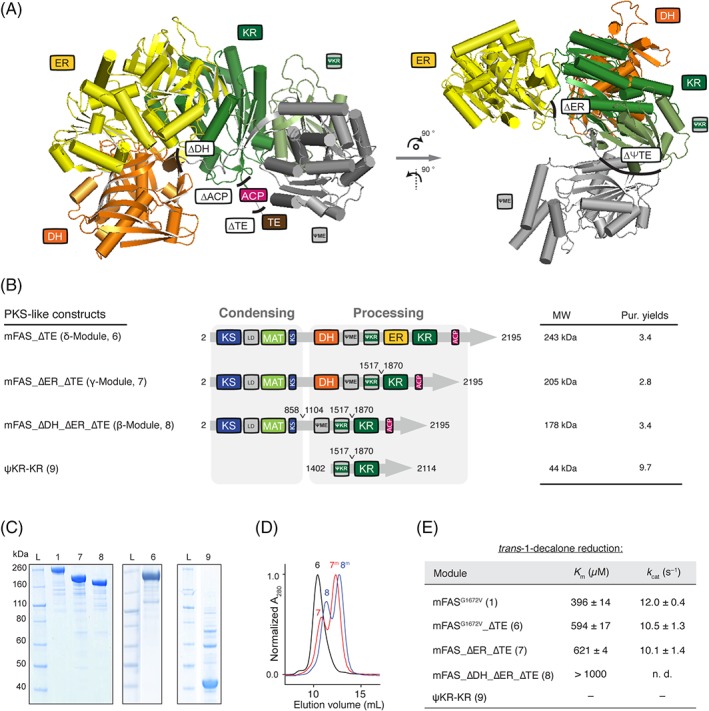
Construction of PKS‐like reducing modules. (A) Structure of the monomeric processing part (porcine FAS; PDB: 2vz9) in cartoon depiction.12 The ψKR fold supports the integrity of the catalytic KR domain and is the docking site for the ψME domain. Black lines indicate sites used for the design on beta to delta modules. (B) Domain organization of modules rebuilding highly reducing (Construct 6; δ‐module) and partially reducing (Construct 7; γ‐module and Construct 8; β‐module) PKSs. Purification yields refer to mg of protein after tandem purification from 1 L cell culture. (C) Coomassie‐stained SDS‐PAGE (NuPAGE 4–12% Bis‐Tris) of purified reducing modules (β‐, γ‐, and δ‐). Construct 9 was purified via a Strep‐tactin affinity chromatography, but shows impurities. (D) SEC of purified Constructs 6, 7 and 8 with absorption normalized to the highest peak. Samples 7 and 8 were not incubated at 37°C before SEC runs. Peaks correspond to apparent molecular weights of 584 kDa, 490 (237), and 378 (200) kDa, respectively (theoretical dimer molecular weights: 6: 486 kDa, 7: 410 kDa and 8: 356 kDa). “M” refers to monomeric species. (E) Specific KR activity determined by a trans‐1‐decalone reduction.23 The ER domain was knocked out by mutation G1672 V;53 n.d. means not determined, and “–“no detectable activity. Errors refer to standard deviation from four technical replicates.
The stability of the three modules was investigated by a thermal shift assay (TSA) revealing comparable melting temperatures as that of the wild type mFAS (Fig. S7). Overall the deletion of the TE domain slightly increased the stability of the modules compared to mFAS (change in melting temperatures of up to 2°C), whereas a deletion of processing domains in β and γ‐modules decreased the melting temperature of the ∂‐module by about 1°C. In general, melting temperatures were less affected by domain deletions than by the change of buffer solutions.
The first step in the series of potentially three processing reactions is the KR‐mediated reduction of the β‐ketoacyl moiety and hence the KR domain is crucial for all reducing PKS modules. It is known that the KR domain (comprising of a catalytic and a structural [ψKR] fold) plays also an important structural role in FASs serving as a hub of the processing part [Fig. 5(A)].12 Therefore, we determined specific KR activity with the trans‐1‐decalone reduction assay as a sensitive measure to quantify the impact of domain deletions [Fig. 5(E)].23 For the full‐length mFAS bearing a mutation in the Rossmann fold of the ER domain G1672 V,20 kinetic constants K m and k cat were determined to 396 ± 14 μM and 12.0 ± 0.4 s−1, respectively, which was determined to be four‐fold smaller (2.6 nmol min−1 μg protein−1) in comparison to the corresponding value for recombinant rat FAS measured at 37°C (11 nmol min−1 μg protein−1).23 The designed PKS‐like modules also showed differences to the KR specific kinetic parameters. For example, the δ‐module (without the TE domain) showed marked increase of the K m by approximately 50% (594 ± 17 μM) and a slight decrease of the k cat (10.5 ± 1.3 s−1). γ‐Module (Construct 7) gave similar values for KR activity as the δ‐module (K m of 621 ± 4 μM and k cat of 10.1 ± 1.4 s−1) and hence deletion of the ER domain did not affect KR activity. Due to limited solubility of trans‐1‐decalone we could not determine accurate values for Construct 8 (β‐module), but the estimated K m clearly increased as compared to the other constructs [Fig. 5(E)]. Finally, the stand‐alone KR (9) containing just ψKR and KR was expressed as soluble protein, but did not show KR activity [Fig. 5(A–C) and (E)]. See Figure S6, for engineering of the processing part as constructs separated from the condensing part.
Engineering of a PKS‐like non‐reducing α‐module
Engineering of a non‐reducing α‐module [Fig. 2(B)] requires the direct linkage of the ACP domain to the condensing part. For an initial KS‐ACP linker design, we have used the linkers from Module 3 and Module 11 (both non‐reducing α‐modules) of the avermectin synthase (AVES 2: Uniprot number Q9S0R7; AVES 4: Q79ZM6) [Fig. 6(A)]. C‐terminal ends of the post‐AT linkers, defining the N‐terminus of the designed linker, were identified by localizing a conserved motif occurring in most PKSs (AVESKS3: YPFQHHHYW; AVESKS11: YAFERERFW).28 The N‐termini of AVESACP domains were determined by homology to the ACP domain of DEBS Module 2 (PDB: 2ju2), and were defining the C‐terminus of designed linkers.29 Using this information, the two linkers with 31 (AVESM3L) and 37 (AVESM11L) amino acid residues in length were inserted between the C‐terminus of the KS domain and the N‐terminus of the ACP domain [by comparison with rat ACP, PDB: 2png; see Fig. 6(B)].30 In the first generation of α‐modules, we used the C‐terminal end of the conserved motif of the post‐AT linker as anchor points for linkers AVESM3L (18) and AVESM11L (20) assuming that the residual stretch of the post‐AT linker only transiently interacts with the KS domain [Fig. 6(B)]. Furthermore, two other constructs were designed that only utilize amino acid residue sequences of mFAS by bridging the first β‐sheet of the DH domain to the natural KR‐ACP linker (linker length: 33 aa) to either connect the ACP domain (Construct: 17) or the ACP‐TE didomain (22). Constructs 18 and 20 yielded only about 25–30% of purified protein, as compared to the yields from 17 and 22, although 18 and 20 did not show an increased tendency toward aggregation [Fig. 6(C)]. Constructs 18 and 20 yielded exclusively monomeric protein that did not dimerize, but aggregated under incubation at 37°C. In contrast, Constructs 17 and 22 were purified as mixtures of monomers and dimers, which could be assembled under appropriate conditions.20 To determine whether the poor protein yield of Constructs 18 and 20 originates from artificial avermectin linkers or the missing C‐terminal stretch of the post‐AT linker of mFAS, we exchanged the first 11 amino acid residues of the AVES linkers by the respective mFAS amino acid sequence to create Constructs 19 and 21 [Fig. 6(A) and (B)]. These constructs showed essentially the same behavior as 17 and 22 in respect to purification yields, the ratio between monomers and dimers and the ability to assemble in high ionic strength buffers.
Figure 6.
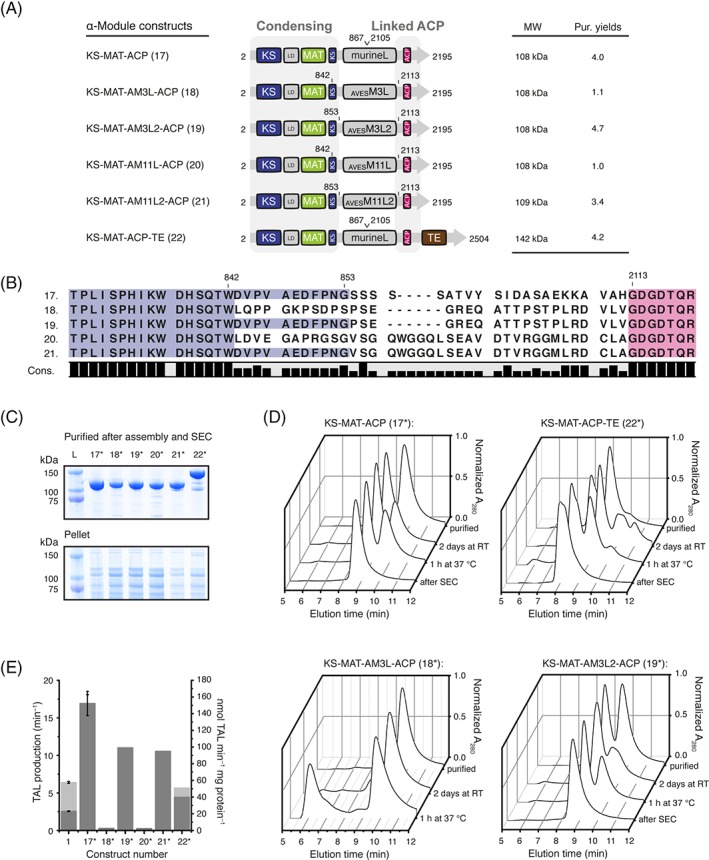
Engineering of a PKS‐like non‐reducing module. (A) Domain organization of α‐modules. The PKS AVES Modules 3 and 11 serve as a template for linker design. (B) Sequence alignment supporting linker design. The mFAS KS domain (post‐AT linker) is shown in blue and mFAS ACP domain in purple. (C) Coomassie‐stained SDS‐PAGE (NuPAGE 4–12% Bis–Tris) of purified α‐modules (upper panel) and insoluble fractions (lower panel). Asterisk (*) indicates phosphopantetheinylated ACP received by co‐expression with Sfp (D) HPLC‐SEC analysis of select constructs with absorption normalized to the highest peak. The chromatographic profiles indicate existence of monomeric and dimeric species. For multiangle light scattering data see Figure S8. (E) TAL assay of purified constructs after preparative SEC. Rates are given in molecules produced per minute (light gray) by dividing by the total enzyme concentration and in TAL production per minute [see Fig. 2(C)] and molecules produced per mg protein (dark gray). TAL production assay was performed as described in the methods section. Error bars reflect the standard deviation of biological triplets, whereas Constructs 18–22 were only analyzed in technical triplets.
Constructs 17, 19, 21, and 22 were further purified by size exclusion chromatography to isolate the dimeric state [Fig. 6(D)] and used to determine rates of TAL formation to provide a quantitative measure to evaluate different construct designs. Constructs 18 and 20 did not show any activity and served as negative controls. Construct 22, with the fused ACP‐TE didomain possessed a TAL formation rate of 5.7 ± 0.3 min−1, which was comparable to the rate observed with the wild type mFAS (6.4 ± 0.1 min−1). Remarkably, Constructs 17, 19, and 21 were significantly more efficient in TAL production than mFAS, which suggests a beneficial effect of the TE truncation on the enzymatic activity of α‐modules. Furthermore, the linker to the ACP domain also influences catalytic efficiency as Construct 17 (16.5 ± 1.6 min−1) was about 50% faster than 19 (10.7 min−1) and 21 (10.3 min−1). Considering the rate per mg of protein, Construct 17 (152 ± 15 nmol min−1 mg protein−1) was about 6–7 times faster than wild‐type mFAS (23 ± 0.5 nmol min−1 mg protein−1).
Generation of bimodular constructs
The feasibility of assembling functional mFAS components to new architectures was performed by attaching loading domains from modular PKSs as well as by fusing domains of the mFAS fold (Fig. 7). For the first approach, we engineered mFAS with N‐terminal fusions of loading domains of PKSs. These constructs mimic the N‐terminal part of PKS synthetic pipelines, which comprise the priming step of polyketide synthesis as well as the first elongation step. DEBS and AVES feature single loading didomains (AT‐ACP didomain) connected to the first module (“module 1”).26, 31 An alternate approach may be derived from the Pikromycin synthase (PikA), which uses a modified α‐module (KS, AT and ACP) with a decarboxylating KS domain and an AT domain, specific for extender substrates.32, 33
Figure 7.
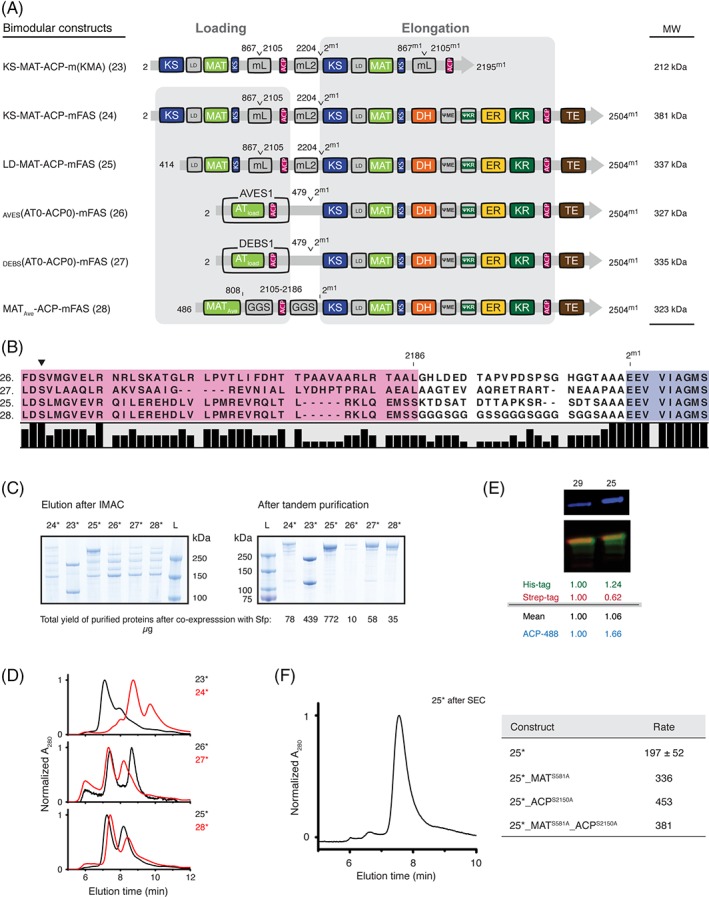
Engineering of bimodular constructs. (A) Domain organization of bimodular constructs. mFAS is used as elongation module (“Module 1”) and different loading modules are fused N‐terminally. Superscript “m1” indicates mFAS domain borders of “Module 1”. Constructs 23–25 are fusions of mFAS with functional units of mFAS exclusively using sequences from mFAS also for linkage. Additionally, loading modules from AVES (AVES 1: Q9S0R8) and DEBS (DEBS 1: Q03131) were utilized. (B) Sequence alignment of select constructs showing sequences of the ACP to KS linker region. The mFAS KS domain is shown in blue (conserved motif: EEVVI, compare DEBS Module 1: EPVAV) and the attached ACP domains in purple. The active site serine phosphopantetheinylated during post‐translation modification is highlighted by a black triangle. (C) Coomassie‐stained SDS‐PAGE (NuPAGE 4–12% Bis–Tris) of purified bimodular constructs after IMAC and tandem purification. Despite purification via tags at both termini, strong bands for truncated proteins remained in preparations of 23 and 24, likely resulting from the co‐purification by heterodimer formation. Protein yields are given in μg and refer to yields of purified protein (tandem purification) after co‐expression with Sfp (star (*)) from 1 L cell culture. (D) HPLC‐SEC of bimodular constructs after dual‐affinity chromatography with absorption normalized to the highest peak. The two peaks refer to the monomeric and dimeric states. For multiangle light scattering data see Figure S8. (E) Phosphopantetheinylation of ACPs in bimodular Construct 25. Quantitative Western blot after in vitro phosphopantetheinylation with CoA‐488. A merged picture is shown in false colors. Antibodies against both tags were used. The anti‐Strep antibody is colored in red and the anti‐His antibody in green. Blue channel refers to fluorescently labeled ACPs. Normalized intensities for all channels are shown below in reference to Control 29 (LD‐MAT‐mFAS). (F) Further analysis of Construct 25*. The isolated dimer from SEC was reassigned by HPLC‐SEC to verify that the oligomeric state is stable in the high ionic strength buffer (left panel). Overall activity of different functional knockouts in the loading didomain of construct 25* addressed by a NADPH consumption assay (right panel). Data are from our previously published paper and rates are given in nmol NADPH min−1 mg protein−1.13
To connect the ACP domain of the loading module with the KS domain of the elongation module, the natural murine ACP‐TE linker was extended with three alanine residues. Construct 23 was created by linking two α‐modules (Construct 17) in sequence. Constructs 24 and 25 were designed by fusing either the α‐module 17 or the MAT‐ACP didomain [resembling Construct 14; Fig. 4(C)] to the full‐length mFAS [Fig. 7(A) and (B)]. Further, loading didomains from AVES and DEBS including their natural ACP‐KS linkers were N‐terminally fused to full‐length mFAS, generating Constructs 26 and 27 [Fig. 7(A) and (B)]. Finally, Construct 28 resembles the architecture of AVES (module 0–1) and was built solely using domains of mFAS connected by two artificial GGS linkers.
The bimodular constructs were expressed in E. coli in co‐expressions with Sfp, and were subsequently purified [Fig. 7(C)]. Constructs with natural PKS loading didomains 26 and 27 as well as Constructs 24 and 28 poorly expressed and suffered from strong proteolysis. Construct 23 showed moderate expression and yielded a heterodimer with a truncated polypeptide chain, which could not be separated with the applied purification strategy. Construct 25 yielded about 800 μg of purified full‐length protein from 1 L cell culture and was used for further analysis. HPLC‐SEC profiles of all samples after dual‐affinity chromatography showed a mixture of monomeric and dimeric species in which monomeric species are pronounced [Fig. 7(D)].
We then performed an in vitro fluorescence assay with Construct 25 [apo‐protein, Fig. 7(E)] to confirm the accessibility of the two ACP domains which indicated a 1.7‐fold increase in‐gel fluorescence intensity when compared to a control construct possessing only one ACP (29; LD‐MAT‐mFAS). The dimer of Construct 25 (holo‐protein) isolated by SEC was stable in high ionic strength buffer and was active as analyzed by the NADPH consumption assay. From the combinatorial study with functional knockouts of the loading didomain, one can observe that the loading module can interact with the inherent mFAS fold [Fig. 7(F)].13
Discussion
Here we present a rational protein engineering approach using murine FAS (mFAS) as a model protein, to study modularity as a property of megasynthases. While modularity has been harnessed on a gene‐level, e.g., by rearranging PKS genes for combinatorial PK synthetic approaches,34 our goal was to assess modularity at a protein level to reveal and quantify engineering effects. Considering the evolutionarily strong connection of FASs and PKSs, some of these findings may also apply to the large and diverse family of PKSs.
Recombinant mFAS from E. coli clearly shows reduced activity when compared to FASs isolated from native tissue or rat FAS expressed in insect cells.23, 24 It is known from proteomic studies that FAS in the native host undergoes additional post‐translational modifications whose absence may lead to lowered catalytic efficiency.35, 36 Alternatively, the reduced overall and specific KR activity could be attributed to partially misfolded particles in the preparations, which are not apparent in the size exclusion patterns. This aspect needs further investigation, as homogenous, intact protein preparations are necessary for structural determination and applications to biotechnology.
Our study began by investigating the structural independence of individual units from the mFAS fold. A multitude of data demonstrates that individual enzymatic domains can be liberated from the structural embedment in the overall fold and remain intact. Befitting examples for that aspect are the MAT, ACP, and TE domain, which can be purified as freestanding proteins that maintain their functionality.13, 37 Furthermore, multidomain subunits as the condensing or processing part were readily accessible by truncation at interconnecting linkers, which were confirmed as suited sites for engineering. The design of PKS‐like reducing β‐, γ‐, and δ‐modules by subsequent deletion of modifying domains confirmed that also the processing part itself has a strong modular character and that the overall mFAS architecture allows relatively easy alterations. The protein integrity was judged by the yield of purified protein (this measure has been used in literature before, see references),38, 39 behavior in SEC and stability of the constructs in thermal shift assays. This suggests that individual domains in the FAS fold have maintained a high degree of independence, contrary to expectations based on the crystal structure,12 as similarly found in comparable iterative reducing PKSs.40
Our findings reveal properties of the FAS/PKS family that have to be considered while engineering megasynthases. A deletion of the ER domain significantly reduced the dimeric interface of PKS‐like modules, which led to an increase of the monomeric protein fraction and hence inactive species. Such modules may need an optimization of remaining dimeric interfaces or, as naturally occurring in some PKSs, an introduction of stabilizing structural motifs like dimerization elements or docking domains.41, 42 Partial activity assays and enzyme kinetics provide a useful tool to quantify these effects and can be used to investigate specific domain‐domain interactions. Hence, the activity of the KR domain in mFAS is essentially unaffected by the presence or absence of the ER domain, whereas a deletion of the DH domain dramatically reduced the catalytic efficiency, which might be explained by a stabilizing effect of α‐helix 989–999 on the Rossmann fold. Moreover, deletion of the TE domain (δ‐module), which is a relatively independent domain without any direct structural interface, altered the specific activity of the KR domain.
A promising application of the modularity of mFAS was demonstrated by the reassembly of the KS‐MAT didomain with the ACP domain to create a non‐reducing PKS‐like α‐module. Although the KS‐domain of FAS is relatively specific for fully reduced carbon chains,43 it has the ability to accept β‐keto groups and can condense acetyl‐CoA with malonyl‐CoA twice to produce TAL.44 Our results from the TAL assay on α‐modules revealed two major aspects: (i) the C‐terminal part of the post‐AT linker, even downstream of the conserved motif, is crucial for the dimerization and activity of the KS domain of mFAS and alterations in its sequence have dramatic effects. This stretch of residues should rather be seen as structural element of the KS domain than as an interdomain linker. (ii) The presence of the TE domain and different linkage of the identical domains KS, MAT, and ACP resulted in marked differences in the catalytic efficiency to produce TAL. Construct 17, which is basically a deletion construct using exclusively mFAS sequences, possessed the highest turnover rates (152 ± 15 nmol min−1 mg protein−1). Remarkably, this created a 6–7‐fold more efficient catalyst than the full‐length mFAS, considering the different masses, and even more significantly than the iterative PKS methylsalicylic acid synthase (MSAS) from Penicillium patulum (12.5 nmol TAL min−1 mg protein−1).45
We finally investigated the interconnection of FAS‐based modules. The simplest bimodular system was created by a N‐terminal fusion of loading didomains to the mFAS fold. Remarkably, such constructs were expressible in E. coli, although the yield of purified protein as well as the protein quality was dramatically decreased. The main challenge in expressing such constructs seems to avoid in vivo proteolysis, which may be achieved by sequence optimization of the mFAS gene. Nonetheless our initial experiments confirmed the dimeric state of all constructs and we could prove a kinetic influence of the loading didomain on fatty acid synthesis in Construct 25.13
Conclusion and Outlook
mFAS is a modular system that can readily be dissected into its functional units. The units can further be reassembled into new modules with altered catalytic properties. The open architecture of animal FAS is well suited for engineering approaches, since it allows the construction of PKS‐like multi‐modular systems. By this property, animal FAS can potentially make a larger spectrum of compounds available than the barrel‐structured fungal and bacterial Type I FASs.46, 47, 48
Materials and Methods
pVR01 (a pET22b[+] derivative) was used as a master plasmid for cloning the human FAS gene [codon optimized; synthetic gene from Mr Gene (GeneArt, ThermoFisher)] encoding a construct with an N‐terminal StrepI and a C‐terminal H(8)‐tag. FASN genes from Homo sapiens and Mus musculus were purchased from Source BioScience (cDNA clones: IRAK110M20 and IRAVp968A0187D). Plasmids encoding chaperones from E. coli (TF, TF[N + C], DnaK, DnaJ, GrpE, GroEl, and GroEs) were kindly provided by Prof. Hartl from the MPI Martinsried, whereas plasmids encoding DEBS 1, DEBS 2, and DEBS 3 (pBP144 and pBP130) were kindly provided by the Khosla laboratory at Stanford University. Microbial genomic DNA was purchased from DSMZ: Pyrococcus furiosus (DSM3638) and Streptomyces avermitilis (DSM46492). We performed PCR based cloning for deletions or point mutations and ligation independent cloning with the In‐Fusion HD Cloning Kit (Clonetech) as described previously.13 All plasmids encoding the presented constructs are listed in the Supplemental Info (Table S1). Primers and information about cloning are summarized in Table S2. The sequences of all used plasmids were confirmed with the “dye terminator” method. All CoA‐esters were purchased from Sigma‐Aldrich. Uncropped pictures of SDS‐gels are provided in Figure S9.
Expression of FAS and truncated constructs thereof
All plasmids were transformed into chemically competent E. coli BL21gold(DE3) cells. The transformants were grown overnight at 37°C in 20 mL LB (100 μg mL−1 ampicillin (amp) and 1% (w/v) glucose) medium. Pre‐cultures were used to inoculate 1 L TB medium (100 μg mL−1 amp). Cultures were grown at 37°C until they reached an optical density (OD600) of 0.5–0.6. After cooling at 4°C for 20 min, cultures were induced with 0.25 mM IPTG, and grown for additional 14–16 h at 20°C and 180 rpm. Cells were harvested by centrifugation (4000 rcf for 20 min). The cell pellets were resuspended in lysis buffer 1 [50 mM sodium phosphate, 200 mM NaCl, 10% [v/v] glycerol, 1 mM EDTA, 1 mM DTT, 20 mM imidazole (pH 7.6)] or lysis buffer 2 [50 mM sodium phosphate, 450 mM NaCl, 20% (v/v) glycerol, 1 mM DTT, (pH 7.6)] and lysed by French press. After centrifugation at 50,000 rcf for 30 min, the supernatant was mixed with 1 M MgCl2 to a final concentration of 2 mM. The cytosol was transferred to Ni‐NTA‐columns and washed with 5 column volumes (CV) wash buffer (lysis buffer without EDTA). Bound protein was eluted with 2.5 CV elution buffer (50 mM sodium phosphate, 200 mM NaCl, 10% (v/v) glycerol, 1 mM DTT, 300 mM imidazole (pH 7.6). The eluent was transferred to Strep‐Tactin columns, and washed with 5 CV strep‐wash buffer [250 mM potassium phosphate, 10% (v/v) glycerol, 1 mM EDTA, 1 mM DTT (pH 7.6)]. Proteins were eluted with 2.5 CV elution buffer (strep‐wash buffer containing 2.5 mM D‐desthiobiotin). After concentration to 5–20 mg mL−1, the proteins were frozen in liquid nitrogen and stored at −80°C. Samples were thawed at 37°C for 30 min and further polished by size‐exclusion chromatography (SEC) using a Superdex 200 GL10/300 column equilibrated with the strep‐wash buffer. Proteins were concentrated again to 5–20 mg mL−1 and stored frozen in aliquots using liquid nitrogen.
Protein concentrations were calculated from the absorbance at 280 nm, which was recorded on a NanoDrop 2000c (Thermo Fisher Scientific). Extinction coefficients were calculated from the primary sequence without N‐formylmethionine with CLC Main workbench (Qiagen).
HPLC‐SEC analysis
HPLC analysis of proteins was performed using a Dionex UltiMate 3000 RSLC equipped with a RS fluorescence detector. Chromatographic separation was performed on a SEC column (bioZen 1.8 μm SEC‐3) in the buffer (150 mM KPi, pH 6.8) at room temperature. Proteins were detected by monitoring the absorbance at 280 nm. Dimeric FAS was found to elute at 7.5–7.6 min.
The signal for multiangle light scattering (MALS) was monitored using a miniDAWN TREOS MALS detector (Wyatt Technology Corporation) operated with a linear polarized laser light at 658 nm. Data were analyzed with the software ASTRA (version 7.1.0.29, Wyatt Technology Corporation, USA).
Overall fatty acid synthase activity
FAS activity was measured fluorometrically with a microplate reader (CLARIOstar, BMG LABTECH GmbH) by following the oxidation of NADPH at 25°C in 50 mM potassium phosphate (pH 7.0), 10% glycerol (v/v), 1 mM DTT, 75–100 μM acetyl‐CoA or other priming substrates, 100 μM malonyl‐CoA and 40 μM NADPH. Alternatively, the absorbance at 340 nm was observed with a NanoDrop in cuvette mode using an extinction coefficient for NADPH of 6220 M−1 cm−1. The enzyme was prepared in a 4‐fold stock containing BSA (0.12 mg/mL) for stabilization, resulting in a final protein concentration (one polypeptide chain) of 20 nM and BSA (0.03 mg/mL) in the assay. The reaction was initiated by the addition of malonyl‐CoA. Every measurement was performed in technical triplicates and the corresponding background (without CoA‐esters) was subtracted.
Microplate reader settings were as follows: excitation: 348–20 nm; emission: 476–20 nm; gain: 1490; focal height: 5.7 mm; flashes: 17; orbital averaging: 4 mm.
Analysis of kinetic data from overall fatty acid synthesis
Data was analyzed according to the methods of Cox and Hammes using the software OriginPro 8.5 (OriginLab, USA).21 To facilitate a global fit of the three data sets (varied substrate concentrations of NADPH, acetyl‐CoA, and malonyl‐CoA) in Origin, the equation:
| (1) |
had to be converted into
| (2) |
where parameters s Ac, s Mal, and s N were put to zero or one assigning the summand to the respective data set. As other substrate concentrations were kept constant, all concentrations reduced to simple numbers. All other kinetic constants are defined as described in Cox and Hammes.21
Triacetic acid lactone (TAL) production assay
TAL production was monitored photometrically with a NanoDrop (cuvette mode) by observing the increase in absorbance at 298 nm. Two solutions were prepared in the assay buffer (50 mM potassium phosphate, pH 7.0, 10% (v/v) glycerine, 1 mM DTT and 0.03–0.05 mg/mL BSA). Solution 1 contained the substrates acetyl‐ and malonyl‐CoA (both 200 μM) and Solution 2 contained the enzyme (1400 nM) in 2‐fold concentrated stock solutions. 50 μL of both solutions (incubated at 25°C) were mixed to final concentrations of 100 μM acetyl‐CoA, 100 μM malonyl‐CoA and 700 nM enzyme and the absorbance was monitored for 5 min. No background increase in the absence of enzyme was detected and the absorbance was converted into concentrations by using the extinction coefficient for TAL of ε = 2540 M−1 cm−1.49 All assays were performed in triplicates and the mean values were calculated from the initial linear phase of the TAL production curve.
Specific ketoreductase activity
Ketoreductase activity was measured fluorometrically by monitoring the consumption of NADPH at 25°C according to previous reports.23, 50 Two solutions were prepared in the assay buffer (100 mM potassium phosphate, pH 7.0) with Solution 1 containing the enzyme and trans‐1‐decalone and Solution 2 containing the NADPH, which was used to start the reaction. 50 μL of both solutions (incubated at 25°C) were mixed to final concentrations of 0.05–0.15 μM enzyme, 0.02–10 mM (±)‐trans‐1‐decalone and 300 μM NADPH and the consumption was monitored for 15 min. Fluorescence was converted into concentrations by using a calibration curve with NADPH in the respective buffer.
Microplate reader settings (Tecan Infinite M200) were the following: excitation: 360–20 nm; emission: 455–20 nm; gain: 110.
Thermal shift assay
Thermal shift assays were performed as previously reported.51 Briefly, 2 μL of protein solution (20 μM) were mixed with 21 μL of the respective buffer and 2 μL of SYPRO Orange protein gel stain (5000 × diluted), then fluorescence was measured from 5°C to 95°C with a step of 0.5°C min−1, with excitation wavelength set to 450–490 nm, and emission wavelength to 560–580 nm. Data were analyzed with the software OriginPro 8.5 (OriginLab, USA) following the instructions of Huynh and Partch.52
Authors’ contribution
A.R. performed molecular cloning, protein expression, purification experiments, enzymatic assays and analyzed corresponding data. A.R. conceived the project. M.G. designed the research. D.D. established and performed specific KR kinetic experiments and the TSA with PKS‐like modules under supervision of A.R. A.H. established and performed kinetic experiments on the whole mFAS under supervision of A.R. The authors A.R., K.S.P., and M.G. analyzed data and wrote the manuscript.
Conflict of interest
The authors declare no conflict of interest.
Supporting information
Figure S1: Cloning of human FAS expression constructs in E. coli
Figure S2: Screening of expression conditions for human FAS in E. coli
Figure S3: Co‐expression of hFAS with chaperones encoding genes
Figure S4: Expression of hFAS and mFAS constructs in large scale (1‐2 L expression cultures)
Figure S5: Sequences of animal type I FAS
Figure S6: Deconstruction of the processing part of mFAS
Figure S7: Thermal shift assay
Figure S8: Confirmation of the oligomeric state of select constructs
Figure S9: Original pictures of relevant presented gels
Table S1: List of plasmids
Table S2: List of primers
Acknowledgments
This work was supported by a Lichtenberg grant of the Volkswagen Foundation to M.G. (Grant number 85701). Further support was received from the LOEWE program (Landes‐Offensive zur Entwicklung wissenschaftlich‐ökonomischer Exzellenz) of the state of Hesse conducted within the framework of the MegaSyn Research Cluster.
References
- 1. Herbst DA, Townsend CA, Maier T (2018) The architectures of iterative type I PKS and FAS. Nat Prod Rep 35:1046–1069. [DOI] [PMC free article] [PubMed] [Google Scholar]
- 2. Schweizer E, Hofmann J (2004) Microbial type I fatty acid synthases (FAS): major players in a network of cellular FAS systems. Microbiol Mol Biol Rev 68:501–517. [DOI] [PMC free article] [PubMed] [Google Scholar]
- 3. Bukhari HST, Jakob RP, Maier T (2014) Evolutionary origins of the multienzyme architecture of giant fungal fatty acid synthase. Structure 22:1775–1785. [DOI] [PubMed] [Google Scholar]
- 4. Grininger M (2014) Perspectives on the evolution, assembly and conformational dynamics of fatty acid synthase type I (FAS I) systems. Curr Opin Struct Biol 25:49–56. [DOI] [PubMed] [Google Scholar]
- 5. Sweetlove LJ, Fernie AR (2018) The role of dynamic enzyme assemblies and substrate channelling in metabolic regulation. Nat Commun 9:2136. [DOI] [PMC free article] [PubMed] [Google Scholar]
- 6. Khosla C, Kapur S, Cane DE (2009) Revisiting the modularity of modular polyketide synthases. Curr Opin Chem Biol 13:135–143. [DOI] [PMC free article] [PubMed] [Google Scholar]
- 7. Hertweck C (2009) The biosynthetic logic of polyketide diversity. Angew Chem Int Ed 48:4688–4716. [DOI] [PubMed] [Google Scholar]
- 8. Khosla C, Caren R, Kao CM, McDaniel R, Wang SW (1996) Evolutionally guided enzyme design. Biotechnol Bioeng 52:122–128. [DOI] [PubMed] [Google Scholar]
- 9. Leadlay PF (1997) Combinatorial approaches to polyketide biosynthesis. Curr Opin Chem Biol 1:162–168. [DOI] [PubMed] [Google Scholar]
- 10. González‐Lergier J, Broadbelt LJ, Hatzimanikatis V (2005) Theoretical considerations and computational analysis of the complexity in polyketide synthesis pathways. J Am Chem Soc 127:9930–9938. [DOI] [PubMed] [Google Scholar]
- 11. Smith S, Witkowski A, Joshi AK (2003) Structural and functional organization of the animal fatty acid synthase. Prog Lipid Res 42:289–317. [DOI] [PubMed] [Google Scholar]
- 12. Maier T, Leibundgut M, Ban N (2008) The crystal structure of a mammalian fatty acid synthase. Science 321:1315–1322. [DOI] [PubMed] [Google Scholar]
- 13. Rittner A, Paithankar KS, Huu KV, Grininger M (2018) Characterization of the polyspecific transferase of murine type I fatty acid synthase (FAS) and implications for polyketide synthase (PKS) engineering. ACS Chem Biol 13:723–732. [DOI] [PubMed] [Google Scholar]
- 14. Jayakumar A, Huang WY, Raetz B, Chirala SS, Wakil SJ (1996) Cloning and expression of the multifunctional human fatty acid synthase and its subdomains in Escherichia coli . Proc Natl Acad Sci U S A 93:14509–14514. [DOI] [PMC free article] [PubMed] [Google Scholar]
- 15. Enderle M, McCarthy A, Paithankar KS, Grininger M (2015) Crystallization and X‐ray diffraction studies of a complete bacterial fatty‐acid synthase type I. Acta Cryst F71:1401–1407. [DOI] [PMC free article] [PubMed] [Google Scholar]
- 16. Fischer M, Rhinow D, Zhu Z, Mills DJ, Zhao ZK, Vonck J, Grininger M (2015) Cryo‐EM structure of fatty acid synthase (FAS) from Rhodosporidium toruloides provides insights into the evolutionary development of fungal FAS. Protein Sci 24:987–995. [DOI] [PMC free article] [PubMed] [Google Scholar]
- 17. Ronnett GV, Kim E‐K, Landree LE, Tu Y (2005) Fatty acid metabolism as a target for obesity treatment. Physiol Behav 85:25–35. [DOI] [PubMed] [Google Scholar]
- 18. Menendez JA, Vazquez‐Martin A, Ortega FJ, Fernandez‐Real JM (2009) Fatty acid synthase: association with insulin resistance, type 2 diabetes, and cancer. Clin Chem 55:425–438. [DOI] [PubMed] [Google Scholar]
- 19. Pappenberger G, Benz J, Gsell B, Hennig M, Ruf A, Stihle M, Thoma R, Rudolph MG (2010) Structure of the human fatty acid synthase KS–MAT didomain as a framework for inhibitor design. J Mol Biol 397:508–519. [DOI] [PubMed] [Google Scholar]
- 20. Rangan VS, Joshi AK, Smith S (2001) Mapping the functional topology of the animal fatty acid synthase by mutant complementation in vitro . Biochemistry 40:10792–10799. [DOI] [PubMed] [Google Scholar]
- 21. Cox BG, Hammes GG (1983) Steady‐state kinetic study of fatty acid synthase from chicken liver. Proc Natl Acad Sci U S A 80:4233–4237. [DOI] [PMC free article] [PubMed] [Google Scholar]
- 22. Carlisle‐Moore L, Gordon CR, Machutta CA, Miller WT, Tonge PJ (2005) Substrate recognition by the human fatty‐acid synthase. J Biol Chem 280:42612–42618. [DOI] [PMC free article] [PubMed] [Google Scholar]
- 23. Joshi AK, Smith S (1993) Construction of a cDNA encoding the multifunctional animal fatty acid synthase and expression in Spodoptera frugiperda cells using baculoviral vectors. Biochem J 296:143–149. [DOI] [PMC free article] [PubMed] [Google Scholar]
- 24. Abdinejad A, Fisher AM, Kumar S (1981) Production and utilization of butyryl‐CoA by fatty acid synthetase from mammalian tissues. Arch Biochem Biophys 208:135–145. [DOI] [PubMed] [Google Scholar]
- 25. Helfrich EJN, Piel J (2016) Biosynthesis of polyketides by trans‐AT polyketide synthases. Nat Prod Rep 33:231–316. [DOI] [PubMed] [Google Scholar]
- 26. Wang F, Wang Y, Ji J, Zhou Z, Yu J, Zhu H, Su Z, Zhang L, Zheng J (2015) Structural and functional analysis of the loading acyltransferase from avermectin modular polyketide synthase. ACS Chem Biol 10:1017–1025. [DOI] [PubMed] [Google Scholar]
- 27. Keatinge‐Clay AT (2012) The structures of type I polyketide synthases. Nat Prod Rep 29:1050–1073. [DOI] [PubMed] [Google Scholar]
- 28. Yuzawa S, Kapur S, Cane DE, Khosla C (2012) Role of a conserved arginine residue in linkers between the ketosynthase and acyltransferase domains of multimodular polyketide synthases. Biochemistry 51:3708–3710. [DOI] [PMC free article] [PubMed] [Google Scholar]
- 29. Alekseyev VY, Liu CW, Cane DE, Puglisi JD, Khosla C (2007) Solution structure and proposed domain‐domain recognition interface of an acyl carrier protein domain from a modular polyketide synthase. Protein Sci 16:2093–2107. [DOI] [PMC free article] [PubMed] [Google Scholar]
- 30. Ploskoń E, Arthur CJ, Evans SE, Williams C, Crosby J, Simpson TJ, Crump MP (2008) A mammalian type I fatty acid synthase acyl carrier protein domain does not sequester acyl chains. J Biol Chem 283:518–528. [DOI] [PubMed] [Google Scholar]
- 31. Lau J, Cane DE, Khosla C (2000) Substrate specificity of the loading didomain of the erythromycin polyketide dynthase. Biochemistry 39:10514–10520. [DOI] [PubMed] [Google Scholar]
- 32. Xue Y, Zhao L, Liu HW, Sherman DH (1998) A gene cluster for macrolide antibiotic biosynthesis in Streptomyces venezuelae: architecture of metabolic diversity. Proc Natl Acad Sci U S A 95:12111–12116. [DOI] [PMC free article] [PubMed] [Google Scholar]
- 33. Long PF, Wilkinson CJ, Bisang CP, Cortés J, Dunster N, Oliynyk M, McCormick E, McArthur H, Mendez C, Salas JA, Staunton J, Leadlay PF (2002) Engineering specificity of starter unit selection by the erythromycin‐producing polyketide synthase. Mol Microbiol 43:1215–1225. [DOI] [PubMed] [Google Scholar]
- 34. Menzella HG, Reid R, Carney JR, Chandran SS, Reisinger SJ, Patel KG, Hopwood DA, Santi DV (2005) Combinatorial polyketide biosynthesis by de novo design and rearrangement of modular polyketide synthase genes. Nat Biotechnol 23:1171–1176. [DOI] [PubMed] [Google Scholar]
- 35. Choudhary C, Kumar C, Gnad F, Nielsen ML, Rehman M, Walther TC, Olsen JV, Mann M (2009) Lysine acetylation targets protein complexes and co‐regulates major cellular functions. Science 325:834–840. [DOI] [PubMed] [Google Scholar]
- 36. Zhou H, Di Palma S, Preisinger C, Peng M, Polat A, Heck A, Mohammed S (2103) Toward a comprehensive characterization of a human cancer cell phosphoproteome. J Proteome Res 12:260–271. [DOI] [PubMed] [Google Scholar]
- 37. Zhang W, Chakravarty B, Zheng F, Gu Z, Wu H, Mao J, Wakil SJ, Quiocho FA (2011) Crystal structure of FAS thioesterase domain with polyunsaturated fatty acyl adduct and inhibition by dihomo‐γ‐linolenic acid. Proc Natl Acad Sci U S A 108:15757–15762. [DOI] [PMC free article] [PubMed] [Google Scholar]
- 38. Yuzawa S, Deng K, Wang G, Baidoo EEK, Northen TR, Adams PD, Katz L, Keasling JD (2017) Comprehensive in vitro analysis of acyltransferase domain exchanges in modular polyketide synthases and its application for short‐chain ketone production. ACS Synth Biol 6:139–147. [DOI] [PubMed] [Google Scholar]
- 39. Mayer S, Rüdiger S, Ang HC, Joerger AC, Fersht AR (2007) Correlation of levels of folded recombinant p53 in Escherichia coli with thermodynamic stability in vitro . J Mol Biol 372:268–276. [DOI] [PubMed] [Google Scholar]
- 40. Herbst DA, Jakob RP, Zähringer F, Maier T (2016) Mycocerosic acid synthase exemplifies the architecture of reducing polyketide synthases. Nature 531:533–537. [DOI] [PubMed] [Google Scholar]
- 41. Broadhurst RW, Nietlispach D, Wheatcroft MP, Leadlay PF, Weissman KJ (2003) The structure of docking domains in modular polyketide synthases. Chem Biol 10:723–731. [DOI] [PubMed] [Google Scholar]
- 42. Zheng J, Fage CD, Demeler B, Hoffman DW, Keatinge‐Clay AT (2013) The missing linker: a dimerization motif located within polyketide synthase modules. ACS Chem Biol 8:1263–1270. [DOI] [PMC free article] [PubMed] [Google Scholar]
- 43. Witkowski A, Joshi AK, Smith S (1997) Characterization of the interthiol acyltransferase reaction catalyzed by the β‐ketoacyl synthase domain of the animal fatty acid synthase. Biochemistry 36:16338–16344. [DOI] [PubMed] [Google Scholar]
- 44. Yalpani M, Willecke K, Lynen F (1969) Triacetic acid lactone, a derailment product of fatty acid biosynthesis. Eur J Biochem 8:495–502. [DOI] [PubMed] [Google Scholar]
- 45. Dimroth P, Walter H, Lynen F (1970) Biosynthesis of 6‐methylsalicylic acid. Eur J Biochem 13:98–110. [DOI] [PubMed] [Google Scholar]
- 46. Gajewski J, Buelens F, Serdjukow S, Janßen M, Cortina N, Grubmüller H, Grininger M (2017) Engineering fatty acid synthases for directed polyketide production. Nat Chem Biol 13:363–365. [DOI] [PubMed] [Google Scholar]
- 47. Barajas JF, Blake‐Hedges JM, Bailey CB, Curran S, Keasling JD (2017) Engineered polyketides: synergy between protein and host level engineering. Synth Syst Biotech 2:147–166. [DOI] [PMC free article] [PubMed] [Google Scholar]
- 48. Klaus M, Grininger M (2018) Engineering strategies for rational polyketide synthase design. Nat Prod Rep 35:1070–1081. [DOI] [PubMed] [Google Scholar]
- 49. Xie D, Shao Z, Achkar J, Zha W, Frost JW, Zhao H (2006) Microbial synthesis of triacetic acid lactone. Biotechnol Bioeng 93:727–736. [DOI] [PubMed] [Google Scholar]
- 50. Dutler H, Coon MJ, Kull A, Vogel H, Waldvogel G, Prelog V (1971) Fatty acid synthetase from pig liver. 1. Isolation of the enzyme complex and characterization of the component with oxidoreductase activity for alicyclic ketones. Eur J Biochem 22:203–212. [DOI] [PubMed] [Google Scholar]
- 51. Ericsson UB, Hallberg BM, Detitta GT, Dekker N, Nordlund P (2006) Thermofluor‐based high‐throughput stability optimization of proteins for structural studies. Anal Biochem 357:289–298. [DOI] [PubMed] [Google Scholar]
- 52. Huynh K, Partch CL (2015) Analysis of protein stability and ligand interactions by thermal shift assay. Curr Protoc Protein Sci 79:28901–28914. [DOI] [PMC free article] [PubMed] [Google Scholar]
- 53. Witkowski A, Joshi AK, Smith S (2004) Characterization of the β‐carbon processing reactions of the mammalian cytosolic fatty acid synthase: role of the central core. Biochemistry 43:10458–10466. [DOI] [PubMed] [Google Scholar]
Associated Data
This section collects any data citations, data availability statements, or supplementary materials included in this article.
Supplementary Materials
Figure S1: Cloning of human FAS expression constructs in E. coli
Figure S2: Screening of expression conditions for human FAS in E. coli
Figure S3: Co‐expression of hFAS with chaperones encoding genes
Figure S4: Expression of hFAS and mFAS constructs in large scale (1‐2 L expression cultures)
Figure S5: Sequences of animal type I FAS
Figure S6: Deconstruction of the processing part of mFAS
Figure S7: Thermal shift assay
Figure S8: Confirmation of the oligomeric state of select constructs
Figure S9: Original pictures of relevant presented gels
Table S1: List of plasmids
Table S2: List of primers