

Abstract
Chromosome translocations are a hallmark of cancer cells. We have developed an experimental system to visualize the formation of translocations in living cells and apply it to characterize the spatial and dynamic properties of translocation formation. We demonstrate that translocations form within hours of the occurrence of double-strand breaks (DSBs) and that their formation is cell cycle-independent. Translocations form preferentially between prepositioned genome elements, and perturbation of key factors of the DNA repair machinery uncouples DSB pairing from translocation formation. These observations generate a spatiotemporal framework for the formation of translocations in living cells.
Despite the prevalence and functional importance of chromosome translocations, the sequence and timing of events leading to their formation are largely unknown (1–3). To directly visualize the formation of chromosome translocations in living cells, we generated NIH3T3duo cells, which contain integrated into chromosome 7 the IScel restriction endonuclease site adjacent to an array of the Lac-operator DNA sequence (LacO, 256 copies) and three integrations on chromosomes 1 and 10 (integrations on two chromosome homologs) of the TetO-ISceI-TetO array (TetO, 96 copies) (fig. S1, A and B). The LacO and TetO arrays can be visualized by stable expression of GFP-Lac repressor (LacR) or mCherry- Tet repressor (TetR) proteins, respectively (Fig. 1A and movie S1) (4). To induce double-strand breaks (DSBs), we introduced ISceI by transfection into NIH3T3duo cells; after 12 hours, LacO- ISceI and TetO-ISceI arrays colocalized with the DNA damage sensor 53BP1 and phosphorylated histone H2AX (γH2AX), a marker of DSBs, indicating the efficient generation of DSBs (fig. S1C). Negligible colocalization of the arrays with 53BP1 or γH2AX was observed after expression of the ISceID44A (Asp44 → Ala) mutant, which lacks endonuclease activity (5); 53BP1 and γH2AX strongly accumulated at 12 hours and declined gradually thereafter, indicative ofsuccessful DNA repair (fig. S1C). Efficient cutting and repair was confirmed by ligation-mediated real-time polymerase chain reaction (LM-PCR) (fig. S1D) (4).
Fig. 1. An experimental system to visualize chromosome translocations in living cells.

(A) NIH3T3duo cells containing an integrated LacO- IScel array and three TetO-IScel-TetO arrays, stably expressing GFP-LacR and mCherry-TetR, respectively. Scale bar, 10 μm. (B) Colocalization of LacO (green) and TetO (red) arrays in NIH3T3duo cells 24 hours after expression of IScel. Scale bar, 10 μm. (C) Percentages of the cells with paired LacO and TetO arrays in indicated cell populations. Values represent means ± SD from at least three independent experiments (7500 to 16,500 cells with LacO and TetO analyzed per sample; *P < 0.05, **P < 0.001, ***P < 0.0001, Student t test or χ2 test). (D) Real-time PCR analysis for detection of Lac-Tet translocations in NIH3T3duo cells transfected with ISceI or ISceID44A for the indi cated times. PCR was performed using primers located in the Lac orTet operator sequences. Standard curve was generated by spiking-in at the indi cated ratios with NIH2/4 cells, which contain an integrated LacO-IsceI-TetO array (4). Values are normalized to 1:2000 sample and represent means ± SD from three independent experiments. *P < 0.05, ***P < 0.0001, two-tailed Student t test. (E) Untreated cells or cells transfected for 24 hours with the indicated plasmids were fixed and stained with DAPI and uHTI was performed to assess the cell cycle status of individual cells (fi g. S3, A and B). The percentage of cells with paired LacO- TetO arrays was determined. Values represent means ± SD from three independent experiments; one-way analysis of variance (ANOVA) test or χ2 test (ISceI positive: G1, n = 3620; S, n = 985; G2+M, n = 1295; ISceID44A positive: Gi, n = 1851; S, n = 1052; G2+M, n = 891). (F) NIH3T3duo cells transfected for 24 hours with ISceI were stained with DAPI and sorted into G1 or S+G2+M populations (fig. S3E). Identical numbers of gated G1, S+G2+M, and asynchronous cells were used to extract DNA and perform real-time PCR. Values represent means ± SD from two independent experiments (P > 0.05, one-way ANOVA). (G) Real-time PCR for LacO-TetO translocations in NIH3T3duo cells transfected with ISceI for 24 hours and arrested in G1 phase by contact inhibition or at the G2/M boundary by treatment with nocodazole (fig. S3, A and F). Values represent means ± SD from three experiments (P > 0.05, one-way ANOVA).
To capture the formation of a translocation in individual cells, we used ultrahigh-throughput imaging (uHTI) (fig. S2A) (6). Upon introduction of ISceI, but not of the inactive ISceID44A mutant, the percentage of NIH3T3duo cells with colocalized (defined as <3 pixel distance, pixel size 320 nm; fig. S2, B and C) GFP-LacR and mCherry-TetR arrays (Fig. 1B) increased from background levels of ~2% in nontransfected cells to 7.5 ± 0.9% after 24 hours (P < 10−4) and reached a plateau of 12.1 ± 1.2% after 36 hours (P < 10−3) (Fig. 1C). Formation of translocations was confirmed by realtime PCR (fig. S2D) and sequencing of translocation junctions (fig. S2E). Translocation frequency increased from ~1:2000 cells at 12 hours after ISceI expression to ~1:400 at 24 hours and ~1:300 at 36 hours (Fig. 1D). These data indicate that upon induction of DSBs, a considerable population of DSBs becomes paired, but that only a fraction is illegitimately repaired to form translocations. No differences in GFP-LacR or mCherry-TetR pairing frequency were observed in individual Gi-, S-, or G2/M-phase cells (P> 0.05, Fig. 1E), identified by measuring the integrated intensity of 4’,6-diamidino-2-phenylindole (DAPI) staining of single cells in three dimensions (fig. S3, A to D) (6). The absence of cell cycle dependence of translocation formation was confirmed by PCR of LacO-TetO translocations in cells analyzed by fluorescence-activated cell sorting (FACS) (fig. S3E), (P > 0.05, Fig. 1F) and in cells arrested in G1 or at the G2/M boundary by contact inhibition or nocodazole treatment, respectively (Fig. 1G, P >0.05; fig. S3, A and F). We conclude that the formation of chromosome translocations is cell cycle-independent.
To observe translocation events in living cells, we used uHTI time-lapse microscopy to simultaneously track GFP-LacO and mCherry-TetO arrays in several thousand cells for up to 24 hours (Fig. 2, A and B) (6). The fraction of cells with paired arrays increased with time in cell populations transfected with ISceI, but not with ISceID44A (fig. S4A). Tracking of individual cells by timelapse microscopy demonstrated that after generation of DSBs by ISceI, DSBs sampled the nuclear space by nondirectional, saltatory motion (Fig. 2; fig. S4, B and C). Some DSB pairs moved into spatial proximity and underwent cycles of local transient pairing and dissociation (fig. S4, B and C, and movie S2). A subset of transiently paired DSBs eventually engaged in persistent pairing, resulting in the stable juxtaposition of the LacO and TetO arrays over several hours, suggestive of translocation formation (Fig. 2, A and B, and movies S3 and S4). Stable joining of LacO and TetO arrays by translocation is indicated by the coordinated motion of the two arrays over several hours (fig. S5A and movies S4 and S5). The two intrachromosomal ends marked by TetO, generated by the ISceI cut, moved in unison to the area of pairing with the LacO (Fig. 2, A and B, and movies S3 and S4). The number of the detected TetO arrays per cell, but not of the LacO arrays (P = 0.036), was higher in cells with paired LacO and TetO arrays (P <3.7 × 10⁻⁷, fig. S5B), indicating that the two TetO sequences flanking the break separated after completion of repair toward the formation of a translocation. This observation suggests that the two intrachromosomal breaks do not separate before translocation, and that the choice of the chromosomal partners involved in the joining takes place after the chromosomal partners are in close proximity. The absence of separation of the two chromosome ends generated by a single ISceI cut provides a cell biological explanation for the occurrence of reciprocal translocations, because it would be highly unlikely that both broken chromosome ends find their two corresponding translocation partners, if the two chromosome ends separated prior to congregation with other DSBs.
Fig. 2. Visualization of chromosome translocations by time-lapse microscopy.
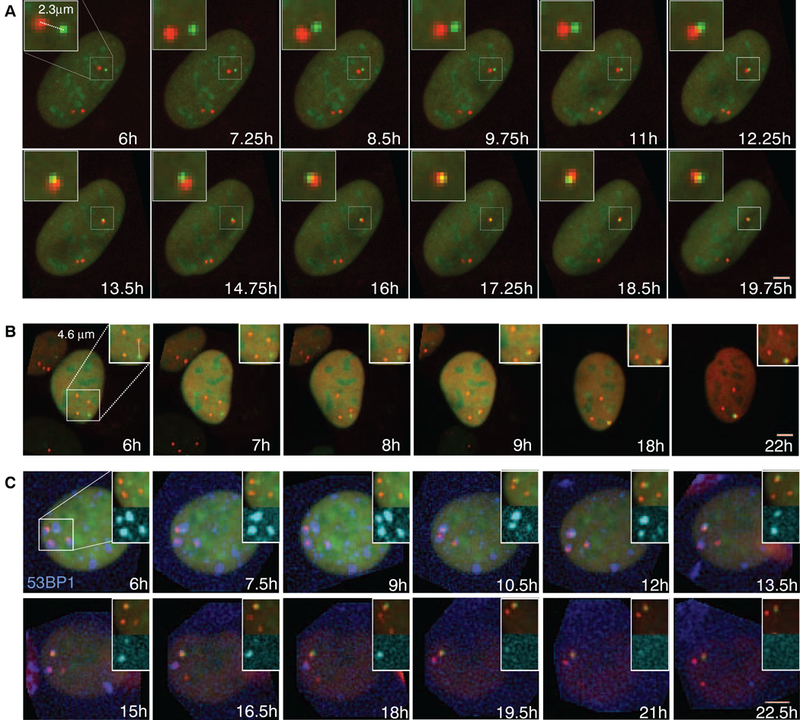
(A and B) Time-lapse microscopy of NIH3T3duo cells transfected with IScel. Maximal projected image sequences of representative movies show pairing of (A) proximal and (B) distal DSBs. Scale bars, 5 μm.(C) Formation of LacO (green)-TetO (red) translocation relative ot repair foci in NIH3T3 duo cells stably expressing BFP-53BFP1 (blue). Scale bar, 5 μm.
Covisualization of the repair factor 53BP1 revealed its recruitment to individual DSBs and the coalescence of individual foci to form a single repair center (Fig. 2C). The combined 53BP1 focus was then resolved over time, presumably as a consequence of completed DNA repair to generate a translocation (Fig. 2C).
Single-particle tracking to monitor the movement of the fluorescently tagged LacO and TetO arrays after expression of ISceI showed that, in agreement with previous reports in mammalian cells (7, 8) but distinct from their behavior in yeast (9, 10), the mean squared displacement of DSBs in mammalian cells displayed motion properties similar to those of intact chromosomal loci (Fig. 3A). In contrast, the motion properties of translocating arrays were significantly faster (Fig. 3B) with a mean squared change in distance Δd2 = 25 μm2 after 8 hours for translocating arrays versus ~10 μm2 for nontranslocating arrays.
Fig. 3. Dynamics of translocations in space and time.
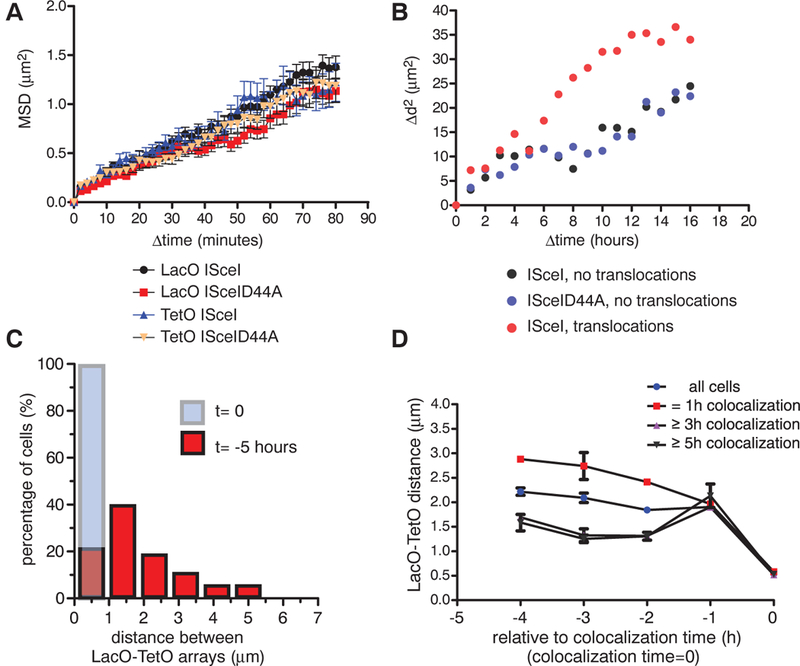
(A) Mean squared displacement (MSD) plots for LacO and TetO in cells transfected with ISceI or ISceID44A. Values represent means ± SEM of pooled data from three independent experiments (n = 66 to 98). (B) Mean squared change in distance (Δd2) between the LacO and the closest TetO array of cells with intact arrays (ISceID44A, n = 34), DSBs without pairing events (ISceI, n = 33), or persistent colocalization (ISceI, pairing ≥3 hours, n = 43). (C) Translocations occur predominantly from proximally located DSBs. Persistent LacO-TetO pairs (≥3 hours) were identified, and distance histograms between LacO and TetO arrays for the time of pairing (t = 0, light blue bar) and 5 hours before (t = −5 hours, red bars) were generated (n = 40). (D) Average LacO- TetO distances as a function of time before pairing for 1 hour, ≥3 hours, and ≥5 hours (all tracks, n = 2897; 1-hour transient interaction, n = 1437; at least 3 hours, n = 615; 5-hour pairing, n = 157). Values represent means ± SD from two independent experiments.
To directly address the role of spatial positioning in translocation formation, we determined the relative positions of translocating DSBs prior to persistent pairing. The increase in paired arrays (8% at 24 hours, 13% at 48 hours, 15% at 60 hours; fig. S6A) was mirrored by a reduction in the population of cells with array separations of 2 to 6 mm (fig. S6A); this finding suggests that the majority of paired arrays arise by association of pairs within this distance range. In support of preferential pairing of proximal DSBs, reverse tracking of LacO-TetO arrays that persistently formed pairs in time-lapse movies (≥3-hour colocalization; <960 nm apart) showed that more than 80% of translocating arrays were found within less than 2.5 mm of each other 5 hours before their permanent joining (Fig. 3C) and that translocating DSBs were separated by an average distance of ~1.5 μm 4 hours before their persistent joining, whereas array pairs that colocalized only temporarily, and thus do not reflect translocation events, were separated by ~3 μm during the same time period (Fig. 3D and fig. S6B). Although the vast majority of persistent colocalizations originated from proximally (<3 μm) located DSBs (Fig. 3, C and D), we also detected the occurrence of ~10% of persistent pairs from distally positioned DSBs (Fig. 2B, Fig. 3C, and movie S4). We conclude that the vast majority of translocations form from pre-positioned proximal DSBs, although a small subset of translocations can be generated by DSBs, which undergo long-range motion. These results unify the “contact-first” and “breakage-first” models for how spatial organization affects translocation formation (3,11,12).
To explore the role of DNA repair in DSB pairing and translocation formation, we inhibited key components of the DNA damage response (DDR) machinery and monitored their effect on these processes. Inhibition of the major DNA repair and signaling kinases ATM (ataxia telangiectasia mutated) or ATR (ataxia telangiectasia and Rad3-related) by inhibitors or knockdown experiments using specific small interfering RNAs (siRNAs) (fig. S7A) had no effect on the fraction of the cells with paired DSBs (P > 0.05; Fig. 4, A and C). However, inhibition of DNA-dependent protein kinase (DNAPK) activity increased translocation frequency by almost an order of magnitude (P < 10−4; Fig. 4B and fig. S7C), indicating uncoupling of DSB pairing from translocation formation. In line with a reported increase in the frequency of c-Myc and immunoglobulin heavy chain locus (IgH) translocations upon treatment of ATM−/− B cells treated with DNAPK inhibitor (13), inhibition of both ATM and DNAPK syn- ergistically increased translocation frequency in NIH3T3duo cells (fig. S7B). In addition, when the catalytic subunit of DNAPK was eliminated by siRNA (fig. S7A), an increase in the frequency of translocations similar to the increase observed after Ku80 knockdown was observed (Fig. 4D) (14).Taken together, these data suggest that upon formation of DSBs and DSB pairing, DDR signaling acts downstream of the paired breaks to regulate the repair steps required for translocation formation, indicating that the kinase activity of DNAPK is essential to suppress translocations without affecting the physical pairing of DSBs. Consistent with this notion, DNAPK kinase activity through autophosphorylation has been implicated in the regulation of DSB end processing, the complex dissociation from the break, and the inactivation of the enzyme (15,16). In support of this idea, sequencing of the translocated junctions formed in the presence of DNAPK inhibitor indicated minimal end processing (fig. S7D).
Fig. 4. Effects of DNA repair machinery on DSB pairing and translocation formation.
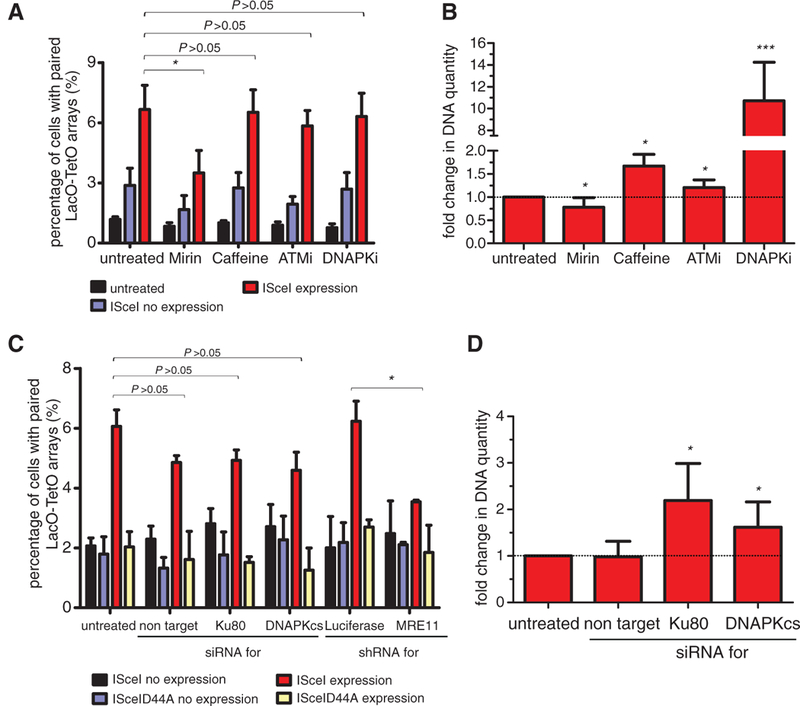
(A) The percentage of NIH3T3duo cells with paired LacO-TetO arrays was assessed after ISceI or ISceID44A expression for 24 hours in the presence of the indicated inhibitors. Values represent means ± SD from at least four independent experiments (Student t test or χ2 test, *P < 0.05). (B) Real-time PCR on DNA from cells transfected with ISceI for 24 hours in the presence of the indicated inhibitors. The untreated sample was used as a control. Values represent means ± SD from at least four independent experiments (Student t test, *P < 0.05, ***P < 0.0001). (C) Percentage of cells with paired LacO-TetO arrays in cells treated with the indicated siRNAs or shRNAs as in (A) (Student t test, *P < 0.05). Values represent means ± SD from at least two independent experiments. (D) Real-time PCR of NIH3T3- duo cells treated with the indicated siRNAs performed as in (B) (Student t test, *P < 0.05).
Interference with the upstream repair machinery by Mirin, an inhibitor of the Mre11 component of the DNA damage-sensing MRN complex (17), or by small hairpin RNA (shRNA) against MRE11 (fig. S7A) reduced by a factor of 2 the fraction of the cells with paired LacO-TetO arrays (P < 0.05; Fig. 4, A and C) and translocation frequency by 23% (P < 0.05; Fig. 4B). Mirin suppressed the increase in frequency of translocations observed in the presence of the DNAPK inhibitor, which suggests that it acts upstream of DNAPK function (fig. S7B). We conclude that inhibition of Mre11 function reduces the efficiency of breaks to pair, and that this effect results in decreased translocation frequency.
The experimental system described here serves as the basis for a comprehensive spatial and temporal framework for the elucidation of the mechanisms involved in the formation of chromosome translocations and will enable in-depth analysis of translocation mechanisms in vivo.
Supplementary Material
Acknowledgments:
We thank T. Tsukamoto, M. Jasin, E. Heard, D. Jullien, and M. Dundr for reagents; B. J. Taylor, S. Banerjee, J. Simone, and K. McKinnon for help with FACS experiments; T. Karpova (NCI Fluorescence Imaging Microscopy Facility) for help with microscopy; and T. Ried and K. Meaburn for expertise with SKY analysis and FISH. This research was supported by the Intramural Research Program of the National Institutes of Health (NIH), NCI, Center for Cancer Research, and by an EMBO long-term fellowship (C.K.S.). We dedicate this work to the memory of Dr. Michael Potter, NCI, a giant in the field of chromosome translocations.
Footnotes
Supplementary Materials
References and Notes
- 1.Mitelman F, Johansson B, Mertens F, Nat. Rev. Cancer 7, 233–245 (2007). [DOI] [PubMed] [Google Scholar]
- 2.Misteli T, Cold Spring Harb. Perspect. Biol. 2, a000794 (2010). [DOI] [PMC free article] [PubMed] [Google Scholar]
- 3.Meaburn KJ, Misteli T, Soutoglou E, Semin. Cancer Biol. 17, 80–90 (2007). [DOI] [PMC free article] [PubMed] [Google Scholar]
- 4.Soutoglou E et al. , Nat. Cell Biol. 9, 675–682 (2007). [DOI] [PMC free article] [PubMed] [Google Scholar]
- 5.Niu Y, Tenney K, Li H, Gimble FS, J. Mol. Biol. 382, 188–202 (2008). [DOI] [PMC free article] [PubMed] [Google Scholar]
- 6.See supplementary materials on Science Online.
- 7.Kruhlak MJ et al. , J. Cell Biol. 172, 823–834 (2006). [DOI] [PMC free article] [PubMed] [Google Scholar]
- 8.Jakob B, Splinter J, Durante M, Taucher-Scholz G, Proc. Natl. Acad. Sci. U.S.A. 106, 3172–3177 (2009). [DOI] [PMC free article] [PubMed] [Google Scholar]
- 9.Miné-Hattab J, Rothstein R, Nat. Cell Biol. 14, 510–517 (2012). [DOI] [PubMed] [Google Scholar]
- 10.Dion V, Kalck V, Horigome C, Towbin BD, Gasser SM, Nat. Cell Biol. 14, 502–509 (2012). [DOI] [PubMed] [Google Scholar]
- 11.Nelms BE, Maser RS, MacKay JF, Lagally MG, Petrini JH, Science 280, 590–592 (1998). [DOI] [PubMed] [Google Scholar]
- 12.Aten JA et al. , Science 303, 92–95 (2004). [DOI] [PubMed] [Google Scholar]
- 13.Callen E et al. , Mol. Cell 34, 285–297 (2009). [DOI] [PMC free article] [PubMed] [Google Scholar]
- 14.Weinstock DM, Brunet E, Jasin M, Nat. Cell Biol. 9, 978–981 (2007). [DOI] [PMC free article] [PubMed] [Google Scholar]
- 15.Neal JA, Meek K, Mutat Res. 711, 73–86 (2011). [DOI] [PMC free article] [PubMed] [Google Scholar]
- 16.Uematsu N et al. , J. Cell Biol. 177, 219–229 (2007). [DOI] [PMC free article] [PubMed] [Google Scholar]
- 17.Dupre A et al. , Nat. Chem. Biol. 4, 119–125 (2008). [DOI] [PMC free article] [PubMed] [Google Scholar]
Associated Data
This section collects any data citations, data availability statements, or supplementary materials included in this article.