

Abstract
Background
Structured illumination microscopy (SIM) is a family of methods in optical fluorescence microscopy that can achieve both optical sectioning and super-resolution effects. SIM is a valuable method for high-resolution imaging of fixed cells or tissues labeled with conventional fluorophores, as well as for imaging the dynamics of live cells expressing fluorescent protein constructs. In SIM, one acquires a set of images with shifting illumination patterns. This set of images is subsequently treated with image analysis algorithms to produce an image with reduced out-of-focus light (optical sectioning) and/or with improved resolution (super-resolution).
Findings
Five complete, freely available SIM datasets are presented including raw and analyzed data. We report methods for image acquisition and analysis using open-source software along with examples of the resulting images when processed with different methods. We processed the data using established optical sectioning SIM and super-resolution SIM methods and with newer Bayesian restoration approaches that we are developing.
Conclusions
Various methods for SIM data acquisition and processing are actively being developed, but complete raw data from SIM experiments are not typically published. Publically available, high-quality raw data with examples of processed results will aid researchers when developing new methods in SIM. Biologists will also find interest in the high-resolution images of animal tissues and cells we acquired. All of the data were processed with SIMToolbox, an open-source and freely available software solution for SIM.
Keywords: super-resolution microscopy, SIMToolbox, structured illumination microscopy, open-source software, fluorescence, Bayesian methods, LAMP1, live cell imaging
Data Description
Context
Several methods are now available that extend the resolution of fluorescence microscopy beyond the diffraction limit. These methods include photoactivated localization microscopy [1, 2], stochastic optical reconstruction microscopy [3, 4], super-resolution optical fluctuation imaging [5, 6], stimulated emission depletion microscopy [7], and structured illumination microscopy (SIM) [8, 9] .
Of these various methods, SIM is usually regarded as the most useful for imaging live cells, and this method has rapidly gained in popularity. Depending on the optical setup and data processing method used, SIM can achieve optical sectioning (OS-SIM) [10], an effect that greatly reduces out-of-focus light similar to laser scanning confocal fluorescence microscopy. SIM can also be used for imaging beyond the diffraction limit in fluorescence microscopy. Super-resolution SIM (SR-SIM) [8, 9], in its most common implementation [11], uses laser illumination to create a high-frequency interference fringe pattern (close to or at the resolution limit of the microscope) to illuminate the sample. In such an experiment, image information with details beyond the limit of spatial frequencies accepted by the microscope is aliased into the acquired images. By acquiring multiple images with shifting illumination patterns, a high-resolution image can be reconstructed [8, 9]. Two-dimensional SR-SIM enables a two-fold resolution improvement in the lateral dimension [8, 9, 12, 13]. If a three-dimensional (3D) illumination pattern is used, a two-fold resolution improvement can also be realized in the axial direction [11, 14, 15]. SIM is perhaps the most attractive super-resolution method for imaging live cells because it does not require high illumination powers, can work with most dyes and fluorescent proteins, uses efficient widefield (WF) detection, and can achieve high imaging rates. SIM has been demonstrated in several applications, including two-dimensional (2D) [12, 13] and 3D imaging [14, 16].
As interest in super-resolution imaging has increased, several alternative approaches for SIM have been introduced that use various kinds of patterned illumination [17–21]. For example, in multifocal structured illumination microscopy [17], a 2D array of focused laser spots is scanned across a sample, and subsequent image processing is used to achieve an image with improved resolution. Structured illumination methods have also been combined with light sheet excitation, a method ideal for imaging live cells [22–26].
In addition to new illumination schemes, alternative data processing methods have also been introduced [27–33]. For example, Orieux et al. suggested a 2D method for SIM reconstruction based on Bayesian estimation [28], and our group showed that Bayesian reconstruction methods in SIM have several potential advantages and can achieve a performance comparable to traditional SIM methods [29]. To allow 3D imaging, our group subsequently introduced maximum a posteriori probability SIM (MAP-SIM [30]), a method based on reconstruction of the SIM data using a Bayesian framework. Image restoration approaches are useful when working with low signal levels in SIM [34] and have been recently reviewed [35].
We present complete raw and analyzed SIM data from several situations in cell biology studies in which we imaged both live and fixed mammalian cells as well as fixed tissues. We used an alternative approach for SIM illumination that has been previously described [30, 36, 37]. Our system uses either light-emitting diode (LED) or laser illumination and a fast ferroelectric liquid crystal-on-silicon (FLCOS) microdisplay (also known as a spatial light modulator [SLM]) for SIM pattern definition. SLMs have seen use in SIM and related applications when high-speed imaging and flexibility in controlling the spatial and temporal properties of the illumination are priorities [12–14, 16, 25, 37–43]. To analyze the data, we used OS-SIM, SR-SIM, and MAP-SIM methods. All of the raw and analyzed data are available on GigaDB, and the analysis software (SIMToolbox) is open source and freely available [36].
Methods
Cell lines and reagents
All cell lines used were maintained in Dulbecco's modified eagle medium supplemented with 10% fetal calf serum, 100 U/mL penicillin, 100 U/mL streptomycin, and L-glutamate (Invitrogen) at 37°C and 100% humidity. Cell lines used for this study included U2-OS (human bone sarcoma, RRID:CVCL_0042), A431 (human skin carcinoma, RRID:CVCL_0037), and Hep-G2 (human liver carcinoma, RRID:CVCL_0027).
Preparation of samples for imaging
SIM data 1, Fig. 4:U2-OS cells expressing lysosome-associated membrane protein 1 labeled with green fluorescent protein (LAMP1-GFP) were grown in petri dishes with coverslip bottoms (MatTek) for 24 hours, then imaged in full medium at room temperature. In this experiment, we used microscopy system 1 (Olympus IX71, Table 2).
Figure 4:

Imaging live cells beyond the diffraction limit with MAP-SIM. U2-OS cells expressing LAMP1-GFP were imaged using the LCOS-based SIM system. Subsequent processing using OS-SIM or MAP-SIM methods. (a) WF, (b) OS-SIM, (c) MAP-SIM, (d) FFT of WF, (e) FFT of OS-SIM, and (f) FFT of MAP-SIM. The images were individually scaled for presentation. The dotted circular lines indicate the approximate resolution achieved in each image according to analysis of the FFT. The full image sequence is available at [53].
Table 2:
Parameters of the microscope systems
| Setup | Microscope | Objective | sCMOS Camera | Illumination tube lens focal length and part number |
|---|---|---|---|---|
| 1 | Olympus IX71 | 100 ×/1.4 | Andor Neo 5.5 | 180 mm |
| UPLSAPO | U-TLU | |||
| 2 | Olympus IX83 | 100 ×/1.3 | Andor Zyla 4.2+ | 180 mm |
| UPLFLN | SWTLU-C | |||
| 3 | Leica DMi8 | 100 ×/1.47 | Andor Zyla 4.2+ | 200 mm |
| HCX PLAPO TIRF | 11 525 408 |
SIM data 2, Fig. 5: A431 cells were grown on #1.5H coverslips (Marienfeld) for 48 hours in normal medium. We washed the cells once with phosphate-buffered saline (PBS), pH 7.4, and then treated the cells with 5 μΜ DiI-C16 (Molecular Probes) in PBS at room temperature for 5 minutes. This probe is lipid modified with a fluorescent dye that inserts into the plasma membrane of live mammalian cells within a few minutes. We then washed the cells twice with PBS, then imaged them on the SIM system in fresh PBS at room temperature using a coverslip chamber (Biotech). In this experiment, we used microscopy system 3 (Leica DMi8, Table 2).
Figure 5:

Imaging live cells beyond the diffraction limit with SIM. A431 cells labeled with DiI-C16 were imaged using the LCOS-based SIM system. Subsequent processing using SR-SIM or MAP-SIM methods. (a) WF, (c) SR-SIM, (e) MAP-SIM. (b), (d), and (f) each show a zoom-in of the region indicated in (a). (g) shows the SIM illumination pattern in one of the four angles used. (h) shows an FFT of the image in (g). The images were individually scaled for visualization purposes. Each is a maximum intensity projection of 3 Z positions (spacing 400 nm except for g and h, which show a single Z-position).
SIM data 3, Fig. 6: A prepared slide was acquired (AmScope) that contained sectioned rabbit testis stained with hematoxylin and eosin. In this experiment, we used microscopy system 3 (Leica DMi8, Table 2).
Figure 6:

Imaging animal tissues using the LCOS-based SIM system and subsequent processing using OS-SIM or MAP-SIM methods. Seminiferous tubule of the rabbit stained with hematoxylin and eosin. (a) WF, (c)OS-SIM, (e) MAP-SIM. (b), (d), and (f) each show a zoom-in of the region indicated in (a). (g) shows the SIM illumination pattern in one of the four angles used. (h) MAP-SIM depth-coded using the lookup table isolum [55]. The images were individually scaled for visualization purposes. Each is a maximum intensity projection of 31 Z-positions (spacing 300 nm except for a, b, and g, which show 1 Z-position).
SIM data 4, Fig. 7: Hep-G2 cells expressing Dendra2-histone 4 [44] were grown on #1.5H coverslips for 24 hours, then fixed for 15 minutes at room temperature with 4% paraformaldehyde. We then permeabilized the cells for 5 minutes at room temperature with 0.1% triton-X100, then washed the cells with PBS. We then labeled the actin cytoskeleton of the cells for 1 hour at room temperature with 5 nM Atto 565 phalloidin, followed by washing the cells with PBS. We finally mounted the coverslips on clean slides using mowiol 4–88 (Fluka). In this experiment, we used microscopy system 1 (Olympus IX71, Table 2).
Figure 7:

SIM imaging of fixed HEP-G2 cells expressing Dendra2-H4 (nucleus) and labeled with Atto-532 phalloidin. (a) WF, (c) SR-SIM, (e) MAP-SIM. (b), (d), and (f) each show a zoom-in of the region indicated in (a). (g) shows the SIM illumination pattern in one of the four angles used. (h) shows an FFT of the image in (g). The images were individually scaled for visualization purposes. Each is a maximum intensity projection of 22 Z-positions (spacing 200 nm except for a, b, g, and h, which show 1 Z-position).
SIM data 5, Fig. 8: A prepared slide was acquired (Molecular Probes) that contained bovine pulmonary endothelial (BPAE) cells stained with Alexa Fluor 488 phalloidin (to label the actin cytoskeleton) and Mitotracker CMXRos (to label mitochondria). In this experiment, we used microscopy system 2 (Olympus IX83, Table 2).
Figure 8:

2D SIM imaging of fixed BPAE cells labeled with Alexa 488-phalloidin (actin) and mitotracker CMXRos (mitochondria). (a) WF, (b)MAPSIM.
Table 1 summarizes the imaging parameters used for the different samples.
Table 1:
Imaging parameters for the SIM datasets
| Data | sample | Label (structure) | Pixel size, nm | Illumination | Exposure time, ms | SIM experiment type | SIM pattern no. of angles/phases | Microscope system used |
|---|---|---|---|---|---|---|---|---|
| SIM data 1 (Fig. 4) | Live U2-OS cells | LAMP1-GFP (lysosomes and membrane) | 65 | LED 480 nm | 25 | 2D time lapse | 1/11 | 1 |
| SIM data 2 (Fig. 5) | Live A431 cells | DiI-C16 (membrane) | 65 | LED 530 nm | 100 | 3D | 4/24 | 3 |
| SIM data 3 (Fig. 6) | Fixed rabbit testis | Hematoxylin and eosin (structural strain) | 65 | LED 530 nm | 200 | 3D | 1/11 | 3 |
| SIM data 4 (Fig. 7) | Fixed Hep-G2 cells | Dendra2-H4 (nucleus) Atto565-phalloidin (actin) | 65 | LED 480 nm LED 530 nm | 500 | 3D | 4/24 | 1 |
| SIM data 5 (Fig. 8) | Fixed BPAE cells | AlexaFluor 488 phalloidin (actin) Mitotracker CMXRos (mitochondria) | 65 | Lumencor spectra-X 470 nm550 nm | 300 | 2D | 1/11 | 2 |
Microscope setup and acquisition
We used three home-built SIM setups based on the same general design as described previously [30, 36, 37] (Fig. 1). The three SIM systems were based on Olympus IX71, Olympus IX83, and Leica DMi8 microscopes coupled with sCMOS cameras (Andor) under the control of IQ3 software (Andor). The parameters of the different microscope setups are shown in Table 2.
Figure 1:

Structured illumination microscope setup that we used with different microscope bodies and cameras. See text and Table 2 for details.
In each microscope setup, the illumination patterns were produced by a high-speed FLCOS microdisplay (SXGA-3DM, Forth Dimension Displays, 13.6 μm pixel pitch). This particular FLCOS microdisplay has been used previously in SIM [14, 16, 25, 29, 30, 36, 37, 45–48] and in other optical sectioning systems such as programmable array microscopy [38, 42, 49]. The display was illuminated by a home-built, three-channel LED system based on high-power LEDs (PT-54 or PT-120 with DK-114N or DK-136M controller; Luminous Devices) with emission maxima at 460 nm, 525 nm, and 623 nm. The output of each LED was filtered with a band pass filter (Chroma), and the three wavelengths were combined with appropriate dichroic mirrors (Chroma). The light was then vertically polarized with a linear polarizer (Edmund Optics). We imaged the microdisplay into the microscope using an external tube lens (Table 2) and polarizing beam splitter cube (Thor Labs). With any of the setups and when using a 100× objective, single microdisplay pixels are imaged into the sample with a nominal size of 136 nm, thus as diffraction-limited spots. This is important for achieving the highest resolution results [37]. More details are available in the supplementary material of [36]. In one experiment (Fig. 8), we used a Spectra-X light source (Lumencor).
The microdisplay allows one to create any desired illumination pattern. In our experiments, the illumination masks consisted of line grids of different orientations (0°, 90°, 45°, and 135°). The lines were 1 microdisplay pixel thick (diffraction limited in the sample when using a 100× objective) with a gap of “off” pixels in between. The illumination line grid was shifted by one pixel between each image acquisition to obtain a shifted illumination mask. The shift between each image was constant, and the sum of all illumination masks resulted in homogenous illumination. Our optical setup, in which an incoherently illuminated microdisplay is imaged into the sample with highly corrected microscope optics, results in much more stable SIM illumination parameters compared to conventional SIM in which the illumination pattern is created by laser interference. We use a unique spatial calibration method to determine, with very high accuracy, the position of the patterned illumination in the sample [37]. This is a spatial domain process and does not rely on fitting of data to a model except for the assumption that the imaging is linear and shift invariant.
Data processing methods
We processed all of the data presented here using SIMToolbox, an open-source, user-friendly, and freely available program that our group developed for processing SIM data [36]. SIMToolbox, sample data, and complete documentation are freely available [50]. SIMToolbox is capable of OS-SIM [10, 37], SR-SIM [8, 9], and MAP-SIM [30] methods. See the Supplementary Information for additional details about these methods.
Resolution measurements—spatial domain method
Previously, we used microscopy setup 1 (Olympus IX71) to measure spatial resolution by averaging spatial measurements from 50 individual 100-nm fluorescent beads [30]. We used a 100×/1.40 numerical aperture oil immersion objective and 460 nm LED excitation (emission 500–550 nm). A 19 × 19 pixel region of interest (ROI) was selected around each bead in both the WF and MAP-SIM images. The ROIs were then registered with sub-pixel accuracy using normalized cross-correlation. Each ROI was fit with a Gaussian function, and the full width at half maximum (FWHM) was determined in the axial and lateral directions. Figure 2 shows the resulting averaged FWHM values and point spread function (PSF) cross-sections [30].
Figure 2:

Measurements of the spatial resolution on a sample of fluorescent beads. Cross-sections of the PSF are obtained by averaging measurements over 50 beads along lateral and axial directions.
Resolution measurements—frequency domain method
It is desirable to measure the actual resolution achieved in SIM images (or image sequences) of cells or tissues, but suitable structures are not always present in the images. We therefore developed a robust frequency domain method that can be used to measure resolution in any fluorescence microscopy image [51].
The power spectral density (PSD) describes the distribution of the power of a signal with respect to its frequency. The PSD of an image is the squared magnitude of its Fourier transform and can be written as
 |
(1) |
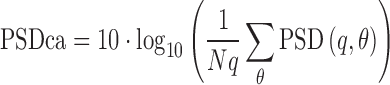
where  represents the Fourier transform, I(m, n) is the image intensity, m, n indexes the rows and columns of the 2D image, respectively, and (k, l) are coordinates in the frequency domain. In polar coordinates, the circularly averaged PSD (PSDca) in frequency space with frequency q and angle θ is given as
 |
(2) |
which averages PSD at spatial frequency q. Nq is the number of pixels at a particular frequency q. The resolution limit in real space corresponds to the cutoff frequency in Fourier space. Assuming a noiseless case, the cutoff frequency will be equal to the spatial frequency at which PSDca drops to zero. In practice, PSDca contains non-zero values over the whole frequency range caused by noise. The signal-to-noise ratio (SNR) in Fourier space is generally very close to the cutoff frequency, which makes precise detection of the cutoff frequency challenging. For this, we use a spectral subtraction method [51]. Assuming additive noise, in the frequency domain we can write
 |
(3) |
where  , and
, and  represent the noisy signal, the desired signal, and the noise spectrum estimate (expected noise spectrum), respectively. The noise spectrum
  is estimated from the parts of signal where only noise is present. If the spatial sampling is high enough to fulfill the Nyquist–Shannon criterion and oversamples the resolution limit of the reconstructed SIM image, spatial frequencies close to half of the sampling frequency do not contain useful signal and can be used for noise estimation. We varied the frequency cutoff threshold over the range
  , estimated the level of noise for every threshold value, and obtained the mean and variance of the cutoff frequency (i.e., the resolution estimate). The
 is given by
  , where
  and
and  are the sampling frequency and the backprojected pixel size, respectively.
Figure 3 shows the PSDca and corresponding resolution limit measured for the data shown in Fig. 5. Using our resolution estimation algorithm, we calculated a lateral spatial resolution of 294 nm for WF and 141 nm for MAP-SIM. The measured resolution is in approximate agreement with our results measured on 100-nm fluorescent beads (Fig. 2).
Figure 3:

Resolution analysis and normalized power spectral density (PSD) measured on a selected image from the data in Fig. 5. The results indicate a circularly averaged PSD lateral spatial resolution of 294 nm for WF and 141 nm for MAP-SIM, in approximate agreement with the analysis in Fig. 4d–f.
Imaging live cells, fixed cells, and tissues with SIM
To demonstrate the utility of our approach in imaging live cells, we imaged U2-OS cells that had been transfected with LAMP1-GFP. LAMP1 is a highly glycosylated protein that is found on the surface of lysosomes and in the plasma membrane [52]. Figure 4 shows WF, OS-SIM, and MAP-SIM images of U2-OS cells expressing LAMP1-GFP and the fast Fourier transform (FFT) of each image. The dotted circles in Fig. 4d–f show the approximate limit of resolution in each image. We found that in addition to lysosomal expression, LAMP1-GFP is also present in high concentrations in the plasma membrane of U2-OS cells.
In this experiment, we acquired SIM image sequences with an exposure time of 25 ms, a raw imaging rate of 40 Hz. We used a SIM pattern with 11 phases (pattern period in the sample plane 1.5 μm) and a single angle (0° with respect to the camera), acquiring 3,982 total frames, resulting in 472 processed frames (see Table 1). The imaging rate of processed result frames was therefore 3.6 Hz. The full image sequence is available at [53 and also available at GigaDB [54]. We further analyzed these data as shown in the Supplementary Figs. S2–S3.
Next, we imaged live A431 cells that we labeled with the fluorescent lipid DiI-C16. In this experiment, we acquired SIM image sequences with an exposure time of 100 ms, a raw imaging rate of 10 Hz. We used a SIM pattern with 24 total phases and four angles (see Table 1). This data are shown in Fig. 5.
Figure 6 shows SIM imaging of fixed tissues, in this case the seminiferous tubule of the rabbit stained with hematoxylin and eosin.
Figure 7 shows SIM imaging of fixed HEPG2 cells expressing H4-Dendra, a nuclear marker. We also stained the cells with Atto 532-phalloidin to label the actin cytoskeleton.
Figure 8 shows SIM imaging of fixed BPAE cells labeled with Alexa 488-phalloidin and mitotracker CMXRos to visualize the actin cytoskeleton and mitochondria, respectively.
Discussion
SIM results sometimes suffer from artifacts related to the illumination pattern. The artifacts, which can be severe and are a cause for concern, can be due to several factors including illumination pattern phase instability and pattern distortion because of refractive index mismatch between the sample and the immersion fluid. In our hands, MAP-SIM results do not suffer from detectable patterned artifacts (Fig. 4c), and the FFT of the MAP-SIM result is free of noticeable spurious peaks (Fig. 4f). We attribute this to several factors, primarily the use of incoherent illumination together with an FLCOS microdisplay for pattern generation. This, combined with precise synchronization of the SIM system, helps eliminate patterned artifacts. Additional artifacts in SIM images can arise due to the detector. In sCMOS cameras like the one we used, each pixel reads out through its own amplifier and, as such, each pixel exhibits a different gain. While very minor, such artifacts can be corrected using a variance stabilization method as has been introduced for single-molecule localization microscopy [56].
There are several other advantages to the use incoherent illumination in SIM, including removing the need for a pupil plane mask to block unwanted diffraction orders. Also, incoherent imaging of a microdisplay for pattern formation means that the pattern spatial frequency in the sample plane does not depend on the wavelength of the light that is used. On the other hand, in incoherent illumination SIM such as we used here, the contrast of the illumination pattern decreases with increasing spatial frequency according to the incoherent optical transfer function [57]. In coherent illumination SIM [8, 9, 11], the coherent optical transfer function applies [57], and so the pattern contrast does not decrease with increasing spatial frequency. This means that coherent illumination SIM can more efficiently mix high-resolution information from outside the frequency limit into the detection passband of the microscope, thereby potentially achieving better resolution than what we achieved in this work. We achieved a lateral resolution enhancement factor of ∼1.8 (Fig. 2), whereas a factor of 2.0 is expected for coherent illumination SIM.
The FLCOS microdisplay (and vendor-supplied microdisplay-timing program) we used can display an illumination pattern and switch to the next pattern in the sequence in 1.14 ms, allowing unprocessed SIM images to be acquired at rates of approximately 875 Hz. However, such rapid imaging is not useful if the reconstructed SIM images are of poor quality, e.g., if they suffer from low SNRs. Specifying the fastest possible acquisition rate is inadequate without consideration of the resolution and SNR of the results. Our resolution analysis shown in Figs. 2–4 (see also Supplementary Fig. S4) uses measured quantities to evaluate SIM results and thereby helps to make realistic conclusions about imaging speeds.
Reuse potential
The presented SIM datasets can be reused in several ways. Researchers investigating SIM reconstruction algorithms can use the datasets to compare their results with those presented here, including the newer method MAP-SIM. Also, the data may be further analyzed in other ways. One possibility is shown in the supplementary material (part 2: single-particle tracking experiments in LAMP1-GFP cells.) Here, we used single-particle tracking methods to study the mobility of lysosomes within U2-OS cells.
Availability of source code and requirements
Project name: SIMToolbox v1.3
Project home page: http://mmtg.fel.cvut.cz/SIMToolbox/
Operating system: platform independent
Programming language: MATLAB
License: GNU General Public License v3.0
Availability of supporting data
All raw and analyzed data are available in the GigaScience GigaDB database [54].
Additional files
Supplementary information is available on the GigaScience website [54].
Detailed software compatibility notes
The SIMToolbox graphical user interface (GUI) was compiled with MATLAB 2015a and tested in Windows 7 and 8. The GUI is a stand-alone program and does not require MATLAB to be installed. To use the MATLAB functions within SIMToolbox (i.e., without the GUI), MATLAB must be installed. The functions were mainly developed with 64 bit MATLAB versions 2012b, 2014a, and 2015a in Windows 7. When using SIMToolbox functions without the GUI, the MATLAB Image Processing Toolbox is required. SIMToolbox also requires the MATLAB YAML package to convert MATLAB objects to/from YAML file format. Note that this package is installed automatically when using the GUI.
Abbreviations
2D: two-dimensional; 3D: three-dimensional; BPAE: bovine pulmonary artery endothelial; FFT: fast Fourier transform; FLCOS: ferroelectric liquid crystal-on-silicon; FWHM: full width at half maximum; GFP: green fluorescent protein; GUI: graphical user interface; LAMP: lysosome-associated membrane protein; LED: light-emitting diode; MAP: maximum a posteriori probability; OS: optical sectioning; PBS: phosphate-buffered saline; PSD: power spectral density; PSF: point spread function; ROI: region of interest; SIM: structured illumination microscopy; SLM: spatial light modulator; SNR: signal-to-noise ratio; SR: super-resolution; WF: widefield.
Competing interests
The authors declare that they have no competing interests.
Funding
This work was supported by the National Institutes of Health (grant 1R15GM128166-01). This work was also supported by the University of Colorado Colorado Springs Center for the University of Colorado BioFrontiers Institute, by the Czech Science Foundation (grant GA17-05840S Multimedia optimization of shift-variant imaging system models), and by Czech Technical University in Prague (grant SGS18/141/OHK3/2T/13). T.L. acknowledges a SCIEX scholarship (project code 13.183). The funding sources had no involvement in study design; in the collection, analysis, and interpretation of data; in the writing of the report; or in the decision to submit the article for publication. This material is based in part upon work supported by the National Science Foundation under grant 1727033. Any opinions, findings, and conclusions or recommendations expressed in this material are those of the authors and do not necessarily reflect the views of the National Science Foundation.
Author contributions
T.L.: analyzed data, developed computer code; J.P.: analyzed data, developed computer code; K.F.: supervised research; K.S.: analyzed data; J.B.: acquired data; G.H.: conceived project, acquired data, analyzed data, supervised research, wrote the paper.
Supplementary Material
8/16/2018 Reviewed
9/3/2018 Reviewed
ACKNOWLEDGEMENTS
The authors thank Dr. Donna Arndt-Jovin and Dr. Tomas Jovin of the Max Planck Institute for Biophysical Chemistry (Göttingen, Germany) for the A431 cells. The authors thank Viola Hausnerová and Christian Lanctôt of Charles University in Prague (Prague, Czech Republic) for the LAMP1-GFP cells. The authors thank Pavel Křížek, Zdeněk Švindrych, and Martin Ovesný for help with data acquisition, microscopy development, programming, and data analysis.
References
- 1. Betzig E, Patterson GH, Sougrat R, et al. Imaging intracellular fluorescent proteins at nanometer resolution. Science. 2006;313:1642–5. [DOI] [PubMed] [Google Scholar]
- 2. Hess ST, Girirajan TPK, Mason MD. Ultra-high resolution imaging by fluorescence photoactivation localization microscopy. Biophys J. 2006;91:4258–72. [DOI] [PMC free article] [PubMed] [Google Scholar]
- 3. Rust MJ, Bates M, Zhuang X. Sub-diffraction-limit imaging by stochastic optical reconstruction microscopy (STORM). Nat Methods. 2006;3:793–5. [DOI] [PMC free article] [PubMed] [Google Scholar]
- 4. Heilemann M, van de Linde S, Schüttpelz M, et al. Subdiffraction-resolution fluorescence imaging with conventional fluorescent probes. Angew Chemie Int Ed. 2008;47:6172–6. [DOI] [PubMed] [Google Scholar]
- 5. Dertinger T, Colyer R, Iyer G et al. Fast, background-free, 3D super-resolution optical fluctuation imaging (SOFI). Proc Natl Acad Sci U S A. 2009;106:22287–92. [DOI] [PMC free article] [PubMed] [Google Scholar]
- 6. Geissbuehler S, Bocchio NL, Dellagiacoma C et al. Mapping molecular statistics with balanced super-resolution optical fluctuation imaging (bSOFI). Opt Nanoscopy. 2012;1:4. [Google Scholar]
- 7. Hell SW, Wichmann J. Breaking the diffraction resolution limit by stimulated emission: stimulated-emission-depletion fluorescence microscopy. Opt Lett. 1994;19:780. [DOI] [PubMed] [Google Scholar]
- 8. Heintzmann R, Cremer C. Laterally modulated excitation microscopy: improvement of resolution by using a diffraction grating. Proc SPIE. 1998;3568:185–96. [Google Scholar]
- 9. Gustafsson MGL. Surpassing the lateral resolution limit by a factor of two using structured illumination microscopy. J Microsc. 2000;198:82–87. [DOI] [PubMed] [Google Scholar]
- 10. Neil MAA, Juškaitis R, Wilson T. Method of obtaining optical sectioning by using structured light in a conventional microscope. Opt Lett. 1997;22:1905–7. [DOI] [PubMed] [Google Scholar]
- 11. Gustafsson MGL, Shao L, Carlton PM, et al. Three-dimensional resolution doubling in widefield fluorescence microscopy by structured illumination. Biophys J. 2008;94:4957–70. [DOI] [PMC free article] [PubMed] [Google Scholar]
- 12. Kner P, Chhun BB, Griffis ER et al. Super-resolution video microscopy of live cells by structured illumination. Nat Methods. 2009;6:339–42. [DOI] [PMC free article] [PubMed] [Google Scholar]
- 13. Hirvonen LM, Wicker K, Mandula O et al. Structured illumination microscopy of a living cell. Eur Biophys J. 2009;38:807–12. [DOI] [PubMed] [Google Scholar]
- 14. Shao L, Kner P, Rego EH, et al. Super-resolution 3D microscopy of live whole cells using structured illumination. Nat Methods. 2011;8:1044–6. [DOI] [PubMed] [Google Scholar]
- 15. Schermelleh L, Carlton PM, Haase S et al. Subdiffraction multicolor imaging of the nuclear periphery with 3D structured illumination microscopy. Science. 2008;320:1332–6. [DOI] [PMC free article] [PubMed] [Google Scholar]
- 16. Fiolka R, Shao L, Rego EH et al. Time-lapse two-color 3D imaging of live cells with doubled resolution using structured illumination. Proc Natl Acad Sci U S A. 2012;109:5311–5. [DOI] [PMC free article] [PubMed] [Google Scholar]
- 17. York AG, Parekh SH, Nogare DD et al. Resolution doubling in live, multicellular organisms via multifocal structured illumination microscopy. Nat Methods. 2012;9:749–54. [DOI] [PMC free article] [PubMed] [Google Scholar]
- 18. Ingaramo M, York AG, Wawrzusin P et al. Two-photon excitation improves multifocal structured illumination microscopy in thick scattering tissue. Proc Natl Acad Sci U S A. 2014;111:5254–9. [DOI] [PMC free article] [PubMed] [Google Scholar]
- 19. York AG, Chandris P, Nogare DD et al. Instant super-resolution imaging in live cells and embryos via analog image processing. Nat Methods. 2013;10:1122–6. [DOI] [PMC free article] [PubMed] [Google Scholar]
- 20. Schropp M, Uhl R. Two-dimensional structured illumination microscopy. J Microsc. 2014;256:23–36. [DOI] [PubMed] [Google Scholar]
- 21. Schropp M, Seebacher C, Uhl R. XL-SIM: Extending superresolution into deeper layers. Photonics. 2017;4:33. [Google Scholar]
- 22. Planchon TA, Gao L, Milkie DE, et al. Rapid three-dimensional isotropic imaging of living cells using Bessel beam plane illumination. Nat Methods. 2011;8:417–23. [DOI] [PMC free article] [PubMed] [Google Scholar]
- 23. Keller PJ, Schmidt AD, Santella A, et al. Fast, high-contrast imaging of animal development with scanned light sheet-based structured-illumination microscopy. Nat Meth. 2010;7:637–42. [DOI] [PMC free article] [PubMed] [Google Scholar]
- 24. Gao L, Shao L, Higgins CCD et al. Noninvasive imaging beyond the diffraction limit of 3D dynamics in thickly fluorescent specimens. Cell. 2012;151:1370–85. [DOI] [PMC free article] [PubMed] [Google Scholar]
- 25. Chen B-C, Legant WR, Wang K et al. Lattice light-sheet microscopy: imaging molecules to embryos at high spatiotemporal resolution. Science. 2014;346:1257998. [DOI] [PMC free article] [PubMed] [Google Scholar]
- 26. Li D, Shao L, Chen B-C et al. Extended-resolution structured illumination imaging of endocytic and cytoskeletal dynamics. Science. 2015;349:aab3500. [DOI] [PMC free article] [PubMed] [Google Scholar]
- 27. Dong S, Nanda P, Shiradkar R, et al. High-resolution fluorescence imaging via pattern-illuminated Fourier ptychography. Opt Express. 2014;22:20856–70. [DOI] [PubMed] [Google Scholar]
- 28. Orieux F, Sepulveda E, Loriette V et al. Bayesian estimation for optimized structured illumination microscopy. IEEE Trans Image Process. 2012;21:601–14. [DOI] [PubMed] [Google Scholar]
- 29. Lukeš T, Hagen GM, Křížek P et al. Comparison of image reconstruction methods for structured illumination microscopy. Proc SPIE. 2014;9129:91293J. [Google Scholar]
- 30. Lukeš T, Křížek P, Švindrych Z, et al. Three-dimensional super-resolution structured illumination microscopy with maximum a posteriori probability image estimation. Opt Express. 2014;22:29805–17. [DOI] [PubMed] [Google Scholar]
- 31. Mudry E, Belkebir K, Girard J, et al. Structured illumination microscopy using unknown speckle patterns. Nat Photonics. 2012;6:312–5. [Google Scholar]
- 32. Huang X, Fan J, Li L, et al. Fast, long-term, super-resolution imaging with Hessian structured illumination microscopy. Nat Biotechnol. 2018, 36, 451–459. [DOI] [PubMed] [Google Scholar]
- 33. Perez V, Chang BJ, Stelzer EHK. Optimal 2D-SIM reconstruction by two filtering steps with Richardson-Lucy deconvolution. Sci Rep. 2016;6:37149. [DOI] [PMC free article] [PubMed] [Google Scholar]
- 34. Chu K, McMillan PJ, Smith ZJ, et al. Image reconstruction for structured-illumination microscopy with low signal level. Opt Express. 2014;22:8687. [DOI] [PubMed] [Google Scholar]
- 35. Chakrova N, Rieger B, Stallinga S. Deconvolution methods for structured illumination microscopy. J Opt Soc Am A. 2016;33:B12. [DOI] [PubMed] [Google Scholar]
- 36. Křížek P, Lukeš T, Ovesný M et al. SIMToolbox: a MATLAB toolbox for structured illumination fluorescence microscopy. Bioinformatics. 2015;32:318–20. [DOI] [PubMed] [Google Scholar]
- 37. Křížek P, Raška I, Hagen GM. Flexible structured illumination microscope with a programmable illumination array. Opt Express. 2012;20:24585. [DOI] [PubMed] [Google Scholar]
- 38. Hagen GM, Caarls W, Thomas M et al. Biological applications of an LCoS-based programmable array microscope. Proc SPIE. 2007;64410S:1–12. [Google Scholar]
- 39. Werley CA, Chien M-P, Cohen AE. An ultrawidefield microscope for high-speed fluorescence imaging and targeted optogenetic stimulation. Biomed Opt Express. 2017;8:5794. [DOI] [PMC free article] [PubMed] [Google Scholar]
- 40. Dan D, Lei M, Yao B, et al. DMD-based LED-illumination super-resolution and optical sectioning microscopy. Sci Rep. 2013;3:1116. [DOI] [PMC free article] [PubMed] [Google Scholar]
- 41. Křížek P, Hagen GM. Spatial light modulators in fluorescence microscopy. In Microscopy: Science, Technology, Applications and Education, Méndez-Vilas A.ed., 4th ed (Formatex, 2010), Vol. 2, pp. 1366–77. [Google Scholar]
- 42. Hagen GM, Caarls W, Lidke KA et al. Fluorescence recovery after photobleaching and photoconversion in multiple arbitrary regions of interest using a programmable array microscope. Microsc Res Tech. 2009;72:431–40. [DOI] [PMC free article] [PubMed] [Google Scholar]
- 43. Song L, Lu-Walther H-W, Förster R et al. Fast structured illumination microscopy using rolling shutter cameras. Meas Sci Technol. 2016;27:055401. [Google Scholar]
- 44. Cvačková Z, Mašata M, Stanĕk D, et al. Chromatin position in human HepG2 cells: although being non-random, significantly changed in daughter cells. J Struct Biol. 2009;165:107–17. [DOI] [PMC free article] [PubMed] [Google Scholar]
- 45. Young LJ, Ströhl F, Kaminski CF. A guide to structured illumination TIRF microscopy at high speed with multiple colors. J Vis Exp. 2016;e53988. [DOI] [PMC free article] [PubMed] [Google Scholar]
- 46. Förster R, Lu-Walther H-W, Jost A, et al. Simple structured illumination microscope setup with high acquisition speed by using a spatial light modulator. Opt Express. 2014;22:20663–77. [DOI] [PubMed] [Google Scholar]
- 47. Lu-Walther H-W, Kielhorn M, Förster R et al. fastSIM: a practical implementation of fast structured illumination microscopy. Methods Appl Fluoresc. 2015;3:014001. [DOI] [PubMed] [Google Scholar]
- 48. Schlichenmeyer TC, Wang M, Elfer KN et al. Video-rate structured illumination microscopy for high-throughput imaging of large tissue areas. Biomed Opt Express. 2014;5:366–77. [DOI] [PMC free article] [PubMed] [Google Scholar]
- 49. Kantelhardt SR, Caarls W, de Vries AHB et al. Specific visualization of glioma cells in living low-grade tumor tissue. PLoS One. 2010;5:1–11. [DOI] [PMC free article] [PubMed] [Google Scholar]
- 50. SIM Toolbox http://mmtg.fel.cvut.cz/SIMToolbox. Accessed November 6, 2018.
- 51. Pospíšil J, Fliegel K, Klíma M. Assessing resolution in live cell structured illumination microscopy. In Proceedings of SPIE - The International Society for Optical Engineering, Páta P, Fliegel Keds. (SPIE, 2017), Vol. 10603, p. 39. [Google Scholar]
- 52. Agarwal AK, Srinivasan N, Godbole R et al. Role of tumor cell surface lysosome-associated membrane protein-1 (LAMP1) and its associated carbohydrates in lung metastasis. J Cancer Res Clin Oncol. 2015;141:1563–74. [DOI] [PMC free article] [PubMed] [Google Scholar]
- 53. http://mmtg.fel.cvut.cz/mapsimlive_suppl/. Supplementary Video, accessed November 6, 2018.
- 54. Pospíšil J, Lukeš T, Bendesky J, et al. Supporting data for “Imaging tissues and cells beyond the diffraction limit with structured illumination microscopy and Bayesian image reconstruction.”. GigaScience Database. 2018, 10.5524/100514. [DOI] [PMC free article] [PubMed] [Google Scholar]
- 55. Geissbuehler M, Lasser T. How to display data by color schemes compatible with red-green color perception deficiencies. Opt Express. 2013;21:9862–74. [DOI] [PubMed] [Google Scholar]
- 56. Huang F, Hartwich TMP, Rivera-Molina FE et al. Video-rate nanoscopy using sCMOS camera-specific single-molecule localization algorithms. Nat Methods. 2013;10:1–9. [DOI] [PMC free article] [PubMed] [Google Scholar]
- 57. Goodman JW. Frequency Analysis of Optical Imaging Systems. In Introduction to Fourier Optics, 2nd ed (McGraw-Hill Int, 1968), pp. 126–71. [Google Scholar]
Associated Data
This section collects any data citations, data availability statements, or supplementary materials included in this article.
Supplementary Materials
8/16/2018 Reviewed
9/3/2018 Reviewed