

Abstract
Mutations that attenuate homologous recombination (HR) repair promote tumorigenesis and sensitize cells to chemotherapeutics that cause replication fork collapse, a phenotype known as “BRCAness.”1 BRCAness tumors arise from loss-of-function mutations in 22 genes.1 Of these genes, all but one (Cdk12) directly function in the HR repair pathway.1 Cdk12 phosphorylates Serine 2 of the RNA Polymerase II (RNAPII) C-terminal domain (CTD) heptapeptide repeat,2–7 a modification that regulates transcription elongation, splicing, and cleavage/polyadenylation.8,9 Genome-wide expression studies suggest that Cdk12 depletion abrogates the expression of several HR genes relatively specifically, blunting HR repair.3–7,10,11 This observation suggests that Cdk12 mutational status may predict sensitivity to targeted treatments against BRCAness, such as Parp1 inhibitors, and that Cdk12 inhibitors may induce sensitization of HR-competent tumors to these treatments.6,7,10,11 Despite growing clinical interest, the mechanism by which Cdk12 regulates HR genes remains unknown. Here we find that Cdk12 globally suppresses intronic polyadenylation events, enabling the production of full-length gene products. Many HR genes harbor more intronic polyadenylation sites than other expressed genes, and these sites are particularly sensitive to Cdk12 loss. The cumulative effect of these sites accounts for the enhanced sensitivity of HR gene expression to Cdk12 loss, and we find that this mechanism is conserved in human tumors harboring Cdk12 loss-of-function mutations. This work clarifies the function of CDK12 and underscores its potential both as a chemotherapeutic target and as a tumor biomarker.
Cdk12 regulates HR gene expression by an unknown mechanism. Mouse embryonic stem cells (mESCs) are primarily in S-phase and fail to activate a G1/S checkpoint after DNA damage, making them reliant on replication-coupled HR repair and sensitive to HR defects.12–14 We sought to dissect Cdk12’s molecular function by generating Cdk12 genetic knockouts (Cdk12Δ) in mESCs that express a complementing, doxycycline (Dox)-inducible Cdk12 transgene under continuous Dox treatment (Extended Data Fig. 1A,B). Upon Dox withdrawal, Cdk12 was depleted after 24 hours and undetectable after 48 hours (Fig. 1A, Extended Data Fig. 1C). Cdk12 loss yielded a progressive viability defect after 72 hours of Dox depletion, which was reversible upon Cdk12 re-expression (Fig. 1B, Extended Data Figure 1D). Importantly, the initial 48 hours of Cdk12 depletion had minimal consequences on viability, providing a window to probe Cdk12 function.
Figure 1. Cdk12 depletion causes attenuated DNA damage repair in mESCs.
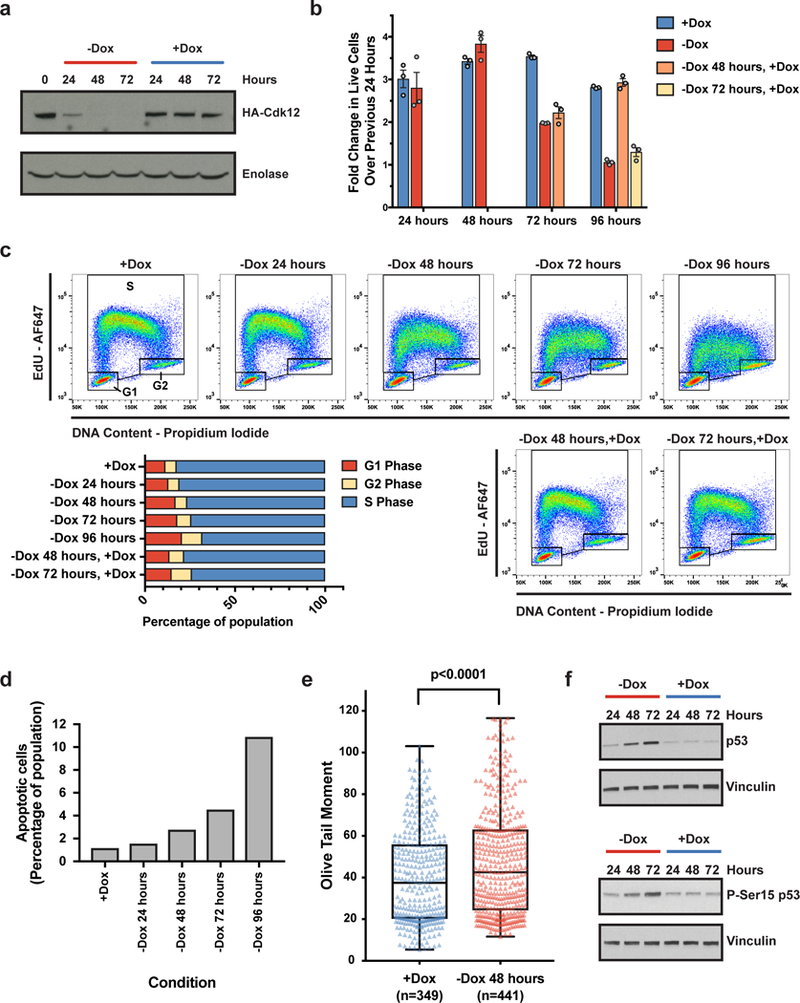
a-f, Phenotypic data from one Cdk12Δ clone. a, Representative immunoblot for Cdk12 (HA-Cdk12) after Dox withdrawal. b, Fold change in live cells over previous 24 hours. Bars: mean fold change (± s.e.m., n=3 biological replicates) for cells grown in Dox continuously (blue), off Dox starting at time 0 (red), or off Dox beginning at time 0 and reintroduced to Dox after 48 (orange) or 72 hours (yellow) for remainder of the experiment. c, FACS cell cycle profiling of one representative biological replicate for the same conditions as in (b), quantified in barplot. d, Quantification of apoptotic cells upon Cdk12 loss for one representative experiment. e. Comet assay for DNA double-stranded breaks in Cdk12Δ cells after 48 hours of Dox withdrawal. Boxplots: median value with 25th and 75th quartiles, whiskers: minimum to maximum. p value based on one-sided Mann-Whitney U test. f. Immunoblot of total and Ser15 phosphorylated (P-Ser15) p53 upon Cdk12 loss.
The viability defect observed upon Cdk12 loss could be due to decreased proliferation and/or increased cell death. Cell cycle profiling upon Cdk12 depletion revealed decreased nucleotide incorporation during S-phase and a shift in the proportion of cells from S-phase to G1, which was reversed upon re-expression of Cdk12 (Fig. 1C, Extended Data Figure 1E). Additionally, the percentage of cells undergoing apoptosis increased upon Cdk12 loss (Fig. 1D, Extended Data Figure 1F). Failure to repair DNA damage during S-phase causes replication fork stalling and impaired DNA replication,15 which is consistent with the decreased nucleotide incorporation during S-phase observed upon Cdk12 depletion. Persistent DNA damage forces mESCs to differentiate or initiate apoptosis.16,17 The accumulation of cells in G1 after Cdk12 loss is consistent with differentiating cells that have longer G1-phases and competent G1/S checkpoints,18 and the increase in apoptosis is consistent with programmed cell death in response to unrepaired DNA damage. Indeed, Dox withdrawal for 48 hours resulted in the accumulation of DNA double-strand breaks (Fig. 1E, Extended Data Fig. 1G). Furthermore, total p53 and Ser15-phosphorylated (activated) p5319 were both upregulated upon Cdk12 loss (Fig. 1F, Extended Data Figure 1H). Taken together, Cdk12 ablation results in phenotypes consistent with defective HR repair in mESCs.
To address the molecular consequences of Cdk12 loss, we sequenced RNA after 24 and 48 hours of Cdk12 depletion. 140 genes after 24 hours and 814 genes after 48 hours changed significantly at the total gene expression level (Extended Data Fig. 2A, Supplementary Table 1). Corroborating the p53 activation observed upon Cdk12 loss, approximately 33% of the significantly changing genes are validated p53 targets that changed in the expected direction (Extended Data Fig. 2B).20 Consistent with p53 activation inducing mESC differentiation, there was additionally an enrichment of genes (12%) harboring bivalent chromatin modifications (H3K4me3 and H3K27me3), a marker of early differentiation genes, at their promoter.21 These two gene signatures accounted for approximately 70% of the genes whose expression increased and 20% of the genes whose expression decreased upon Cdk12 depletion. Excluding these genes as likely secondary effects, Cdk12 depletion after 48 hours modestly affected the total expression of only 428 (3%) of expressed genes and a majority of those genes decreased in expression upon Cdk12 loss (Extended Data Fig. 2B).
In addition to gene expression changes at the total transcript level, alterations in isoform usage also impact functional gene output. Although Cdk12 was implicated in alternative splicing,22 we observed few splicing changes (Extended Data Fig. 2C). We next examined alternative cleavage and polyadenylation. In addition to the polyadenylation site located after the 3’ most exon of a gene (the distal polyadenylation site), intronic polyadenylation sites (IPAs) occur throughout introns. Usage of IPAs produces truncated mRNA isoforms that vary in coding potential, stability, translational efficiency, and localization.23,24 Using 3’ end sequencing data from mESCs25 to define high-confidence IPA and distal isoforms genome-wide, Cdk12-depleted cells showed global increases in IPA events at the expense of distal sites (Fig. 2A,2B), which was validated by isoform-specific RT-qPCR (Extended Data Figure 2D-G). Among 33,115 IPAs identified in 13,594 expressed genes,25 2009 individual IPA isoforms (~6.4% of identified IPA isoforms) were significantly differentially expressed upon Cdk12 loss (Extended Data Fig. 2H, Supplementary Tables 2,3). A vast majority of these IPA isoforms (1824, 91%) increased upon Cdk12 depletion.
Figure 2. Cdk12 loss increases intronic polyadenylation (IPA) and decreases distal polyadenylation.
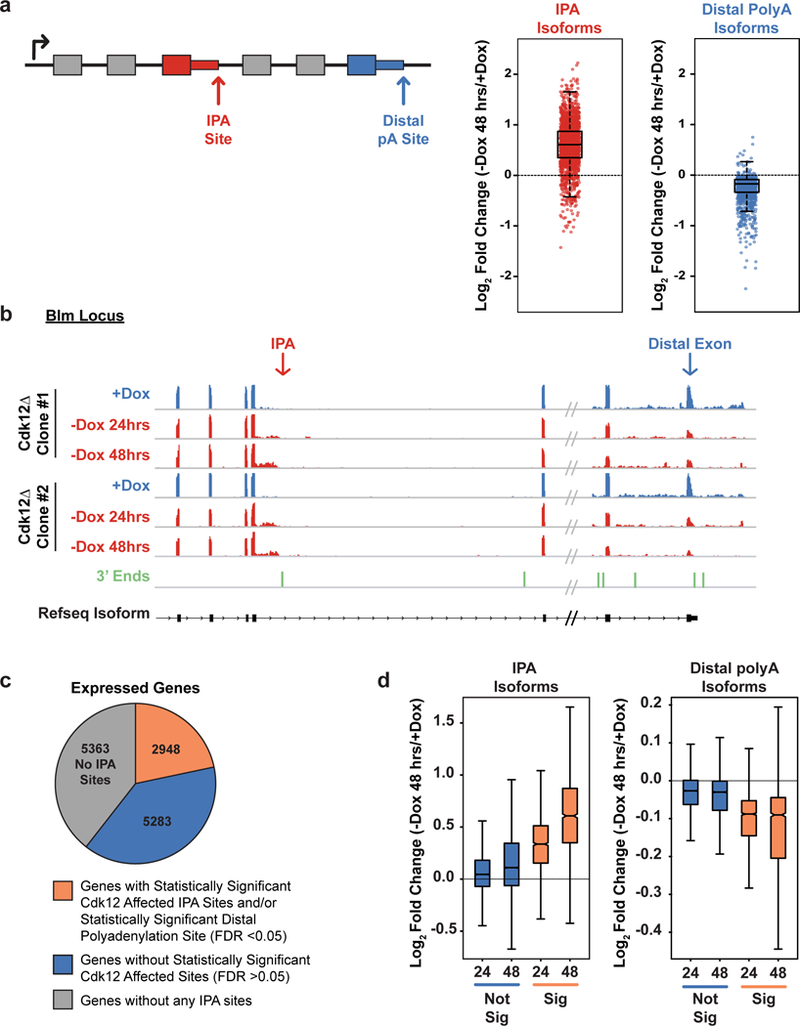
a, Left: Schematic showing an IPA and a distal polyadenylation site. Right: Log2 fold change in normalized read density (-Dox 48 hours/+Dox) for IPA isoforms (red) and distal polyadenylation isoforms (blue) reaching statistical significance (padj < 0.05). b, RNAseq read density across the 3’ end of Blm at one IPA site and at the distal exon; in Dox (blue, n=2 biological replicates per clone) or after Dox withdrawal for 24 or 48 hours (red, n=2 biological replicates per time point and clone). 3’ end sequencing read density below in green. c, Expressed genes with at least one significantly changing IPA and/or distal isoform (orange), at least one IPA isoform with no significant change in IPA or distal isoforms (blue), or genes without any identified IPA sites (grey). d, Log2 fold changes of all IPA sites (left) and all terminal sites (right) in expressed genes that change significantly upon Dox depletion for 24 or 48 hours (orange) or that do not change significantly upon Dox depletion after 24 or 48 hours (blue). (a),(d) FDR adjusted p value determined by the DEXSeq package in R; n=4 biological replicates for each condition; boxplot: median value, 25th and 75th quartiles; whiskers: 1.5x interquartile range.
To quantify expression of isoforms resulting from the usage of distal polyadenylation sites, we measured expression of the distal-most exon as normalized to the rest of the transcript (Fig. 2A). Opposite to IPA isoforms, the majority (1848, 75%) of significantly changing distal isoforms decreased upon Cdk12 loss (Fig. 2A, Extended Data Fig. 2H, Supplementary Table 4). In a subset of these genes (571), we could detect a corresponding, statistically-significant increase in at least one IPA isoform (Extended Data Fig. 2I). A majority (56%) of the remaining genes whose distal isoform’s expression decreased contained at least one IPA that increased in usage even though they did not reach statistical significance. While individual IPAs may not reach statistical significance due to the presence of multiple IPA events within the same gene, the decrease in distal polyadenylation site usage represents the cumulative loss from each upstream IPA. Therefore, we consider these 1,848 genes with significantly decreasing distal exons to also be altered by Cdk12-dependent IPA usage.
An intron may contain multiple IPAs, and a gene may contain multiple introns with IPAs. Collapsing the data to single genes indicated that 2,948 genes (~22% of expressed genes) had at least one significantly increasing IPA isoform, a significantly decreasing distal isoform, or both (Fig. 2C). We focused on this set of genes for the later mechanistic studies; however, notably, for all genes with an IPA, as a population the IPA isoform usage increased and distal isoform usage decreased whether or not the individual sites reached statistical significance (Fig. 2D). Therefore, we conclude that Cdk12’s primary role is to suppress IPAs genome-wide and promote distal (full-length) isoform expression.
Since cleavage and polyadenylation occur co-transcriptionally and Cdk12 phosphorylates the RNAPII CTD, we asked if Cdk12 depletion resulted in changes to RNAPII or its Ser2 phosphorylation (Ser2p) status that might explain the increased IPA site usage. Using chromatin immunoprecipitation sequencing, RNAPII and Ser2p RNAPII density were mapped genome-wide using two independent antibodies per target in biological duplicate. ChIP profiles from the two independent antibodies were highly similar (Extended Data Fig. 3). Therefore, the data from both antibodies and biological replicates were aggregated throughout the metagene analyses (Extended Data Fig. 4A). Furthermore, we developed a statistical framework (Extended Data Fig. 4B-D) to reliably measure differences in ChIP read density.
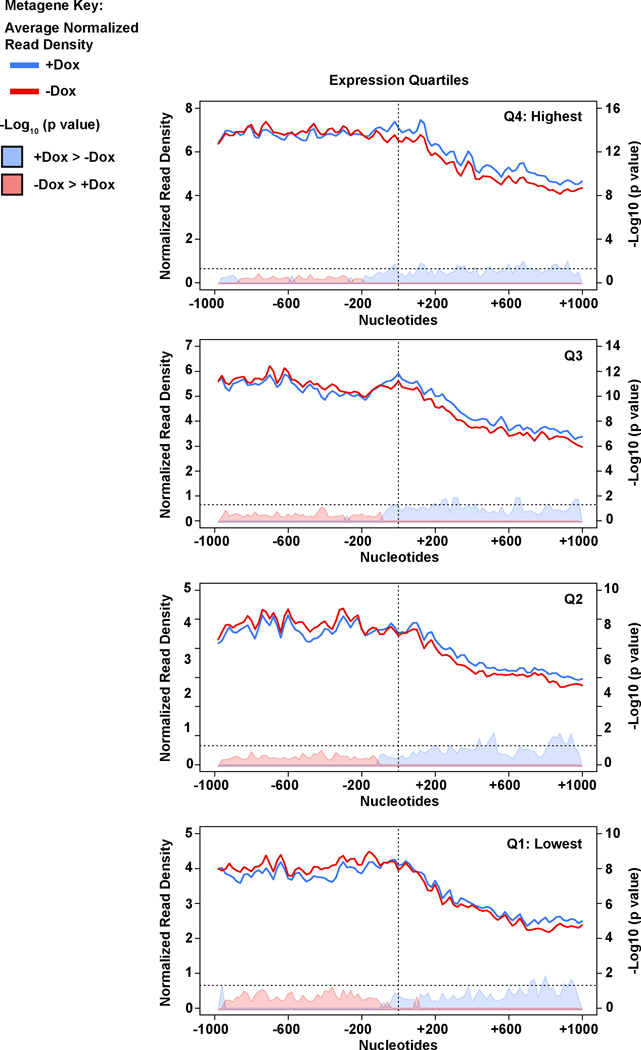
To analyze the effects on RNAPII elongation, metagene profiles of RNAPII density were plotted from the transcriptional start site (TSS) to the distal polyadenylation site (Distal PAS) (Fig. 3A). Because RNAPII density correlates with gene expression levels and inversely with gene length, we removed the shortest and longest length quartiles and focused on the middle two quartiles of genes (Extended Data Fig. 5A,B). Cdk12 loss resulted in decreased RNAPII density at the 5’ end of genes, transitioning to increased RNAPII density toward the 3’end (Fig. 3B, Extended Data Fig. 5B,C). This pattern was not specific to genes with statistically-significant Cdk12-sensitive IPA or distal polyA isoforms and was observed in length- and expression-matched control gene sets (Extended Data Fig. 6).
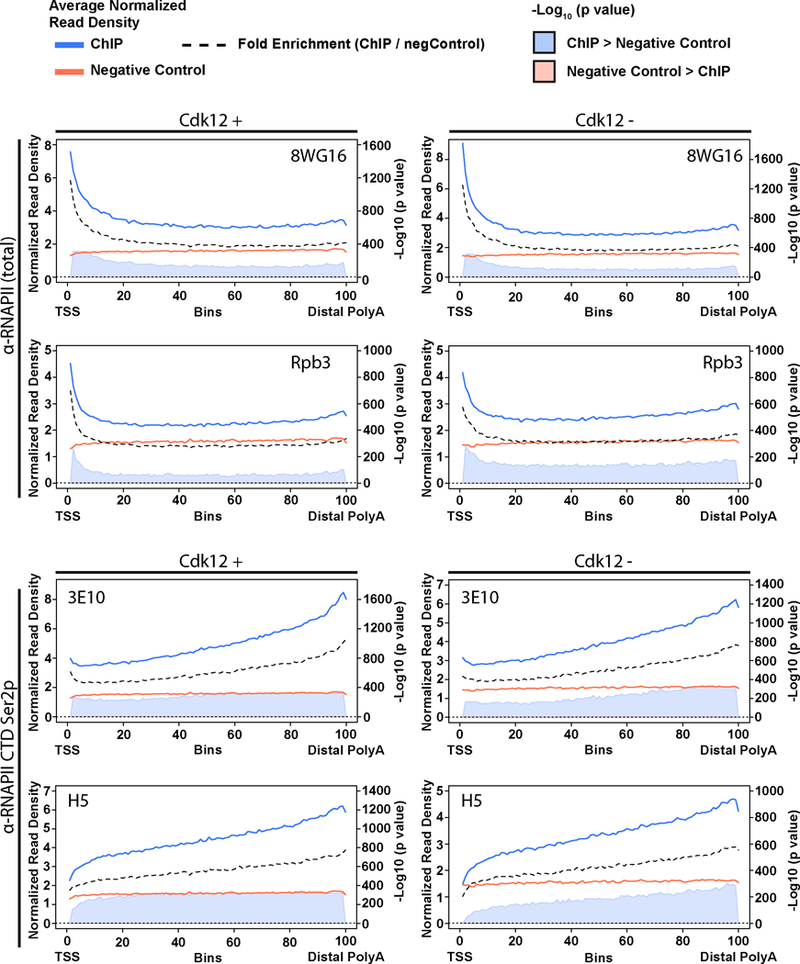
Figure 3. Cdk12 loss results in altered RNAPII elongation dynamics and decreased RNAPII-CTD Ser2 phosphorylation.
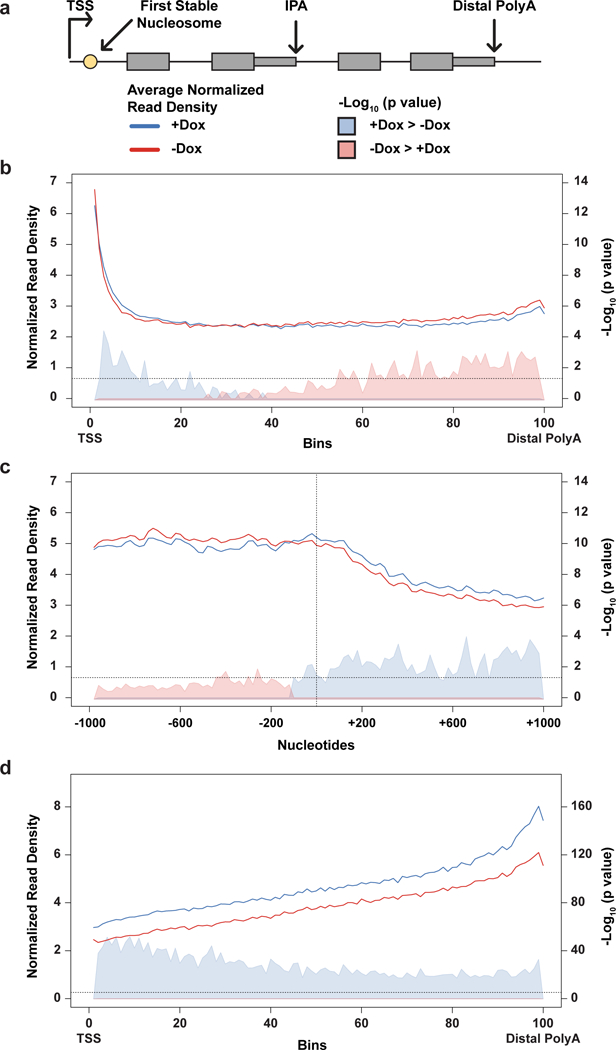
a, Schematic of gene elements and key to metagene plots. b, Metagene profile of total RNAPII density from the transcription start site (TSS) to the distal polyadenylation site. c, Total RNAPII metagene density 1 kb upstream/downstream of the first stable nucleosome dyad (dashed vertical line). d, RNAPII CTD Ser2p metagene density. (b), (c), and (d) include genes with significantly changing IPA/distal isoforms; solid lines indicate normalized read density with (blue, n=4 independent ChIPs) or without (red, n=4 independent ChIPs) Cdk12; shaded areas indicate -log10 (bin-wise p value, Kolmogorov-Smirnov one-sided test) of the difference in read density (blue indicates Cdk12+ signal is greater, pink indicates Cdk12- signal is greater). Horizontal dashed line: p = 0.05. Shortest and longest gene length quartiles are excluded in (b) & (d), (see Extended Data Fig. 5).
To determine whether decreased RNAPII density at the 5’ end of genes could be due to less RNAPII entering elongation, we aligned metagene profiles on the first stable nucleosome downstream of the promoter, a barrier associated with RNAPII entering productive elongation (Fig. 3A).26 Upon Cdk12 loss, RNAPII density increased upstream and decreased downstream of the first stable nucleosome, accounting for the decrease in RNAPII density at the 5’ end of genes and indicating that less RNAPII entered productive elongation (Fig. 3C, Extended Data Fig. 7). Therefore, the increased RNAPII density toward the 3’ ends of genes is most parsimoniously explained by altered elongation dynamics that cause progressive RNAPII accumulation across gene bodies upon Cdk12 depletion. Consistent with its role as a RNAPII Ser2 kinase, Ser2p RNAPII decreased across the entire gene body upon Cdk12 loss (Fig. 3D, Extended Data Fig. 8). Therefore, our data suggest that Cdk12-mediated phosphorylation of the RNAPII CTD is associated with a positive effect on transcription elongation dynamics across all or most genes. How this activity could alter IPA site usage is discussed in Extended Data Fig. 9.
We investigated whether enhanced IPA usage upon CDK12 depletion could account for the functional loss of HR that has been previously reported and that is reflected in our phenotypic data. Indeed, there is an enrichment for the “BRCAness” genes among those genes that show statistically-significant increased IPA or decreased distal polyadenylation usage upon Cdk12 loss (13 genes out of 22 “BRCAness” genes1, p value = 1.59 × 10⁻⁴ Fishers Exact Test). Furthermore, the distal polyadenylation isoforms of these 13 critical HR genes are more profoundly decreased as a group by Cdk12 loss than other genes (Fig. 4A). The enhanced sensitivity of HR genes to IPA activation is explained by two observations. First, the Cdk12-sensitive HR genes are enriched in the frequency of IPAs per gene (Fig. 4B). In genes with multiple IPAs, the negative effect of terminating at each individual IPA on the amount of full-length isoform is cumulative; consequently, we observed a strong correlation between the number of IPAs per gene and the effect of Cdk12 depletion on the production of full-length isoform for that gene (Fig. 4C). Second, compared to expressed genes with the same number of IPAs, the HR genes showed increased sensitivity to Cdk12 loss (Fig. 4A,4C). Our data suggest that the cumulative effect of multiple, high-sensitivity IPAs in HR genes accounts for the downregulation of their full-length isoforms. These isoform changes significantly decreased the expression of full-length protein (Fig. 4D,4E). Since Cdk12 activity maintains the full-length expression of over half of the identified BRCAness genes, we propose that the combined effect of strong downregulation of multiple gene products within the same functional pathway causes the HR-deficient phenotypes observed upon Cdk12 loss.
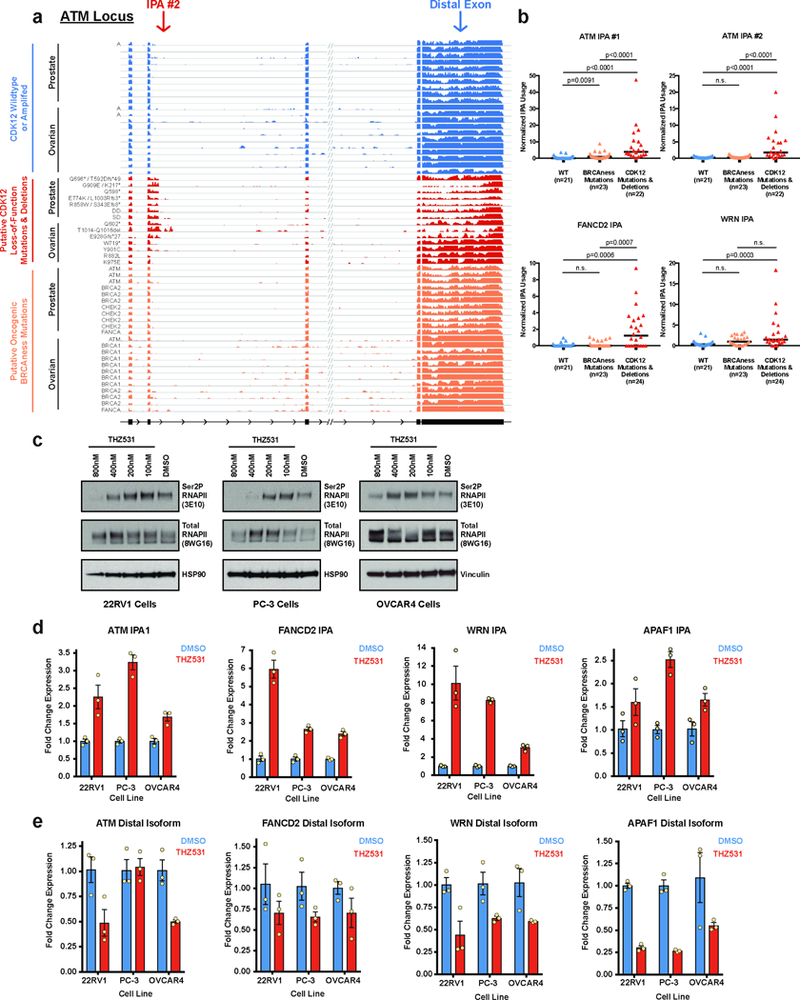
Figure 4. HR genes are highly responsive to Cdk12 loss and human tumors with CDK12 LOF upregulate IPAs.
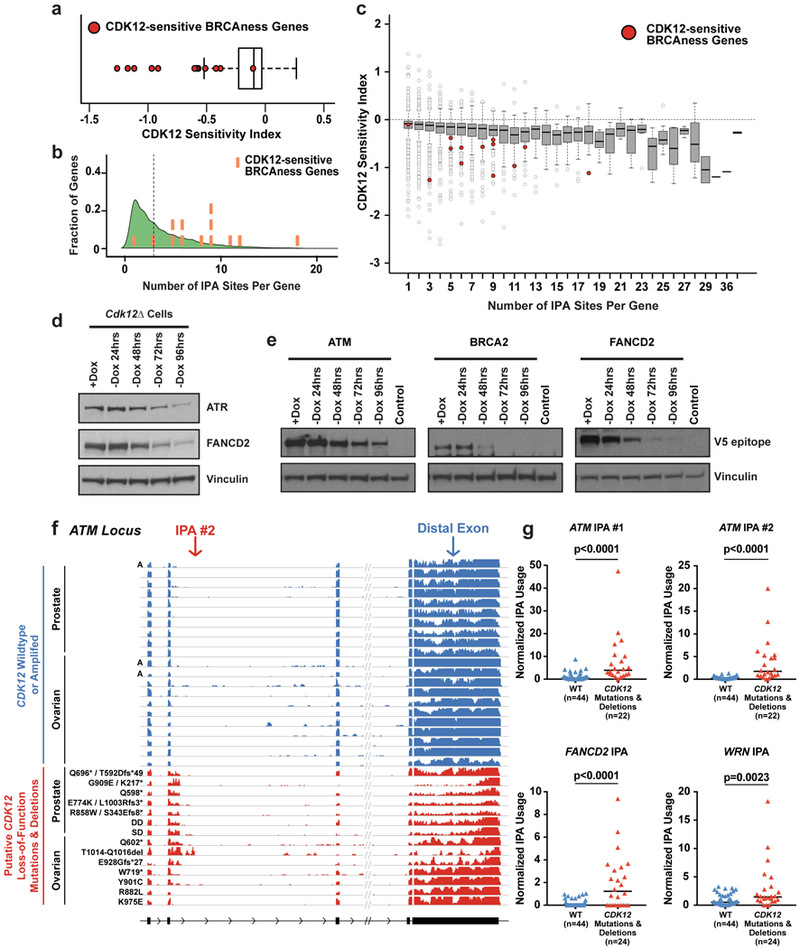
a, Distribution of the Cdk12 Sensitivity Index for all expressed genes with at least one IPA site. Cdk12-sensitive HR genes highlighted as red circles. Boxplots a,c: median value, 25th and 75th quartiles; whiskers: 1.5x interquartile range. a,c n=4 biological replicates per condition. b, Kernel density plot showing distribution of IPA sites per gene in expressed genes with at least one IPA site. Cdk12-sensitive HR genes superimposed as orange bars (left to right: Bap1, Atr, Fancl, Wrn, Brca1, Brca2, Fancm, Brip1, Fancd2, Fanci, Blm, Fanca, Atm). c, Cdk12 Sensitivity Index for expressed genes grouped by number of IPA sites per gene. Cdk12-sensitive HR genes highlighted as red circles. d, Immunoblots of Atr and Fancd2 (endogenous antibodies) in Cdk12Δ cells after Dox removal. e, Immunoblots for representative clone of each cell line endogenously V5 epitope-tagged at Atm, Brca2, and Fancd2 in Cdk12Δ cells after Dox removal. Lysate from untagged Cdk12Δ cells (+Dox) is control. f, RNAseq read density in ATM from TCGA tumors with the indicated mutational status. Tumors shown in blue are wild type for CDK12 and diploid unless marked as amplified (A). Tumors shown in red carry missense putative driver mutations, truncating mutations, or shallow (SD) or deep (DD) CDK12 gene deletions. All ovarian tumors with CDK12 mutations (except R882L) also carry shallow deletions in CDK12. g, Quantification of IPA usage in ATM (2 different IPAs), FANCD2 and WRN in TCGA tumors. Tumors with wild type or amplified CDK12 are shown in blue (WT), those with CDK12 deletions, missense mutations, or truncating mutations in red (Mut). Black bars: medians. Sample size indicated below. p values: one-sided Mann-Whitney U test.
Predicted and validated5 CDK12 loss-of-function (LOF) point mutations and deletions have been recurrently identified in prostate27,28 and ovarian29,30 tumors. RNA sequencing data from ovarian serous adenocarcinoma29 and prostate adenocarcinoma27 patient tumors showed that putative CDK12 LOF mutations, but not oncogenic mutations in other BRCAness genes, increased IPA usage within key BRCAness genes, including ATM, WRN, and FANCD2, compared to tumors that were wild type for CDK12 (Fig. 4F,G; Extended Data Fig. 10A,B). Notably, the tumor harboring the CDK12 K975E missense mutation, which was previously validated to have minimal effect on CDK12 activity5, did not show increased ATM IPA expression (Fig. 4F).
Prostate adenocarcinoma and ovarian carcinoma cell lines were treated with the CDK12/CDK13 inhibitor, THZ531,4 to validate the increased IPA usage observed in CDK12-mutant tumors; as expected, IPA usage increased (Extended Data Fig. 10C,D,E). These data suggest that CDK12’s role in suppressing IPA usage is conserved in humans and that tumors harboring CDK12 loss-of-function mutations upregulate IPAs, abrogating functional HR. Differential IPA usage may therefore serve as a biomarker for functional CDK12 (and thus HR) loss in tumors harboring uncharacterized CDK12 mutations and could potentially be used to identify patients who would respond to targeted treatments against “BRCAness” phenotypes, e.g. PARP1 inhibitors.
Methods
Cell Culture, Cell Line Generation, Drug Conditions
All cell lines were tested for mycoplasma contamination periodically, including immediately upon receipt and after generation of CRISPR-modified clonal cell lines via the MycoAlert Mycoplasma Testing Kit (Lonza). Results were always negative for mycoplasma contamination.
V6.5 (C57Bl/6–129) mESCs and derived cell lines were cultured on 0.2% gelatin-coated tissue culture plates in ES media: Dulbecco’s Modified Essential Media (Thermo Fisher) buffered with 10mM HEPES (Thermo Fisher) and supplemented with 15% Fetal Bovine Serum (Hyclone), 1000U/mL leukemia inhibitory factor (Millipore), 1x non-essential amino acids (Thermo Fisher), 2mM L-glutamine (Thermo Fisher), 0.11mM ß-mercaptoethanol (Sigma), 100 IU penicillin and 100ug/mL streptomycin (Corning). Cdk12Δ clones were maintained in 1ug/mL doxycycline (Dox) (Sigma) in ES media (changed daily) to sustain complementing levels of Cdk12. To investigate Cdk12 loss, cells were washed at time zero with HBS and switched to ES media without Dox.
Cdk12Δ clones were generated as follows (see Extended Data Fig. 1A). A Cdk12-Flox clone was isolated using CRISPR/Cas9 genome editing technology.31 Two sgRNA sequences targeting introns 3 and 4 of the endogenous Cdk12 locus were cloned into pX330 (a gift from Feng Zhang, Addgene# 42230).32 Lipofectamine®2000 (Thermo Fisher) was used to co-transfect wild type V6.5 cells with the sgRNA plasmids, along with single-stranded oligodeoxynucleotides (ssODNs) from Integrated DNA Technologies (IDT) containing a LoxP sequence adjacent to an NcoI restriction site flanked on either side by 60-nucleotide homology arms complementary to intron 3 or intron 4 surrounding the sgRNA cut site, and the pLKO.1 plasmid harboring a puromycin-resistance gene. (sgRNA sequences and ssODN sequences are provided in Supplementary Table 5.) Cells were selected 24 hours after transfection with 1ug/mL puromycin (Sigma) for 48 hours and single-cell cloned. Clones were screened for homozygous LoxP site insertion into both introns by PCR followed by NcoI digest. Positive clones were confirmed by Sanger sequencing. A Dox-inducible Cdk12 transgene was stably introduced into the Cdk12-Flox cell line using a piggybac retrotransposon system. N-terminal Flag- HA- tandem epitope tagged Cdk12 (NM_001109626.1) was cloned from polyA-selected mouse cDNA into pCR8/GW/TOPO (Thermo Fisher) followed by transfer into the doxycycline-inducible piggybac expression vector, PBNeoTetO-Dest (a gift from A.W. Cheng), using standard TOPO and Gateway cloning kits (Thermo Fisher). This expression vector was cotransfected with pAC4 (constitutively expressing M2rtTA, the Dox-inducible transactivator, flanked by piggybac recombination sites, A.W. Cheng) and mPBase (piggybac transposase expression plasmid, A.W. Cheng) using Lipofectamine®2000. 24 hours after transfection, cells were selected with 150 ug/mL Hygromycin (Thermo Fisher) and 200 ug/mL G418 (Sigma) to select stable transformants. Subsequently, a constitutive Cre expression plasmid, pPGK-Cre-bpA (a gift from Klaus Rajewsky, Addgene plasmid # 11543), and a constitutive mCherry expression vector, pCAGGS-mCherry33 were co-transfected using Lipofectamine®2000 into the Cdk12 Flox cells with stably integrated doxycycline-inducible Cdk12. 48 hours after transfection, the cell population was single-cell FACS sorted for mCherry positive cells. Beginning 4–6 hours after Cre transfection, the cells were treated daily with 1ug/mL Dox (Sigma) supplemented ES media to express rescuing levels of Cdk12 protein. PCR was used to select clones harboring homozygous deletions of exon 4 and exon 4 deletion was confirmed by Sanger sequencing across the locus. Several homozygous knockout clones were isolated and two clones were picked for subsequent analysis.
Endogenous N-terminal, V5-epitope tagged ATM, BRCA2, and FANCD2 cell lines were made as follows. sgRNAs targeting genomic loci near the start codon of ATM, BRCA2, and FANCD2 were cloned into pX330. gBlocks (IDT) containing a V5 epitope tag positioned in-frame, immediately adjacent to the start codon flanked by 64 to 354 nucleotides of homology were TOPO cloned and sequenced verified. (sgRNA sequences and gblock sequences are provided in Supplementary Table 5.) For ATM where homologous insertion of the V5 tag disrupted sgRNA/Cas9 cutting, we added a restriction enzyme site in frame to the end of the V5 tag to facilitate screening. For FANCD2 and BRCA2 where homologous insertion of the V5 epitope tag did not inhibit sgRNA/Cas9 re-cleavage, we also engineered point mutations into the gBlock construct that would introduce a novel restriction enzyme site adjacent to the sgRNA PAM motif to disrupt sgRNA/Cas9 re-cutting and facilitate screening. Cdk12Δ cells were co-transfected with the appropriate sgRNA, TOPO-cloned gBlock, and pLKO.1 with blasticidin resistance. Cells were selected with 2ug/mL Blasticidin and single cell cloned. Cells were screened by PCR followed by restriction enzyme digest. Heterozygous and homozygous insertions of the V5 tag were isolated and confirmed by Sanger sequencing across the locus. Two independent clones with homozygous or heterozygous insertions of the V5 tag were isolated and experiments were replicated in at least two independent clones.
22RV1 and PC-3 cells were from ATCC. OVCAR4 cells were from the Koch Institute’s High Throughput Sciences Facility Cell Line Repository. All cell lines were authenticated by STR Profiling (ATCC) upon receipt. 22RV1 and OVCAR4 cells were grown in RPMI-1640 (Gibco) supplemented with 10% FBS (Tissue Culture Biologicals), 2mM L-glutamine (Thermo), and 100 IU penicillin and 100ug/mL streptomycin (Corning). PC-3 cells were grown in Ham’s F-12K (Kaighn’s) Medium (Thermo Fisher) supplemented with 10% FBS (Tissue Culture Biologicals), 2mM L-glutamine (Thermo), and 100 IU penicillin and 100ug/mL streptomycin (Corning). Cells were treated with indicated concentrations of THZ5314 or equivalent volumes of DMSO (vehicle control) for four hours prior to harvest.
FACS Assays
FACS analyses were performed using BD FACS machines: FACS Celesta, LSRII, FACS Canto II, FACS LSR Fortessa, and FACS Aria IIIu. Data was collected using FACS Diva Version 8.0.1 and data was analyzed using FlowJo version 1.0.1.
Growth Curve Analysis
24 hours prior to starting the time course, cells were plated at the same cell number in biological triplicate for each of the first 3 time points of the experiment (0, 24, and 48 hours) in +Dox media; additional cells were grown in parallel cultures for the later timepoints. After 24 hours, we split these parallel cultures into biological triplicates per condition for the final three time points of the experiment (48, 72, and 96 hours). Starting at time 0, cells received daily media changes with +Dox or -Dox media as appropriate. At each time point, triplicate cell cultures were washed with HBS and harvested by trypsinization. Each biological replicate was resuspended in 450uL of ES media followed by addition of 1uL of 50uM calcein-AM in DMSO and 2uL of 2mM ethidium homodimer-1 (Thermo Fisher). Samples were incubated for 15–20 minutes at room temperature protected from light. After staining, 50uL of CountBright Absolute Counting Beads (Thermo Fisher) was added to each sample. Samples were analyzed by flow cytometry such that at least ~5000 CountBright Absolute Counting Beads (~100uL) were recorded per sample, during which samples were vortexed every minute to prevent counting beads from settling out of solution. The number of live cells per replicate was quantified in each sample by counting the number of live (Calcein-AM positive and Ethidium Homodimer-1 negative) cells and comparing it to the number of CountBright Absolute Counting Beads (with known concentration). An example of the flow cytometry gating strategy used is shown in Supplementary Figure 1. To calculate the fold change in live cells over the previous 24 hours, the number of live cells in each biological replicate at each time point was compared to the average of the live cells in the 3 biological replicates at the previous time point to give the ratio of live cells every 24 hours.
Cell Cycle Profiling
Cells were plated at approximately equal cell density 24 hours prior to profiling, such that cells were 50–80% confluent at the time of harvest. Cells were pulsed with 10uM 5-ethynl-2’-deoxyuridine (EdU) for 1 hour under standard growth conditions, then harvested by trypsinization. Collected cell pellets were fixed, permeabilized, and stained for EdU incorporation with Alexa Fluor 647 using Click-iT EdU Flow Cytometry Assay Kit (Thermo Fisher) according to manufacturer’s instructions. After EdU staining, cells were resuspended in 1x Click-iT saponin-based permeabilization and wash reagent (Thermo Fisher) with 50ug/mL propidium iodide to label total DNA content and 100ug/mL RNase A. Cells were incubated at room temperature in the dark for 30 minutes, and at least 50,000 cells (Fig. 1C) and 20,000 cells (Extended Data Fig. 1E) gated on P3 (see gating strategy in Supplementary Figure 1) were analyzed by flow cytometry for EdU content (AlexaFluor 647) and total DNA content (propidium iodide). An example of the flow cytometry gating strategy used is shown in Supplementary Figure 1.
Apoptosis
Cells were plated at approximately equal cell density at least 24 hours prior to harvest. Cells were harvested by trypsinization. The growth media and HBS wash prior to trypsinization were collected and centrifuged with the trypsinized cell population to collect any apoptosing cells with decreased adherence to the plate. Cell pellets were washed twice with cold PBS. Cells were fixed, permeabilized, and stained for cleaved Caspase-3 (apoptosis) using the FITC Active Caspase-3 Apoptosis Kit (BD Pharmingen) and the recommended protocol. At least 50,000 stained cells (gated on P3, see gating strategy in Supplementary Figure 1) were analyzed by FACS. An example of the flow cytometry gating strategy used is shown in Supplementary Figure 1.
Neutral Comet Assay
Assessment of DNA damage and double strand break formation in cells was performed using the single cell gel electrophoresis assay, CometAssay (Trevigen). Cells were harvested and resuspended in low-melting point agarose, plated onto provided glass slides, lysed, and subjected to electrophoresis in neutral electrophoresis buffer (100 mM Tris, 300 mM Na Acetate, pH 9.0). Slides were processed according to manufacturer’s instructions and stained with SYBR Gold. After staining, coverslips were mounted onto slides with approximately 1 drop of ProLong Gold (Thermo Fisher) and cured overnight at room temperature protected from light. DNA tails were visualized using a Nikon Eclipse 80i fluorescence microscope and quantified using ImageJ software with the OpenComet plugin (URL: http://www.opencomet.org).34
Western Blotting
Whole cell extract was harvested from cells by washing the cells in cold phosphate-buffered saline (PBS) and lysing in RIPA (10mM Tris pH7.4, 150mM NaCl, 1% TritonX-100, 0.1% SDS, 0.5% Sodium Deoxycholate, and 1mM EDTA) supplemented with 1x cOmplete, EDTA-free Protease Inhibitors (Roche), 2uL/mL Benzonase Nuclease (Sigma), and if needed, 1x Halt Phosphatase Inhibitor Cocktail (Thermo Fisher). Lysates were incubated on ice for at least 30min, centrifuged for 10 min at 4°C and max speed, and the cleared lysate was quantified using a standard BCA assay (Thermo Fisher). Lysates were normalized for equivalent total protein in 1x Loading Dye (62.5mM Tris pH6.8, 5% glycerol, 2% SDS, 16.67% BME, and 0.083% bromophenol blue) or 1x NuPAGE LDS Sample Buffer (Thermo Fisher) with 1x NuPAGE Reducing Agent (Thermo Fisher). Normalized lysates were boiled for 5 min or incubated at 70°C for 10 min and run on one of the following types of precast gels: NuPAGE 4–12% Bis-Tris Gels (Thermo Fisher), NuPAGE 3–8% Tris-Acetate Protein Gels (Thermo Fisher), Novex 4–20% Tris Glycine Gels (Thermo Fisher), Novex 10–20% Tris Glycine gels. Gels were transferred overnight (30 V) to PVDF in 10% methanol supplemented 1x NuPAGE Transfer Buffer (NuPAGE Bis-Tris Gels) for Bis-Tris and Tris-Acetate gels or 20% methanol supplemented 1x Novex Tris-Glycine Transfer Buffer (Thermo Fisher) for Tris-Glycine gels. Primary antibodies used for blotting: Anti-HA High Affinity Antibody (Roche 11867423001), Enolase I (CST 3810S), Vinculin (Sigma V9131), Hsp90 (BD 610418), p53 (1C12) (CST2524S), P-p53 Serine15 (CST 9284S), ATR (CST 13934S), FANCD2 (Abcam ab108928), and V5 (Life Technologies R96025). Secondary antibodies used all blots except the V5 epitope tag: ECL Anti-Rat IgG (GE Healthcare NA935V), ECL Anti-Mouse IgG (GE Healthcare NA931V), and ECL Anti-Rabbit IgG (GE Healthcare NA934V). For blots with the V5 epitope tag, we used the Anti-Mouse IgG, HRP-linked antibody (CST 7076S). Blots were exposed with Western Lightning Plus-ECL (Perkin Elmer) or SuperSignal West Dura Extended Duration Substrate (Thermo Fisher).
RNA Sequencing
Total RNA was harvested using Trizol Reagent (Thermo Fisher) from two independent Cdk12Δ clones each in biological duplicate from cells maintained in Dox (+Dox) or withdrawn from Dox for 24 hours (-Dox 24 hours) or 48 hours (-Dox 48 hours). In parallel, total RNA was harvested from Cdk12 floxed cells (without integrated Dox-inducible transgene) that had been pre-treated with 1ug/mL Dox daily for 17 days and subjected to the same Dox conditions (+Dox, -Dox 24 hours, -Dox 48 hours) in biological duplicate to serve as a control for gene expression effects of long-term Dox treatment followed by short-term withdrawal. RNA was extracted following the standard Trizol protocol and subsequently DNase treated with Turbo DNase (Thermo Fisher) under standard reaction conditions. RNA quality was assessed by Agilent 2100 Bioanalyzer and only samples with a RIN value ≥ 9 were used for library preparation and sequencing. PolyA-selected libraries were made from 1ug of total RNA input using the TruSeq Stranded mRNA Library Prep Kit (Illumina RS-122–2102) with multiplexing barcodes, following the standard protocol with the following specifications: (1) 5 min RNA fragmentation time, (2) Superscript III (Thermo Fisher) was used for reverse transcription, (3) 15 cycles of PCR were used during the library amplification step, and (4) AMPure beads (Beckman Coulter) were used to size select/purify the library post PCR amplification instead of gel size selection. The 18 libraries were pooled and sequenced on two lanes of an Illumina NextSeq500.
RT-qPCR
For total RNA (THZ531 treatments of human cell lines): Cells were harvested in Trizol (Thermo Fisher) following manufacturer’s instructions. Isolated RNA was DNase treated with Turbo DNase (Thermo Fisher) under standard reaction conditions. Subsequently, RNA was extracted with acid phenol:chloroform and ethanol precipitated. Reverse transcription was performed using SuperscriptIII (Thermo Fisher) with normalized total RNA input (4–5ug per reaction) in a 20-uL reaction with 1uL of 50uM olido(dT)20 primer and standard reaction conditions (50ºC, 1 hour). Each cDNA reaction was treated with 5U RNase H at 37ºC for 20 min and subsequently diluted 1:10 in ddH2O. Real-time qRT-PCR was performed using Power SYBR Green (Thermo Fisher) with 1–4 uL 1:10 diluted cDNA (depending on the target) and 200nM forward and reverse primer mix (500nM for HPRT control primer pair) on an ABI 7500 Real-Time qPCR machine or an ABI StepOnePlus machine. Primers spanning the exon3-exon4 junction of HPRT were used as a control to compare samples using a standard ΔΔCt calculation. (See Supplementary Table 6 for primer sequences.)
For purified mRNA (qPCR from Cdk12Δ clones): Total RNA was purified directly from cells using the RNeasy Plus kit (Qiagen) and following manufacturer’s instructions. Subsequently, mRNA was purified from total RNA using the Oligotex mRNA Mini kit (Qiagen). Reverse transcription was performed using SuperscriptIII (Thermo Fisher) with normalized quantities of mRNA input (200–250ng per reaction) in a 20-uL reaction with 200ng random hexamer primers and standard reaction conditions (50ºC, 1 hour). Each cDNA reaction was treated with 5U RNase H at 37ºC for 20 min and diluted 1:10 in ddH2O. Real-time qRT-PCR was performed using Power SYBR Green (Thermo Fisher) with 1–4 uL 1:10 diluted cDNA (depending on target) and 200nM forward and reverse primers on an ABI 7500 Real-Time qPCR machine or an ABI StepOnePlus machine. Primers to Pgk1 were used as a control to compare samples using a ΔΔCt calculation. (See Supplementary Table 6 for primer sequences.)
Chromatin Immunoprecipitation Sequencing
We modified a high resolution, micrococcal nuclease (MNase) digestion-based ChIP methodology.35,36 We performed ChIP on Cdk12Δ cells in +Dox or –Dox 48 hour conditions for total RNAPII density and Ser2p RNAPII density. Two independent antibodies were used for each antigen as follows: 8WG16 (Abcam ab817) and Rpb3 (Bethyl A303–771A) for total RNAPII density; and H5 Clone (Abcam ab24758) and 3E10 Clone (Millipore 04–1571) for Ser2p RNAPII density. Two biological replicates were processed for each antibody and Dox condition (for example of the experimental setup for one protein target, e.g. RNAPII, see Extended Data Fig. 4). For each Dox condition, we also processed 4 negative control libraries: one whole-cell extract (WCE) sample and 3 mock IP samples with the following antibodies: goat anti-mouse IgM (Thermo Fisher 31172), goat anti-rat IgG (Thermo Fisher 31226), mouse IgG2a [MOPC-173] Isotype Control (Abcam ab18413).
Chromatin immunoprecipitation was performed as follows. Briefly, 48 hours before cells were harvested, 10e6 CDK12Δ cells were plated in 15 cm dishes either in +Dox or –Dox ES media. Cells were crosslinked directly in media on the plate in 1% methanol-free formaldehyde (Thermo Fisher) for 10 minutes at room temperature. Crosslinking was quenched with 250mM glycine. Cells were washed 3x in 10mL chilled PBS and harvested by scraping. Cells were pelleted, washed in 10mL chilled PBS, and pelleted again. PBS was aspirated off the cells and the pellets were flash frozen in liquid nitrogen and stored at −80°C. Pellets were thawed on ice and resuspended in 0.9mL of ChIP Lysis Buffer (1% SDS, 10mM EDTA, 50mM Tris-HCL pH7.5) supplemented with 1x cOmplete Protease Inhibitors (Roche) and 1x Halt Phosphatase Inhibitors (Thermo Fisher) and lysed for 10 minutes at room temperature. Pellets were diluted in 8.1mL of ChIP Dilution Buffer (1% TritonX-100, 2mM EDTA, 150mM NaCl, 20mM Tris-HCl ph7.5) supplemented with 1x cOmplete Protease Inhibitors (Roche) and 1x Halt Phosphatase Inhibitors (Thermo Fisher) and 3mM CaCl2. Each tube was pre-warmed at 37°C for 2 minutes. 12 Units of micrococcal nuclease (MNase, Sigma) were added per tube and samples were digested for 30 min at 37°C with rotation. The digestion reaction was quenched with the addition of 180uL 500mM EDTA and 360uL 500mM EGTA per tube. Samples were sonicated in 15mL polystyrene tubes in a BioRupter (Diagenode) for 20 cycles on high (1 cycle = 30 seconds ON/30 seconds OFF). Samples were cleared by centrifugation (max speed, 4°C, 10min).
Soluble material was transferred to a new tube and each sample (one pellet) was split into four 1.8mL parts. Lysate was incubated overnight at 4°C plus rotation with 10ug or 10uL of acites fluid of the following antibodies: Total RNAPII (8WG16 and Rpb3), and RNAPII CTD Ser2p (H5 and 3E10). After the overnight incubation, the IPs were incubated for 2 hours at 4°C as follows: The 8WG16 and Rpb3 IPs were incubated with 100uL of Protein G Dynabeads (Thermo Fisher). The H5 IPs were incubated with 100uL of Protein G Dynabeads pre-conjugated overnight with 20ug goat anti-mouse IgM (Thermo Fisher 31172) in Bead Preparation Solution (9 ChIP Dilution Buffer: 1 ChIP Lysis Buffer). The 3E10 IP was incubated with 100uL of Protein G Dynabeads pre-conjugated with 20ug goat anti-rat IgG (Thermo Fisher 31226). IPs were washed as follows 2 × 2mL LB3 (20mM Tris-HCl pH7.5, 150mM NaCl, 2mM EDTA, 0.1% SDS, 1% Triton X-100); 1× 2mL LB3+ (20mM Tris-HCl pH7.5, 500mM NaCl, 2mM EDTA, 0.1% SDS, 1% Triton X-100); 1× 2mL Lithium Chloride Buffer (10mM Tris-HCl, pH 7.5, 250mM LiCl, 1mM EDTA, 1% NP-40), and 1× 2mL TE+50mM NaCl (10mM Tris-HCl, pH 7.5, 1mM EDTA, 50mM NaCl). After washing, beads were resuspended in 200uL of Extraction Buffer (50 mM Tris pH 8, 10mM EDTA, 5mM EGTA, 1% SDS). For WCE control, 100uL of soluble input material was added to 100uL of Extraction buffer. Samples were incubated overnight at 65°C +1000rpm shaking to elute IP and reverse crosslinks. 200uL of eluted samples was cleared of beads and added to 200uL TE pH 8. Samples were digested with 0.2mg/mL RNaseA for 1 hour at 37°C. 7 uL of CaCl2 solution (10mM Tris-HCl, pH 8 and 300mM CaCl2) and 4uL of 20mg/mL proteinase K were added to each sample and incubated for 1 hour at 55°C. Samples were extracted 1 x phenol:chloroform followed by 1 x chloroform and precipitated overnight at −80°C with a standard NaCl, ethanol, and glycogen DNA precipitation. Pellets were washed 2× 1mL 70% ethanol, dried, and resuspended in 70uL 0.1x TE pH 8.
All of the ChIP material (70 uL resuspended) or 200ng of input material (WCE) was used to prepare libraries. Sample DNA was end-repaired for 30 min at 20°C in a 100uL reaction: 1x T4 DNA Ligase Buffer (New England Biolabs, NEB), 0.4 mM dNTPs (NEB), 15 U of T4 DNA Polymerase (NEB), 5 U of Klenow enzyme (NEB), 50 U of T4 PNK (NEB). Samples were purified by Invitrogen Purelink Kit (Thermo Fisher) following standard conditions and eluted in 33uL. 32uL of purified product was A-tailed for 37°C for 30 min in a 50uL reaction with 1x NEB Buffer 2, 2 uM dATP (NEB), and 15 U of Klenow exo- (NEB). Samples were purified by Invitrogen Purelink Kit and eluted in 11uL. Illumina genomic adapters were ligated onto 10uL of the purified product for 15min at 20°C in the following 50uL reaction with 1x Quick Ligase Buffer (NEB), 400nM of Y-shaped Adapter Oligo, and 5uL of Quick Ligase. The reaction was cleaned up by a double size selection with AMPure beads as described by the manufacturer with the initial size selection using a 0.9x AMPure ratio and keeping the supernatant (to select against large products – mononucleosomes and larger) followed by a 1.8x AMPure selection keeping the bead bound material (to select against adapter dimers and free adapters). Note: When switching between first and second size selection, we used the following formula provided by the manufacturer to calculate the amount of additional beads to add: (second ratio-first ratio)*volume transferred. Illumina adapter oligos were added to the size selected product in a 50 uL PCR reaction with 200uM dNTPs (NEB), 1x High Fidelity Phusion Buffer (NEB), 1uL Phusion Polymerase (NEB), 0.5uM forward Illumina oligo adapter, and 0.5uM reverse Illumina oligo adapter with 16x cycles of standard Phusion PCR conditions (annealing: 65°C 30 sec and extension: 72°C 30 sec). PCR products were AMPure purified (1.8x ratio) according to manufacturer guidelines. Libraries were run on the BioAnalyzer. Libraries with adapter dimer contamination were repurified with extra AMPure selections until adapter dimer contamination disappeared. The libraries were sequenced with 40bp paired-end reads on 4 lanes of an Illumina HiSeq 2000. Sequencing results from the four lanes were pooled and analyzed.
Bioinformatics and statistical analyses
Mapping reads and junctions
Raw RNA-seq reads were mapped using Tophat v. 2.0.1237 or STAR aligner version 2.4.1d38 with the parameters:
STAR --runMode alignReads --runThreadN 2 --genomeDir UCSC_mm9 --twopassMode Basic --sjdbOverhang 74 --outSAMtype BAM SortedByCoordinate --outFilterMultimapNmax 20 --outFilterMismatchNmax 999 --outFilterMismatchNoverLmax 0.04 --alignIntronMin 70 --alignIntronMax 500000 --alignMatesGapMax 500000 --alignSJoverhangMin 8 --alignSJDBoverhangMin 1 --outSAMstrandField intronMotif --outFilterType BySJout
Gene expression quantitation
Gene-level quantification was performed using Rsem version 1.2.2639 and EBSeq version 1.10.140 using the UCSC mm9 genome annotation with four independent replicates each (2x technical replicates of 2x independent clones) for Cdk12-expressing and Cdk12-depleted samples at 24 and 48 hours post Dox-withdrawal. Parameters: rsem-calculate-expression --forward-prob 0.5 --output-genome-bam -p 2 --paired-end UCSC_mm9
Rsem analysis was followed by read-count matrix assembly and standard EBSeq differential expression analysis.
Gene-level and quantification was also performed using DESeq41 to obtain independent validation as well as to derive an adjusted p value for use in gene expression volcano plots. Gene expression differences at the total gene level were considered significant if the posterior probability of differential expression (PPDE) as determined by EBSeq > 0.95. Genes that exhibited statistically significant changes in response to doxycycline alone were excluded from the set of Cdk12-affected genes. Gene expression data is provided in Supplementary Table 1.
Annotation of p53-target genes and bivalent promoters
p53 target genes were derived from previously published data.20 In order to be considered a direct p53 transcriptional target gene, the gene was required to have a p53 ChIP peak within ~5.5 kb upstream and 2.5 kb downstream of the TSS, and exhibit a p53-dependent transcriptional response to DNA-damage induced by Adriamycin (doxorubicin) dosing in mouse ES cells. Directionality of transcriptional responses was determined by microarray-assayed gene expression changes.
Classification of bivalent-promoter genes was based on previously published data.21 Genome wide ChIP experiments were used as the basis for classifying genes based on histone modifications within the promoter region. Genes with H3K4-trimethylation overlapping H3K27-trimethylation in mouse ES cells were considered to belong to the bivalent class.
Determination and quantitation of alternative splicing events
Mapped splice junctions detected in all samples were combined and processed using custom Python scripts to filter out junctions representing < ~1% of transcripts. Alternative and constitutive intron classifications were performed using custom Python scripts, and are agnostic with regard to existing annotations other than known gene boundaries. If no overlapping introns exist for a given intron, it is assigned to the constitutive class. The subgroups containing overlapping introns are assigned a splicing classification if the start and end coordinates of all of the constituent introns fall into a pattern representing a known splice type (cassette, mutually exclusive, alternative 5’ splice site, alternative 3’ splice site).
To quantify differences in alternative splicing events between Cdk12-expressing and Cdk12-depleted cells, splicing events determined from mapped junctions as described above were converted into event-specific gff3 annotation files compatible with MISO.42 We then performed two separate MISO analyses (one for each clone, comparing Cdk12-expressing versus Cdk12-depleted samples) per alternative splicing type. To be considered significant, splicing events in both independent clones were required to change in percent-spliced in (delta-PSI) in the same direction, both with a Bayes factor of >= 5.
Annotation of intronic polyadenylation (IPA) sites
We used previously published 3’ end sequencing data25 to identify genome-wide polyadenylation sites in the same strain of mouse ES cells used to generate the Cdk12 knockout lines. These data were generated from poly(A)-selected RNA that was oligo-dT primed and reverse transcribed. cDNAs were circularized, PCR amplified, and sequenced. After mapping, the reads were filtered to remove genomically-encoded poly(A) tracts and polyadenylation sites associated with B2-SINE retrotransposons. Putative cleavage sites were then required to have one of 36 strong, polyadenylation signal sequences within 40 nucleotides upstream. In the data analysis performed here, we first combined all cleavage sites from both control and U1-snRNA antisense morpholino oligonucleotide treated cells (two replicates each) and cleavage sites within 40 nucleotides of contiguous sequence were combined into the same cluster. Clusters were required to contain a minimum of 20 reads to be included in the analysis. Putative IPAs that overlapped an alternative 5’ splice site extending into the intron (as identified in our RNA sequencing data- see section on “Determination and quantitation of alternative splicing events”) were excluded from the analysis. The genomic coordinates of these clusters are provided in Supplementary Table 2.
Genome-wide IPA transcript annotation and quantification
We used custom Python scripts to derive a transcriptome annotation based on Mm9 (Mus_musculus_NCBI_build37.1) gene start and end boundaries, the location of polyadenylation sites as determined by 3’ end sequencing (described above), and the genomic locations of all mapped splice junctions from the RNA-seq data. Annotation of the distal polyadenylation site isoform for each gene was based on the consensus isoform, i.e. the junctions defining each exon are the most frequently used junction detected among all of the combined samples. Each IPA site within a gene was then assigned to an additional transcript based on the consensus isoform but terminating at the IPA cleavage site. These gene annotations were then converted to DEXseq exon parts using DEXseq-associated script dexseq_prepare_annotation.py and the reads mapping to each exon part in each sample were counted using dexseq_count.py. Using the counts matrix thus derived for all biological replicates in each condition, DEXseq was used to identify changes in the relative abundance of each exon part as normalized to all exon parts within the gene, including those representing the IPAs and distal polyadenylation site isoform 3’ terminal exon. This gave a log2-fold change and FDR adjusted p value for each exon part as it differed between the Cdk12-expressing and Cdk12-depleted samples. IPA sites or distal polyadenylation site isoform 3’ terminal exons whose exon part exhibited an adjusted p value < 0.05 were considered statistically significant. Significantly changing IPA sites and distal polyadenylation site isoform 3’ terminal exons are listed in Supplementary Tables 3 and 4, respectively.
Determination of first stable nucleosome dyad positions
Genomic coordinates of nucleosome dyads in mESCs were download from previously published data.43 To identify regions with stable nucleosomes, five different mESC MNase-seq datasets were analyzed with NucTools.44 Stable nucleosome regions were determined using stable_nucs_replicates.pl with a sliding window of 50 bases and a relative error based on five replicates < 0.5. The NucTools-defined stable region dyad downstream and most proximal to the transcription start site was regarded as the +1 dyad (first stable nucleosome).
Chromatin Immunoprecipitation sequencing analysis
Custom Python and R scripts were used to calculate normalized read densities of ChIP data, bin for metagene analysis, and perform statistical tests. Briefly, genomic coordinates for full genes or TSS-flanking regions for specific gene sets were first compiled. Mapped reads from ChIP data sets were counted within the specified regions using the Bedtools coverageBed tool,45 combining both replicates of both antibodies for the ChIP under analysis. Each gene was divided into 100 equal-length bins and the total read counts per nucleotide for each gene within each bin were summed. Summed read counts were normalized by total mapped reads for the sample under consideration and the average of these count values across all genes was plotted as the normalized read density for that bin. Bin-wise p values were obtained using a one-sided Kolmogorov-Smirnov test comparing the distributions of normalized reads across all genes in the group between Cdk12 +/− samples.
Determination of Cdk12 Sensitivity Index
In order to determine the cumulative effect of IPA site usage on full-length gene expression, the log2-fold change between Cdk12-depleted and Cdk12-expressing samples in the ratios of the previously annotated (see above) first and last (distal polyA isoform) exons of each gene was calculated. We refer to this change in ratio as the “Cdk12 Sensitivity Index”. The index for each gene was plotted as part of a distribution containing all other genes sharing the same total number of detected IPA sites as determined by the IPA annotation (see above).
Identification and quantitation of IPA sites in The Cancer Genome Atlas (TCGA) tumor samples
Patient samples from the prostate adenocarcinoma27 and ovarian serous cystadenocarcinoma29 TCGA cohorts were assessed for the presence of missense or truncating point mutations as well as copy-number variations (amplifications or deletions) in CDK12 and BRCAness genes using cBioPortal (www.cbioportal.org).46,47 Additionally, normalized CDK12 mRNA expression levels were considered. We included all tumors from these cohorts in our analysis that were predicted to have CDK12 loss-of-function (LOF) mutation(s) as annotated in cBioPortal. We considered tumors to be likely CDK12 LOF if they carried at least one truncating or missense putative driver mutation or if the copy number analysis classified the tumor as carrying a deep deletion (indicating a likely homozygous deletion across the locus) and if the mRNA expression levels of CDK12 were significantly downregulated compared to the mean expression of WT, diploid CDK12 tumors. We additionally included 4–5 shallow deletions from each tumor type that exhibited the lowest mRNA expression levels of CDK12, and one in-frame deletion mutant of unknown functional consequence. As an additional control for specificity, we included a single tumor carrying a K975E mutation that had been previously validated as a missense mutation with no LOF. The only CDK12 mutated tumors we excluded from consideration were three tumors in prostate carrying missense mutations of unknown consequence as we could not accurately classify them as WT or LOF.
A set of patients from the prostate and ovarian cohorts with wild-type, diploid CDK12 loci were selected along with one or two samples from each tumor type carrying an amplified locus. Among all such tumors, this control set was selected by ranking the tumors in order of normalized CDK12 mRNA expression and taking the subset with the highest expression (9 from each cohort). For the BRCAness control subset, we selected a set of tumors that carried only “likely oncogenic” missense or truncating mutations and selected a set that contained all available BRCAness genes, as well as larger samples for genes that are more frequently mutated (e.g. BRCA1/2 and CHEK2). These tumors were selected without considering CDK12 gene expression levels. Retrospectively, we also determined that two of the CDK12 WT diploid tumors carried putative deep deletions with mRNA loss in FANCA, CHEK1, and CHEK2 in one tumor and BRCA2 in the other; these tumors exhibited identical low IPA usage consistent with the other CDK12 WT tumors. Once the tumor sets were selected based on these genomic characteristics, sequencing data from all of these tumors and only these tumors were downloaded and included in the quantifications performed as described below.
Aligned reads (STAR-mapped .bam files) covering relevant gene loci were downloaded from the Genomic Data Commons (https://gdc.cancer.gov/) using the bam-slicing tool. Reads were visually inspected to identify regions with clear IPA events that aligned with a canonical PAS motif. Regions spanning from the upstream 5’ splice site of the preceding exon to the PAS site were added to gtf annotations of the gene of interest, and DEXseq tools were used for annotating and counting reads mapping to each exon part as described above; these were used to generate a matrix of counts per exon part in each individual tumor sample. All exonic reads aligning within the gene were summed for each sample, and then read counts for each exon part were normalized to exon length and total exon counts in the gene for each sample to obtain a normalized IPA site usage metric for that sample. GraphPad PRISM 7 software was used to generate plots. Significance levels of the differences in IPA site usage between wild type diploid versus the deletion and mutation group were determined using the Mann-Whitney U test (one-tailed).
Statistics and Reproducibility
All results with one representative example shown were repeated at least twice (n=2 independent experiments) with each of those independent experiments from two independently-derived clonal cell lines. Western blots for Cdk12 expression: Cdk12Δ clone 36 (Fig. 1A) n=4 independent experiments and Cdk12Δ clone 28 (Extended Data Fig. 1C) n=4 independent experiments. Cell cycle profiling: Cdk12Δ clone 36 (Fig. 1C) n=3 independent experiments and Cdk12Δ clone 28 (Extended Data Fig. 1E) n=2 independent experiments. Cleaved Caspase 3 Apoptosis Staining: Cdk12Δ clone 36 (Fig. 1D) n=2 independent experiments and Cdk12Δ clone 28 (Extended Data Fig. 1F) n=2 independent experiments. Comet Assays: Cdk12Δ clone 36 (Fig. 1E) n=1 independent experiment and Cdk12Δ clone 28 (Extended Data Fig. 1G) n=1 independent experiment. Western blots for p53 and Ser15 phosphorylated p53: Cdk12Δ clone 36 (Fig. 1F) n=2 independent experiments and Cdk12Δ clone 28 (Extended Data Fig. 1H) n=1 independent experiment. Cdk12Δ genotyping gel (Extended Data Fig. 1B) n=2 independent experiments and PCR products were sequenced verified by Sanger sequencing. Endogenous Atr and Fancd2 expression upon Cdk12 loss (Fig. 4D) were repeated in n=2 independent experiments. All V5-epitope tagged Western Blots (Fig. 4E) were repeated in two independently-derived homozygously or heterzygously V5-epitope, endogenously-tagged clones. V5-Atm Western Blot (Fig. 4E): clone 1 (n=1) and clone 7 (n=2). V5-Brca2 (Fig. 4E): clone 14 (n=2) and clone 15 (n=2). Fancd2 (Fig. 4E): clone 5 (n=3) and clone 35 (n=3). Western blots from human cell lines treated with THZ531 (Extended Data Fig. 10c) were performed n=1 independent experiments to establish the concentration at which 22RV1, PC-3, and OVCAR4 cells responded to THZ531 treatment. qRT-PCR results based on these treatments (Extended Data Fig. 10D,E) was performed in n=3 biological replicates.
Extended Data
Extended Data Figure 1. Generation of Cdk12 genetic knockouts in mESCs and phenotypic data from a second, independently-derived Cdk12Δ clone.

a, Schematic of Cdk12Δ cell line generation, LoxP sites (red triangles), sgRNA cut sites (*), endogenous promoter (black arrows), doxycycline-inducible promoter (orange arrow). b, PCR products across the Cdk12 locus flanking exon 4 (primers shown as orange arrows) for wild type mESCs and Cdk12Δ clones. Clones 28 and 36 used throughout this study are indicated in red. c-h. Phenotypic data from the second of two independently-derived Cdk12Δ clones shown corresponding to results shown in Fig.1a-1f for the other clone. c, Representative immunoblot for Cdk12 transgene (HA epitope) expression after doxycycline (Dox) withdrawal. d, Fold change in live cells over previous 24 hours quantified by FACS; bars represent mean fold change (± standard error of the mean.) for n=3 biological replicates. Cells were grown continuously in Dox (blue bars), withdrawn from Dox at time 0 and maintained off Dox (red bars), or withdrawn from Dox at time 0 and reintroduced to Dox after 48 hours (orange bars) or 72 hours (yellow bars) for remainder of the time course. e, FACS-based cell cycle profiling of one representative replicate for the same conditions as in (d) (top) and quantification (bottom). f, FACS-based quantification of cleaved Caspase 3 positive (apoptotic) cells. One representative biological replicate shown. g. Neutral Comet assay to quantify degree of unrepaired DNA double stranded breaks in Cdk12Δ cells after 48 hours of doxycycline withdrawal. Boxplots: median value with 25th and 75th quartiles, whiskers: minimum to maximum. p value based on one-sided Mann-Whitney U test. h. Immunoblot for total and phosphorylated Ser15 (P-Ser15) p53 upon Cdk12 loss for the indicated times. Hsp90 serves as a loading control.
Extended Data Figure 2. Gene expression changes in Cdk12-depleted mESCs are dominated by increased IPA usage.

a, Volcano plots of significant gene expression events at the total gene level after 24 h (left) or 48 h (right) of Dox withdrawal. y-axis: FDR adjusted P value determined by the DESeq package in R; coloured dots: PPDE > 0.95 (posterior probability of differential expression, determined by the EBSeq package in R). b, Pie chart indicating genes that decrease (left) or increase (right) in total gene expression at a statistically significant level after 24 or 48 hours of Dox withdrawal (combined). Likely secondary effects are indicated: p53 repressed genes (red), p53 enhanced genes (blue), bivalent promoter genes (yellow), p53 repressed and bivalent promoter genes (orange), and p53 enhanced and bivalent promoter genes (green). Genes belonging to none of the above groups are indicated in gray. c, Table summarizing significant alternative splicing events observed after 24 and 48 hours of Dox depletion in Cdk12Δ cells. d-g, Isoform-specific RT-qPCR corroborating differential isoform usage observed in the RNA sequencing data. Blue bars (+Dox) and red bars (-Dox 48 hours) represent mean (± s.e.m.), n=4 biological replicates. Seven IPA isoforms from five genes were validated in two independent Cdk12Δ clones in d,e and the corresponding distal polyadenylation isoforms in those five genes were validated in f,g. d,f and e,g represent corresponding data from the two independently-derived Cdk12Δ clones used throughout this study. h, Left: IPA sites exhibiting a statistically significant (padj < 0.05, FDR adjusted p value determined by the DEXSeq package in R) change (orange) or not (blue) in expressed genes after 24 or 48 hours of Dox depletion. Right: Expressed genes with terminal polyadenylation sites that are significantly changed (orange) or not statistically significant (blue) as normalized to the rest of the transcript. i, Scatterplot showing log2 fold changes upon Cdk12 loss in distal exons (y-axis) versus IPA sites (x-axis) in genes that have both a statistically significant (padj < 0.05, FDR adjusted p value determined by the DEXSeq package in R) IPA site and a statistically significant distal polyadenylation change; n=4 biological replicates per condition.
Extended Data Figure 3. ChIP antibodies recognizing the same target protein exhibit strongly overlapping metagene patterns.
Metagene profiles broken down by individual antibodies used. Blue lines: normalized read density for the specific ChIP antibody in n=2 biological replicates. Orange lines: negative control (combined whole cell extract and all antibody negative controls n=4 biological replicates). Black dashed lines: fold-enrichment (specific ChIP / negative control). Shaded areas: -log10 (bin-wise p values, Kolmogorov-Smirnov one-sided test) of the difference in read depth, with blue shading indicating the plus Cdk12 signal is significantly greater. The -log10 of the p value is shown in the axis on the right, and the horizontal dashed line is p = 0.05. TSS=Transcription Start Site; DPA=Distal PolyAdenylation site.
Extended Data Figure 4. Schematic of ChIP experiments and data analysis.
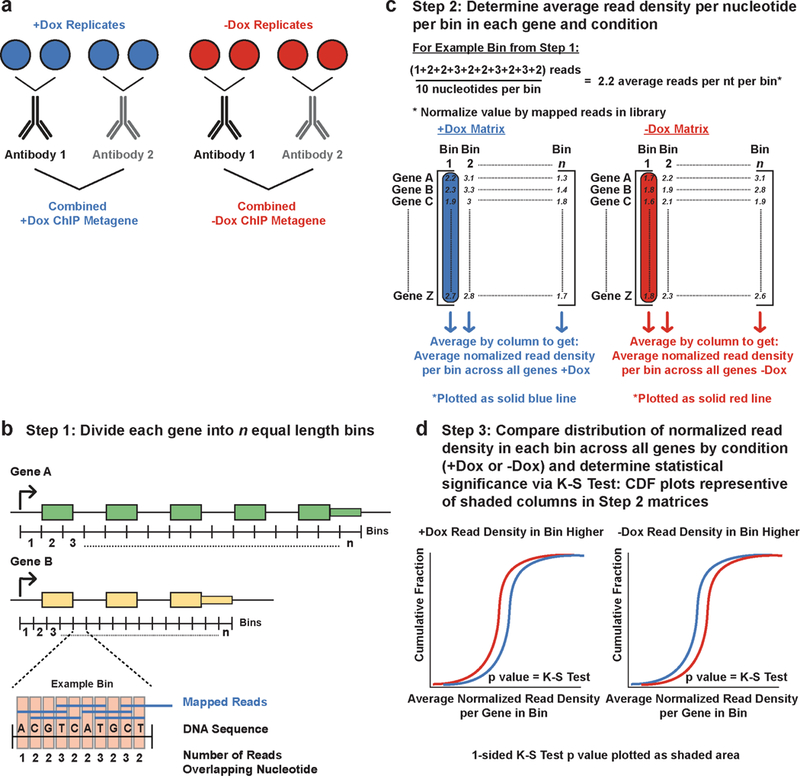
a, Schematic of biological replicate/antibody replicate experimental design. Each ChIP set (RNAPII and Ser2p, in Cdk12+/−) consists of 2 biological replicates each ChIP’ed with two different antibodies recognizing the same protein. These four replicates were then combined for the ChIP metagene analyses. b-d, Schematic of the steps used to determine average read densities for the ChIP assays, and the statistical test used to determine significant differences in the read density dependent on Cdk12 expression.
Extended Data Figure 5. RNAPII metagene patterns are influenced by gene length and expression.
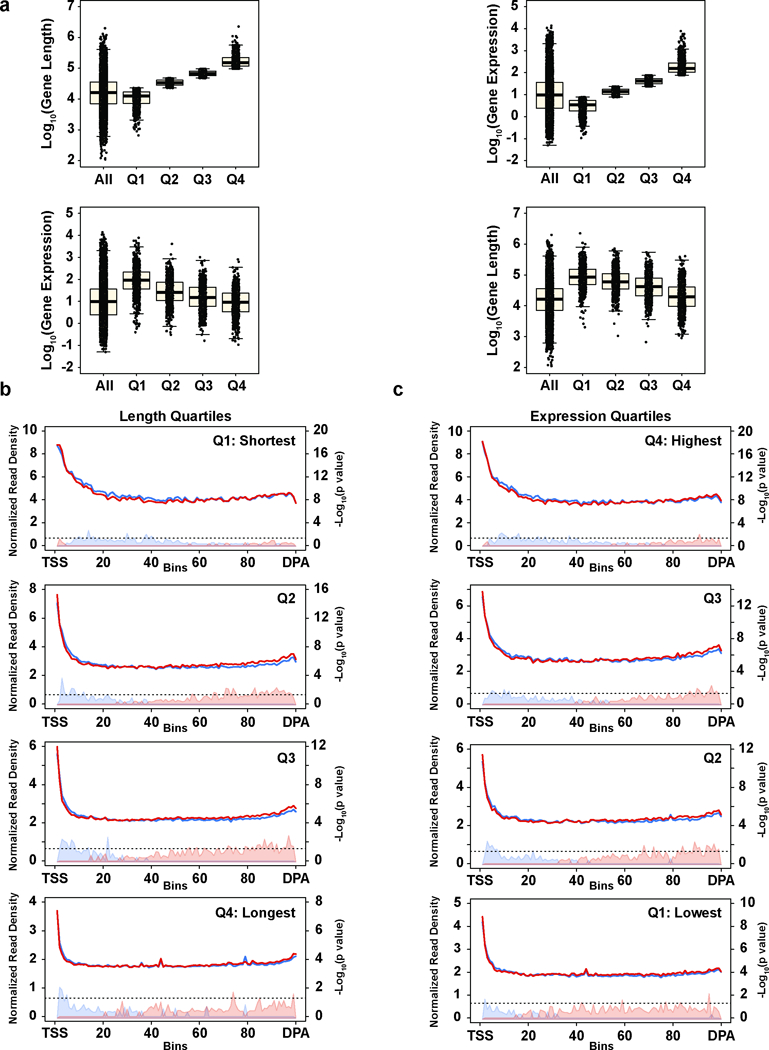
a, Length and expression quartiles of the significantly changing (padj < 0.05, FDR adjusted p value determined by the DEXSeq package in R) IPA/distal isoform genes. Boxplots: median value, 25th and 75th quartiles; whiskers: 1.5 x interquartile range. n=4 biological replicates per condition. Top panels: size distributions (log10 of length in nucleotides) of each length quartile (left) and gene expression distributions (log10 of transcripts per million) of each expression quartile (right) compared to the respective distributions of all expressed genes. Bottom panels: expression distributions for each length quartile (left) and length distributions for each expression quartile (right). Note that gene length is generally inversely correlated with expression level, but median expression of all quartiles of the significantly changing IPA/distal isoforms is higher than the median for all expressed genes. Additionally, the median length of all expression quartiles of the significantly changing IPA/distal isoforms is longer than the median for all expressed genes. Thus, the genes comprising the significantly changing IPA/distal isoform set are longer and more highly expressed for their length than the broader gene population. b, Metagene profiles of RNAPII density in genes with a statistically-significant Cdk12-sensitive IPA or terminal site divided into length-based quartiles. TSS=Transcription Start Site; DPA=Distal PolyAdenylation site. Note that in the shortest quartile, the Cdk12-depleted cells show a trend toward increased density at the 3’ end, but the shortest genes terminate before the polymerase can reach a higher density than the Cdk12 competent cells. Conversely, the longest genes are expressed at a lower level (see (a)) resulting in lower RNAPII ChIP signal. For these reasons, the shortest and longest length quartiles were excluded in Fig. 3b,d. c, Metagene profiles of RNAPII density in genes with a statistically-significant Cdk12-sensitive IPA or terminal site divided into expression-based quartiles. (b),(c): n=4 biological replicates per condition.
Extended Data Figure 6. RNAPII ChIP pattern is not specific to Cdk12 IPA-affected genes.
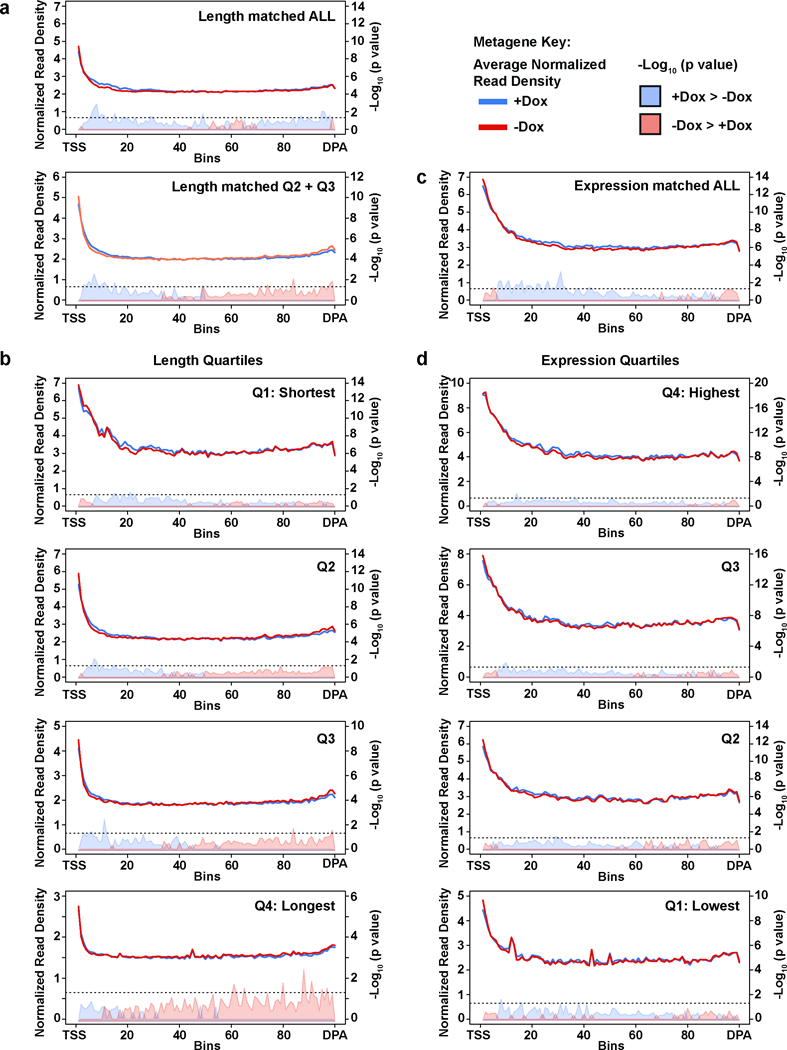
a, Metagene profile of RNAPII density in a set of control genes length-matched to the significantly changing IPA/distal isoforms gene set. Top: all control genes. Bottom: shortest and longest quartiles removed (as in Fig. 3B). TSS=Transcription Start Site; DPA=Distal polyadenylation site. b, Metagene profile of RNAPII density in a set of control genes length-matched to the significantly changing IPA/distal isoforms gene set divided into length quartiles. c, Metagene profile of RNAPII density in a set of control genes expression-matched to the significantly changing IPA/distal isoforms gene set. d, Metagene profile of RNAPII density in a set of control genes expression-matched to the significantly changing IPA/distal isoforms gene set divided into expression quartiles. (a),(b),(c),(d): n=4 biological replicates per condition.
Extended Data Figure 7. Increased RNAPII upstream and decreased RNAPII downstream of first stable nucleosome occurs in all gene expression quartiles.
Total RNAPII metagene density 1 kb upstream and 1kb downstream of the first stable nucleosome for the significantly changing IPA/distal isoforms divided into gene expression quartiles. As in Fig 3C, solid lines indicate normalized read depth with (blue) or without (red) Cdk12, and shaded areas indicate - log10 (bin-wise p values, Kolmogorov-Smirnov one-sided test) of the difference in read depth, with blue shading indicating the plus Cdk12 signal is significantly greater, and pink shading indicating the minus Cdk12 signal is significantly greater. Horizontal dashed line is p = 0.05. Vertical dashed line indicates the position of the first stable nucleosome dyad. n=4 biological replicates per condition.
Extended Data Figure 8. Ser2p is depleted by Cdk12 loss and metagene patterns are influenced by gene expression and length.

Left panels: Metagene profiles of Ser2p density in genes with a statistically-significant (padj < 0.05, FDR adjusted p value determined by the DEXSeq package in R) Cdk12-sensitive IPA or terminal site divided into length-based quartiles. As in Fig. 3D, solid blue lines indicate average normalized read density in Cdk12+ cells, red solid lines are the average normalized read density in Cdk12-depleted samples. Light blue shading indicates the plus Cdk12 signal is significantly greater. TSS=Transcription Start Site; DPA=Distal PolyAdenylation site. n=4 biological replicates per condition. Right panels: Metagene profiles of Ser2p density in genes with a statistically-significant Cdk12-sensitive IPA or terminal site divided into expression-based quartiles. n=4 biological replicates per condition.
Extended Data Figure 9. Model for Cdk12-dependent effects gene expression.

Upper panel: As RNAPII transcribes through a region of a gene (exonic regions shown in blue with 5’ and 3’ splice sites (SS) indicated, introns in gray) containing an IPA site (red octagon), Cdk12-dependent RNAPII-CTD Ser2 phosphorylation suppresses IPA site usage. Lower panel: In the absence of Cdk12, RNAPII-CTD Ser2 phosphorylation is decreased. IPA site usage increases resulting in increased truncated isoforms and decreased distal-most isoforms. RNAPII that transcribes through the downstream exon accumulates with increasing density toward the 3’ end of the gene. IPA usage is in competition with the splicing of its encompassing intron. Decreasing the efficiency of splicing or increasing the activity of cleavage and polyadenylation could both increase IPA usage. Alternatively, a decrease in the efficiency of transcription elongation could alter the kinetic balance to favor IPA usage. Indeed, previous studies have suggested that slower RNAPII elongation rates, due to mutant polymerases or alterations in transcription elongation factors, increased IPA usage over that of distal sites.48–51 All three of these possibilities have been related to RNAPII Ser2p, however, how Cdk12-dependent phosphorylation of Ser2p is related to these non-mutually exclusive possibilities is unclear.
Extended Data Figure 10. Upregulated IPA usage in human tumors is specific to CDK12 LOF mutations and not mutations in other BRCAness genes; treatment of human ovarian and prostate cancer cell lines with THZ531 phenocopies the increased IPA site usage observed upon CDK12 genetic loss.
a, RNA-seq read density from TCGA tumors of prostate adenocarcinoma and ovarian cystadenocarcinoma with the indicated mutational status at a CDK12-sensitive IPA site in the human ATM locus (ATM IPA #2). Tumors shown in blue are wild type for CDK12 and diploid unless marked as amplified (A). Tumors shown in red carry missense putative driver mutations, truncating mutations, or shallow (SD) or deep (DD) gene deletions at the CDK12 locus. Of note, all of the ovarian cystadenocarcinoma tumors that carry CDK12 point mutations also have a shallow deletion at the CDK12 locus except for the tumor with the R882L missense mutation, which is diploid across the locus. The 23 tumors in orange harbor putative driver mutations in the other BRCAness genes (ATM, BRCA1, BRCA2, FANCA, or CHEK2) as noted. b, Quantification of usage of two different IPA sites in human ATM and at IPA sites in FANCD2 and WRN in human prostate and ovarian tumors from TCGA data (combined in this analysis). Tumors with wild type or amplified CDK12 are shown in blue (WT), those with CDK12 deletions, missense mutations, or truncating mutations in red (Mut), and those with “putative driver mutations” in the five BRCAness genes (ATM, BRCA1, BRCA2, FANCA, and CHEK2) in orange. Medians are indicated by horizontal black bars and sample sizes are indicated below. p values were determined by one-sided Mann-Whitney U test. c, Immunoblots showing the effect of 4 hours of THZ531 treatment versus DMSO on RNAPII pSer2 (3E10 antibody) in two prostate carinoma cell lines (22RV1 and PC-3) and one high-grade serous ovarian carcinoma cell line (OVCAR4). Total RNAPII (8WG16 antibody), HSP90, and Vinculin are shown as loading controls. d,e, Isoform-specific RT-qPCR used to assay for the expression of IPA and distal polyadenylation isoforms in two prostate carcinoma cell lines (22RV1 and PC-3) and one high-grade serous ovarian carcinoma cell line (OVCAR4) after 4 hours of 400nM THZ531 treatment compared to vehicle (DMSO). Blue bars (DMSO) and red bars (THZ531) represent mean (± standard error of the mean) for n=3 biological replicates. d, Four IPA sites were assayed. Three IPA sites were identified in the TCGA data from human ovarian and prostate tumors (ATM IPA #1, FANCD2 IPA, and WRN IPA; Fig. 4f,4g and Extended Data Fig. 10a,b). One IPA site corresponded to a significantly changing IPA site in our mESC Cdk12Δ clones (Apaf1). e, Distal polyadenylation isoforms for the genes in (d).
Supplementary Material
Acknowledgements
We thank the Sharp lab, J. Arribere, F. Solomon, and L. Cote for discussions and reading the manuscript. pAC4 and PBNeoTetO-Dest, the OVCAR4 cells, and THZ531 were gifts from A. Cheng, S. Correa Echavarria, and N. Gray respectively. We thank H. Suzuki for the first stable nucleosome coordinates and F. Lam for assistance with Comet Assays. The results shown here are in part based upon data generated by the TCGA Research Network: http://cancergenome.nih.gov/. We thank the Koch Institute’s Robert A. Swanson (1969) Biotechnology Center at MIT for technical support, specifically G. Paradis of the Flow Cytometry Core and S. Levine of the MIT BioMicro Center. The research described here was supported by Program Project Grant P01CA042063 from the NCI (P.A.S), by United States Public Health Service grants R01-GM034277 and R01-CA133404 from the NIH (P.A.S.), and by the Koch Institute Support (core) grant P30-CA14051 from the NCI. S.J.D. was also supported by a David H. Koch Fellowship and the NIH Pre-Doctoral Training Grant T32GM007287 (MIT Biology Department).
Footnotes
Author Contributions S.J.D., P.L.B., and P.A.S conceived and designed the experiments and analysis. S.J.D. performed experiments. P.L.B. performed computational analysis. S.J.D., P.L.B., and P.A.S. analyzed the data and wrote the manuscript.
Author Information Reprints and permissions information is available at www.nature.com/reprints. The authors declare no competing financial interests. Correspondence and requests for materials should be addressed to sharppa@mit.edu.
Data and Software Availability Sequencing data is deposited in the Gene Expression Omnibus under accession number GSE116017. Custom scripts used for analysis are available upon request.
Supplementary Information is available in the online version of the paper.
References
- 1.Lord CJ & Ashworth A BRCAness revisited. Nat. Rev. Cancer 16, 110–120 (2016). [DOI] [PubMed] [Google Scholar]
- 2.Bartkowiak B et al. CDK12 is a transcription elongation-associated CTD kinase, the metazoan ortholog of yeast Ctk1. Genes Dev. 24, 2303–2316 (2010). [DOI] [PMC free article] [PubMed] [Google Scholar]
- 3.Blazek D et al. The Cyclin K/Cdk12 complex maintains genomic stability via regulation of expression of DNA damage response genes. Genes Dev. 25, 2158–2172 (2011). [DOI] [PMC free article] [PubMed] [Google Scholar]
- 4.Zhang T et al. Covalent targeting of remote cysteine residues to develop CDK12 and CDK13 inhibitors. Nat. Chem. Biol. 12, 876–884 (2016). [DOI] [PMC free article] [PubMed] [Google Scholar]
- 5.Ekumi KM et al. Ovarian carcinoma CDK12 mutations misregulate expression of DNA repair genes via deficient formation and function of the Cdk12/CycK complex. Nucleic Acids Res. 43, 2575–2589 (2015). [DOI] [PMC free article] [PubMed] [Google Scholar]
- 6.Johnson SF et al. CDK12 Inhibition Reverses De Novo and Acquired PARP Inhibitor Resistance in BRCA Wild-Type and Mutated Models of Triple-Negative Breast Cancer. Cell Rep. 17, 2367–2381 (2016). [DOI] [PMC free article] [PubMed] [Google Scholar]
- 7.Balboni Iniguez A et al. EWS/FLI Confers Tumor Cell Synthetic Lethality to CDK12 Inhibition in Ewing Sarcoma. Cancer Cell 33, 202–216 (2018). [DOI] [PMC free article] [PubMed] [Google Scholar]
- 8.Hsin JP & Manley JL The RNA polymerase II CTD coordinates transcription and RNA processing. Genes Dev. 26, 2119–2137 (2012). [DOI] [PMC free article] [PubMed] [Google Scholar]
- 9.Davidson L, Muniz L & West S 3’ end formation of pre-mRNA and phosphorylation of Ser2 on the RNA polymerase II CTD are reciprocally coupled in human cells. Genes Dev. 28, 342–356 (2014). [DOI] [PMC free article] [PubMed] [Google Scholar]
- 10.Bajrami I et al. Genome-wide profiling of genetic synthetic lethality identifies CDK12 as a novel determinant of PARP1/2 inhibitor sensitivity. Cancer Res. 74, 287–297 (2014). [DOI] [PMC free article] [PubMed] [Google Scholar]
- 11.Joshi PM, Sutor SL, Huntoon CJ & Karnitz LM Ovarian cancer-associated mutations disable catalytic activity of CDK12, a kinase that promotes homologous recombination repair and resistance to cisplatin and poly(ADP-ribose) polymerase inhibitors. J. Biol. Chem. 289, 9247–9253 (2014). [DOI] [PMC free article] [PubMed] [Google Scholar]
- 12.Hong & Stambrook PJ Restoration of an absent G1 arrest and protection from apoptosis in embryonic stem cells after ionizing radition. Proc. Natl. Acad. Sci. U.S.A. 101, 14443–14448 (2004). [DOI] [PMC free article] [PubMed] [Google Scholar]
- 13.Aladjem MI et al. ES cells do not activate p53-dependent stress responses and undergo p53-independent apoptosis in response to DNA damage. Curr. Biol. 8, 145–155 (1998). [DOI] [PubMed] [Google Scholar]
- 14.Tichy ED et al. Mouse Embryonic Stem Cells, but Not Somatic Cells, Predominantly Use Homologous Recombination to Repair Double-Strand DNA Breaks. Stem Cells Dev. 19, 1699–1711 (2010). [DOI] [PMC free article] [PubMed] [Google Scholar]
- 15.Zeman MK & Cimprich KA Causes and consequences of replication stress. Nat. Cell Biol. 16, 2–9 (2013). [DOI] [PMC free article] [PubMed] [Google Scholar]
- 16.Lin T et al. p53 induces differentiation of mouse embryonic stem cells by suppressing Nanog expression. Nat. Cell Biol. 7, 165–171 (2005). [DOI] [PubMed] [Google Scholar]
- 17.Liu JC et al. High mitochondrial priming sensitizes hESCs to DNA-damage-induced apoptosis. Cell Stem Cell 13, 483–491 (2013). [DOI] [PMC free article] [PubMed] [Google Scholar]
- 18.van der Laan S, Tsanov N, Crozet C & Maiorano D High Dub3 expression in mouse ESCs couples the G1/S checkpoint to pluripotency. Mol. Cell 52, 366–379 (2013). [DOI] [PubMed] [Google Scholar]
- 19.Shieh SY, Ikeda M, Taya Y & Prives C DNA damage-induced phosphorylation of p53 alleviates inhibition by MDM2. Cell 91, 325–334 (1997). [DOI] [PubMed] [Google Scholar]
- 20.Lee K-H et al. A genomewide study identifies the Wnt signaling pathway as a major target of p53 in murine embryonic stem cells. Proc. Natl. Acad. Sci. U.S.A. 107, 69–74 (2010). [DOI] [PMC free article] [PubMed] [Google Scholar]
- 21.Ku M et al. Genomewide analysis of PRC1 and PRC2 occupancy identifies two classes of bivalent domains. PLoS Genet. 4, 1–14 (2008). [DOI] [PMC free article] [PubMed] [Google Scholar]
- 22.Tien JF et al. CDK12 regulates alternative last exon mRNA splicing and promotes breast cancer cell invasion. Nucleic Acids Res. 45, 6698–6716 (2017). [DOI] [PMC free article] [PubMed] [Google Scholar]
- 23.Tian B & Manley JL Alternative polyadenylation of mRNA precursors. Nat. Rev. Mol. Cell Biol. 18, 18–30 (2017). [DOI] [PMC free article] [PubMed] [Google Scholar]
- 24.Tian B, Pan Z & Lee JY Widespread mRNA polyadenylation events in introns indicate dynamic interplay between polyadenylation and splicing. Genome Res. 17, 156–165 (2007). [DOI] [PMC free article] [PubMed] [Google Scholar]
- 25.Almada AE, Wu X, Kriz AJ, Burge CB & Sharp PA Promoter directionality is controlled by U1 snRNP and polyadenylation signals. Nature 499, 360–363 (2013). [DOI] [PMC free article] [PubMed] [Google Scholar]
- 26.Weber CM, Ramachandran S & Henikoff S Nucleosomes are context-specific, H2A.Z-modulated barriers to RNA polymerase. Mol. Cell 53, 819–830 (2014). [DOI] [PubMed] [Google Scholar]
- 27.The Cancer Genome Atlas Research Network et al. The Molecular Taxonomy of Primary Prostate Cancer. Cell 163, 1011–1025 (2015). [DOI] [PMC free article] [PubMed] [Google Scholar]
- 28.Wu Y et al. Inactivation of CDK12 Delineates a Distinct Immunogenic Class of Advanced Prostate Cancer. Cell 173, 1770–1782 (2018). [DOI] [PMC free article] [PubMed] [Google Scholar]
- 29.The Cancer Genome Atlas Research Network. Integrated genomic analyses of ovarian carcinoma. Nature 474, 609–615 (2011). [DOI] [PMC free article] [PubMed] [Google Scholar]
- 30.Menghi F et al. The Tandem Duplicator Phenotype Is a Prevalent Genome-Wide Cancer Configuration Driven by Distinct Gene Mutations. Cancer Cell 34, 1–14 (2018). [DOI] [PMC free article] [PubMed] [Google Scholar]
Additional References
- 31.Ran FA et al. Genome engineering using the CRISPR-Cas9 system. Nat. Protoc. 8, 2281–2308 (2013). [DOI] [PMC free article] [PubMed] [Google Scholar]
- 32.Cong L et al. Multiplex genome engineering using CRISPR/Cas systems. Science 339, 819–823 (2013). [DOI] [PMC free article] [PubMed] [Google Scholar]
- 33.Gurtan AM, Lu V, Bhutkar A & Sharp PA In vivo structure-function analysis of human Dicer reveals directional processing of precursor miRNAs. RNA 18, 1116–1122 (2012). [DOI] [PMC free article] [PubMed] [Google Scholar]
- 34.Gyori BM, Venkatachalam G, Thiagarajan PS, Hsu D & Clement M-V OpenComet: An automated tool for comet assay image analysis. Redox Biology 2, 457–465 (2014). [DOI] [PMC free article] [PubMed] [Google Scholar]
- 35.Skene PJ & Henikoff S A simple method for generating high-resolution maps of genome-wide protein binding. eLife 4, 1–9 (2015). [DOI] [PMC free article] [PubMed] [Google Scholar]
- 36.Skene PJ, Hernandez AE, Groudine M & Henikoff S The nucleosomal barrier to promoter escape by RNA polymerase II is overcome by the chromatin remodeler Chd1. eLife 3, 1–19 (2014). [DOI] [PMC free article] [PubMed] [Google Scholar]
- 37.Trapnell C et al. Differential gene and transcript expression analysis of RNA-seq experiments with TopHat and Cufflinks. Nat. Protoc. 7, 562–578 (2012). [DOI] [PMC free article] [PubMed] [Google Scholar]
- 38.Dobin A et al. STAR: ultrafast universal RNA-seq aligner. Bioinformatics 29, 15–21 (2013). [DOI] [PMC free article] [PubMed] [Google Scholar]
- 39.Li B & Dewey CN RSEM: accurate transcript quantification from RNA-Seq data with or without a reference genome. BMC Bioinform. 12, 323 (2011). [DOI] [PMC free article] [PubMed] [Google Scholar]
- 40.Leng N et al. EBSeq: an empirical Bayes hierarchical model for inference in RNA-seq experiments. Bioinformatics 29, 1035–1043 (2013). [DOI] [PMC free article] [PubMed] [Google Scholar]
- 41.Anders S & Huber W Differential expression analysis for sequence count data. Genome Biol. 11, 1–12 (2010). [DOI] [PMC free article] [PubMed] [Google Scholar]
- 42.Katz Y, Wang ET, Airoldi EM & Burge CB Analysis and design of RNA sequencing experiments for identifying isoform regulation. Nat. Meth. 7, 1009–1015 (2010). [DOI] [PMC free article] [PubMed] [Google Scholar]
- 43.Voong LN et al. Insights into Nucleosome Organization in Mouse Embryonic Stem Cells through Chemical Mapping. Cell 167, 1555–1570 (2016). [DOI] [PMC free article] [PubMed] [Google Scholar]
- 44.Vainshtein Y, Rippe K & Teif VB NucTools: analysis of chromatin feature occupancy profiles from high-throughput sequencing data. BMC Genomics 18, 1–13 (2017). [DOI] [PMC free article] [PubMed] [Google Scholar]
- 45.Quinlan AR & Hall IM BEDTools: a flexible suite of utilities for comparing genomic features. Bioinformatics 26, 841–842 (2010). [DOI] [PMC free article] [PubMed] [Google Scholar]
- 46.Gao J et al. Integrative analysis of complex cancer genomics and clinical profiles using the cBioPortal. Sci. Signal. 6, 1–19 (2013). [DOI] [PMC free article] [PubMed] [Google Scholar]
- 47.Cerami E et al. The cBio Cancer Genomics Portal: An Open Platform for Exploring Multidimensional Cancer Genomics Data: Figure 1. Cancer Discov. 2, 401–404 (2012). [DOI] [PMC free article] [PubMed] [Google Scholar]
- 48.Cui Y & Denis CL In Vivo Evidence that Defects in the Transcriptional Elongation Factors RPB2, TFIIS, and SPT5 Enhance Upstream Poly(A) Site Utilization. Mol. Cell. Biol. 23, 7887–7901 (2003). [DOI] [PMC free article] [PubMed] [Google Scholar]
- 49.Yang Y et al. PAF Complex Plays Novel Subunit-Specific Roles in Alternative Cleavage and Polyadenylation. PLoS Genet. 12, 1–28 (2016). [DOI] [PMC free article] [PubMed] [Google Scholar]
- 50.Liu X et al. Transcription elongation rate has a tissue-specific impact on alternative cleavage and polyadenylation in Drosophila melanogaster. RNA 23, 1807–1816 (2017). [DOI] [PMC free article] [PubMed] [Google Scholar]
- 51.Bentley DL Coupling mRNA processing with transcription in time and space. Nat. Rev. Genet. 15, 163–175 (2014). [DOI] [PMC free article] [PubMed] [Google Scholar]
Associated Data
This section collects any data citations, data availability statements, or supplementary materials included in this article.