

Abstract
The development of Barret’s esophagus (BE) and its progression to esophageal adenocarcinoma (EAC) is highly linked to exposure to acidic bile salts due to chronic gastroesophageal reflux disease (GERD). In this study, we investigated the role of Apurinic/apyrimidinic endonuclease 1 /redox effector factor-1 (APE-1/REF-1) in STAT3 activation in response to EAC. Our results indicate that APE1 is constitutively overexpressed in EAC whereas its expression is transiently induced in response to acidic bile salts in non-neoplastic BE. Using overexpression or shRNA knockdown of APE1, we found that APE1 is required for phosphorylation, nuclear localization, and transcription activation of STAT3. By using an APE1 redox-specific mutant (C65A) and APE1 redox inhibitor (E3330), we demonstrate that APE1 activates STAT3 in a redox-dependent manner. By using pharmacologic inhibitors and genetic knockdown systems, we found that EGFR is a required link between APE1 and STAT3. EGFR phosphorylation (Y1068) was directly associated with APE1 levels and redox function. Co-immunoprecipitation and proximity ligation assays indicated that APE-1 coexists and interacts with the EGFR-STAT3 protein complex. Consistent with these findings, we demonstrated a significant induction in mRNA expression levels of STAT3 target genes (IL-6, IL-17A, BCL-xL, Survivin and c-Myc) in BE and EAC cells, following acidic bile salts treatment. ChIP assays indicated that acidic bile salts treatment enhances binding of STAT3 to the promoter of its target genes, Survivin and BCL-xL. Inhibition of APE1/REF-1 redox activity using E3330 abrogated STAT3 DNA binding and transcriptional activity. The induction of APE-1 - STAT3 axis in acidic bile salts conditions provided a survival advantage and promoted cellular proliferation. In summary, our study provides multiple pieces of evidence supporting a critical role for APE1 induction in activating the EGFR-STAT3 signaling axis in response to acidic bile salts, the main risk factors for Barrett’s carcinogenesis.
Keywords: APE-1/Ref-1, Acidic bile salts, Barret’s Esophagus, Esophageal adenocarcinoma, EGFR, Stat3
Introduction
The incidence of esophageal adenocarcinoma (EAC) continues to rise in the United States.(1) EAC is associated with a poor clinical outcome and an overall 5-year survival rate below 20%.(2) Barrett’s esophagus (BE), the main risk factor for EAC, is a premalignant condition whereby columnar metaplasia replaces the stratified squamous epithelium of the distal esophagus.(3) Patients with BE exhibit a 30- to 60-fold increased risk for EAC.(4) BE develops as a consequence of chronic gastroesophageal reflux disease (GERD), where acid and bile salts abnormally reflux from the stomach into the lower esophagus.(5–7) Previous studies have shown that bile acids are implicated in the development of BE and EAC by activating oncogenic signaling pathways along with induction of sustained levels of oxidative stress and DNA damage.(8–13)
Apurinic/apyrimidinic endonuclease-1 (APE1)/redox effector factor-1 (REF-1) is a multifunctional protein that plays an essential role in base excision repair (BER) pathway, essential for repair of oxidative DNA base damage as well as redox-dependent regulation of several transcription factors such as NF-kB, p53, AP-1, HIF-1 and EGR-1.(14, 15) The N-terminal Cys65 residue in the APE1 protein plays a critical role in mediating its redox functions by acting as a reductive activator of transcription factors.(16–18) The redox- selective inhibitor of APE1, E3330, has been shown to reduce STAT3 transcriptional activity.(19, 20) Dysregulation of APE1 expression level is associated with cancer development, angiogenesis, progression, and metastasis.(21–24) Of note, high levels of APE1 have been linked to resistance to chemotherapy and poor clinical outcome.(20, 25–27)
EGFR is known to catalyze STAT3 tyrosine phosphorylation in response to EGF(28), which is mediated by the intrinsic kinase activity of the receptor.(29) EGFR activation results in its dimerization to facilitate the phosphorylation of its tyrosine residue, Y1068, the binding site for STAT3.(30) STAT3 phosphorylation, nuclear localization, and transcriptional activation mediate expression of a large number of target genes, leading to initiation of signaling cascades that promote proliferation, tumorigenesis, metastasis, and chemoresistance.(31, 32) Nuclear localization of EGFR has been recently described in aggressive tumors.(33)
In this study, we demonstrate that exposure of Barrett’s and EAC cells to acidic bile salts, in conditions that closely mimic GERD, activates EGFR and STAT3 in a manner dependent on APE1 expression and redox activity. We also provide evidence that acidic bile salts induce APE1-EGFR-STAT3 complex formation with subsequent STAT3 binding to the promoters of pro-survival genes. These findings identify a novel role of APE1 in response to acidic bile salts, the main risk factor for BE and EAC.
RESULTS
Acidic bile salts induce APE1-dependent activation of STAT3 in BE and EAC cells.
We have previously shown APE1 is expressed at high levels in dysplastic BE and EAC tissue samples. This expression pattern was also observed in the dysplastic BE and EAC cell lines, as compared to non-dysplastic BE (34)(Supplementary Figure S1A). We investigated whether exposure to acidic bile salts, that mimic the pathophysiological condition of GERD, can induce APE1 expression. We treated non-dysplastic BE (CPA, BAR-10T), high-grade dysplastic BE (CPB), and EAC (OE33, FLO-1) cell lines with acidic bile salts cocktails (100 μM, pH 4) for 30 min followed by recovery in regular media for 0, 1, 3 and 6h post-treatment. We found that APE1 was substantially induced in response to acidic bile salts in all cell lines (Figure 1A and Supplementary Figure S1B). Of note, high levels of phospho-STAT3 (Y705) have been observed in dysplastic BE and EAC.(35) Therefore, we investigated the relationship between APE1 induction by acidic bile salts and STAT3 activation in BE models. We detected an increase in STAT3 phosphorylation (p-STAT3Y705) that followed the same pattern as the induction of APE1, following exposure to acidic bile salts (Figure 1A). Consistent with these findings, we found a significant increase in STAT3 transcription activity (**p< 0.01), as measured by a luciferase reporter assay, following treatment with bile salts (Figure 1B). Taken together, these results demonstrate that acidic bile salts can significantly induce APE1 overexpression and activation of STAT3 (p-STAT3Y705). At the same time, these findings raised a question regarding the requirement of APE1 for STAT3 activation.
Figure 1. Acidic bile salts (pH4) induce APE1-dependent activation of STAT3 in BE and EAC cells.
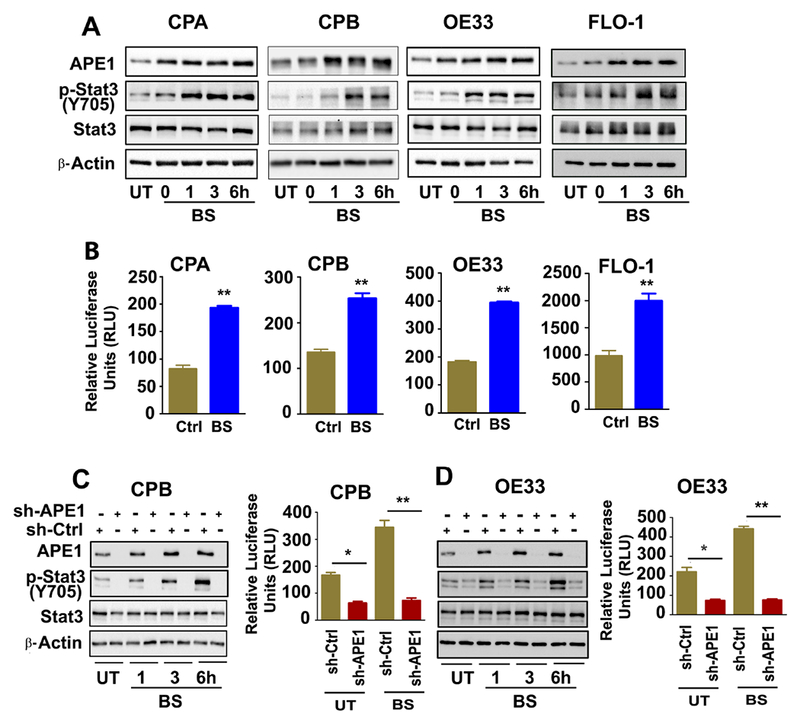
BE (CPA, CPB, A) and EAC (OE33, FLO-1, A) cells were treated with acidic bile salts (100 μM, pH4) for 20 minutes, followed by a recovery in complete media. The samples were collected at 0, 1, 3 and 6h after recovery and analyzed by western blotting for the indicated proteins, β- Actin was used as an internal control. The luciferase reporter assay for STAT3 transcriptional regulation was performed in BE (CPA, CPB, B) and EAC (OE33, FLO-1, B) cells transfected with STAT3-Luc-reporter plasmid followed by treatment with bile salts (100 μM) for 20 minutes. The samples were collected and read for the reporter activity at 6h post recovery. APE1 stable knockdown cells CPB-shAPE1 (C) and OE33-shAPE1 (D) cells, and their control cells (CPB-shCtrl and OE33-shCtrl) were treated with acidic (pH4) bile salts (100 μM) for 20 minutes, followed by a recovery in complete media. The samples were collected at 1, 3 and 6h after recovery and analyzed by western blotting for the indicated proteins, β- Actin was used as an internal control. The luciferase reporter assay for STAT3 transcriptional regulation was performed in CPB-shAPE1 (C), OE33-shAPE1 (D) cells and their control cells by treatment with bile salts (100 μM) for 20 minutes. The samples were collected for the reporter activity at 6h post recovery. The results are expressed as the mean ± SEM of three independent experiments. BS, Bile salts; UT, Untreated. *p<0.05, **p < 0.01 using one-way ANOVA.
To examine the involvement of APE1 in bile salts-induced STAT3 activation, we developed stable knockdown of APE1 in CPB and OE33 cells (sh-APE1), and control cells (sh-Ctrl). The cells were treated with acidic bile salts (100 μM, pH 4) for 30 min followed by recovery in complete media for 1, 3 or 6 hours post-treatment. We observed that APE1 knockdown in CPB and OE33 cells decreased basal levels of STAT3 phosphorylation (p-STAT3Y705) and completely abrogated the acidic bile salts-induced increase in phosphorylated STAT3, as compared to the control cells (sh-Ctrl) (Figures 1C and D). These results were confirmed in CPA cells where the levels of p-STAT3Y705 were significantly diminished by using transient siRNA-mediated knockdown of APE1 (Supplementary Figure S2A). Similarly, exposure to bile salts did not increase p-STAT3Y705 levels in sh-APE1 cells, whereas elevated p-STAT3Y705 was observed in sh-Ctrl cells (Supplementary Figure S2A). We then determined the impact of APE1 knockdown on the STAT3 transcriptional activity, by STAT3-Luc reporter assays in sh-Ctrl and sh-APE1 cells (CPB, OE33) with acidic bile salts treatment. APE1-knockdown significantly diminished basal levels of STAT3 transcriptional activity (p*< 0.05) and abrogated acidic bile salts-induced increase of STAT3 transcriptional activity, as compared to control (sh-Ctrl) cells (p**< 0.01) (Figure 1C and D). To further confirm the role of APE1 in regulating STAT3 activity, we developed stable Tet-on-APE1 FLO1 cells. There were significant increases in APE1 expression, followed by increased p-STAT3Y705 expression at 48 and 72h of doxycycline treatment (Supplementary S2B). Withdrawal of doxycycline for 72h (-Dox) resulted in restoration of APE1 and p-STAT3Y705 expression levels back to their baseline (Supplementary Figure S2C). The data collectively demonstrates that APE1 regulates basal STAT3 transcriptional activity and is required for acidic bile salt-induced STAT3 activation via phosphorylation.
APE1 facilitates acidic bile salts-induced STAT3 nuclear accumulation
We have previously shown nuclear and cytoplasmic overexpression of APE1 in Barrett’s dysplasia and EAC tissue samples.(34) Because chronic reflux of acidic bile salts into the lower esophagus is the main risk factor for EAC, we evaluated the effects of acidic bile salts on the expression and localization of APE1 and STAT3. Transient treatment with acidic bile salts (pH 4.0), that mimics a reflux episode, resulted in a remarkable increase in APE1 and p-STAT3 (p-STAT3Y705) levels (Figures 2A, B). We observed an increase in both cytosolic and nuclear APE1 with nuclear accumulation of p-STAT3 (p-STAT3Y705) (Figures 2A, B). To investigate whether APE1 is required for the acidic bile salt-induced nuclear accumulation of p-STAT3Y705, we used stable APE1 knockdown cells (sh-APE1) and control cells (sh-Ctrl) for immunofluorescent staining. Acidic bile salt treatment showed intense nuclear accumulation of APE1 and p-STAT3Y705 in the control cells (BS, sh-Ctrl), as compared to the untreated cells (UT, sh-Ctrl). Conversely, APE1-knockdown (sh-APE1) completely inhibited these changes (Figure 2C, D). We observed similar effects in dysplastic Barrett’s CPB (sh-Ctrl and sh-APE1) cells. Using 3D organotypic models and immunofluorescent staining, we confirmed that acidic bile salt exposure increases nuclear accumulation of APE1 and p-STAT3Y705 (Figure 2E), consistent with the 2D culture model (Figures 2C, D). Taken together, these results indicate that APE1 is required for acidic bile salts-induced nuclear accumulation of p-STAT3.Y705
Figure 2. APE1 drives acidic bile salts induced STAT3 nuclear accumulation in BE and EAC cells.
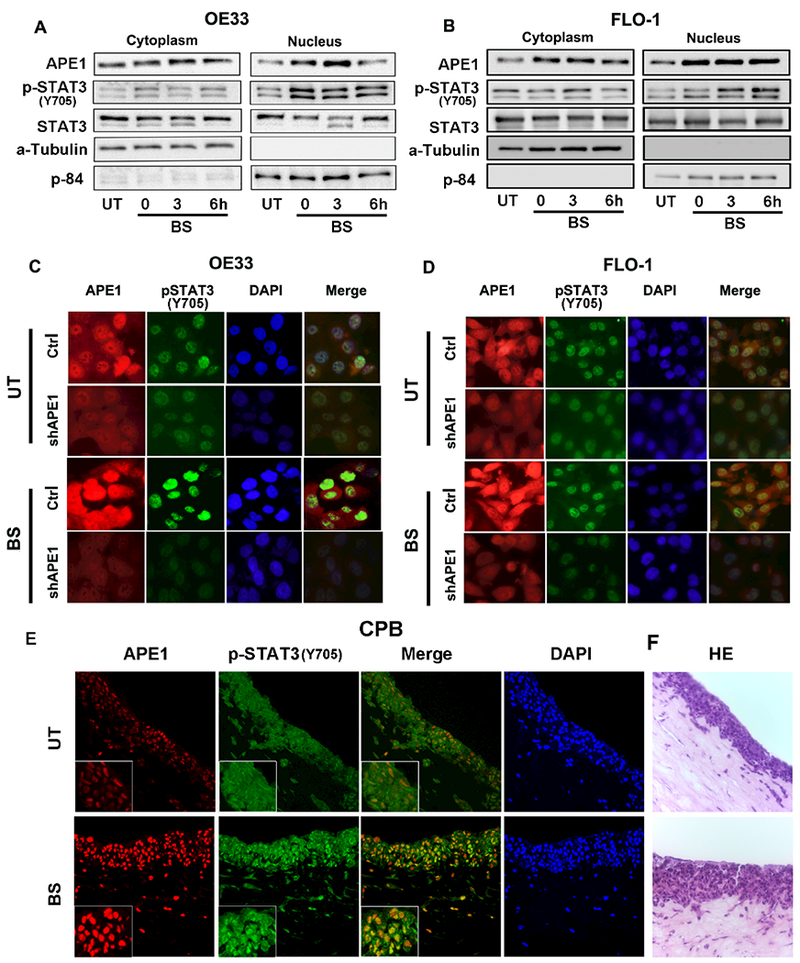
Immunoblot analysis of cytoplasmic and nuclear fractions of OE33 (A) and FLO-1 cells (B) treated with acidic (pH4) bile salts (100 μM) for 20 minutes, followed by a recovery in complete media. The samples were collected at 0, 3 and 6h post recovery. Alpha-tubulin represents a loading control for the cytoplasmic fraction, and p84 for the nuclear fraction. Immunofluorescent images of APE1 stable knockdown cells, OE33-shAPE1 (C) and FLO-1-shAPE1 (D), and their control cells (shCtrl) treated with acidic (pH4) bile salts (100 μM). Cells were stained for APE1 (red), pSTAT3 (green) and nuclei with DAPI (blue). (E) Immunocytochemistry staining of 3D organotypic culture with APE1 (red) and p-STAT3 (green) using immunofluorescence. (F) HE images of organotypic culture corresponding to the fluorescent images. Results shown are representative of at least three independent experiments.
APE1 redox function is required for transcriptional activation of STAT3
Our next step was to investigate whether the redox function of APE1 is required for the induction of STAT3 activity and elucidate the signaling mechanism. Using a FLAG-tagged adenoviral expression system (Ad) containing the wild-type (WT) or redox-defective (C65A) mutant of APE1, we found that Ad-APE1 (WT) increased the p-STAT3Y705 levels in CPB and OE33 cells, whereas the redox-defective mutant Ad-APE1 (C65A) failed to induce p-STAT3Y705 (Figures 3A-B). We also found that overexpression of Ad-APE1 (WT) increased the STAT3 transcriptional activity, as compared to control (Ad-Ctrl) (Figures 3C, D; **p<0.01), where exposure to bile salts further increased the STAT3 activity (p<0.001). In contrast, a similar response was not obtained upon overexpressing the redox-defective mutant Ad-APE1 (C65A) (Figures 3C, D). To further validate the role of the redox function of APE1 on STAT3 transcriptional activity, we used a small molecule inhibitor E3330, which selectively inhibits APE1 redox activity without affecting its endonuclease function.(36, 37) Treatment of CPB and OE33 cells with bile salts significantly (p< 0.01) increased STAT3 transcriptional activity, as compared to control (No Treatment, NT) (Supplementary Figure S3A and B). On the other hand, pretreatment of cells with E3330 significantly (p< 0.001) inhibited bile salts-induced STAT3 activity (Supplementary Figures S3A and B). These results altogether suggest that APE1 mediates activation of STAT3 via its redox regulatory function, following exposure to bile salts.
Figure 3. APE1 redox function is required for transcriptional activation of STAT3.
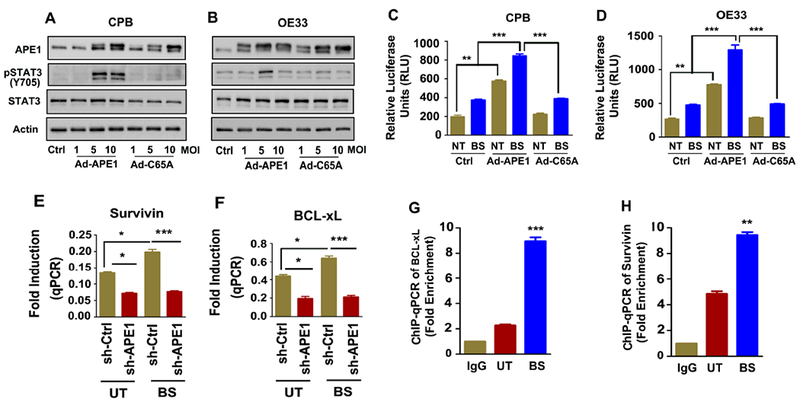
CPB (BE, A) and OE33 (EAC, B) cells were infected with Control (Ad-ctrl) or Flag-APE1 (WT or C65A) adenoviral expression vector and allowed expression for 48h. C65A is a redox defective mutant of APE1. The samples were analyzed by western blotting for the indicated proteins, β- Actin was used as an internal control. The luciferase reporter assay for STAT3 transcriptional activation was performed in CPB (C) and OE33 (D) cells infected with Control (Ad-ctrl) or Flag-APE1 (WT or C65A) and treated with acidic bile salts (100 μM) for 20 minutes. The samples were collected and read for the reporter activity at 6h post recovery. APE1 stable knockdown cells, OE33-shAPE1, and its’ control (-shCtrl) cells were treated with acidic (pH4) bile salts (100 μM) for 1h. Total RNA was isolated and expression of Survivin (E) and BCL-xL (F) were measured by qPCR. The affinities of STAT3 to the promoters of BCL-xL (G) and Survivin (H), were determined by ChIP assay. OE33 cells were treated with acidic (pH4) bile salts (100 μM) for 1h. IgG works as ChIP control. qPCR quantification was done by specific ChIP primers. Shown is signal in the immunoprecipitates expressed as a fold enrichment. The results are expressed as the mean ± SEM of three independent experiments. Ctrl; Ad-Ctrl, MOI; Multiplicity of infection, NT; No treatment; BS; Bile Salt. **p < 0.01, **p < 0.001 using one-way ANOVA.
Next we examined the mRNA expression of several STAT3 target genes (BCL2, IL-6, IL17A, c-MYC, Survivin and BCL-xL) in stable APE1 knockdown OE33 cells (sh-APE1) and control counterparts (sh-Ctrl), following exposure to acidic bile salts (100 μM, pH 4) for 30 min and subsequent recovery in complete media for 1h post-treatment to acidic bile salts (100 μM, pH 4). We detected a significant increase in mRNA expression for these genes after exposure to bile salts in the control cells. This elevation in mRNA levels was significantly decreased following APE1 knockdown (Figure 3E, F and Supplementary Figure S4A-D). To confirm the enhanced binding of STAT3 to its target genes, we performed chromatin immunoprecipitation (ChIP) for two genes, Survivin and BCL-xl as validation of our qPCR results. Indeed, we found that STAT3 was significantly recruited to the Survivin and BCL-xL promoters in APE1-expressing cells, upon acidic bile salts exposure (Figure 3G and H; p< 0.01, p<0.001). Altogether, these results indicated that acidic bile salts activate STAT3 and induce the expression of its downstream target genes, in an APE-l-dependent manner.
Bile salts-induced EGFR activation is mediated by APE1
Earlier studies have shown that EGFR plays a role in activation of STAT3.(38, 39) Although it has been reported that bile salts activate EGFR,(40, 41) the mechanisms underlying bile acid-induced EGFR activation in BE and EAC remain unclear. We found that exposure of CPA cells to acidic bile salts increased EGFR phosphorylation at Tyr1068 (Figure 4A). Furthermore, we detected a positive correlation between the levels of APE1, p-STAT3Y705, and p-EGFRY1068 (Figure 4A). Using Tet-on-APE1 CPA cells, the base line expression levels of APE1, p-EGFRY1068 and p-STAT3Y705 was low (Figure 4B). Following induction with doxycycline, there was a notable increase in expression of APE1 along with an increase in p-EGFRY1068 and p-STAT3.Y705 The strongest activation was observed at 48 and 72h of doxycycline treatment. Upon withdrawal of doxycycline for 72h, expression levels of APE1, p-EGFRY1068 and p-STAT3Y705 returned to baseline (Figure 4B), suggesting that APE1 levels play an important role in regulating both p-STAT3 and p-EGFR levels. Because of the observed induction of APE1 upon exposure to bile acids (Figure 1A), we aimed to further confirm its role by knocking down APE1 prior to exposure to acidic bile salts. APE1-knockdown (sh-APE1) abolished the activation of EGFR (Tyr1068) by acidic bile salts in CPB cells, as compared to control cells (sh-Ctrl) (Figure 4C). Similarly, subsequent activation of STAT3 was blocked by APE1-knockdown (Figure 4C). Protein levels of BCL-xL, a STAT3 downstream target gene, correlated with protein levels of APE1 (Figure 4C). Immunofluorescence analysis demonstrated an increase in nuclear APE1 and p-STAT3Y705 following exposure to acidic bile salts (Figure 4D). Previous studies reported nuclear localization of EGFR expression in aggressive tumor phenotypes.(42) We, therefore, investigated whether nuclear APE1 was closely linked to nuclear EGFR and whether this complex enhanced STAT3 transcriptional activation. Using 3D organotypic cultures of CPB cells, we detected co-localization of nuclear APE1 and EGFRY1068, but only after exposure to acidic bile salts (Figure 4E). Taken together, our results suggest that exposure to acidic bile salts promotes activation and nuclear localization of p-STAT3 and p-EGFR in an APE1-dependent manner.
Figure 4. Bile salts-induced EGFR activation is mediated by APE1.
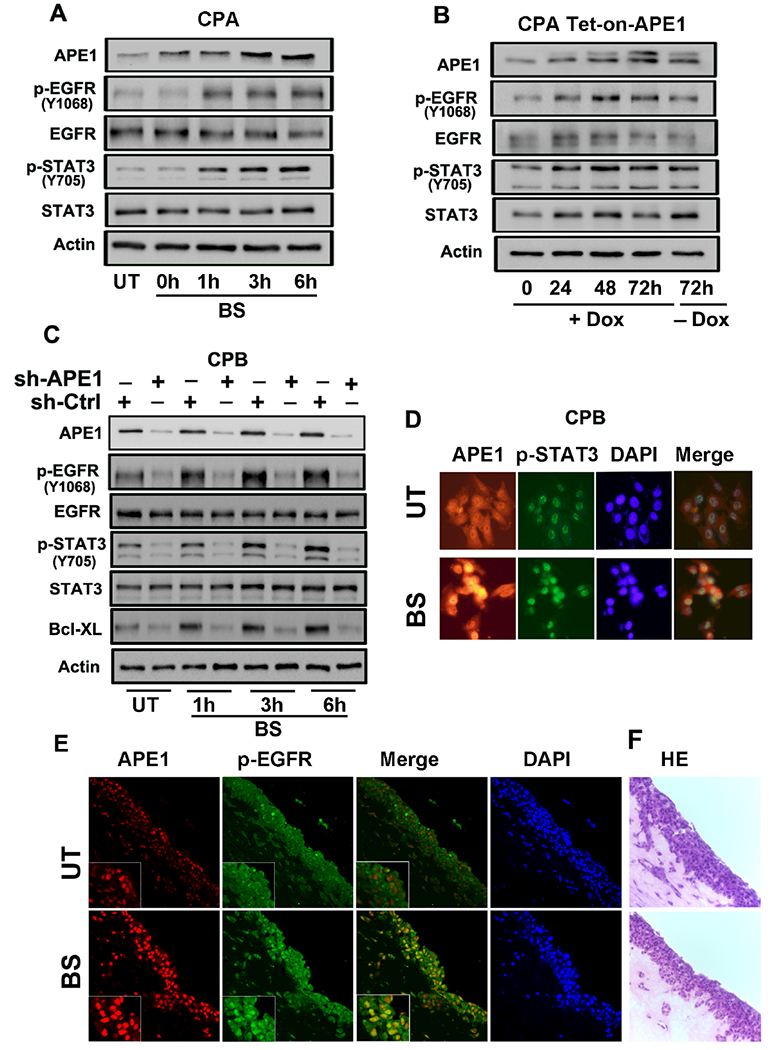
(A) Immunoblot analysis of CPA cells treated with acidic (pH4) bile salts (100 μM) for 20 minutes, followed by a recovery in complete media. The samples were collected at 0, 1, 3 and 6h post recovery. (B) Doxycycline-inducible APE1-Tet-on CPA stable cells were treated with 200ng/ml Doxycycline for 72h and removal of doxycycline for next 72h. The samples were collected at 0, 24, 48 and 72h and analyzed by immunoblotting for the indicated proteins. (C) APE1 knockdown cells CPB-shAPE1 and its control cells CPB-shCtrl were treated with acidic (pH4) bile salts (100 μM) for 20 minutes, followed by a recovery in complete media. The samples were collected at 1, 3 and 6h post recovery and analyzed by immunoblotting for the indicated proteins, β- Actin was used as an internal control. (D) Immunofluorescent images of CPB cells treated with acidic (pH4) bile salts (100 μM). Cells were stained for APE1 (red), pSTAT3 (green) and nuclei with DAPI (blue). (E) Immunocytochemistry staining of 3D organotypic culture with APE1 (red) and p-EGFR (green) using immunofluorescence. (F) H&E images of organotypic culture corresponding to the fluorescent images. Results shown are representative of at least three independent experiments.
APE1 mediates bile salts-induced STAT3 activation via an EGFR-dependent mechanism
We investigated whether EGFR mediates APE1-dependent activation of STAT3. Towards this end, we used gefitinib (25 μM) to inhibit EGFR in CPB, FLO-1 and OE33 cells, followed by exposure to acidic bile salts. Exposure to acidic bile salts induced APE1 expression, as expected, but failed to induce p-STAT3Y705 in cells treated with gefitinib (Figures 5A-C). To further validate the involvement of EGFR in APE1-mediated bile salts-induced STAT3 activation, we depleted EGFR by using small interfering RNA (siRNA) in OE33 cells. The results supported the gefitinib data by showing a lack of p-STAT3Y705 induction following exposure to acidic bile salts (Figure 5D), further supporting the role of the APE1-EGFR axis in mediating bile salts-induced phosphorylation and activation of STAT3.
Figure 5. APE1 mediates bile salts-induced STAT3 activation via an EGFR-dependent mechanism.
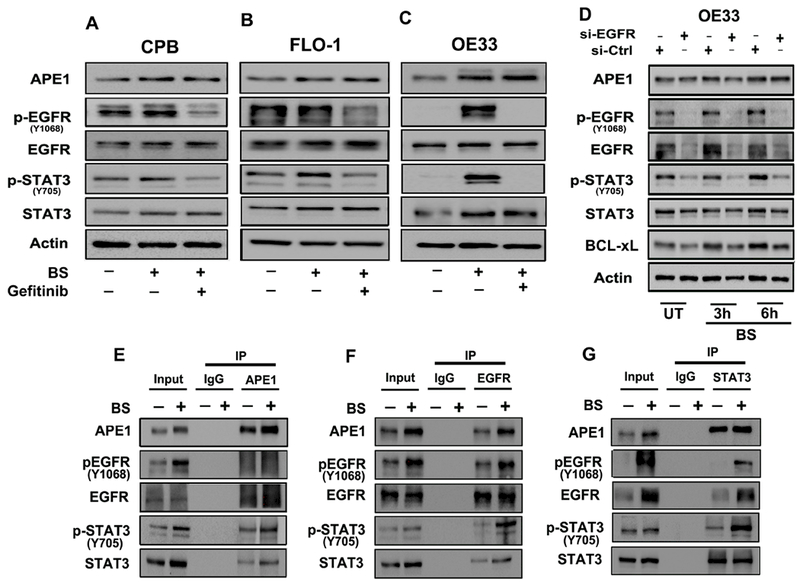
Immunoblot analysis of CPB (A), FLO-1 (B) and OE33 (C) cells pretreated with EGFR inhibitor (Gefitinib, 25 μM) followed by exposure to acidic (pH4) bile salts (100 μM). The samples were analyzed for the indicated proteins, β-actin was used as an internal control. (D) Immunoblot analysis of OE33 cells with EGFR-knockdown via EGFR siRNA followed by treatment with acidic (pH4) bile salts (100 μM) for 20 minutes and allowed to recover in complete media. The samples were collected at 3 and 6h post recovery and analyzed for the indicated proteins, β-actin was used as an internal control. Immunoprecipitation (IP) of APE1 (E), EGFR (F) and STAT3 (G) in OE33 cells treated with acidic (pH4) bile salts (100 μM) and immunoblotted for the indicated proteins. Results shown are representative of at least three independent experiments.
APE1 co-exists in complex with EGFR and STAT3
Our results have shown nuclear accumulation of APE1, p-EGFRY1068 and p-STAT3Y705 in response to bile salts exposure (Figures 2C-E and 4D-E). Reciprocal co-immunoprecipitation (co-IP) experiments followed by immunoblotting in bile salts-treated OE33 cells revealed co-precipitation of APE1, p-EGFR and p-STAT3 (Figures 5E, F and G). We observed a stronger interaction between APE1, p-EGFR and p-STAT3 in OE33 cells when treated with the bile salts, as compared to controlled untreated cells (Figures 5E, F and G). To validate the interaction between APE1, p-EGFR and p-STAT3, we used the Duolink in situ proximity ligation assay (PLA). Following treatment of OE33 cells with acidic bile salts, we detected a strong fluorescence signal (red dots) indicative of close proximity and interaction of APE1-p-EGFR (Figure 6A, upper panel), APE1-p-STAT3 (Figure 6B, lower panel bottom), and pSTAT3-pEGFR (Figure 6C, upper panel), as compared to untreated control cells (Figure 6A-C). These results affirm the close intracellular proximity of APE1 with the p-EGFR and p-STAT3.
Figure 6. APE1 co-localizes with EGFR and STAT3.
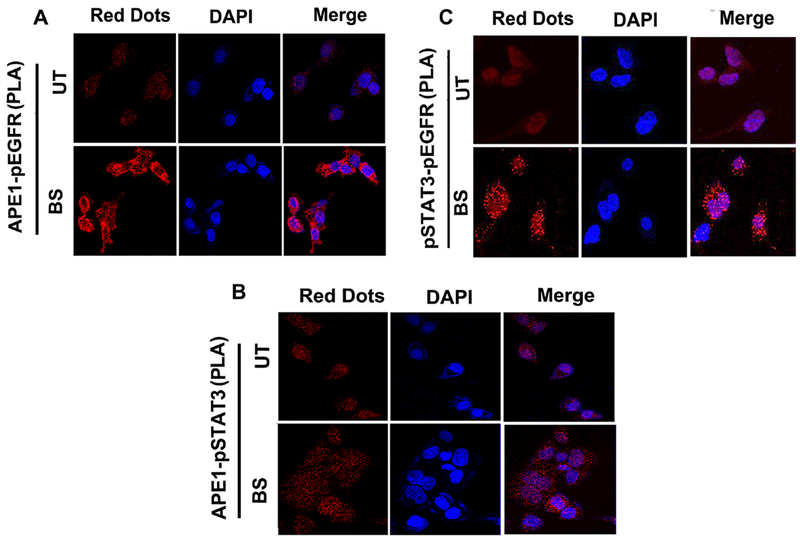
(A and B) In situ proximity ligation assay (PLA) demonstrates the interaction of p-EGFR and p-STAT3 with APE1. (C) In situ proximity ligation assay (PLA) demonstrates the interaction of p-EGFR and p-STAT3. Protein interactions (red fluorescent signals) were revealed by PLA anti-rabbit plus probe and PLA anti-mouse minus probe in OE33 cells treated with acidic (pH4) bile salts (100 μM) as mentioned in the materials and methods. Nuclei were stained with DAPI (blue). Results shown are representative of at least three independent experiments.
APE1 promotes cell viability and proliferation and suppresses apoptosis of BE and EAC cells
STAT3 plays a critical role in regulating cell survival in response to stress stimuli and harsh environmental conditions. Acidic bile salts produce significant cellular stress conditions that are lethal to cells in the absence of pro-survival mechanisms. By using the CellTiter-Glo luminescence-based viability assay, we found that the APE1 knockdown significantly decreased cell viability, a finding that is further exacerbated in response to acidic bile salts (Figure 7A-C; p<0.01, p<0.001). Using the TUNEL assay for cell apoptosis, we confirmed that APE1 knockdown increased the number of apoptotic cells in response to bile salts (Figure 7D). Using the Click-IT plus EdU for analyzing DNA replication in proliferating cells, we detected a significant reduction in the proliferative capacity, following knockdown of APE1 (Figure 7E). Taken together, these results indicate that APE1 plays an essential role in promoting cell survival and proliferation in response to acidic bile salts-induced cellular stress.
Figure 7. APE1 inhibition decreases cell viability, proliferation and enhances apoptosis in response to acidic bile salts.
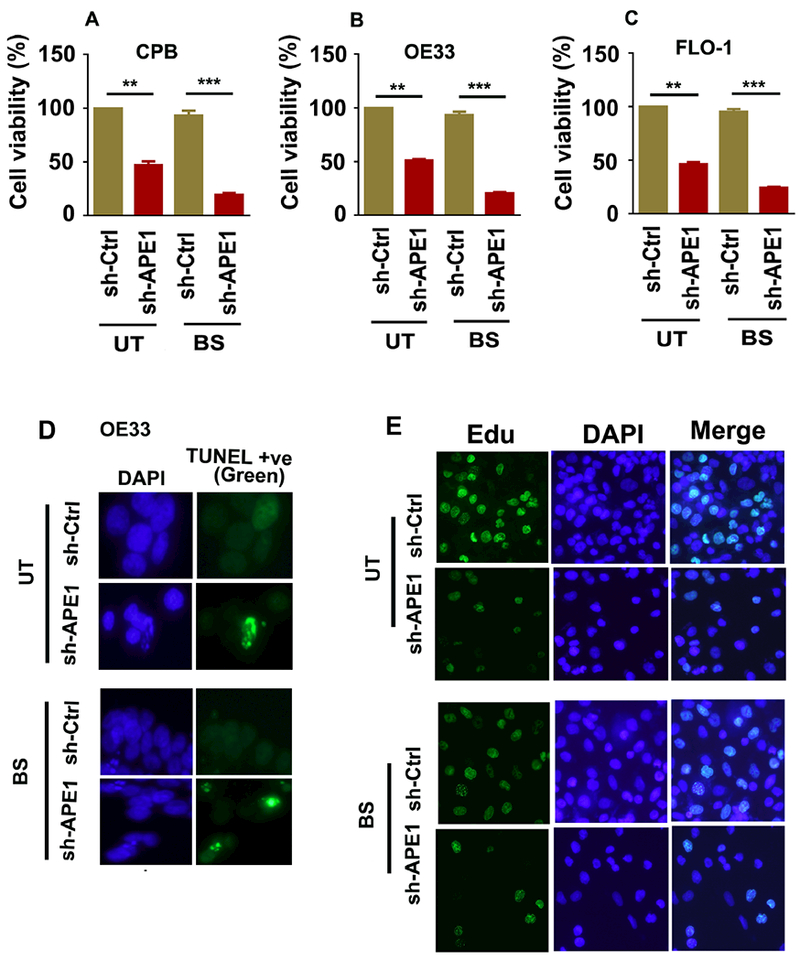
APE1-knockdown (shAPE1) in CPB, OE33 and FLO-1, and the control (shCtrl) cells were treated with acidic (pH4) bile salts (100μM) for 20 minutes, followed by a recovery in complete media. (A-C) The cell viability was measured by CellTiter-Glo assay in CPB (A), OE33 (B) and FLO-1 (C) cells at 24h post recovery. (D) The apoptosis was measured by a TUNEL assay in OE33 cells at 24h post recovery. (E) For cell proliferation, Edu cell proliferation assay was performed in OE33 cells. The results are expressed as the mean ± SEM of three independent experiments. BS, Bile salts; UT, Untreated. **p < 0.01, **p < 0.001 using one-way ANOVA.
DISCUSSION
Chronic gastro-esophageal reflux disease, where acidic bile salts abnormally refluxate from the stomach to the lower esophagus, is the main risk factor for the development of BE and its progression to EAC.(5–7) In this study, we demonstrate that repeated exposure to acidic bile salt, a major risk factor for BE and EAC, activates a novel molecular signaling axis comprising of APE1-EGFR-STAT3 in esophageal cells. We show that APE1 redox activity is essential for activation of the EGFR-STAT3 axis and demonstrate, for the first time, that APE1 forms a complex with EGFR and STAT3 upon exposure to acidic bile salts.
We have used a cocktail of acidic bile salts that mimics the mixture of bile acids to which the distal esophagus is exposed to during GERD.(8, 43, 44) The acidic bile salt cocktail used in our studies had a concentration in the physiologic range (100 μM) and for a short span of time (15–30 min) to mimic reflux episodes. Although total bile acid concentrations in the refluxate of BE patients are in the range 0.03 to 0.82 mmol/L(8), higher levels have been reported in the refluxate of some BE patients.(45) A number of earlier studies have shown that exposure of BE and EAC cells to acidic bile salts generates reactive oxygen species (ROS).(46–48) ROS levels are high in tissues with BE and EAC in both human(46) and animal models.(49) High levels of ROS and oxidative stress in response to exposure to acidic bile salts induce DNA damage in esophageal cells.(46, 50–52) Although, APE1 is involved in the regulation and repair of acidic bile salts-induced DNA damage in BE and EAC cells (34), the role of APE1 in regulating signaling pathways in response to acidic bile salts has remained largely unknown. In this study, we report that exposure of BE and EAC cells to acidic bile salts increases APE1 protein levels with a concomitant increase in STAT3 activation. The fact that earlier studies have shown activation of STAT3 in BE tissue(35) raised a question as to whether there is a causal relationship between APE1 expression and STAT3 activation in response to acidic bile salts.
We present several pieces of evidence showing that APE1 promotes STAT3 phosphorylation, nuclear localization, activation, and transcriptional target binding in response to acidic bile salts. Knockdown of APE1 abrogated activation of STAT3 and reduced expression of several pro-survival STAT3 transcription targets. APE1 is a reducing donor and its cysteine 65 (Cys65)-redox activity is essential to maintain reduced status on specific cysteine residues of several transcription factors. (16, 17) STAT3 DNA binding and transcriptional activity is decreased by oxidation of critical cysteine residues in STAT3 protein through peroxide treatment.(19, 53) Exposure to acidic bile salts induce high levels of ROS and create a harsh oxidative environment.(13, 46, 47, 54) We have verified that APE1 redox activity is required for activation of STAT3. Overexpression of a redox-deficient APE1 (C65A) failed to promote STAT3 transactivation. Similarly, blockade of the redox function of APE1 by using E3330 inhibitor, dramatically inhibited the bile salts-induced phosphorylation and transcriptional activity of STAT3. Collectively, our findings indicate that the APE-1 –STAT3 axis cooperates to inhibit acidic bile salts oxidative stress-induced apoptotic stresses.
Our study clearly indicated that APE1 is critical in mediating acidic bile salts-induced STAT3 activation in BE and EAC cells. STAT3 is a DNA-binding transcription factor known to mediate normal cellular processes upon activation by growth factors, ligands and cytoplasmic cytokines.(55, 56) EGFR has been reported directly to tyrosine phosphorylate STAT3.(57, 58) Activation of STAT3 can also require recruitment of the SRC kinase to the EGFR.(59, 60) Our findings demonstrate a close association between levels of APE1, p-STAT3, and p-EGFR, suggesting that EGFR is the signaling link between APE1 and STAT3 activation. Indeed, genetic knockdown and pharmacologic inhibition of EGFR abolished APE1-induced activation of STAT3 in response to acidic bile salts, indicating that EGFR mediates APE1-induced phosphorylation and activation of STAT3. This is likely an important step in carcinogenesis as EGFR is capable of maintaining persistent tumorigenic STAT3 activation, compared with IL-6-mediated STAT3 activation, which is rapid and transient.(61) EGFR cross-talk with STAT3 is not only through tyrosine-kinase mediated activation,(58, 62, 63) but also through nuclear cooperation through transcriptional cofactors.(64–66) We have shown that APE1, STAT3, and EGFR are co-localized in the nucleus, following exposure to acidic bile salts. Based on co-immunoprecipitation and proximity ligation assay results, these proteins are in close proximity and co-exist in the same protein complex. Based on our findings, it is likely APE1 controls two fundamental functions of EGFR, cytoplasmic signal transduction and nuclear accumulation.
We find that acidic bile salts induce upregulation of several STAT3 target genes in an APE1-dependent manner. These genes included BCL2, IL-6, IL-17A, c-MYC, Survivin and BCL-xL. They encode pro-inflammatory, pro-survival and anti-apoptotic functions that can promote carcinogenesis in several organs (67–70), and therefore they may participate in initiating BE or promoting its progression to EAC.(71, 72) We confirmed the role of APE1 in promoting STAT3 binding to Survivin and BCL-xL promoters in response to acidic bile salts. Of note, previous studies showed high levels of BCL-xL in BE.(73, 74) In this context, our results demonstrate a novel molecular mechanism explaining the role of APE1-EGFR-STAT3 axis in promoting pro-survival cellular mechanisms in response to reflux conditions in Barrett’s tumorigenesis and EAC.
In summary, our data suggests that episodic exposure to acidic bile salts mediates EGFR-STAT3 activation, cell survival and proliferation through redox-dependent activity of APE1. Activation of APE1-EGFR-STAT3 is a novel signaling axis that is tightly linked to the etiology of reflux-induced Barrett’s and EAC.
Materials & Methods
A summary of main methods is described below. Additional methods are provided in supplementary methods.
Antibodies and reagents
Antibodies against p-STAT3 (Y705), STAT3, p-EGFR (Y1068), EGFR, BCL-xL, Survivin, α – Tubulin were purchased from Cell Signaling Technology (Danvers, Massachusetts, USA). Anti-Stat3 (phospho Y705) antibody for immunohistochemistry (IHC) was purchased from Abcam (Cambridge, MA, USA). APE1 antibody was obtained from ThermoFisher Scientific (Waltham, MA, USA), c-MYC from Santa Cruz Biotechnology, Inc. (Dallas, TX, USA), Actin from Sigma-Aldrich (St. Louis, Missouri, USA) and p84 from Genetex (Irvine, CA, USA). The EGFR tyrosine kinase inhibitor, gefitinib, was purchased from LC laboratories (Woburn, MA). Transfection reagents (Polyjet and Lipojet) were purchased from SignaGen Laboratories (Rockville, MD). Control siRNA, EGFR siRNA and APE1 siRNA were obtained from Santa Cruz Biotechnology, Inc.
Acidic bile salts treatment
BE and EAC Cells were treated with an acidic bile salts cocktail consisting of an equimolar mixture of sodium salts of glycocholic acid, taurocholic acid, glycodeoxycholic acid, glycochenodeoxycholic acid, and deoxycholic acid. In all experiments, we used a final concentration of 100 μM of the bile salts cocktail (20 μM of each of the above bile salts) in either pH 4 or pH 7 medium. The acidic bile salts cocktail was prepared to mimic the mixture of bile acids in distal esophagus during gastroesophageal reflux disease, as reported earlier. (43) (11)
APE1 expression and expression vectors
The FLAG-tagged coding sequence of APE1 was cloned into pcDNA3.1 mammalian expression plasmid (Invitrogen, Carlsbad, CA USA). The APE1 coding sequence from pcDNA3.1/APE1 plasmid was sub-cloned using Xba I and BamH I restriction sites in the adenoviral shuttle vector pACCMV. The recombinant adenovirus expressing APE1 was generated by co-transfecting HEK-293 cells with the shuttle and backbone adenoviral pJM17 plasmids using a Calcium Phosphate Transfection kit (Applied Biological Materials Inc., Richmond, BC) (34). Lentivirus particles expressing APE1 shRNA or control shRNA were produced by VectorBuilder Inc. (Santa Clara, CA, USA) and then used to transduce OE33 and CPB cells. Control siRNA (sc-29470) and APE1 siRNA (sc-29470) were obtained from Santa Cruz Biotechnology.
3D Organotypic culture
3D organotypic cultures of CPB cells were performed as previously described.(75) Briefly, human esophageal fibroblasts (ScienCell, Carlsbad, CA USA) were seeded into a 3D matrix (75,000 cells/well) containing collagen I (High concentration rat-tail collagen, Corning) and Matrigel (BD Biosciences, Franklin Lakes, NJ USA) and incubated for 7 days at 37°C. Following incubation, CPB cells were seeded (500,000 cells/well) on top of the fibroblast matrix. Cultures were then allowed to grow for additional 7 days and treated with an acidic bile salts cocktail (100 μM, pH 4) for 30 min followed by recovery in complete media for the next 3h. Cells were harvested, fixed in 70% ethanol and processed for paraffin embedding, H&E staining and slide sectioning for immunocytochemistry.
Immunocytochemistry of 3D organotypic cell culture
Paraffin-embedded 3D culture slides were deparaffinized and rehydrated following standard protocols. Antigen retrieval was performed by boiling the slides in 1M Tris EDTA, pH8.0 for 10 min. Slides were allowed to cool down to room temperature before incubation in 5% BSA in PBS for 1 hour. Primary antibodies such as anti-APE1 (ThermoFisher Scientific, mouse monoclonal, #13B 8E5C2), anti-p-STAT3 (Y705) (Abcam, rabbit monoclonal, #ab76315) and anti-p-EGFR (Y1068) (Cell Signaling Technology, rabbit polyclonal, #2234) at a dilution of 1:200 were added to the slides and incubated over night at 4°C in a humidified chamber. The next day following incubation, the slides were washed with PBS and incubated with AlexaFluor conjugated anti-mouse or anti-rabbit secondary antibody (Fluor-488 or Fluor-586) for 1 hour at room temperature, protected from light. The slides were washed again with PBS and mounted with a Vectashield mounting medium with DAPI (Vector Laboratories). Images were captured with the Zeiss Confocal Microscope (Carl Zeiss LSM 880).
Cell fractionation
The cells were treated with acidic bile salts cocktail (100 μM, pH 4) for 30 minutes and then cultured in fresh complete media for 3 and 6h. Cell fractionation was performed according to the supplier’s protocol (NE-PER Nuclear and Cytoplasmic extraction kit, ThermoFisher Scientific). Briefly, the cells were trypsinized and then centrifuged at 500×g for 5 minutes. The supernatant was discarded and the cell pellet was suspended in an ice-cold CER I buffer followed by a CER II buffer. The tube was vortexed and centrifuged at 16,000g for 5 min. The cytoplasmic fraction was transferred to a new pre-chilled tube. The crude nuclear fraction pellet was suspended in ice-cold NER buffer and centrifuged at 16,000 g for 10 min. The supernatant (nuclear extract) was transferred to a new pre-chilled tube. The cytoplasmic and nuclear fractions were mixed with the 4× Laemmli sample buffer and electrophoresed using SDS-PAGE.
Chromatin Immunoprecipitation assay
Chromatin immunoprecipitation (ChIP) assay was performed using EZ-Magna ChIP A/G Kit from Merck Millipore (Billerica, Massachusetts, USA) following the manufacturer’s instructions. Briefly, the cells were seeded at 3 χ 106 cells per 100-mm dish 24h prior to treatment. Cells were treated with acidic bile salts (100 μM, pH4) for 1h. After treatment, the cells were fixed with formaldehyde (1% final concentration, Sigma-Aldrich) and then washed with cold PBS. The cells were collected in a cell lysis buffer, centrifuged and the pellet suspended in a nuclear lysis buffer. The resulting chromatin was sheared on ice for 10 cycles of 30 sec ON/30 sec OFF with the Bioruptor Pico (Diagenode, Denville, NJ, USA) to yield an average length between 200bp and lOOObp. The sheared cross-linked chromatin was diluted in the dilution buffer and incubated with the immunoprecipitating antibody (STAT3) and PureProteome Protein G magnetic beads (Millipore) overnight at 4°C with rotation. The protein/DNA complex was eluted and reverse cross-linked with the ChIP elution buffer by incubating at 62°C for 2h. The magnetic beads were separated using a magnetic separation device and the supernatant purified using the spin columns. The final eluate is purified DNA which was analyzed by quantitative real-time PCR for STAT3 binding to the promoter sequences of surviving and BCL-XL target genes. The primer sequences were Survivin-chIP-F:5′-CAGTGAGCTGAGATCATGCC-3′; Survivin-chIP-R:5′-TATTAGCCCTCCAGCCCCAC-3′ and BCL-xL-chIP-F:5′-AGGGTAAATGGCATGCATATTAA-3′; BCL-xL-R:5′-TTATAAFAGGGATGGGCTCAACCA –3′. The control primer mix for GAPDH was included in the kit. The qPCR data was calculated as fold enrichment.
Proximity Ligation Assay
In situ protein-protein interactions were detected using the Duolink in Situ proximity ligation assay (PLA) detection kit (Sigma-Aldrich) following the manufacturer’s instructions. Cells were cultured in 8-well chamber slides at a low density and treated with acidic bile salts (100 μM, pH4) for 1h. After treatment, the cells were washed in PBS and fixed with 4% paraformaldehyde buffer for 45 min at RT. Cells were then permeabilized in 0.5% Triton X-100 in PBS for 5 min at RT, blocked for 45 min at RT with gentle shaking and incubated overnight at 4°C with the two primary antibodies raised against the two proteins of interest, each from a different host species. The following primary antibodies (APE1, Mouse monoclonal, ThermoFisher Scientific; pSTAT3Y705, Rabbit Monoclonal, Abcam; pEGFR Y1068 , Mouse Monoclonal, Cell Signaling) were used. Hybridizations, ligations, washings, and detection steps followed the supplier’s protocol. After final washes in buffer B, cells were mounted using the Duolink in situ mounting medium with DAPI, sealed with nail polish, and allowed to dry for 15 min at RT before imaging using a Zeiss Confocal Fluorescence Microscope (Zeiss LSM 880).
Statistical Analysis
Biochemical experiments were repeated 3 times in at least two independent cell lines and conditions. Quantified results were expressed as mean ± SEM. Differences were analyzed by oneway ANOVA followed by the Bonferroni post-hoc test. All the statistical analyses were performed using GraphPad Prism, version 5.0 (GraphPad Software). P < 0.05 was considered statistically significant.
Supplementary Material
Acknowledgments
This study was supported by grants from the U.S. National Institutes of Health (R01CA206563) and the U.S. Department of Veterans affairs (1IK6BX003787 and I01BX001179). The content of this work is solely the responsibility of the authors and do not necessarily represent the official views of the Department of Veterans Affairs, National Institutes of Health, or the University of Miami.
Footnotes
Disclosure of Potential Conflicts of Interest: No potential conflicts of interest were disclosed
REFERENCES
- 1.Cook MB, Chow WH, Devesa SS. Oesophageal cancer incidence in the United States by race, sex, and histologic type, 1977-2005. Br J Cancer. 2009;101(5):855–9. [DOI] [PMC free article] [PubMed] [Google Scholar]
- 2.Eloubeidi MA, Mason AC, Desmond RA, El-Serag HB. Temporal trends (1973-1997) in survival of patients with esophageal adenocarcinoma in the United States: a glimmer of hope? Am J Gastroenterol. 2003;98(7):1627–33. [DOI] [PubMed] [Google Scholar]
- 3.Reid BJ, Li X, Galipeau PC, Vaughan TL. Barrett’s oesophagus and oesophageal adenocarcinoma: time for a new synthesis. Nat Rev Cancer. 2010;10(2):87–101. [DOI] [PMC free article] [PubMed] [Google Scholar]
- 4.Lagergren J. Adenocarcinoma of oesophagus: what exactly is the size of the problem and who is at risk? Gut. 2005;54 Suppl 1:i1–5. [DOI] [PMC free article] [PubMed] [Google Scholar]
- 5.Pera M, Manterola C, Vidal O, Grande L. Epidemiology of esophageal adenocarcinoma. J Surg Oncol. 2005;92(3):151–9. [DOI] [PubMed] [Google Scholar]
- 6.Sital RR, Kusters JG, De Rooij FW, Kuipers EJ, Siersema PD. Bile acids and Barrett’s oesophagus: a sine qua non or coincidence? Scand J Gastroenterol Suppl. 2006(243):11–7. [DOI] [PubMed] [Google Scholar]
- 7.Bernstein H, Bernstein C, Payne CM, Dvorak K. Bile acids as endogenous etiologic agents in gastrointestinal cancer. World J Gastroenterol. 2009;15(27):3329–40. [DOI] [PMC free article] [PubMed] [Google Scholar]
- 8.Nehra D, Howell P, Williams CP, Pye JK, Beynon J. Toxic bile acids in gastro-oesophageal reflux disease: influence of gastric acidity. Gut. 1999;44(5):598–602. [DOI] [PMC free article] [PubMed] [Google Scholar]
- 9.Bernstein H, Payne CM, Bernstein C, Schneider J, Beard SE, Crowley CL. Activation of the promoters of genes associated with DNA damage, oxidative stress, ER stress and protein malfolding by the bile salt, deoxycholate. Toxicol Lett. 1999;108(1):37–46. [DOI] [PubMed] [Google Scholar]
- 10.Sokol RJ, Winklhofer-Roob BM, Devereaux MW, McKim JM, Jr. Generation of hydroperoxides in isolated rat hepatocytes and hepatic mitochondria exposed to hydrophobic bile acids. Gastroenterology. 1995;109(4):1249–56. [DOI] [PubMed] [Google Scholar]
- 11.Peng DF, Hu TL, Soutto M, Belkhiri A, El-Rifai W. Glutathione Peroxidase 7 Suppresses Bile Salt-Induced Expression of Pro-Inflammatory Cytokines in Barrett’s Carcinogenesis. J Cancer. 2014;5(7):510–7. [DOI] [PMC free article] [PubMed] [Google Scholar]
- 12.Inayama M, Hashimoto N, Tokoro T, Shiozaki H. Involvement of oxidative stress in experimentally induced reflux esophagitis and esophageal cancer. Hepatogastroenterology. 2007;54(75):761–5. [PubMed] [Google Scholar]
- 13.Jenkins GJ, Cronin J, Alhamdani A, Rawat N, D’Souza F, Thomas T, et al. The bile acid deoxycholic acid has a non-linear dose response for DNA damage and possibly NF-kappaB activation in oesophageal cells, with a mechanism of action involving ROS. Mutagenesis. 2008;23(5):399–405. [DOI] [PubMed] [Google Scholar]
- 14.Fishel ML, Kelley MR. The DNA base excision repair protein Ape1/Ref-1 as a therapeutic and chemopreventive target. Mol Aspects Med. 2007;28(3-4):375–95. [DOI] [PubMed] [Google Scholar]
- 15.Tell G, Quadrifoglio F, Tiribelli C, Kelley MR. The many functions of APE1/Ref-1: not only a DNA repair enzyme. Antioxid Redox Signal. 2009;11(3):601–20. [DOI] [PMC free article] [PubMed] [Google Scholar]
- 16.Bhakat KK, Mantha AK, Mitra S. Transcriptional regulatory functions of mammalian AP-endonuclease (APE1/Ref-1), an essential multifunctional protein. Antioxid Redox Signal. 2009;11(3):621–38. [DOI] [PMC free article] [PubMed] [Google Scholar]
- 17.Tell G, Fantini D, Quadrifoglio F. Understanding different functions of mammalian AP endonuclease (APE1) as a promising tool for cancer treatment. Cell Mol Life Sci. 2010;67(21):3589–608. [DOI] [PMC free article] [PubMed] [Google Scholar]
- 18.Izumi T, Brown DB, Naidu CV, Bhakat KK, Macinnes MA, Saito H, et al. Two essential but distinct functions of the mammalian abasic endonuclease. Proc Natl Acad Sci U S A. 2005;102(16):5739–43. [DOI] [PMC free article] [PubMed] [Google Scholar]
- 19.Cardoso AA, Jiang Y, Luo M, Reed AM, Shahda S, He Y, et al. APE1/Ref-1 regulates STAT3 transcriptional activity and APE1/Ref-1-STAT3 dual-targeting effectively inhibits pancreatic cancer cell survival. PLoS One. 2012;7(10):e47462. [DOI] [PMC free article] [PubMed] [Google Scholar]
- 20.Fishel ML, Jiang Y, Rajeshkumar NV, Scandura G, Sinn AL, He Y, et al. Impact of APE1/Ref-1 redox inhibition on pancreatic tumor growth. Mol Cancer Ther. 2011;10(9):1698–708. [DOI] [PMC free article] [PubMed] [Google Scholar]
- 21.Di Maso V, Mediavilla MG, Vascotto C, Lupo F, Baccarani U, Avellini C, et al. Transcriptional Up-Regulation of APE1/Ref-1 in Hepatic Tumor: Role in Hepatocytes Resistance to Oxidative Stress and Apoptosis. PLoS One. 2015;10(12):e0143289. [DOI] [PMC free article] [PubMed] [Google Scholar]
- 22.Biswas A, Khanna S, Roy S, Pan X, Sen CK, Gordillo GM. Endothelial cell tumor growth is Ape/ref-1 dependent. Am J Physiol Cell Physiol. 2015;309(5):C296–307. [DOI] [PMC free article] [PubMed] [Google Scholar]
- 23.Yang Z, Yang S, Misner BJ, Liu-Smith F, Meyskens FL. The role of APE/Ref-1 signaling pathway in hepatocellular carcinoma progression. Int J Oncol. 2014;45(5):1820–8. [DOI] [PMC free article] [PubMed] [Google Scholar]
- 24.Thakur S, Sarkar B, Cholia RP, Gautam N, Dhiman M, Mantha AK. APE1/Ref-1 as an emerging therapeutic target for various human diseases: phytochemical modulation of its functions. Exp Mol Med. 2014;46:e106. [DOI] [PMC free article] [PubMed] [Google Scholar]
- 25.Kim JS, Kim JM, Liang ZL, Jang JY, Kim S, Huh GJ, et al. Prognostic significance of human apurinic/apyrimidinic endonuclease (APE/Ref-1) expression in rectal cancer treated with preoperative radiochemotherapy. Int J Radiat Oncol Biol Phys. 2012;82(1):130–7. [DOI] [PubMed] [Google Scholar]
- 26.Fishel ML, Colvin ES, Luo M, Kelley MR, Robertson KA. Inhibition of the redox function of APE1/Ref-1 in myeloid leukemia cell lines results in a hypersensitive response to retinoic acid-induced differentiation and apoptosis. Exp Hematol. 2010;38(12):1178–88. [DOI] [PMC free article] [PubMed] [Google Scholar]
- 27.Bobola MS, Finn LS, Ellenbogen RG, Geyer JR, Berger MS, Braga JM, et al. Apurinic/apyrimidinic endonuclease activity is associated with response to radiation and chemotherapy in medulloblastoma and primitive neuroectodermal tumors. Clin Cancer Res. 2005;11(20):7405–14. [DOI] [PubMed] [Google Scholar]
- 28.Han W, Lo HW. Landscape of EGFR signaling network in human cancers: biology and therapeutic response in relation to receptor subcellular locations. Cancer Lett. 2012;318(2):124–34. [DOI] [PMC free article] [PubMed] [Google Scholar]
- 29.Leaman DW, Pisharody S, Flickinger TW, Commane MA, Schlessinger J, Kerr IM, et al. Roles of JAKs in activation of STATs and stimulation of c-fos gene expression by epidermal growth factor. Mol Cell Biol. 1996;16(1):369–75. [DOI] [PMC free article] [PubMed] [Google Scholar]
- 30.Downward J, Parker P, Waterfield MD. Autophosphorylation sites on the epidermal growth factor receptor. Nature. 1984;311(5985):483–5. [DOI] [PubMed] [Google Scholar]
- 31.Oda K, Matsuoka Y, Funahashi A, Kitano H. A comprehensive pathway map of epidermal growth factor receptor signaling. Mol Syst Biol. 2005;1:2005 0010. [DOI] [PMC free article] [PubMed] [Google Scholar]
- 32.Yu H, Pardoll D, Jove R. STATs in cancer inflammation and immunity: a leading role for STAT3. Nat Rev Cancer. 2009;9(11):798–809. [DOI] [PMC free article] [PubMed] [Google Scholar]
- 33.Hoshino M, Fukui H, Ono Y, Sekikawa A, Ichikawa K, Tomita S, et al. Nuclear expression of phosphorylated EGFR is associated with poor prognosis of patients with esophageal squamous cell carcinoma. Pathobiology. 2007;74(1):15–21. [DOI] [PubMed] [Google Scholar]
- 34.Hong J, Chen Z, Peng D, Zaika A, Revetta F, Washington MK, et al. APE1-mediated DNA damage repair provides survival advantage for esophageal adenocarcinoma cells in response to acidic bile salts. Oncotarget. 2016;7(13):16688–702. [DOI] [PMC free article] [PubMed] [Google Scholar]
- 35.Dvorak K, Chavarria M, Payne CM, Ramsey L, Crowley-Weber C, Dvorakova B, et al. Activation of the interleukin-6/STAT3 antiapoptotic pathway in esophageal cells by bile acids and low pH: relevance to barrett’s esophagus. Clin Cancer Res. 2007;13(18 Pt 1):5305–13. [DOI] [PubMed] [Google Scholar]
- 36.Kelley MR, Luo M, Reed A, Su D, Delaplane S, Borch RF, et al. Functional analysis of novel analogues of E3330 that block the redox signaling activity of the multifunctional AP endonuclease/redox signaling enzyme APE1/Ref-1. Antioxid Redox Signal. 2011;14(8):1387–401. [DOI] [PMC free article] [PubMed] [Google Scholar]
- 37.Luo M, Delaplane S, Jiang A, Reed A, He Y, Fishel M, et al. Role of the multifunctional DNA repair and redox signaling protein Ape1/Ref-1 in cancer and endothelial cells: small-molecule inhibition of the redox function of Ape1. Antioxid Redox Signal. 2008;10(11):1853–67. [DOI] [PMC free article] [PubMed] [Google Scholar]
- 38.Chan KS, Carbajal S, Kiguchi K, Clifford J, Sano S, DiGiovanni J. Epidermal growth factor receptor-mediated activation of Stat3 during multistage skin carcinogenesis. Cancer Res. 2004;64(7):2382–9. [DOI] [PubMed] [Google Scholar]
- 39.Yu XT, Zhu SN, Xu ZD, Hu XQ, Zhu TF, Chen JQ, et al. Roles of EGFR-Stat3 signal pathway in carcinogenesis of experimental hepatoma in rats. J Cancer Res Clin Oncol. 2007;133(3):145–52. [DOI] [PMC free article] [PubMed] [Google Scholar]
- 40.Sommerfeld A, Reinehr R, Haussinger D. Bile acid-induced epidermal growth factor receptor activation in quiescent rat hepatic stellate cells can trigger both proliferation and apoptosis. J Biol Chem. 2009;284(33):22173–83. [DOI] [PMC free article] [PubMed] [Google Scholar]
- 41.Dossa AY, Escobar O, Golden J, Frey MR, Ford HR, Gayer CP. Bile acids regulate intestinal cell proliferation by modulating EGFR and FXR signaling. Am J Physiol Gastrointest Liver Physiol. 2016;310(2):G81–92. [DOI] [PMC free article] [PubMed] [Google Scholar]
- 42.Chua CY, Liu Y, Granberg KJ, Hu L, Haapasalo H, Annala MJ, et al. IGFBP2 potentiates nuclear EGFR-STAT3 signaling. Oncogene. 2016;35(6):738–47. [DOI] [PMC free article] [PubMed] [Google Scholar]
- 43.Kauer WK, Peters JH, DeMeester TR, Feussner H, Ireland AP, Stein HJ, et al. Composition and concentration of bile acid reflux into the esophagus of patients with gastroesophageal reflux disease. Surgery. 1997;122(5):874–81. [DOI] [PubMed] [Google Scholar]
- 44.Theisen J, Nehra D, Citron D, Johansson J, Hagen JA, Crookes PF, et al. Suppression of gastric acid secretion in patients with gastroesophageal reflux disease results in gastric bacterial overgrowth and deconjugation of bile acids. J Gastrointest Surg. 2000;4(1):50–4. [DOI] [PubMed] [Google Scholar]
- 45.Iftikhar SY, Ledingham S, Steele RJ, Evans DF, Lendrum K, Atkinson M, et al. Bile reflux in columnar-lined Barrett’s oesophagus. Ann R Coll Surg Engl. 1993;75(6):411–6. [PMC free article] [PubMed] [Google Scholar]
- 46.Dvorak K, Payne CM, Chavarria M, Ramsey L, Dvorakova B, Bernstein H, et al. Bile acids in combination with low pH induce oxidative stress and oxidative DNA damage: relevance to the pathogenesis of Barrett’s oesophagus. Gut. 2007;56(6):763–71. [DOI] [PMC free article] [PubMed] [Google Scholar]
- 47.Peng D, Belkhiri A, Hu T, Chaturvedi R, Asim M, Wilson KT, et al. Glutathione peroxidase 7 protects against oxidative DNA damage in oesophageal cells. Gut. 2012;61(9):1250–60. [DOI] [PMC free article] [PubMed] [Google Scholar]
- 48.Zhang HY, Hormi-Carver K, Zhang X, Spechler SJ, Souza RF. In benign Barrett’s epithelial cells, acid exposure generates reactive oxygen species that cause DNA double-strand breaks. Cancer Res. 2009;69(23):9083–9. [DOI] [PMC free article] [PubMed] [Google Scholar]
- 49.Lee JS, Oh TY, Ahn BO, Cho H, Kim WB, Kim YB, et al. Involvement of oxidative stress in experimentally induced reflux esophagitis and Barrett’s esophagus: clue for the chemoprevention of esophageal carcinoma by antioxidants. Mutat Res. 2001;480-481:189–200. [DOI] [PubMed] [Google Scholar]
- 50.Jolly AJ, Wild CP, Hardie LJ. Acid and bile salts induce DNA damage in human oesophageal cell lines. Mutagenesis. 2004;19(4):319–24. [DOI] [PubMed] [Google Scholar]
- 51.Zhang R, Gong J, Wang H, Wang L. Bile salts inhibit growth and induce apoptosis of culture human normal esophageal mucosal epithelial cells. World J Gastroenterol. 2005;11(41):6466–71. [DOI] [PMC free article] [PubMed] [Google Scholar]
- 52.Lechner S, Muller-Ladner U, Schlottmann K, Jung B, McClelland M, Ruschoff J, et al. Bile acids mimic oxidative stress induced upregulation of thioredoxin reductase in colon cancer cell lines. Carcinogenesis. 2002;23(8):1281–8. [DOI] [PubMed] [Google Scholar]
- 53.Li L, Cheung SH, Evans EL, Shaw PE. Modulation of gene expression and tumor cell growth by redox modification of STAT3. Cancer Res. 2010;70(20):8222–32. [DOI] [PubMed] [Google Scholar]
- 54.Farhadi A, Fields J, Banan A, Keshavarzian A. Reactive oxygen species: are they involved in the pathogenesis of GERD, Barrett’s esophagus, and the latter’s progression toward esophageal cancer? Am J Gastroenterol. 2002;97(1):22–6. [DOI] [PubMed] [Google Scholar]
- 55.Darnell JE, Jr. STATs and gene regulation. Science. 1997;277(5332):1630–5. [DOI] [PubMed] [Google Scholar]
- 56.Turkson J STAT proteins as novel targets for cancer drug discovery. Expert Opin Ther Targets. 2004;8(5):409–22. [DOI] [PubMed] [Google Scholar]
- 57.Garcia R, Bowman TL, Niu G, Yu H, Minton S, Muro-Cacho CA, et al. Constitutive activation of Stat3 by the Src and JAK tyrosine kinases participates in growth regulation of human breast carcinoma cells. Oncogene. 2001;20(20):2499–513. [DOI] [PubMed] [Google Scholar]
- 58.Park OK, Schaefer TS, Nathans D. In vitro activation of Stat3 by epidermal growth factor receptor kinase. Proc Natl Acad Sci U S A. 1996;93(24):13704–8. [DOI] [PMC free article] [PubMed] [Google Scholar]
- 59.Grandis JR, Drenning SD, Chakraborty A, Zhou MY, Zeng Q, Pitt AS, et al. Requirement of Stat3 but not Stat1 activation for epidermal growth factor receptor- mediated cell growth In vitro. J Clin Invest. 1998;102(7):1385–92. [DOI] [PMC free article] [PubMed] [Google Scholar]
- 60.Vigneron A, Gamelin E, Coqueret O. The EGFR-STAT3 oncogenic pathway up-regulates the Eme1 endonuclease to reduce DNA damage after topoisomerase I inhibition. Cancer Res.2008;68(3):815–25. [DOI] [PubMed] [Google Scholar]
- 61.Zhang F, Li L, Yang X, Wang B, Zhao J, Lu S, et al. Expression and activation of EGFR and STAT3 during the multistage carcinogenesis of intrahepatic cholangiocarcinoma induced by 3′-methyl-4 dimethylaminoazobenzene in rats. J Toxicol Pathol. 2015;28(2):79–87. [DOI] [PMC free article] [PubMed] [Google Scholar]
- 62.Shao H, Cheng HY, Cook RG, Tweardy DJ. Identification and characterization of signal transducer and activator of transcription 3 recruitment sites within the epidermal growth factor receptor. Cancer Res. 2003;63(14):3923–30. [PubMed] [Google Scholar]
- 63.Coffer PJ, Kruijer W. EGF receptor deletions define a region specifically mediating STAT transcription factor activation. Biochem Biophys Res Commun. 1995;210(1):74–81. [DOI] [PubMed] [Google Scholar]
- 64.Lo HW, Cao X, Zhu H, Ali-Osman F. Cyclooxygenase-2 is a novel transcriptional target of the nuclear EGFR-STAT3 and EGFRvIII-STAT3 signaling axes. Mol Cancer Res. 2010;8(2):232–45. [DOI] [PMC free article] [PubMed] [Google Scholar]
- 65.Lo HW, Hsu SC, Ali-Seyed M, Gunduz M, Xia W, Wei Y, et al. Nuclear interaction of EGFR and STAT3 in the activation of the iNOS/NO pathway. Cancer Cell. 2005;7(6):575–89. [DOI] [PubMed] [Google Scholar]
- 66.Jaganathan S, Yue P, Paladino DC, Bogdanovic J, Huo Q, Turkson J. A functional nuclear epidermal growth factor receptor, SRC and Stat3 heteromeric complex in pancreatic cancer cells. PLoS One. 2011;6(5):e19605. [DOI] [PMC free article] [PubMed] [Google Scholar] [Retracted]
- 67.Catlett-Falcone R, Landowski TH, Oshiro MM, Turkson J, Levitzki A, Savino R, et al. Constitutive activation of Stat3 signaling confers resistance to apoptosis in human U266 myeloma cells. Immunity. 1999;10(1):105–15. [DOI] [PubMed] [Google Scholar]
- 68.Gritsko T, Williams A, Turkson J, Kaneko S, Bowman T, Huang M, et al. Persistent activation of stat3 signaling induces survivin gene expression and confers resistance to apoptosis in human breast cancer cells. Clin Cancer Res. 2006;12(1):11–9. [DOI] [PubMed] [Google Scholar]
- 69.Coussens LM, Werb Z. Inflammation and cancer. Nature. 2002;420(6917):860–7. [DOI] [PMC free article] [PubMed] [Google Scholar]
- 70.Karin M. Nuclear factor-kappaB in cancer development and progression. Nature. 2006;441(7092):431–6. [DOI] [PubMed] [Google Scholar]
- 71.Picardo SL, Maher SG, O’Sullivan JN, Reynolds JV. Barrett’s to oesophageal cancer sequence: a model of inflammatory-driven upper gastrointestinal cancer. Dig Surg. 2012;29(3):251–60. [DOI] [PubMed] [Google Scholar]
- 72.Poehlmann A, Kuester D, Malfertheiner P, Guenther T, Roessner A. Inflammation and Barrett’s carcinogenesis. Pathol Res Pract. 2012;208(5):269–80. [DOI] [PubMed] [Google Scholar]
- 73.Abdel-Latif MM, O’Riordan J, Windle HJ, Carton E, Ravi N, Kelleher D, et al. NF-kappaB activation in esophageal adenocarcinoma: relationship to Barrett’s metaplasia, survival, and response to neoadjuvant chemoradiotherapy. Ann Surg. 2004;239(4):491–500. [DOI] [PMC free article] [PubMed] [Google Scholar]
- 74.Dvorakova K, Payne CM, Ramsey L, Holubec H, Sampliner R, Dominguez J, et al. Increased expression and secretion of interleukin-6 in patients with Barrett’s esophagus. Clin Cancer Res. 2004;10(6):2020–8. [DOI] [PubMed] [Google Scholar]
- 75.Le Bras GF, Loomans HA, Taylor CJ, Revetta FL, Andl CD. Activin A balance regulates epithelial invasiveness and tumorigenesis. Lab Invest. 2014;94(10):1134–46. [DOI] [PMC free article] [PubMed] [Google Scholar]
Associated Data
This section collects any data citations, data availability statements, or supplementary materials included in this article.