

Abstract
The development of novel miniaturized wireless and wearable functional Near-Infrared Spectroscopy (fNIRS) devices have paved the way to new functional brain imaging that can revolutionize the cognitive research fields. Over the past few decades, several studies have been conducted with conventional fNIRS systems that have demonstrated the suitability of this technology for a wide variety of populations and applications, to investigate both the healthy brain and the diseased brain. However, what makes wearable fNIRS even more appealing is its capability to allow measurements in everyday life scenarios that are not possible with other gold-standard neuroimaging modalities, such as functional Magnetic Resonance Imaging. This can have a huge impact on the way we explore the neural bases and mechanisms underpinning human brain functioning. The aim of this review is to provide an overview of studies conducted with wearable fNIRS in naturalistic settings in the field of cognitive neuroscience. In addition, we present the challenges associated with the use of wearable fNIRS in unrestrained contexts, discussing solutions that will allow accurate inference of functional brain activity. Finally, we provide an overview of the future perspectives in cognitive neuroscience that we believe would benefit the most by using wearable fNIRS.
Keywords: fNIRS, wearable, ecological, cognitive neuroscience
Understanding and identifying the relationships between human behaviour and cognitive processes represented the main goal of cognitive neuroscientists over the past century. Historically, neuropsychological assessments were conducted investigating the effect of task manipulations on participants’ performance and behavioural variables (e.g., response times, accuracy, etc.), with cognitive models built on the basis of the outcome of the cognitive tests. Neuropsychological tests were - and still are - often used as a support for diagnostic purposes, e.g. for the early detection of cognitive disabilities such as Alzheimer’s (Spooner & Pachana, 2006). However, there is not always a univocal correspondence between a certain stimulus and behaviour, and behavioural variables might not be enough in characterizing some cognitive functions (Poldrack, 2006).
Nowadays, the field of cognitive neuroscience concerns itself with mapping information processing models of the mind onto the structural and operational (e.g., electrical, metabolic, hemodynamic) features of the brain. This has been enabled by neuroimaging technologies currently available to neuroscientists, such as neurovascular-based techniques (i.e., functional magnetic resonance imaging (fMRI), functional near-infrared spectroscopy (fNIRS), positron-emission-tomography (PET)), and electromagnetic techniques (i.e., electroencephalography (EEG) and magnetoencephalography (MEG)).
In classical neuroimaging investigations, participants are required to undertake a timely rigid constructed experimental procedure involving one or many different types of stimuli that intend to elicit a behaviour that can be associated with particular brain regions. Often, the experimental paradigm used to elicit the mental processing (e.g., showing a long series of single words one at a time) does not require the participant to be engaged in a mental task that is very similar to one that would typically be encountered in everyday life. Indeed, as neuroimaging is done within the tight constraints of the neuroimaging laboratory and instrument, everyday life behaviour cannot be exactly replicated. For example, interactions with other people (including physical ones), and complex integrative tasks such as serial multitasking where a person is swapping between very different tasks such as cooking or shopping (Burgess, 2015). These situations are hard to mimic in e.g. an fMRI scanner. In fact, fMRI as well as PET and MEG impose significant physical constraints, given the fact that measurements are taken with participants restrained in a scanner. Moreover, all these techniques are highly susceptible to motion artifacts and/or cannot be brought outside the lab, thus not being suitable for use on freely-moving subjects and in everyday life.
These issues limit the questions that can be asked, and raise the question of the ecological validity (i.e., the degree to which the task performance predicts the real-world behaviour (Burgess et al., 2006)) of the results. For these reasons, a neuroimaging method which can be used while people perform almost any activity that they would in everyday life, especially over lengthy durations, opens up the possibility of asking very different scientific questions, especially exploratory ones. Moreover, the method can, if used appropriately, decrease the possibility of an error of scientific inference in mapping mind to brain.
A solution for monitoring the neural correlates of daily life activities can be achieved by wearable fNIRS devices. fNIRS is one of the most recent neuroimaging technique and, over the past few decades, it has rapidly grown to become an invaluable and powerful tool for neuroscientists and clinicians to monitor changes in brain tissue oxygenation and hemodynamic (Boas, Elwell, Ferrari & Taga, 2014). fNIRS utilises near-infrared (NIR) light (650-1000 nm) to measure the concentration changes of oxygenated (HbO2) and deoxygenated (HbR) haemoglobin, taking advantage of the different absorption spectra of the two chromophores in the NIR wavelength range. When a brain region becomes metabolically active, there is an oversupply of cerebral blood flow (CBF) to meet the increase in oxygen demand; this is reflected by an increase in ΔHbO2 and a decrease in ΔHbR (i.e., the hemodynamic response) and is an indicator of functional brain activity (Scholkmann et al., 2014). fNIRS measurements are performed by placing a certain number of NIR light sources, shining light into the brain, and optical detectors, collecting the back-scattered light, onto the participants’ head. The transmitted and the back-scattered light are usually guided through fibre optics connected to the main recording unit of the fNIRS system.
Most of the conventional fNIRS instruments are quite heavy and big in size, and need carts to be transported (Scholkmann et al., 2014). Thanks to the recent technological advancements, more portable and miniaturized fNIRS devices were developed. This new generation of wearable devices allow participants to freely and naturally move in the environment without tight physical restraints. These systems are battery-powered, wearable, and data can be either stored on the wearable recording unit or transmitted wirelessly to a laptop. Wireless EEG solutions were proposed as well for use in outdoor environments and on freely-moving individuals (Debener, Minow, Emkes, Gandras, & Vos, 2012; Mihajlović, Grundlehner, Vullers, & Penders, 2015). EEG can provide measurement of neural activity with a higher temporal resolution than fNIRS (~ms versus ~tens of ms) so it might be more suitable for monitoring neural responses to fast processes and stimuli happening in everyday scenarios. However, EEG is more susceptible to motion artifacts than fNIRS, and thus people’s movements walking in the real-world must be limited. Therefore, fNIRS might be a better option when a wider range of movements are needed and a higher spatial localization of brain activity is required (fNIRS spatial resolution ~2-3 cm versus EEG ~5-9 cm).
The availability of this novel fNIRS technology, paves the way to new neuroscientific investigations that can now be performed in more naturalistic and ecologically-valid settings, with people free to walk and interact with the environment as they would do in real-life. The aim of this review is to give an overview of the studies performed so far with wearable fNIRS devices in the field of cognitive neuroscience in more naturalistic situations. In this framework, we also aim at discussing (a) the challenges associated with the use of fNIRS on freely moving people, focusing on the analysis approaches and limitations, (b) provide recommendations for successful use of the technology in naturalistic situations, and (c) discuss the possible future directions.
Overview of Wearable fNIRS Systems
The last decade has seen a trend towards the development of miniaturized and wearable fNIRS devices. Such systems are based on the continuous-wave (CW) NIRS technology (Scholkmann et al., 2014), and overcome the issues and restrictions related to bulky fibre optic bundles, usually by having LEDs directly coupled to the head and flexible headbands holding sources and detectors. In addition, these instruments are battery operated, being more portable and allowing measurements in everyday life scenarios with minimal restraints; data are usually stored in the device itself or sent to a PC through wireless communication.
Concerning the number of channels, this depends on the number of sources and detectors the device is equipped with. A channel is composed by one source and one detector, and represents the measurement point, i.e., the investigated brain tissue volume located at half of the source-detector distance and at a depth of around half the source-detector distance (Patil, Safaie, Moghaddam, Wallois, & Grebe, 2011). The first wearable system implementing wireless telemetry was limited by the number of optodes (i.e., light source or detector), having one detector and one light source, resulting in one measurement channel, and permitting the monitoring of very limited brain regions (Hoshi & Chen, 2002; Shiga, Yamamoto, Tanabe, Nakase, & Chance, 1997). Significant progress was made subsequently, and more sophisticated devices were developed and validated, with a higher number of channels (e.g., 16 (Ayaz et al., 2013), 20 (Piper et al., 2014), 22 (Atsumori et al., 2009), 32 (Muehlemann, Haensse, & Wolf, 2008)) to meet the need for higher head coverage for different functional investigations. For example, one of the first portable optical brain imagers (Chance, Luo, Nioka, Alsop, & Detre, 1997) was improved and extended from one to 16 channels (4 LEDs light sources and 10 detectors; sampling frequency=2 Hz) at Drexel University (Ayaz et al., 2013), allowing now the monitoring of both dorsal and inferior frontal cortical areas. Additionally, the palm-sized wireless system described by Muehlemann, Haensse, and Wolf (2008) can measure up to 32 channels at a sampling frequency of 100 Hz (Muehlemann et al., 2008). Channels configuration and number can be easily adapted on individual’s needs using systems with modular optodes (Funane et al., 2017; Chitnis et al., 2016a). More recently, multi-distance, eight- and four-wavelength systems were implemented (Chitnis et al., 2016b; Wyser, Lambercy, Scholkmann, Wolf, & Gassert, 2017), permitting the monitoring of changes in both brain hemodynamics (ΔHbO2, ΔHbR) and metabolism (oxidized cytochrome-c-oxidase (ΔoxCCO)), at different depths, and with a scalable number of channels, thanks to the modular optodes design (Wyser et al., 2017). In addition, the availability of short-separation channels in the system presented by Wyser et al. (2017) improves the signals’ quality by automatically removing the influence of systemic physiological changes originating at the more superficial layers of the head (Tachtisdis & Sholkmann, 2016; Wyser et al., 2017). Wearable solutions integrating simultaneous EEG and fNIRS measurements were proposed as well (Lareau et al., 2011; Safaie, Grebe, Moghaddam, & Wallois, 2013), taking advantage of the suitability of fNIRS for multimodal imaging. However, to date, in order to minimize the power consumption and have a miniaturized and light wearable device that functions for long time periods, the number of channels is still limited when compared to conventional fNIRS instruments that can reach whole head coverage.
From 2009, several companies began to commercialize wearable and wireless fNIRS devices. The systems available so far in the market were reviewed by Quaresima and Ferrari (2016) (NOTE: in addition to the list provided by the authors, a newer system, the Brite23, has been recently introduced by Artinis, Netherlands, with 23 channels, a maximum sampling rate of 100 Hz, wireless data transmission and possible hyperscanning configuration). In Table 1, we expanded the information provided by Quaresima and Ferrari (2016) with additional details on the available systems (Quaresima & Ferrari, 2016).
Table 1.
Overview of the features of the commercially available wireless and wearable fNIRS systems (adapted from Quaresima and Ferrari (2016)).
| Device | Company, Country | Probed brain region | Fibreless | Wavelengths | SD separation |
|---|---|---|---|---|---|
| Brite23 | Artinis, The Netherlands | Whole PFC | 760, 850 nm | 35 mm | |
| OctaMon | Artinis, The Netherlands | PFC | 760, 850 nm | 35 mm (26 mm for babies) | |
| PortaLite | Artinis, The Netherlands | Custom | 760, 850 nm | 30, 35, 40 mm | |
| Hb-13N | Astem, Japan | PFC | X | 770, 830 nm | 2, 4, 20, 30 mm(spatially resolved) |
| Pocket NIRS HM | Dynasense Inc., Japan | PFC | X | 735, 810, 850 nm | 30 mm |
| fNIRS Imager 1200M | fNIRS Devices LLC., USA | PFC | X | 730, 850 nm | 2.5 mm |
| WOT-100 | Hitachi, Japan | PFC | X | 705, 830 nm | 30 mm |
| WOT-220 | Hitachi, Japan | PFC | X | 705, 830 nm | 30 mm |
| WOT-HS | Hitachi, Japan | PFC | X | 705, 830 nm | 21.2, 30 mm |
| HOT-1000 | Hitachi, Japan | PFC | X | 810 nm | 10, 30 mm |
| Genie | MRRA Inc., USA | INF | INF | 700, 850 nm | DOT |
| NIRSport | NIRx Medical Technologies, LLC, USA | Custom | 760, 850 nm | Custom | |
| NIRSIT | Obelab, Korea | PFC | X | 780, 850 nm | 15, 21.2, 30, 33.5 |
| LIGHTNIRS | Shimadzu, Japan | Custom | 780, 805, 830 nm | 30 mm | |
| SPEEDNIRS | Shimadzu, Japan | Custom | 780, 805, 830 nm | 30 mm | |
| OEG-16 | Spectratech Inc., Japan | PFC | X | 770, 840 nm | 30 mm |
| OEG-16 ME | Spectratech Inc., Japan | PFC | X | 770, 840 nm | 30 mm |
| OEG-17APD | Spectratech Inc., Japan | Custom | 770, 840 nm | 30 mm | |
| OEG-SpO2 | Spectratech Inc., Japan | PFC | X | 770, 840 nm | 30 mm |
| Techen Wireless | TechEn Inc., USA | INF | INF | INF | INF |
Note. Abbreviations: SD= source-detector; PFC = Prefrontal cortex; DOT = Diffuse optical tomography; INF= Information not found.
Twenty devices are currently commercially available, with different number of channels (from 1 to 496) and sampling frequencies (1-100 Hz). The majority of them implement wireless data transmission and allow the synchronization of multiple devices (up to 7) for hyperscanning measurements (i.e., simultaneous recording of brain activity of two or more individuals (Babiloni & Astolfi, 2014)). High-density (i.e., more dense set of source-detector pairs (Eggebrecht et al., 2012)) optical tomography systems for the prefrontal cortex are available as well, with 204 and 496 channels (Quaresima & Ferrari, 2016), that allows the performance of diffuse optical tomography (DOT) measurements. DOT configurations involve the use of multiple source-detector distances resulting in overlapping channels that allows researchers to sample tomographical maps of HbO2 and HbR and to gather several measurements at different depths, which improves the lateral and depth resolution (Eggbrecht et al., 2012, Zhao & Cooper, 2017). Most of the instruments are designed for measuring only the prefrontal cortex (Table 1), mainly to maximize the functioning duration of the system, and the optical components are usually connected to a small processing and recording/transmitting unit holding the battery, usually carried through a backpack (Figure 1).
Figure 1.
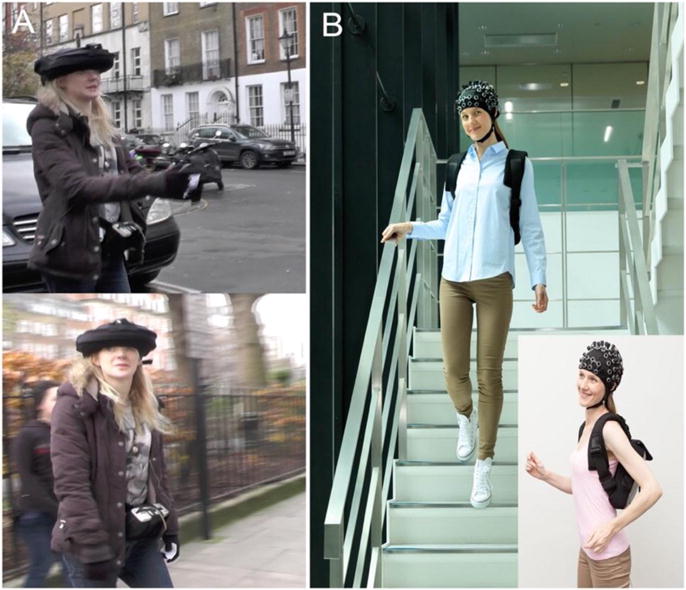
Examples of wireless and wearable fNIRS devices in unrestrained situations. Panel A shows a fibreless system (WOT-100, Hitachi, Japan) monitoring the prefrontal cortex outside the lab. A black cap is used to prevent detectors saturation. In panel B, a wearable device equipped with fibres (LIGHTNIRS, Shimadzu, Japan) measuring over the motor cortices is presented, where wires are connected to the control unit carried through a backpack (Photo courtesy of Shimadzu, Japan).
Most instruments have fixed source-detector separations, typically 3 cm for adult studies. Two DOT systems are available and allow measurement of brain activity at different depths, while two systems permit the adjustment of source-detector separations with custom configurations. The majority of the instruments use two wavelengths to resolve oxy- and deoxy- haemoglobin concentrations, except the Pocket NIRS HM from Dynasense and the SPEEDNIRS and LIGHTNIRS from Shimadzu that use three-wavelengths to account for the scattering, and the WOT-100 from Hitachi, which uses only one wavelength to resolve total-haemoglobin. Eleven of the available systems are completely fibreless and optical components are directly coupled to the head (Table 1; see Figure 1 A for an example); the others use shorter and lighter wires than conventional fNIRS systems to guide the light that are connected to the control unit (see Figure 1 B for an example), still allowing for free movement. To prevent detector saturations in case of outdoor use, shading caps are available (Figure 1 A); alternatively, some devices implement a reference detector measuring the ambient light that is used to correct for stray light.
Literature Review
A literature review of research articles using wearable fNIRS devices in more ecologically-valid cognitive experiments was carried out in order to identify the most common applications of wireless fNIRS in the field of cognitive neuroscience so far, and to set the starting point for our discussions and future directions. More precisely, we focused on the studies employing the new class of wearable and/or wireless devices in unrestrained contexts with freely-moving participants while undertaking a cognitive task. The search procedure was performed using the PubMed database, manual search from articles references and the publication surveys available on the Society for functional Near Infrared Spectroscopy website (http://fnirs.org/publications/nirs-niri-publications/). For database searching, we used the keywords functional near-infrared spectroscopy, fNIRS, wireless, portable, wearable, and brain. Articles were selected on the basis of the following inclusion criteria:
Original research papers published on peer-reviewed journals until September 2017. Review papers and conference proceedings were excluded.
Papers involving task-evoked functional activity experiments with a cognitive task performed on freely moving participants and not in a typical laboratory setup (usually, seated and interacting with a computer only).
Articles employing wearable fNIRS devices to measure brain activity in response to cognitive tasks. Papers using conventional fNIRS instrumentation were excluded.
In case of multiple cognitive tasks examined within the same paper, only the ones involving the use of wearable fNIRS devices, and with freely-moving subjects were considered. Ten original research papers were included in the present review. Following the procedure adopted by Herold et al. (2017), from articles’ full-texts we collected information concerning the application of wireless fNIRS (e.g., population, and experimental protocol), the pre-processing, and the statistical analysis of fNIRS data. In the following sections, we present the approaches adopted in the reviewed studies with additional details, providing an overview of the application of wearable fNIRS (Table 2), and data acquisition (Table 3), data pre-processing (Table 4) and statistical inference (Table 5).
Table 2.
Summary of the populations investigated in the reviewed articles and overview of the experimental protocols.
| First author | Population (n= number of participants; age in years ± SD) | Experimental protocol | ||
|---|---|---|---|---|
| Behavioural task | Conditions | Study design Number of blocks; block duration |
||
| Atsumori et al. 2010 | - Healthy young adults (n=6; 29.7 ± 3.3) | - NW - DTW + attention demanding task |
- Rest - Control (NW) - Task |
- 1 block; 20 s. - 6 blocks; 10 s. - 5 blocks; 10 s. |
| Balardin et al. 2017 | - Healthy young adults (n=1; 30) | - Playing table tennis |
- Rest - Forehand - Predictable - Unpredictable |
- 10 blocks; 30 s. - 10 blocks; 20 s. - 10 blocks; 20 s. - 10 blocks; 20 s. |
| - Healthy young adults (n=1; 26) | - Continuous monitoring in everyday life | - Everyday life activities | - Continuous; 4 h. | |
| Doi et al. 2013 | - MCI old adults (n=16; 75.4 ± 7.2) | - NW - DTW + verbal letter fluency task |
- Pre-task rest - Task - Rest |
- 3 blocks; 10 s. - 3 blocks; 20 s. - 3 blocks; 30 s. |
| Maidan et al. 2016 | - Old adults with Parkinson’s Disease (n=68; 71.6 ± 0.9); - Healthy old adults (n=28; 70.4 ± 0.9) | - NW - DTW + serial subtraction - DTW + negotiating obstacles |
- Rest - Task |
- 5 blocks; 20 s. - 5 blocks; 30 s. |
| McKendrick et al. 2016 | - Healthy young adults (n=20; 18-29) | - DTW + auditory 1 -back task - DTW + scenery probe |
- Rest - Task |
- 47 blocks; minimum 15 s. - 37 blocks; 60 s. - 10 blocks; 30 s. |
| McKendrick et al. 2017 | - Healthy young adults (n=13; mean=22; range 19-31) | - Sitting + auditory 1- back task - DTW indoor + auditory 1-back task - DTW outdoor + auditory 1-back task |
- Task | - 4 blocks; 120 s. - 2 blocks: 120 s. - 2 blocks, 120 s. |
| Mirelaman et al. 2014 | - Healthy young adults (n=23; 30.9 ± 3.7) | - NW - DTW + counting forward - DTW + serial subtraction - Standing + serial subtraction |
- Rest - Task |
- 6 blocks; 20 s. - 5 blocks; 30 s/30 m. |
| Nieuwhof et al. 2016 | - Old adults with Parkinson’s Disease (n=12; 70.1 ± 5.4) | - DTW + counting forward - DTW + serial subtraction - DTW + reciting digit span |
- Rest - Task |
- 6 blocks; 20 s. - 5 blocks; 40 s. |
| Pinti et al. 2015 | - Healthy young adults (n=1; 24) | - DTW + ongoing task - DTW + PM |
- Rest - Ongoing task - Non-social PM task - Social PM task |
- 2 blocks; 60 s. - 2 blocks; ~5 min. - 1 block; ~5 min. - 1 block; ~5 min. |
| Takeuchi et al. 2016 | - Healthy young adults (n=16; 25.9 ± 4.4) - Healthy old adults (n=15; 71.7 ± 3.3) | - DTW + playing Touch the numbers | - Rest - Task |
- 6 blocks; 30 s. - 15 blocks; 10 s. |
Note. Abbreviations: NW = Normal walking; DTW = Dual-task walking; MCI = Mild cognitive impairment; PM = Prospective memory.
Table 3.
Summary of the fNIRS devices and data acquisition features.
| First author | fNIRS data acquisition | ||||
|---|---|---|---|---|---|
| Wavelengths | Number of channels | Source-detector separation | Cortical brain region | Sampling frequency | |
| Atsumori et al. 2010 | - 754 and 830 nm | - 22 | - 30 mm | - PFC | - 5 Hz |
| Balardin et al., 2017 | - 760 and 850 nm | - 23 - 22 |
- 30 mm | - PFC - supplementary motor and primary motor cortex |
- 7.81 Hz |
| Doi et al. 2013 | - 770 and 840 nm | - 16 | - 30 mm | - PFC | - 1.54 Hz |
| Maidan et al. 2016 | - 760 and 850 nm | - 6 | - 30, 35, 40 mm | - PFC | - 10 Hz |
| McKendrick et al. 2016 | - 730 and 850 nm | - 4 | - Not reported | - PFC | - 4 Hz |
| McKendrick et al. 2017 | - 730 and 850 nm | - 4 | - Not reported | - PFC | - 4 Hz |
| Mirelaman et al. 2014 | - 760 and 850 nm | - 6 | - Not reported | - PFC | - 10 Hz |
| Nieuwhof et al. 2016 | - 760 and 850 nm | - 6 | - 30, 35, 40 mm | - PFC | - 10 Hz |
| Pinti et al. 2015 | - 705 and 830 nm | - 16 | - 30 mm | - PFC | - 5 Hz |
| Takeuchi et al. 2016 | - 705 and 830 nm | - 16 | - 30 mm | - PFC | - 5 Hz |
Note. Abbreviations: PFC = Prefrontal cortex.
Table 4.
Summary of the steps adopted for the fNIRS data pre-processing.
| First author | fNIRS data pre-processing | |||
|---|---|---|---|---|
| DPF | Motion artifact correction | Filtering | Additional steps | |
| Atsumori et al. 2010 | - N/A | - Not performed | - Not performed | - Baseline correction |
| Balardin et al., 2017 | - Not reported | - Not performed | - BP filter [0.01 0.2] Hz | - Down-sampling to 1 Hz |
| Doi et al. 2013 | - Not reported | - Not performed | - LP filter 0.05 Hz | - Baseline correction |
| Maidan et al. 2016 | - Not reported | - Wavelet-based | - BP filter [0.01 0.14] Hz | - CBSI; Baseline correction |
| McKendrick et al. 2016 | - Not reported | - Not performed | - LP FIR filter, 20th order, 0.1 Hz | - Baseline correction |
| McKendrick et al. 2017 | - Not reported | - Not performed | - LP FIR filter, 20th order, 0.1 Hz | - Baseline correction |
| Mirelaman et al. 2014 | - Not reported | - Not performed | - LP FIR filter, 0.14 Hz | - Baseline correction |
| Nieuwhof et al. 2016 | - Constant (6.0) | - MARA | - LP Butterworth filter, 0.1 Hz | - Baseline correction |
| Pinti et al. 2015 | - N/A | - Wavelet-based | - BP Butterworth filter, 3rd order, [0.008 0.2] Hz | - Down-sampling to 1 Hz; CBSI |
| Takeuchi et al. 2016 | - N/A | - Not performed | - Moving average - BP filter [0.01 0.5] Hz |
- Baseline correction |
Note. Abbreviations: DPF = differential path length factor; BP = Band-pass; LP = low-pass; CBSI = correlation-based signal improvement; FIR = finite impulse response; MARA = movement artifact reduction algorithm.
Table 5.
Overview of the analysis of fNIRS data.
| First author | fNIRS analysis | ||
|---|---|---|---|
| Method | Activation parameter | Time used for the analysis | |
| Atsumori et al. 2010 | - Averaging + t-test | - HbO2 and HbR | - 6 – 32 s after the start of the task |
| Balardin et al. 2017 | - GLM + t-test - CWT |
- HbO2 | - Entire task block - 1 min |
| Doi et al. 2013 | - Averaging + t-test | - HbO2 | - Entire task block |
| Maidan et al. 2016 | - Averaging + Linear mixed model | - HbO2 | - Entire task block |
| McKendrick et al. 2016 | - Averaging + Generalized and linear mixed model | - HbO2 and HbR | - Entire task block |
| McKendrick et al. 2017 | - Averaging + Generalized and linear mixed model | - HbO2 and HbR | - Entire task block |
| Mirelaman et al. 2014 | - Averaging + RM ANOVA - CWT |
- HbO2 | - Entire task block |
| Nieuwhof et al. 2016 | - Averaging + Wilcoxon signed-rank test | - HbO2 and HbR | - Entire task block |
| Pinti et al. 2015 | - N/A | - HbO2 and HbR | - Entire task period |
| Takeuchi et al. 2016 | - Averaging + ANOVA | - HbO2 | - Entire task block |
Note. Abbreviations: GLM = General linear model; CWT = Continuous wavelet transform; RM ANOVA = Repeated measures analysis of variance analysis.
Population and Experimental Protocol
The majority of the studies (Table 2) included in the present review were performed on a cohort of healthy young adults (Atsumori et al., 2010; Balardin et al., 2017; McKendrick et al., 2016; McKendrick, Mehta, Ayaz, Scheldrup, & Parasuraman, 2017; Mirelaman et al., 2014; Pinti et al., 2015; Takeuchi, Mori, Suzukamo, Tanaka, & Izumi, 2016) and two on healthy older adults (Maidan et al., 2016; Takeuchi et al., 2016). Two papers examined individuals with neurological deficits such as Parkinson’s Disease (Maidan et al., 2016; Nieuwhof et al., 2016), and one included individuals with mild cognitive impairments (Doi et al., 2013).
All the studies examined in this review (Table 2) involved a motor-cognitive dual-task walking (DTW) protocol, in which participants were asked to perform a secondary cognitive task while walking. For instance, in the study of Atsumori et al. (2010), the secondary task was an attention demanding task (ball-carrying) that was carried out while walking (Atsumori et al., 2010). Other cognitive tasks employed in addition to walking involved serial subtractions (Maidan et al, 2016; Mirelaman et al., 2014; Nieuwhof et al., 2016), counting forward (Mirelaman et al., 2014; Nieuwhof et al., 2016), reciting a series of digits (digit span (Nieuwhof et al., 2016), a verbal letter fluency task (Doi et al., 2013) and playing a game on a smartphone (Takeuchi et al., 2016). A table tennis task was used by Balardin et al. (2017) to investigate the feasibility of wearable and wireless fNIRS in case of moderate levels of motion (Balardin et al., 2017). Whilst the above-mentioned studies were performed in indoor environments, more interestingly four studies (Balardin et al., 2017; McKendrick et al., 2016; McKendrick et al., 2017; Pinti et al., 2015) were carried out outside in everyday life contexts. Balardin et al. (2017) monitored changes in prefrontal cortex activity during the execution of everyday life actions (Balardin et al., 2017). The study by McKendrick et al. (2016) aimed at investigating situation awareness and mental workload on people during navigation of a college campus using a hand-held display, or an augmented reality wearable display while simultaneously performing a visual perception or an auditory 1-back task (McKendrick et al., 2016). More recently, the auditory 1-back was repeated on participants while sitting, walking indoor and walking outdoor around a busy college campus (McKendrick et al., 2017). Pinti et al. (2015) investigated the neural correlates of a prospective memory (PM) task conducted in the streets of London on freely-moving subjects with no particular restrictions and no preparation of the environment (Pinti et al., 2015).
Typical block design experiments (i.e., conditions are repeated over time and spaced out by rest periods) are usually employed except for the papers by Pinti et al. (2015) and Balardin et al. (2017), where continuous monitoring with minimum task repetitions were adopted (Balardin et al., 2017; Pinti et al., 2015). For instance, in Pinti et al. (2015) conditions were repeated twice while in most neuroscience experimental investigations blocks and events are repeated multiple times (e.g., 10 or more). This was done to mimic real-life situations as much as possible and to have more ecologically-valid cognitive tasks (Pinti et al., 2015). Rest periods are usually represented by normal walking (NW, i.e., walking with no secondary task) conditions (Atsumori et al., 2010; McKendrick et al., 2016; Pinti et al., 2015; Takeuchi et al., 2016), standing while performing a secondary task (Pinti et al., 2015) or standing still (Balardin et al., 2017; Doi et al., 2013; Maidan et al., 2016; McKendrick et al., 2017; Mirelaman et al., 2014; Nieuwhof et al., 2016).
Data Acquisition
Cortical hemodynamic responses (Table 3) were usually investigated over the pre-frontal cortex (PFC) since this region is easily accessible, and most of the commercially available system allows the monitoring of only frontal regions (Atsumori et al., 2010; Doi et al., 2013; Maidan et al., 2016; McKendrick et al., 2016; McKendrick et al., 2017; Mirelaman et al., 2014; Nieuwhof et al., 2016; Pinti et al., 2015; Takeuchi et al., 2016). In one study, supplementary motor and primary motor cortex were probed instead during a table tennis task (Balardin et al., 2017).
Data Pre-processing
The pre-processing of fNIRS data is a crucial step as the results of statistical analyses strongly rely on the quality of the data. It is thus extremely important to reduce the impact of physiological noises, motion artifacts and slow drifts present in the fNIRS signals. Table 4 summarizes the details of the pre-processing steps adopted in the reviewed studies to de-noise fNIRS data.
Data Analysis
The presence of functional activation in the investigated brain regions was statistically assessed (Tak & Ye, 2014) in most of the studies (Table 5) using the averaging method, i.e. averaging signal segments across task and rest periods, and inferring functional brain activity on the basis of the difference between task and rest mean values (Atsumori et al., 2010; Doi et al., 2013; Maidan et al., 2016; McKendrick et al., 2016; McKendrick et al., 2017; Mirelaman et al., 2014; Nieuwhof et al., 2016; Takeuchi et al., 2016).
One paper adopted the General Linear Model (GLM) approach instead, i.e. fitting the fNIRS data with task-related regressors modelling the theoretical hemodynamic response to the assigned cognitive task (Balardin et al., 2017). Continuous Wavelet Transform (CWT) was used in 2 articles to investigate the functional connectivity between brain regions (Balardin et al., 2017; Mirelaman et al., 2014).
Challenges and Way Forward
When recording fNIRS data in unrestrained contexts and on mobile people, there are some methodological issues that need to be considered and addressed. In this section, we discuss and summarize the technology limitations (Table 6), providing some suggestions to overcome these issues, and to get meaningful fNIRS data and results.
Table 6.
Summary of the challenges associated with using fNIRS in naturalistic settings and recommended solutions.
| Challenge | Solution | |
|---|---|---|
| Body movements | Motion artifacts | Correct through: - Wavelet-based filtering - tPCA |
| Optical decoupling | - Properly secure the fNIRS probes to the head | |
| Sunlight/Detector saturation | - Protecting caps - Device with ambient light detector |
|
| Signals’ quality deterioration/Channels inclusion criteria | - Visual inspection of signals - Exclude channels without heart rate oscillations - Exclude channels with CV>15% - Exclude non-measuring channels (e.g. flat lines) |
|
| Systemic changes | - Include longer rest periods (e.g., 2 min) - Band-pass filtering (NOTE: this removes some of the physiological noises, e.g. heart rate and respiration, but it is not effective in removing task-evoked systemic changes) - Measure additional physiological signals - Monitor participants’ movements (accelerometer or GPS) - Report results of ΔHbO2 and ΔHbR |
|
| Statistical inference/Unstructured protocols | - Apply AIDE | |
Note. Abbreviations: tPCA = targeted principal component analysis; SNR = Signal-to-noise ration; CV = coefficient of variation.
Body Movements
In order to arrive at a correct neuroscientific conclusion, it is necessary to record good quality fNIRS data. However, the signals’ quality can be deteriorated by several factors.
If we consider recording neuroimaging data on freely moving people, the first concern relates to the execution of body and head movements. In fact, although fNIRS is more tolerant to movements, and wearable devices are miniaturized and even more robust than conventional fNIRS instruments, motion artifacts are more likely to occur when participants are walking rather than sitting on a chair, as they are allowed to move freely and perform a wider range of movements. For example, motion errors can corrupt fNIRS signals with shifts from baseline values (Figure 2 A, green shaded areas) or fast and narrow spikes (Brigadoi et al., 2014), characterized by a positive correlation between HbO2 and HbR (Figure 2 A, yellow shaded areas).
Figure 2.
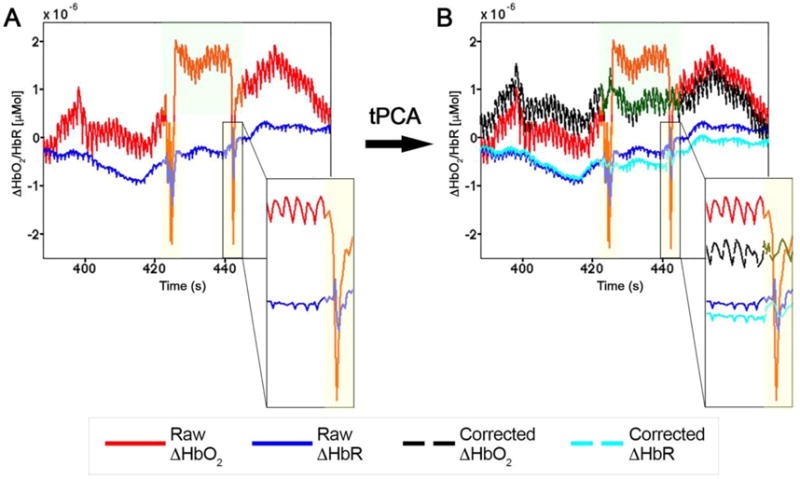
Example of motion artifacts in raw fNIRS signals (A) as shifts from baseline values (green shaded areas) and fast spikes (yellow shaded areas), where HbO2 and HbR are correlated. Panel B shows the effect of the application of the tPCA approach for the correction of motion errors. HbO2 and HbR become anti-correlated after being properly corrected. Data refer to the study by Pinti et al., 2015.
To date, several methods are available to identify and correct for motion artifacts (Scholkmann, Spichtig, Muehlemann, & Wolf, 2010), and were reviewed by Brigadoi et al. (2014) (Brigadoi et al., 2014). Among these, the wavelet-based (Molavi & Dumonts, 2012) and the targeted principal component analysis (tPCA) approaches (Yücel, Selb, Cooper, & Boas, 2014) appeared to be the most effective. In Figure 2 B, we show the effectiveness of tPCA to correct both baseline shifts (green shaded areas) and higher-frequency spikes (yellow shaded areas). In the latter, the physiological anti-correlation between HbO2 and HbR typical of functional activity (Obrig et al., 2000) is effectively restored.
Only 3 of the reviewed papers included the correction of motion errors. Since correcting for such artifacts was demonstrated to be better than rejecting corrupted trials (Brigadoi et al., 2014), we suggest employing one of the available correction techniques, and especially the wavelet-based filtering or tPCA (Table 6), as part of the pre-processing flow. Head movements can also lead to a loss of coupling between the optodes and the head that further deteriorates signals’ quality. In case of poor optical coupling, no physiological signals are sampled and time-series are only constituted of white-noise (Figure 3 A), characterized by a constant power spectral density (PSD). The fNIRS probes thus have to be securely attached to the head, with good contact with the skin.
Figure 3.
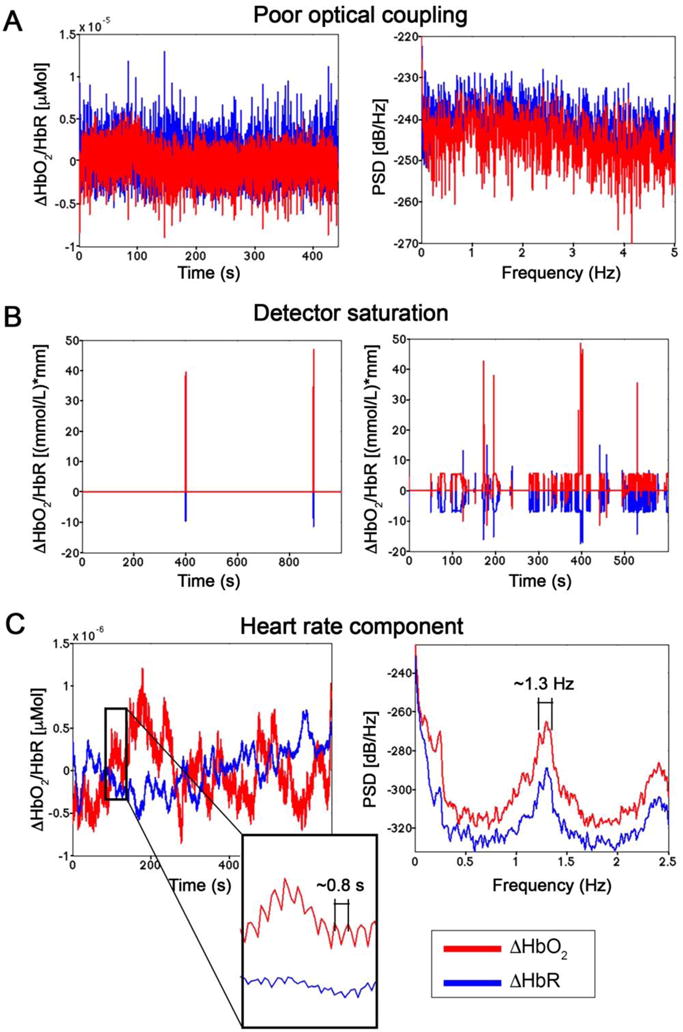
Example ΔHbO2 and ΔHbR in absence of a good coupling between the optodes and the head (A). This is reflected by the presence of only white noise, with a constant PSD. Data were in-house collected on the visual cortex using the Hitachi ETG-4000 during the presentation of a flashing checkerboard. In panel B, examples of channels corrupted by sunlight are shown, with consequent detector saturation. Data refer to the study by Pinti et al., 2015. The quality of fNIRS data can be assessed evaluating the presence of heart beat oscillations (C), visible both in the time- and in the frequency-domain. Data correspond to resting-state signals in-house recorded over the PFC using the Hitachi WOT-system.
In addition, when using fNIRS in outdoor environments, optical detectors should be protected from the stray sunlight. In this case, the detectors will be overexposed and measured intensity signals will appear as flat lines or be full of spikes with non-physiological amplitudes (Figure 3 B). Detector overexposure and saturation can be prevented using light-shielding caps/hats (Figure 1 A; McKendrick et al., 2016, 2017; Pinti et al., 2015) or detectors with very high dynamic range or using fNIRS devices that incorporate a reference detector measuring only the ambient light that is then subtracted from the other channels’ signals (e.g., Brite23 and Octamon from Artinis, Table 1).
In order to identify noisy channels due to poor coupling or not-measuring channels due to detectors saturation, we highly recommended to (a) visually inspect the recorded signals and (b) assess channels’ quality using more objective measures e.g. following the approach proposed by Piper et al. (2014) based on the coefficient of variation (CV) of the signals, excluding those channels with CV values higher than 15% (Piper et al., 2014). Signals’ quality can be evaluated checking for the presence of the heart beat oscillation (~0.6 - 1 s) in the time-series, especially in ΔHbO2, or a frequency peak in the range ~1 - 1.5 Hz in the PSD of the signal (Figure 2 C). This ensures that physiologically meaningful components are measured.
Systemic Interferences
To improve the accuracy of functional investigations through fNIRS, the influence of physiological confounding factors need to be taken into consideration as well. In fact, fNIRS signals are contaminated by components of systemic origin that are not related to neuronal activity and that can lead to false positives and/or false negatives when inferring functional activity (Tachtsidis & Scholkmann, 2016). These physiological changes can arise both at the intra- and extra-cerebral compartments of the head, and can be both spontaneous and evoked by the cognitive task (Scholkmann et al., 2014). We expect the effect of systemic interferences to be even more pronounced in case of physical activity. For example, rapid posture changes (e.g., from laying down to standing up) can induce venous pooling or orthostatic hypotension (Balardin et al., 2017). In addition, walking can lead to changes in e.g. heart and breathing rates. In Figure 4, we show examples of heart rate (A) and breathing rate (B) signals recorded during the experiment performed by Pinti et al. (2015) (Pinti et al., 2015).
Figure 4.
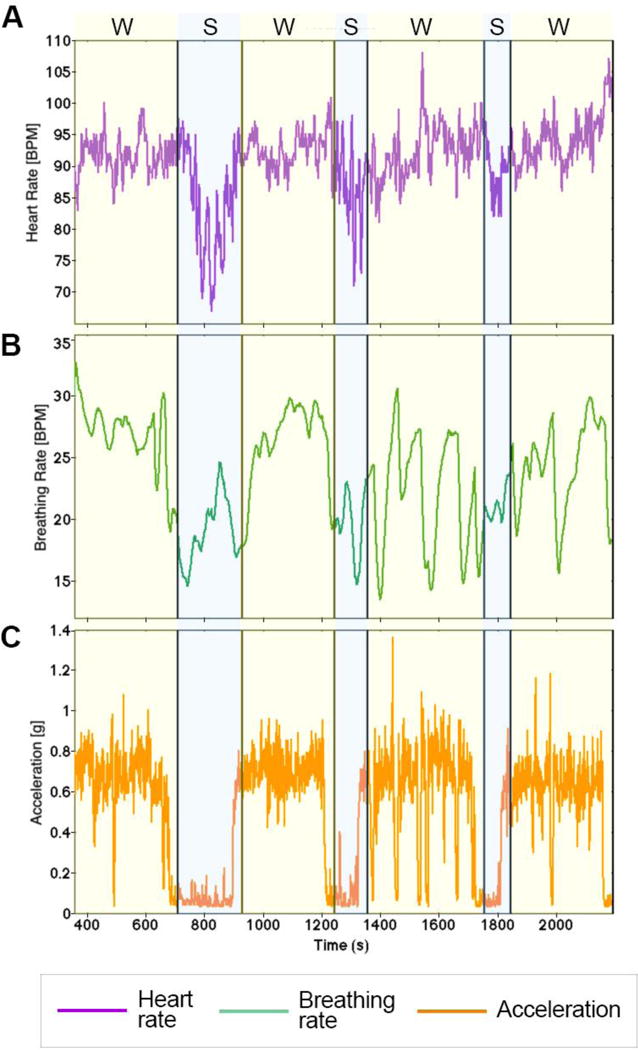
Heart rate (A), breathing rate (B), and acceleration (C) data referring to one participant undertaking the experiment described in Pinti et al. (2015). Yellow shaded areas indicate the conditions involving walking (W), while blue shaded areas represent the phases in which the participant was standing (S).
Walk-related changes can be observed in both signals when passing from experimental conditions involving walking (W; yellow shaded areas, lasting ~6 min) to standing conditions (S; blue shaded areas, lasting ~3 min), with increases and decreases in both heart rate and breathing rate levels.
Measuring acceleration (Figure 4 C) or GPS data can help in the interpretation of physiological and hemodynamic changes, providing information on participants’ movements (e.g., walk vs. stand, speed). Walking for long periods can cause fatigue with consequent systemic changes that alter the brain hemodynamic responses. As shown in Figure 5, changes in breathing rate exhibits trends very similar to concentration signals, and in particular ΔHbO2 (Kirilina et al., 2012; Tachtsidis & Scholkmann, 2016), both when the participant is walking (W; yellow shaded areas) and standing (S; blue shaded areas). To reduce fatigue, longer rest periods lasting a few minutes are recommended (Herold et al., 2017), to allow physiological and hemodynamic variables to reach their baseline values.
Figure 5.
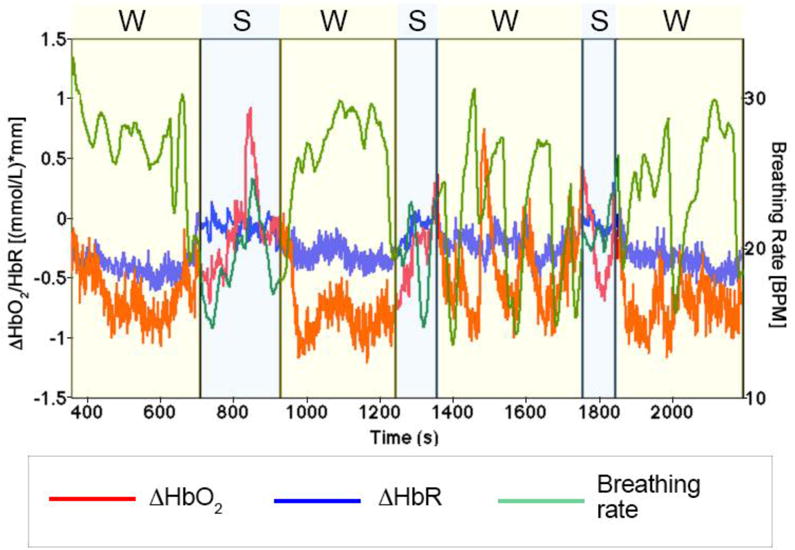
Breathing rate and unpre-processed concentration changes in oxy- and deoxy- haemoglobin referring to one participant undertaking the experiment described in Pinti et al. (2015). Yellow shaded areas indicate the conditions involving walking (W), while blue shaded areas represent the phases in which the participant was standing (S).
Different methods were proposed so far to reduce the impact of these components (Scholkmann et al., 2014). One of the most straightforward is to filter the fNIRS signals in specific frequency bands, preserving the functional activity range and excluding the noise frequencies. In the reviewed studies, low-pass filters are more often used. However, fNIRS signals can also include slow trends related to instrumental noise and/or very low frequency vasomotion regulations (<0.1 Hz). We thus recommend to use low-pass filters together with high-pass filters (i.e., band-pass filters) to remove both slow trends and higher frequency physiological noises (e.g., heart rate (~1 Hz)). Attention should be paid in the choice of the cut-off frequencies to ensure that only the noise components are filtered out.
Additionally, the use of short-separation (SS) channels was demonstrated to be effective in removing the extra-cerebral signals components (e.g., superficial skin blood flow) from long-separation channels (Gagnon et al., 2012). SS channels are created by placing a light source very close to a detector, usually at less than 1 cm distance, and record data from the extra-cerebral tissue. However, such superficial signal regression techniques (Funane et al., 2014, Gagnon et al., 2012) require a larger number of optodes, as each long separation channel must be combined with a short separation channel as close as 1.5 cm (Gagnon, Yücel, Boas, & Cooper, 2014). This is not fully possible with most of the commercially available wearable devices since the number of channels is still limited compared to conventional systems and are designed to maximize the investigation of the cortical tissue. Superficial regression can, to date, be performed with DOT devices (e.g., Genie from MMRA, and NIRSIT from Obelab, Table 2) that have a denser array of optodes, with the possibility of sampling from SS channels.
Other approaches based on independent component analysis (ICA) (Kohno et al., 2007), principal component analysis (PCA; Zhang, Brooks, Franceschini, & Boas, 2005), Bayesan filtering (Scarpa et al., 2011) and anti-correlation maximization (CBSI; Cui, Bray, & Reiss, 2010) have been proposed as well. Currently, the most effective methodology able to separate systemic components from fNIRS cortical signals (Scholkmann et al., 2014) is to combine fNIRS measurements with systemic physiological data (e.g., mean blood pressure, heart rate, scalp blood flow). These systemic signals can be e.g. used as additional regressors in the GLM analysis of fNIRS data (Tachtsidis, Koh, Stubbs, & Elwell, 2010; Kirilina et al., 2012) or combined with ICA to identify the components to remove (Patel, Katura, Maki, & Tachtsidis, 2011).
Only one of the studies we reviewed (Pinti et al., 2015) monitored changes in heart rate and breathing rate, and none included SS channels signal regression or PCA/ICA approaches. However, we recommend measuring physiological signals alongside fNIRS for a more effective reduction of systemic interferences. In fact, thanks to the feasibility of fNIRS for multimodal monitoring, this can be easily performed through the use of wearable physiological monitors (e.g., chest straps; Pinti et al., 2015) that do not interfere with the optical equipment and with participants’ movements.
Statistical Analysis
Concerning the statistical analysis of fNIRS data, the most common method to infer functional brain activity from fNIRS signals is to use averaging or GLM approaches (see Tak and Ye (2014) for a review (Tak & Ye, 2014)) and group-level analyses can be performed on a channel-wise basis or on topographic maps. These methods are commonly used to analyse fNIRS data recorded with typical fNIRS systems and can be expanded to the analysis of fNIRS data gathered through the new generation of wireless fNIRS devices.
The averaging method consists in computing the average concentration changes across task and rest periods, and using statistical tests (e.g., ANOVAs) to assess the presence of functional activation in task periods versus rest periods. The GLM approach provides more statistical power by considering the whole fNIRS time series. It expresses fNIRS data as a linear combination of regressors reflecting the experimental protocol and an error term. Regressors are computed through the convolution of delta and boxcar functions representing the experimental design with the hemodynamic response function (HRF). If on the one hand the averaging method has less statistical power considering only segments of fNIRS data, on the other hand the GLM is strongly model-dependent and requires assumptions on the shape and dynamics of the HRF. Both methods require the knowledge of the timeline of events, which are pre-established and known in conventional experimental protocols structured as typical block- or event-related design paradigms.
However, the analysis is not so immediate in case of unstructured experimental protocols such as those conducted in everyday life situations with wireless fNIRS systems, where brain activity is continuously monitored with minor control over the presentation of stimuli. For instance, in the work by Pinti et al. (2015), functional brain activity over the PFC was measured during the execution of an unstructured prospective memory task (Pinti et al., 2015). In that case, participants were asked to respond and “fist bump” in greeting particular targets (either certain people or stationary objects) located in the testing area. However, the onsets of functional events associated with those actions were not pre-established as in typical block or event-related design experiments, and were very difficult to identify from the analysis of video recordings of participants’ behaviour. In fact, the peaks of hemodynamic responses (i.e., increase in ΔHbO2 and decrease in ΔHbR) are expected to occur ~6 s after the stimulus onset (Scholkmann et al., 2014); however, non-synchronous hemodynamic responses to the targets’ fist bumping were observed (Figure 6 A, arrows), where the ΔHbO2 and ΔHbR peaks were anticipated of ~15 s.
Figure 6.
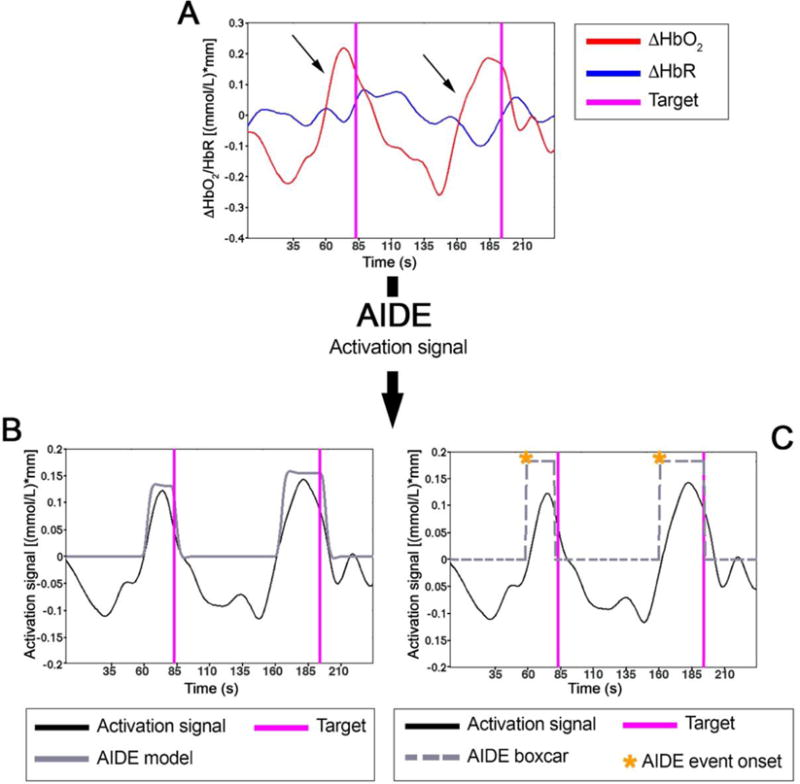
Example of ΔHbO2 and ΔHbR signals referring to one participant undertaking the experiment described in Pinti et al. (2015) (A). Magenta lines represent the time point in which the participant fist bumped two targets in the experimental area. Panel B shows the resulting activation model resulting from the application of AIDE (black line; Pinti et al., 2017), corresponding to the best fit with the activation signal (red line). The corresponding boxcar (black line) and the identified event onsets (orange asterisks) are illustrated in panel C. The estimated functional events occur ~20 s before the participant reached the targets (magenta lines).
This means that, in this case, functional events are more likely to occur when the participant spotted/approached the target (i.e., intention retrieval) rather than actually fist bumped it (i.e., intention realization). Recovery or prediction of the onset of the event corresponding to the moment when the participant retrieves the intention can be extremely difficult and time consuming from the video. This is also true when brain activity is continuously monitored during everyday life activities as in the study by Balardin et al. (2017), and it is very hard to match fNIRS signal changes to participants’ behaviour (Balardin et al., 2017). For instance, the authors investigated the inter-hemispherical functional connectivity using 1 min sliding window over the 4 hours continuously recorded fNIRS data. The spectrogram of the time-varying connectivity revealed a frequency peak of 0.002 Hz that, however, could not be linked to a particular daily activity.
To overcome the issues related to the identification of functional events in unstructured protocols, alternative approaches must be developed. A first attempt was proposed by Pinti et al. (2017). The authors developed an algorithm based on the GLM fitting procedure, called AIDE (Automatic IDentification of functional Events) that recovers the onsets of functional events directly from fNIRS data with good accuracy. Functional events (both the onset and duration) are determined identifying the activation model (i.e., the convolution of a boxcar representing the timeline of the events with the HRF) that gives the best fit with the activation signal (Pinti et al., 2017). In Figure 6 B-C, are presented the results of the application of AIDE to the example of Figure 6 A. More precisely, Figure 6 B shows the activation model (black line) giving the best fit with the activation signal (red line) that best describes the occurrence of functional trends (i.e., increase in the activation signal). The corresponding boxcar, representing the timeline of functional events, is reported in Figure 6 C (black line). In agreement with the visual inspection of signals that suggested anticipated hemodynamic responses, functional events (Figure 6 C, orange asterisks) actually happened ~20 s before the participant reached the targets (Figure 6 C, magenta lines). This confirms that functional events occur during the intention retrieval process rather than in correspondence of the intention realization. The main advantage of AIDE is that it does not make assumptions on the timings of functional events so that they can be identified also in case of experimental protocols with no particular structure. On the other hand, AIDE is model-dependent as it is based on the GLM. Hence, assumptions on the model and shape of the HRF have to be made. In addition, the impact of serial autocorrelations in fNIRS data must be taken into consideration and further improved from the current version of the algorithm.
To increase the strength of the statistical inference results and to formulate more accurate conclusions, we also recommend reporting results for both ΔHbO2 and ΔHbR. In fact, functional activation corresponds to an increase in ΔHbO2 and decrease in ΔHbR (Obrig et al., 2000). Changes in oxyhemoglobin are very often used as the marker to assess functional activity because of its high-contrast changes. However, this signal has been demonstrated to be strongly influenced by systemic changes (Kirilina et al., 2012), and can give rise to global and poorly localized hemodynamic responses (Zhang X., Noah, & Hirsch, 2016). On the contrary, ΔHbR is less affected by confounding factors (Kirilina et al., 2012) and a more robust indicator of brain activity, giving more localized and specific results (Hirsch, Zhang X., Noah & Ono, 2017).
In addition, the problem of correction for multiple comparisons needs to be taken into consideration, especially with the development of multi-channel fNIRS systems with a larger number of channels. The multiple comparison problem arises when more than one statistical inference is carried out. In that case, the significance level (i.e., the p-value) has to be adjusted to control for Type I errors. Typical approaches can be applied to control for family-wise error rates (FWER) in case of channel-wise statistical analyses, such as the widely-used Bonferroni correction or the Least Significant Differences (LSD). In case of statistical tests performed on topographic fNIRS maps, other approaches were proposed to control for FWER, such as the tube formula or the Euler characteristic (EC) method (see Tak and Ye (2014) for a review (Tak & Ye, 2014)). More recently, the use of alternative and less conservative approaches was explored. An example is the False Discovery Rate (FDR) method, that evaluates the expected proportion of falsely declared-active channels respect to the declared active channels. This approach provides a more robust and powerful measure of Type I errors than e.g. the Bonferroni correction, whilst ensuring a good compromise between power and specificity, and is highly recommended for channel-wise comparisons (Tak & Ye (2014); Singh & Dan, 2006).
Optodes Placement and Spatial Registration
In order to record reproducible fNIRS data and compare measurements across studies and individuals, a consistent placement of the fNIRS optodes overlying the desired or the same brain regions across subjects is crucial. The easiest way to achieve this is to place the fNIRS optodes or channels with respect to particular anatomical landmarks on the scalp as defined by the 10-20 system (Jasper, 1958; Okamoto & Dan, 2005) of electrode placement typically used for EEG. The 10-20 system identifies landmark points on the head surface that correspond to particular cortical structures on the basis of percentages of the distance between four references points (nasion, inion, right and left preauricular points). However, this approach alone provides only a qualitative assessment of channel location. By adding a 3D digitizer, the optodes x, y, z coordinates can be recorded and used to register the fNIRS channels onto a common brain space to recover more accurate information on the underlying anatomical brain regions.
The registration of functional neuroimaging data onto a common brain template is extremely important to compare study results among research groups, modalities and individuals. Nowadays, the most used brain platform is the Montreal Neurological Institute (MNI) stereotaxic space, created through the registration onto the Talaraich coordinate system and average of MRI structural images of several individuals. The registration of functional data onto the MNI brain template is quite straightforward for fMRI or PET as structural images of the brain can be obtained. However, this is not the case for fNIRS as no anatomical images can be collected and data are sampled only from the cortical surface. To this goal, several approaches were proposed and reviewed by Tsuzuki and Dan (2014). In brief, initially the spatial registration of fNIRS channels was performed using the structural MRI of each individual by transforming the digitized fNIRS probe locations into the MRI space through rigid body rotations and translations. In the subject’s MRI space, fNIRS positions are projected from the head surface onto the brain cortex (Okamoto & Dan, 2005). Alternative approaches include the reconstruction of the functional image using the optical properties of the brain (Aasted et al., 2015). However, in order to perform channel-wise or topographic maps comparisons across individuals, it is necessary to normalize the single subject’s MRI coordinates into the standard MNI brain. Typically, this is done by normalizing the structural MRI into the MNI template and the inverse transformation matrices are then applied to the fNIRS optodes.
As MRI scans are not always available, and MRI is expensive and would reduce the economic advantages of fNIRS, new stand-alone approaches to register the digitized fNIRS optodes locations onto the standard MNI space that do not require the MRI scans of each individual were developed (Singh, Okamoto, Dan, Jurcak & Dan, 2005). More recently, these approaches were improved even further to become completely stand-alone and do not need the use of a 3D digitizer (Cutini, Scatturin & Zorzi, 2011; Tsuzuki et al., 2007).
Once fNIRS optodes are registered onto the MNI template, between-subjects, -studies and -modalities comparisons can be carried out. If channels are placed in a similar location and overlap the same brain anatomical region across individuals, channel-wise comparisons can be performed. However, channels can cover different anatomical regions in case of subjects with different head sizes and shapes and can impact group-level channel-wise analyses. Alternatively, brain atlases, such as the Automated Anatomical Labelling (AAL), that consider macro-anatomical regions can be adopted to identify regions of interest (ROI) and increase the reproducibility by considering groups of channels within a ROI rather than single channels (Tsuzuki & Dan, 2014).
These methods are implemented in the main software for fNIRS data analyses, such as Homer2 (Huppert, Diamond, Franceschini, & Boas, 2009), SPM-fNIRS toolbox (Tak, Uga, Flandin, Dan, & Penny, 2016) and in the previous version NIRS-SPM (Ye, Tak, Jang, Jung, & Jang, 2009), and POTATO (Sutoko et al., 2016).
Discussion and Future Directions
Over the last few decades, fNIRS has rapidly become a powerful method to image brain activity and investigate cognitive functions that cannot be studied in artificial contexts such as an fMRI scanner (e.g., social interactions (Hirsch et al., 2017), motor control (Herold et al., 2017), neurodevelopment (Lloyd-Fox, Blasi, & Elwell, 2010)). The boundaries of these neuroscientific investigations can now be further extended thanks to the availability of wearable fNIRS instrumentation (Quaresima & Ferrari, 2016), allowing the monitoring of brain functioning in even more ecologically-valid scenarios and in outdoor environments (Balardin et al., 2017; McKendrick et al., 2016; McKendrick et al., 2017; Pinti et al., 2015) with mobile participants.
To date, most of the studies were conducted in conventional laboratory settings, and involved the monitoring of PFC hemodynamics during a dual-task walking test (Table 2) with basic cognitive tasks (e.g., N-back task, digit span, verbal fluency task, serial subtractions, playing a game on a smartphone). Nevertheless, even though these studies adopted standard approaches for neuroimaging, they have contributed some major findings. First, they have demonstrated the feasibility of wearable fNIRS in assessing functional brain activity to tasks performed during walking. This sets the basis for future applications in real-world contexts since we continuously carry out dual-task walking (DTW) actions in our everyday life. Second, the new class of fNIRS devices are well tolerated not only by healthy adults, but also by patients with neurological deficits and mild cognitive impairment. This opens the way to new applications in clinical settings such as for neurorehabilitation. Third, it was proven that the new class of fNIRS devices are able to investigate the interplay between gait and higher cognitive and cortical control mechanisms in case of clinical patients. For instance, this is particularly important in the case of Parkinson’s disease as the monitoring of these patients during DTW tasks can help in explaining their difficulties in performing two tasks at the same time or gait failures in everyday life (Maidan et al., 2016).
The studies by Balardin et al. (2017), McKendrick et al. (2016, 2017), and Pinti et al. (2015) were conducted in outdoor environments and in situations mirroring everyday life contexts (Balardin et al., 2017; McKendrick et al., 2016, 2017; Pinti et al., 2015). Whilst some precautions related to the use of fNIRS in challenging situations need to be taken into account, these studies have demonstrated the feasibility of wearable fNIRS in effectively monitoring functional brain activity on people freely moving in outdoor settings while carrying out tasks as they would normally do in real life.
Below, we describe some of the possible applications in the field of cognitive neuroscience that we believe they would benefit the most from the use of wearable fNIRS.
The New Neuroscience of Two: Hyperscanning with fNIRS
One clear advantage for fNIRS as a technique for the study of human brain-cognition relationships is in the study of social interaction. This is because the typical environment of e.g. a MRI or PET scanner precludes naturalistic or normal social behaviour, limiting the questions that can be asked, and raising the question of the ecological validity of the results.
While current fNIRS hyperscanning studies all use tethered systems with seated participants (Scholkmann, Holper, Wolf, & Wolf, 2013), the extension of hyperscanning to wearable fNIRS would allow us to monitor brain activity during a much wider range of social activities including dance, teaching, large scale collaborative tasks, even sports. For example, a recent study used wireless EEG to track brain-to-brain synchrony in classrooms (Dikker et al., 2017); similar studies with fNIRS might provide more detailed information on the engagement of different brain systems during teaching and learning interactions.
The investigation of dynamic social interactions between two individuals extends the fundamental unit of behaviour from a single brain to a two-brain unit, the dyad, and the focus is on communication protocols within the unit. Further to this, rapidly fluctuating facial expressions and subtle interaction-related movements that are transmitted and received during natural social interactions are poorly resolved by conventional experimental methods, thereby highlighting the significant advantages to hyperscanning (Schilbach, 2014). This advantage is illustrated in several recent studies. For example, although the salience of eyes in communication is well acknowledged, the evidence is primarily based on single brain studies and viewing static pictures often with direct vs indirect gaze (Allison, Puce, & McCarthy, 2000; Ethofer, Gschwind, & Vuilleumier, 2011). However, a recent hyperscanning study of live eye-to-eye contact with fNIRS confirms a previously unappreciated critical role for real interaction via eye contact in natural interpersonal interactions (Hirsch et al., 2017).
These foundational findings and the forward trajectories are early entry points toward a new neuroscience of two that emerges from hyperscanning based on fNIRS.
fNIRS and Virtual Reality (VR)
A further benefit of fNIRS is that it can potentially be combined with virtual reality (VR) or augmented reality to give full experimental control of a participant’s experience in a dynamic environment. Common VR headsets (e.g., Oculus Rift) can be modified to combine with an fNIRS frontal cortex recording system, or fNIRS can be used in conjunction with a CAVE VR system in which the virtual environment is present on all the walls surrounding the participant and is seen in 3D with 3D glasses. Studies in fMRI examined how participants in VR respond to threat stimuli (McCall, Hildebrandt, Bornemann & Singer, 2015) and if they show prosocial behaviour in an emergency (Pan & Slater, 2011). If these VR scenarios were combined with fNIRS, we could understand the neural mechanisms underlying these behaviours.
fNIRS as a Tool of Driving Research
The potential of fNIRS is also particularly striking for everyday behaviours that simply cannot be investigated in the laboratory, such as driving a car. Liu, Pelowski, Pang, Zhou, and Cai (2016) reviewed fNIRS as a tool for driving research, evaluating different models of fNIRS devices, paradigms employed and key findings, as well as comparing to fMRI/EEG research. While various studies used fNIRS in driving simulators, others used fNIRS in real cars (see Liu et al. (2016) for a review (Liu, Pelowski, Pang, Zhou, & Cai, 2016)). fNIRS allowed the investigation of various risk factors in driving such as fatigue, distraction, ageing (for further details see Liu et al., 2016). The authors are convinced that fNIRS proved itself as a useful method in driving research. Further research can address changes in brain activations in other regions than PFC, such as temporal cortex, parietal and pre-motor areas. Moreover, other risk factors can be explored, such as inexperience, unexpected events, distractions, alcohol and with passengers. Lastly, the authors highlight the recent introduction of time-course measurements, which will allow exploring real-time, dynamic activation changes during driving.
fNIRS for Neuroeconomics and Neuroergonomics Research
Other applications could involve multimodal monitoring in everyday life contexts. Kopton and Kenning (2014) evaluated the potential of fNIRS in neuroeconomics research. They argue that the interdisciplinary research field of ‘neuroeconomics’ was the result of investigating neurophysiological processes of economic decision making using methods such as fMRI, EEG, electrodermal activity (EDA) and eye-tracking. However, recent challenges in neuroeconomics necessitate measuring situational factors outside the laboratory and in the ‘real-world’. These methodological demands can only be met with flexible and mobile technologies such as wearable fNIRS. The review describes not only lab-based experiments using wireless fNIRS with high ecological validity, but also evaluate the reliability of wireless fNIRS in field experiments (Kopton & Kenning, 2014).
Additionally, neuroergonomics would massively benefit from the use of wearable fNIRS on mobile participants. In fact, it is different from conventional neuroscience as it investigates cognition in response to work, and requires the possibility to measure brain activity in naturalistic environments such as in the workplace (Mehta & Parasuraman, 2013). Therefore, conventional neuroimaging techniques such as fMRI and PET are not well suited for neuroergonomics research. The potential of fNIRS in neuroergonomics has been reviewed by Ayaz et al. (2013) (Ayaz et al., 2013).
fNIRS for the Study of Prefrontal Cortex Function
There is another sizeable subfield of cognitive neuroscience where the necessity for wearable neuroimaging devices is just as great but perhaps less immediately obvious. This is the study of prefrontal cortex (PFC) function. PFC supports a wide range of high-level mental processes and some subregions of PFC (especially rostral PFC) are specifically involved in dealing with ‘open-ended’ situations, i.e. problems where there are many possible solutions and one has to decide for oneself which one to take. These situations are very hard to recreate in a typical neuroimaging setting where an experimenter asks a person to lie down in a scanner, concentrate on what they are about to be shown, and then are shown a series of near-identical stimuli to which a very limited number of responses are instructed to be made. In addition, previous studies demonstrated how cognitive tasks that mimic ‘real-world’ situations are more sensitive in detecting frontal lobe dysfunction in neurological patients than those that are administered in the clinic and are quite confrontational in their format (see Burgess et al., (2006) and Burgess and Stuss (in press) for review (Burgess et al., 2006; Burgess & Stuss (in press)).
The new developments with fNIRS offer the possibility of following an analogous path in moving from measurement in the clinic or laboratory, to measurement in “real life”, thus permitting much more accurate measurement of the processes of interest, with the attendant promise of new discoveries about the functions that the frontal lobes support.
Conclusion
Over recent years, the focus of cognitive neuroscientists shifted significantly towards the monitoring of brain activity in ‘real life’, especially when investigating those cognitive functions that might be difficult to study in a highly artificial experimental environment. We now have the possibility to do this thanks to the availability of new instruments such as wearable fNIRS systems.
In summary, the reviewed studies laid the foundations to future neuroscientific investigations with wearable fNIRS devices in more ecologically-valid contexts and in outdoor environments, starting from the basics and demonstrating the feasibility of the new generation of wearable fNIRS with a series of proof-of-principle experiments. Having demonstrated the strengths and the limitations of this new technology, we believe that wearable fNIRS can find application in many different fields, addressing questions that cannot be investigated with previous technologies. It seems possible now with recent technological and conceptual developments in fNIRS that neuroimaging for cognitive neuroscience can now move ‘from lab to life’.
Footnotes
This work was supported by the Wellcome Trust (104580/Z/14/Z).
This work was supported by the following grants from the US National Institute of Health: NIH 5 R01 MH107513; NIH 5 R01 MH111629; NIH 1 R37 HD090153
References
- Aasted CM, Yücel MA, Cooper RJ, Dubb J, Tsuzuki D, Becerra L, Boas DA. Anatomical guidance for functional near-infrared spectroscopy: AtlasViewer tutorial. Neurophotonics. 2015;2(2):020801. doi: 10.1117/1.NPh.2.2.020801. [DOI] [PMC free article] [PubMed] [Google Scholar]
- Allison T, Puce A, McCarthy G. Social perception from visual cues: role of the STS region. Trends in Cognitive Sciences. 2000;4:267–278. doi: 10.1016/S1364-6613(00)01501-1. [DOI] [PubMed] [Google Scholar]
- Atsumori H, Kiguchi M, Obata A, Sato H, Katura T, Funane T, Maki A. Development of wearable optical topography system for mapping the prefrontal cortex activation. Review of Scientific Instruments. 2009;80(4):043704. doi: 10.1063/1.3115207. [DOI] [PubMed] [Google Scholar]
- Atsumori H, Kiguchi M, Katura T, Funane T, Obata A, Sato H, Kubota K. Noninvasive imaging of prefrontal activation during attention-demanding tasks performed while walking using a wearable optical topography system. Journal of Biomedical Optics. 2010;15(4):046002–046002. doi: 10.1117/1.3462996. [DOI] [PubMed] [Google Scholar]
- Ayaz H, Onaral B, Izzetoglu K, Shewokis PA, McKendrick R, Parasuraman R. Continuous monitoring of brain dynamics with functional near infrared spectroscopy as a tool for neuroergonomic research: Empirical examples and a technological development. Frontiers in Human Neuroscience. 2013:7. doi: 10.3389/fnhum.2013.00871. [DOI] [PMC free article] [PubMed] [Google Scholar]
- Babiloni F, Astolfi L. Social neuroscience and hyperscanning techniques: Past, present and future. Neuroscience & Biobehavioral Reviews. 2014;44:76–93. doi: 10.1016/j.neubiorev.2012.07.006. [DOI] [PMC free article] [PubMed] [Google Scholar]
- Balardin JB, Morais GAZ, Furucho RA, Trambaiolli L, Vanzella P, Biazoli C, Jr, Sato JR. Imaging brain function with functional near-infrared spectroscopy in unconstrained environments. Frontiers in Human Neuroscience. 2017:11. doi: 10.3389/fnhum.2017.00258. [DOI] [PMC free article] [PubMed] [Google Scholar]
- Boas DA, Elwell CE, Ferrari M, Taga G. Twenty years of functional near-infrared spectroscopy: Introduction for the special issue. NeuroImage. 2014;85:1–5. doi: 10.1016/j.neuroimage.2013.11.033. [DOI] [PubMed] [Google Scholar]
- Brigadoi S, Ceccherini L, Cutini S, Scarpa F, Scatturin P, Selb J, Cooper RJ. Motion artifacts in functional near-infrared spectroscopy: A comparison of motion correction techniques applied to real cognitive data. NeuroImage. 2014;85:181–191. doi: 10.1016/j.neuroimage.2013.04.082. [DOI] [PMC free article] [PubMed] [Google Scholar]
- Burgess PW, Alderman N, Forbes C, Costello A, Coates LMA, Dawson DR, Channon S. The case for the development and use of “ecologically valid” measures of executive function in experimental and clinical neuropsychology. Journal of the International Neuropsychological Society. 2006;12:1–16. doi: 10.1017/s1355617706060310. [DOI] [PubMed] [Google Scholar]
- Burgess PW. Serial multitasking: From lab to life. In: Fawcett J, Risko EF, Kingstone A, editors. The Handbook of Attention. MIT Press; 2015. pp. 443–462. Retrieved from https://mitpress.mit.edu/books/handbook-attention (May 10, 2018) [Google Scholar]
- Burgess PW, Stuss DT. Fifty years of frontal lobe research: Impact on assessment. Journal of the International Neuropsychological Society. 23:755–767. doi: 10.1017/S1355617717000704. [DOI] [PubMed] [Google Scholar]
- Chance B, Luo Q, Nioka S, Alsop DC, Detre JA. Optical investigations of physiology: A study of intrinsic and extrinsic biomedical contrast. Philosophical Transactions of the Royal Society of London B: Biological Sciences. 1997;352(1354):707–716. doi: 10.1098/rstb.1997.0053. [DOI] [PMC free article] [PubMed] [Google Scholar]
- Chitnis D, Cooper RJ, Dempsey L, Powell S, Quaggia S, Highton D, Everdell NL. Functional imaging of the human brain using a modular, fibre-less, high-density diffuse optical tomography system. Biomedical Optics Express. 2016a;7(10):4275–4288. doi: 10.1364/boe.7.004275. [DOI] [PMC free article] [PubMed] [Google Scholar]
- Chitnis D, Airantzis D, Highton D, Williams R, Phan P, Giagka V, Elwell CE. Towards a wearable near infrared spectroscopic probe for monitoring concentrations of multiple chromophores in biological tissue in vivo. Review of Scientific Instruments. 2016b;87(6):065112. doi: 10.1063/1.4954722. [DOI] [PMC free article] [PubMed] [Google Scholar]
- Cui X, Bray S, Reiss AL. Functional near infrared spectroscopy (NIRS) signal improvement based on negative correlation between oxygenated and deoxygenated hemoglobin dynamics. NeuroImage. 2010;49:3039–3046. doi: 10.1016/j.neuroimage.2009.11.050. [DOI] [PMC free article] [PubMed] [Google Scholar]
- Cutini S, Scatturin P, Zorzi M. A new method based on ICBM152 head surface for probe placement in multichannel fNIRS. NeuroImage. 2011;54:919–927. doi: 10.1016/j.neuroimage.2010.09.030. [DOI] [PubMed] [Google Scholar]
- Debener S, Minow F, Emkes R, Gandras K, Vos M. How about taking a low‐cost, small, and wireless EEG for a walk? Psychophysiology. 2012;49:1617–1621. doi: 10.1111/j.1469-8986.2012.01471.x. [DOI] [PubMed] [Google Scholar]
- Dikker S, Wan L, Davidesco I, Kaggen L, Oostrik M, McClintock J, Poeppel D. Brain-to-brain synchrony tracks real-world dynamic group interactions in the classroom. Current Biology. 2017;27:1375–1380. doi: 10.1016/j.cub.2017.04.002. [DOI] [PubMed] [Google Scholar]
- Doi T, Makizako H, Shimada H, Park H, Tsutsumimoto K, Uemura K, Suzuki T. Brain activation during dual-task walking and executive function among older adults with mild cognitive impairment: A fNIRS study. Aging Clinical and Experimental Research. 2013;25:539–544. doi: 10.1007/s40520-013-0119-5. [DOI] [PubMed] [Google Scholar]
- Eggebrecht AT, White BR, Ferradal SL, Chen C, Zhan Y, Snyder AZ, Culver JP. A quantitative spatial comparison of high-density diffuse optical tomography and fMRI cortical mapping. NeuroImage. 2012;61:1120–1128. doi: 10.1364/biomed.2012.bsu4a.2. [DOI] [PMC free article] [PubMed] [Google Scholar]
- Ethofer T, Gschwind M, Vuilleumier P. Processing social aspects of human gaze: A combined fMRI-DTI study. NeuroImage. 2011;55:411–419. doi: 10.1016/j.neuroimage.2010.11.033. [DOI] [PubMed] [Google Scholar]
- Funane T, Atsumori H, Katura T, Obata AN, Sato H, Tanikawa Y, Kiguchi M. Quantitative evaluation of deep and shallow tissue layers’ contribution to fNIRS signal using multi-distance optodes and independent component analysis. NeuroImage. 2014;85:150–165. doi: 10.1016/j.neuroimage.2013.02.026. [DOI] [PubMed] [Google Scholar]
- Funane T, Numata T, Sato H, Hiraizumi S, Hasegawa Y, Kuwabara H, Kiguchi M. Rearrangeable and exchangeable optical module with system-on-chip for wearable functional near-infrared spectroscopy system. Neurophotonics. 2017;5:011007. doi: 10.1117/1.nph.5.1.011007. [DOI] [PMC free article] [PubMed] [Google Scholar]
- Gagnon L, Cooper RJ, Yücel MA, Perdue KL, Greve DN, Boas DA. Short separation channel location impacts the performance of short channel regression in NIRS. NeuroImage. 2012;59:2518–2528. doi: 10.1016/j.neuroimage.2011.08.095. [DOI] [PMC free article] [PubMed] [Google Scholar]
- Gagnon L, Yücel MA, Boas DA, Cooper RJ. Further improvement in reducing superficial contamination in NIRS using double short separation measurements. NeuroImage. 2014;85:127–135. doi: 10.1016/j.neuroimage.2013.01.073. [DOI] [PMC free article] [PubMed] [Google Scholar]
- Herold F, Wiegel P, Scholkmann F, Thiers A, Hamacher D, Schega L. Functional near-infrared spectroscopy in movement science: a systematic review on cortical activity in postural and walking tasks. Neurophotonics. 2017;4:041403. doi: 10.1117/1.nph.4.4.041403. [DOI] [PMC free article] [PubMed] [Google Scholar]
- Hirsch J, Zhang X, Noah JA, Ono Y. Frontal temporal and parietal systems synchronize within and across brains during live eye-to-eye contact. NeuroImage. 2017;157:314–330. doi: 10.1016/j.neuroimage.2017.06.018. [DOI] [PMC free article] [PubMed] [Google Scholar]
- Hoshi Y, Chen SJ. Regional cerebral blood flow changes associated with emotions in children. Pediatric Neurology. 2002;27(4):275–281. doi: 10.1016/s0887-8994(02)00432-0. [DOI] [PubMed] [Google Scholar]
- Huppert TJ, Diamond SG, Franceschini MA, Boas DA. HomER: a review of time-series analysis methods for near-infrared spectroscopy of the brain. Applied Optics. 2009;48:D280–D298. doi: 10.1364/ao.48.00d280. [DOI] [PMC free article] [PubMed] [Google Scholar]
- Jasper HH. The ten twenty electrode system of the international federation. Electroencephalography and Clinical Neurophysiology. 1958;10:371–375. doi: 10.1016/0013-4694(58)90053-1. [DOI] [PubMed] [Google Scholar]
- Kirilina E, Jelzow A, Heine A, Niessing M, Wabnitz H, Brühl R, Tachtsidis I. The physiological origin of task-evoked systemic artefacts in functional near infrared spectroscopy. Neuroimage. 2012;61(1):70–81. doi: 10.1016/j.neuroimage.2012.02.074. [DOI] [PMC free article] [PubMed] [Google Scholar]
- Kohno S, Miyai I, Seiyama A, Oda I, Ishikawa A, Tsuneishi S, Shimizu K. Removal of the skin blood flow artifact in functional near-infrared spectroscopic imaging data through independent component analysis. Journal of Biomedical Optics. 2007;12:062111–062111. doi: 10.1117/1.2814249. [DOI] [PubMed] [Google Scholar]
- Kopton IM, Kenning P. Near-infrared spectroscopy (NIRS) as a new tool for neuroeconomic research. Frontiers in Human Neuroscience. 2014;8 doi: 10.3389/fnhum.2014.00549. [DOI] [PMC free article] [PubMed] [Google Scholar]
- Lareau E, Lesage F, Pouliot P, Nguyen D, Le Lan J, Sawan M. Multichannel wearable system dedicated for simultaneous electroencephalography/near-infrared spectroscopy real-time data acquisitions. Journal of Biomedical Optics. 2011;16:096014–096014. doi: 10.1117/1.3625575. [DOI] [PubMed] [Google Scholar]
- Liu T, Pelowski M, Pang C, Zhou Y, Cai J. Near-infrared spectroscopy as a tool for driving research. Ergonomics. 2016;59:368–379. doi: 10.1080/00140139.2015.1076057. [DOI] [PubMed] [Google Scholar]
- Lloyd-Fox S, Blasi A, Elwell CE. Illuminating the developing brain: the past, present and future of functional near infrared spectroscopy. Neuroscience & Biobehavioral Reviews. 2010;34:269–284. doi: 10.1016/j.neubiorev.2009.07.008. [DOI] [PubMed] [Google Scholar]
- Maidan I, Nieuwhof F, Bernad-Elazari H, Reelick MF, Bloem BR, Giladi N, Mirelman A. The role of the frontal lobe in complex walking among patients with Parkinson’s disease and healthy older adults: An fNIRS study. Neurorehabilitation and Neural Repair. 2016;30:963–971. doi: 10.1177/1545968316650426. [DOI] [PubMed] [Google Scholar]
- McCall C, Hildebrandt LK, Bornemann B, Singer T. Physiophenomenology in retrospect: Memory reliably reflects physiological arousal during a prior threatening experience. Consciousness and Cognition. 2015;38:60–70. doi: 10.1016/j.concog.2015.09.011. [DOI] [PubMed] [Google Scholar]
- McKendrick R, Parasuraman R, Murtza R, Formwalt A, Baccus W, Paczynski M, Ayaz H. Into the wild: Neuroergonomic differentiation of hand-held and augmented reality wearable displays during outdoor navigation with functional near infrared spectroscopy. Frontiers in Human Neuroscience. 2016;10 doi: 10.3389/fnhum.2016.00216. [DOI] [PMC free article] [PubMed] [Google Scholar]
- McKendrick R, Mehta R, Ayaz H, Scheldrup M, Parasuraman R. Prefrontal hemodynamics of physical activity and environmental complexity during cognitive work. Human Factors. 2017;59:147–162. doi: 10.1177/0018720816675053. [DOI] [PubMed] [Google Scholar]
- Mehta RK, Parasuraman R. Neuroergonomics: A review of applications to physical and cognitive work. Frontiers in Human Neuroscience. 2013;7 doi: 10.3389/fnhum.2013.00889. [DOI] [PMC free article] [PubMed] [Google Scholar]
- Mihajlović V, Grundlehner B, Vullers R, Penders J. Wearable, wireless EEG solutions in daily life applications: What are we missing? IEEE Journal of Biomedical and Health Informatics. 2015;19:6–21. doi: 10.1109/jbhi.2014.2328317. [DOI] [PubMed] [Google Scholar]
- Mirelman A, Maidan I, Bernad-Elazari H, Nieuwhof F, Reelick M, Giladi N, Hausdorff JM. Increased frontal brain activation during walking while dual tasking: An fNIRS study in healthy young adults. Journal of Neuroengineering and Rehabilitation. 2014;11:85. doi: 10.1186/1743-0003-11-85. [DOI] [PMC free article] [PubMed] [Google Scholar]
- Molavi B, Dumont GA. Wavelet-based motion artifact removal for functional near-infrared spectroscopy. Physiological Measurement. 2012;33:259. doi: 10.1109/iembs.2010.5626589. [DOI] [PubMed] [Google Scholar]
- Muehlemann T, Haensse D, Wolf M. Wireless miniaturized in-vivo near infrared imaging. Optics Express. 2008;16:10323–10330. doi: 10.1364/oe.16.010323. [DOI] [PubMed] [Google Scholar]
- Nieuwhof F, Reelick MF, Maidan I, Mirelman A, Hausdorff JM, Rikkert MGO, Claassen JA. Measuring prefrontal cortical activity during dual task walking in patients with Parkinson’s disease: Feasibility of using a new portable fNIRS device. Pilot and Feasibility Studies. 2016;2:59. doi: 10.1186/s40814-016-0099-2. [DOI] [PMC free article] [PubMed] [Google Scholar]
- Obrig H, Wenzel R, Kohl M, Horst S, Wobst P, Steinbrink J, Villringer A. Near-infrared spectroscopy: Does it function in functional activation studies of the adult brain? International Journal of Psychophysiology. 2000;35:125–142. doi: 10.1016/s0167-8760(99)00048-3. [DOI] [PubMed] [Google Scholar]
- Okamoto M, Dan I. Automated cortical projection of head-surface locations for transcranial functional brain mapping. NeuroImage. 2005;26:18–28. doi: 10.1016/j.neuroimage.2005.01.018. [DOI] [PubMed] [Google Scholar]
- Pan X, Slater M. Proceedings of the 25th BCS Conference on Human-Computer Interaction, British Computer Society. Newcastle-upon-Tyne; UK: 2011. Confronting a moral dilemma in virtual reality: a pilot study; pp. 46–51. Retrieved from https://dl.acm.org/citation.cfm?id=2305326 (May 10, 2018) [Google Scholar]
- Patel S, Katura T, Maki A, Tachtsidis I. Quantification of systemic interference in optical topography data during frontal lobe and motor cortex activation: an independent component analysis. Oxygen Transport to Tissue. 2011;XXXII:45–51. doi: 10.1007/978-1-4419-7756-4_7. [DOI] [PMC free article] [PubMed] [Google Scholar]
- Patil AV, Safaie J, Moghaddam HA, Wallois F, Grebe R. Experimental investigation of NIRS spatial sensitivity. Biomedical Optics Express. 2011;2:1478–1493. doi: 10.1364/boe.2.001478. [DOI] [PMC free article] [PubMed] [Google Scholar]
- Poldrack RA. Can cognitive processes be inferred from neuroimaging data? Trends in Cognitive Sciences. 2006;10:59–63. doi: 10.1016/j.tics.2005.12.004. [DOI] [PubMed] [Google Scholar]
- Pinti P, Aichelburg C, Lind F, Power S, Swingler E, Merla A, Tachtsidis I. Using fiberless, wearable fNIRS to monitor brain activity in real-world cognitive tasks. Journal of Visualized Experiments: JoVE. 2015;(106):e5336. doi: 10.3791/53336. [DOI] [PMC free article] [PubMed] [Google Scholar]
- Pinti P, Merla A, Aichelburg C, Lind F, Power S, Swingler E, Tachtsidis I. A novel GLM-based method for the Automatic IDentification of functional Events (AIDE) in fNIRS data recorded in naturalistic environments. NeuroImage. 2017;155:291–304. doi: 10.1016/j.neuroimage.2017.05.001. [DOI] [PMC free article] [PubMed] [Google Scholar]
- Piper S, Krüger A, Koch SP, Mehnert J, Habermehl C, Steinbrink J, Schmitz CH. A wearable multi-channel NIRS imaging system for brain imaging in freely moving subjects. NeuroImage. 2014;85:64–71. doi: 10.1016/j.neuroimage.2013.06.062. [DOI] [PMC free article] [PubMed] [Google Scholar]
- Quaresima V, Ferrari M. Functional near-infrared spectroscopy (fNIRS) for assessing cerebral cortex function during human behavior in natural/social situations: A concise review. Organizational Research Methods. 2016 doi: 10.1177/1094428116658959. 1094428116658959. [DOI] [Google Scholar]
- Safaie J, Grebe R, Moghaddam HA, Wallois F. Toward a fully integrated wireless wearable EEG-NIRS bimodal acquisition system. Journal of Neural Engineering. 2013;10(5):056001. doi: 10.1088/1741-2560/10/5/056001. [DOI] [PubMed] [Google Scholar]
- Scarpa F, Brigadoi S, Cutini S, Scatturin P, Zorzi M, Dell’Acqua R, Sparacino G. A methodology to improve estimation of stimulus evoked hemodynamic response from fNIRS measurements. Engineering in Medicine and Biology Society, EMBC, 2011 Annual International Conference of the IEEE. 2011:785–788. doi: 10.1109/iembs.2011.6090180. [DOI] [PubMed] [Google Scholar]
- Schilbach L. On the relationship of online and offline social cognition. Frontiers in Human Neuroscience. 2014;8:278. doi: 10.3389/fnhum.2014.00278. [DOI] [PMC free article] [PubMed] [Google Scholar]
- Scholkmann F, Spichtig S, Muehlemann T, Wolf M. How to detect and reduce movement artifacts in near-infrared imaging using moving standard deviation and spline interpolation. Physiological Measurement. 2010;31:649. doi: 10.1088/0967-3334/31/5/004. [DOI] [PubMed] [Google Scholar]
- Scholkmann F, Holper L, Wolf U, Wolf M. A new methodical approach in neuroscience: Assessing inter-personal brain coupling using functional near-infrared imaging (fNIRI) hyperscanning. Frontiers in Human Neuroscience. 2013;7:813. doi: 10.3389/fnhum.2013.00813. [DOI] [PMC free article] [PubMed] [Google Scholar]
- Scholkmann F, Kleiser S, Metz AJ, Zimmermann R, Pavia JM, Wolf U, Wolf M. A review on continuous wave functional near-infrared spectroscopy and imaging instrumentation and methodology. Neuroimage. 2014;85:6–27. doi: 10.1016/j.neuroimage.2013.05.004. [DOI] [PubMed] [Google Scholar]
- Shiga T, Yamamoto K, Tanabe K, Nakase Y, Chance B. Study of an algorithm based on model experiments and diffusion theory for a portable tissue oximeter. Journal of Biomedical Optics. 1997;2:154–161. doi: 10.1117/12.268963. [DOI] [PubMed] [Google Scholar]
- Singh AK, Okamoto M, Dan H, Jurcak V, Dan I. Spatial registration of multichannel multi-subject fNIRS data to MNI space without MRI. NeuroImage. 2005;27:842–851. doi: 10.1016/j.neuroimage.2005.05.019. [DOI] [PubMed] [Google Scholar]
- Singh AK, Dan I. Exploring the false discovery rate in multichannel NIRS. NeuroImage. 2006;33:542–549. doi: 10.1016/j.neuroimage.2006.06.047. [DOI] [PubMed] [Google Scholar]
- Spooner DM, Pachana NA. Ecological validity in neuropsychological assessment: A case for greater consideration in research with neurologically intact populations. Archives of Clinical Neuropsychology. 2006;21:327–337. doi: 10.1016/j.acn.2006.04.004. [DOI] [PubMed] [Google Scholar]
- Sutoko S, Sato H, Maki A, Kiguchi M, Hirabayashi Y, Atsumori H, Katura T. Tutorial on platform for optical topography analysis tools. Neurophotonics. 2016;3:010801. doi: 10.1117/1.nph.3.1.010801. [DOI] [PMC free article] [PubMed] [Google Scholar]
- Tachtsidis I, Koh PH, Stubbs C, Elwell CE. Functional optical topography analysis using statistical parametric mapping (SPM) methodology with and without physiological confounds. Oxygen Transport to Tissue. 2010;XXXI:237–243. doi: 10.1007/978-1-4419-1241-1_34. [DOI] [PMC free article] [PubMed] [Google Scholar]
- Tachtsidis I, Scholkmann F. False positives and false negatives in functional near-infrared spectroscopy: Issues, challenges, and the way forward. Neurophotonics. 2016;3:031405–031405. doi: 10.1117/1.nph.3.3.030401. [DOI] [PMC free article] [PubMed] [Google Scholar]
- Tak S, Ye JC. Statistical analysis of fNIRS data: A comprehensive review. NeuroImage. 2014;85:72–91. doi: 10.1016/j.neuroimage.2013.06.016. [DOI] [PubMed] [Google Scholar]
- Tak S, Uga M, Flandin G, Dan I, Penny WD. Sensor space group analysis for fNIRS data. Journal of neuroscience methods. 2016;264:103–112. doi: 10.1016/j.jneumeth.2016.03.003. [DOI] [PMC free article] [PubMed] [Google Scholar]
- Takeuchi N, Mori T, Suzukamo Y, Tanaka N, Izumi SI. Parallel processing of cognitive and physical demands in left and right prefrontal cortices during smartphone use while walking. BMC Neuroscience. 2016;17(1):9. doi: 10.1186/s12868-016-0244-0. [DOI] [PMC free article] [PubMed] [Google Scholar]
- Tsuzuki D, Jurcak V, Singh AK, Okamoto M, Watanabe E, Dan I. Virtual spatial registration of stand-alone fNIRS data to MNI space. NeuroImage. 2007;34:1506–1518. doi: 10.1016/j.neuroimage.2006.10.043. [DOI] [PubMed] [Google Scholar]
- Tsuzuki D, Dan I. Spatial registration for functional near-infrared spectroscopy: from channel position on the scalp to cortical location in individual and group analyses. Neuroimage. 2014;85:92–103. doi: 10.1016/j.neuroimage.2013.07.025. [DOI] [PubMed] [Google Scholar]
- Wyser DG, Lambercy O, Scholkmann F, Wolf M, Gassert R. Wearable and modular functional near-infrared spectroscopy instrument with multidistance measurements at four wavelengths. Neurophotonics. 2017;4:041413. doi: 10.1117/1.nph.4.4.041413. [DOI] [PMC free article] [PubMed] [Google Scholar]
- Ye JC, Tak S, Jang KE, Jung J, Jang J. NIRS-SPM: statistical parametric mapping for near-infrared spectroscopy. NeuroImage. 2009;44:428–447. doi: 10.1117/12.762291. [DOI] [PubMed] [Google Scholar]
- Yücel MA, Selb J, Cooper RJ, Boas DA. Targeted principle component analysis: A new motion artifact correction approach for near-infrared spectroscopy. Journal of Innovative Optical Health Sciences. 2014;7:1350066. doi: 10.1142/s1793545813500661. [DOI] [PMC free article] [PubMed] [Google Scholar]
- Zhao H, Cooper RJ. Review of recent progress toward a fiberless, whole-scalp diffuse optical tomography system. Neurophotonics. 2017;5(1):011012. doi: 10.1117/1.nph.5.1.011012. [DOI] [PMC free article] [PubMed] [Google Scholar]
- Zhang X, Noah JA, Hirsch J. Separation of the global and local components in functional near-infrared spectroscopy signals using principal component spatial filtering. Neurophotonics. 2016;3:015004. doi: 10.1117/1.nph.3.1.015004. [DOI] [PMC free article] [PubMed] [Google Scholar]
- Zhang Y, Brooks DH, Franceschini MA, Boas DA. Eigenvector-based spatial filtering for reduction of physiological interference in diffuse optical imaging. Journal of Biomedical Optics. 2005;10:011014–01101411. doi: 10.1117/1.1852552. [DOI] [PubMed] [Google Scholar]