Significance
X-ray diffraction is routinely used to monitor the ground-state electronic charge density of molecules or the motion of nuclei. In this work, we propose a spectroscopic measurement based on multidimensional photon-coincidence X-ray diffraction, which probes the correlation functions of the charge densities in momentum space. The inverse Fourier-transformed signal in real space, which is a combination of correlation functions of transition charge densities, allows us to identify the various scattering pathways that dominate the signal in momentum space and provides most valuable information on spontaneous electronic fluctuations and correlations.
Keywords: X-ray diffraction, photon-coincidence, multidimensional spectroscopy
Abstract
The ultrafast spontaneous electron-density fluctuation dynamics in molecules is studied theoretically by off-resonant multiple X-ray diffraction events. The time- and wavevector-resolved photon-coincidence signals give an image of electron-density fluctuations expressed through the four-point correlation function of the charge density in momentum space. A Fourier transform of the signal provides a real-space image of the multipoint charge-density correlation functions, which reveal snapshots of the evolving electron density in between the diffraction events. The proposed technique is illustrated by ab initio simulations of the momentum- and real-space inelastic scattering signals from a linear cyanotetracetylene molecule.
Time-resolved ultrafast X-ray diffraction is a rapidly developing technique (1–7). Recent advances include single-molecule diffraction (8–10) and multiple-photon coincidence detection (11, 12). It is now possible to envision time-resolved detection schemes involving repeated diffraction events on the same single molecule (13–16). Such measurements use several X-ray pulses with variable delays, each undergoing a diffraction event, whereby a photon is recorded in momentum space. Multidimensional diffraction signals (MDSs) given by multiple-point correlation functions of the charge-density operator are obtained when the photons are detected in coincidence. The detection of each photon can be described either in momentum space by considering directly the momentum-transfer vector, or in real space by a Fourier transform of the diffraction signal. Multiple photon-counting signals thus combine temporal, spatial, and momentum resolutions to provide valuable information on electronic and structural dynamics.
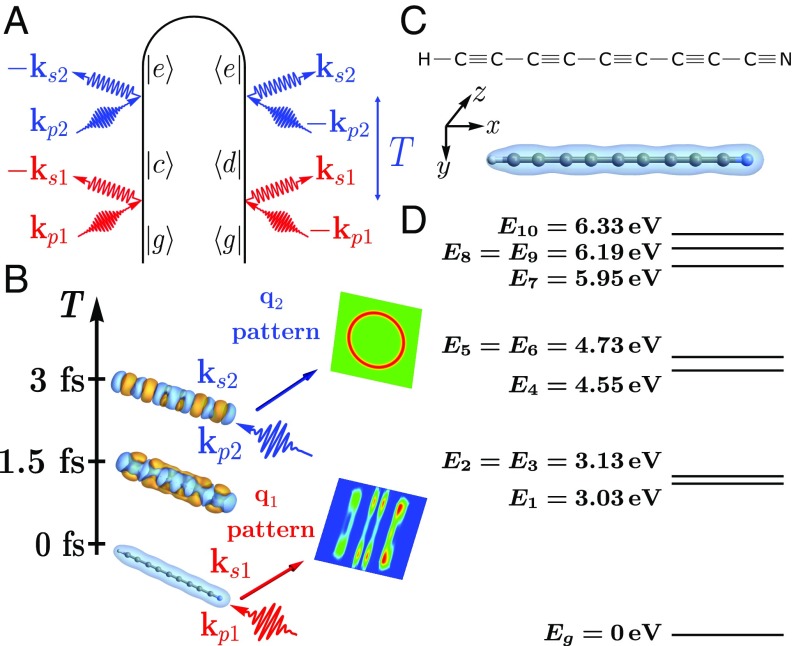
We shall focus on the 2D signal represented in Fig. 1A. Diffracted photons are recorded for various time delays, thereby directly monitoring the dynamical charge-density fluctuations. Generalization to -dimensional signals obtained by diffraction events is straightforward. The first scattering event transfers a momentum to the electrons and brings the molecule into a superposition state that is later detected by the second diffraction process. If the two diffraction events come from different molecules, the signal is independent on the delay and carries no additional information beyond ordinary 1D single diffraction. We are therefore interested in single-molecule contributions whereby the two diffraction events occur with the same molecule. In a system of molecules, the first contribution which scales as is much stronger than the second contribution that scales as . In a macroscopic ensemble, multiple diffraction events most likely occur on different molecules. The single-molecule contribution may be isolated by subtracting the two-molecule background (17, 18) which is independent on the time delay. Separating the background is easier in a few-molecule sample (small ). Sensitive detection (19) can be used in single-molecule samples where the two-molecule background does not exist.
Fig. 1.
(A) Loop diagram for off-resonant X-ray scattering from a single molecule detected by two-photon coincidence. The molecule is initially in the ground state . is the time delay between the two scattering events. (B) Schematic of the two-photon coincidence diffraction process. (C) Chemical structure of cyanotetracetylene () oriented in laboratory frame along with the ground-state charge density (isovalue of 0.05). The color scheme for the atoms is carbon (gray), hydrogen (white), and nitrogen (blue). (D) Energy levels of the ground () and excited () states.
Imaging atomic-resolution structure and following the dynamics of single molecules are now feasible, thanks to the major advances in X-ray free-electron lasers (17, 20–24) and detectors (10, 25–27). Sensitive single-photon counting detectors are now available, such as the Jungfrau detector developed by the detector group at the Paul Scherrer Institute (28). Single-molecule multidimensional X-ray diffraction has been proposed recently (14, 15). Here, we demonstrate how this technique may be used to transfer a controlled momentum to a molecule by the first scattering event and is able to detect in real-space correlation functions of the charge density. In the first diffraction event, a momentum is given to the electrons, thereby preparing the molecule in a superposition electronic state. The molecule then evolves freely for a delay , after which a second diffraction provides a momentum and so forth. This class of signals offers a great wealth of information, and an appropriate representation is needed for displaying them. Here, we develop a mixed momentum-space representation that gives a clear physical insight: The molecular dynamics is followed in real space after a given momentum has been transferred to the electrons. The MDS depends on the momentum transfers and times of all diffraction events . As shown in Fig. 1A, two interactions are needed to create each diffracted photon. An -photon-counting multiple diffraction is given by a correlation functions of charge density in momentum space. The correlation function of the multiple-photon diffraction thus involve an even number of charge densities. Various excitation and detection parameters, such as time, frequency, wavevector, polarization, and phase, can be used as control knobs.
We first introduce the two-photon coincidence signals and then demonstrate the physical insight gained on a linear molecule, cyanotetracetylene. The analysis of the density matrix and the sum-over-states expression for the signal allow us to identify the dominating pathways of the electron-density dynamics in momentum space. The time- and wavevector-resolved signal is obtained by eliminating the elastic scattering contribution. While the signal is highly dependent on the time-evolving charge densities, it is not obvious that the real-space transition charge densities can be recovered from the scattering patterns in momentum space. In this work, we show that the Fourier-transformed signal directly images the charge-density correlations in real space and provides valuable information about the various charge-density pathways between the diffraction events.
The 2D Photon-Coincidence Diffraction
The radiation–matter interaction is given by the minimal-coupling Hamiltonian (29–31)
| [1] |
Here, is the speed of light, and and are the electron charge and mass, respectively. and are the charge and current density operators, respectively, and is the radiation field vector potential. The first term in Eq. 1 dominates off-resonant scattering processes (32), which will be investigated in this work. The second term is responsible for resonant scattering processes and will be neglected hereafter. Anomalous diffraction involving both and interactions occurs in the near-resonant regime (32).
The matrix elements of the charge-density operator for an -electron system are given by
| [2] |
where is the many-electron wavefunction of electronic eigenstate , with as the electronic coordinates.
In a 2D coincidence measurement, two temporally well-separated pulses with wavevectors and and a delay are scattered off a single molecule. The scattered X-ray field intensities from the two diffraction events are recorded in coincidence. The process is described by loop diagram (33), as depicted in Fig. 1 A and B. The first diffraction transfers a momentum to the electrons which then evolve freely for a delay period until the second pulse is diffracted. The two scattered photons are collected in the directions or . When the molecule is initially in the ground state , the diffracted signal is given by the sum-over-states expression (15)
| [3] |
The indices , , and run over the valence molecular eigenstates, () is the spectral envelope of the -th incoming pulse, and is the corresponding detection frequency. is the transition charge density between states and with the scattering momentum transferred from the photon to the electrons. is the Fourier transform of . Eq. 3 shows that the time dependence of the signal originates from electronic coherences during the delay , while populations contribute to a constant background.
The two-photon coincidence signal can be alternatively displayed in a mixed representation obtained by a Fourier transform of Eq. 3 with respect to
| [4] |
where is the correlation function of transition charge densities in real space
| [5] |
and is defined by the convolution theorem. is a lineshape function
| [6] |
In a simple picture, when the electronic configurations of two states and only differ by two orbitals and , the transition charge density is given by . Thus, a real-space display of the transition charge density indicates where the charge movement has occurred during an electronic transition. The correlations between transition charge densities that are directly measured by the photon coincidence indicate how the electronic change occurring in two transitions differs. has been used to investigate the interplay between charge ordering and high-temperature superconductivity in cuprates (34), the correlated movement of electrons in solid-state plasmas (35), and the protein structural dynamics (36).
Application to Cyanotetracetylene
We have simulated the diffraction signals from cyanotetracetylene () (Fig. 1C), a linear polyynic molecule with alternating single and triple bonds. Its ground-state charge density has cylindrical symmetry. Its linear geometry allows a clear interpretation in both momentum and real space. This molecule was first detected in interstellar space (37) and has been studied both experimentally (38–42) and theoretically (43–47). We assume a single molecule oriented along in the laboratory frame as shown in Fig. 1C.
The X-ray scattering signals contain both elastic and inelastic contributions (48, 49). The former is expressed as the correlation function of the ground-state charge density in momentum space . The latter is given by correlation functions of the transition charge densities () responsible for the time-dependent features of the signal. The transition charge densities (i.e., off-diagonal elements of the charge-density operator) are smaller than their diagonal counterparts. The inelastic contribution is thus significantly weaker than the elastic one (14). The latter can be filtered out either by removing the time-independent contribution or by keeping the detection frequency outside the pulse bandwidth. Radiation damage is neglected since we focus on the ultrashort (less than a few femtoseconds) dynamics before the Coulombic explosion can take place (50–52).
The first X-ray pulse is a Gaussian propagating along
| [7] |
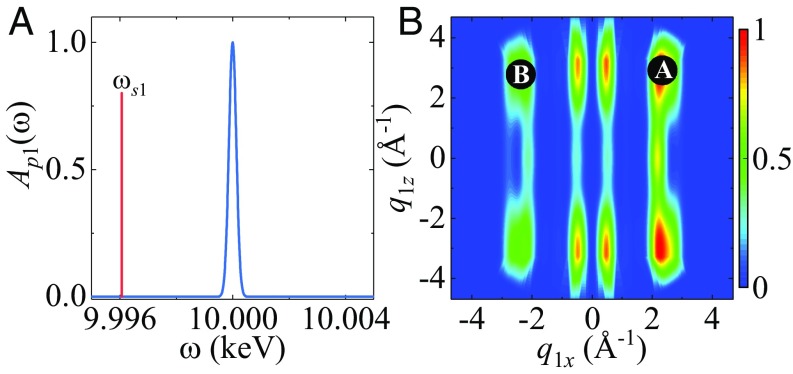
The central frequency is set to , and the pulse duration is . The detection frequency for the first scattered photon is , as marked by the red vertical line in Fig. 2A. Only the valence states within the pulse bandwidth () contribute to the inelastic scattering; Fig. 1D. The elastic scattering, which is times stronger than the inelastic, is eliminated. The scattering pattern is shown in Fig. 2B. Unlike elastic scattering, which is dominated by the ground-state charge density and strongly centered around the origin (14), the inelastic scattering has several peaks away from the origin.
Fig. 2.
Off-resonant scattering of a Gaussian X-ray pulse (Eq. 7) from . (A) The pump spectral envelope and the detected scattered frequency (red vertical line). (B) The ground-state scattering pattern created by the first pulse propagating along .
We have selected two points and from the scattering pattern indicated in Fig. 2B to apply the second scattering event. The molecule has received a known momentum from the first X-ray scattering and evolves freely in a superposition state until the next pulse arrives, where the superposition coefficients are given by
| [8] |
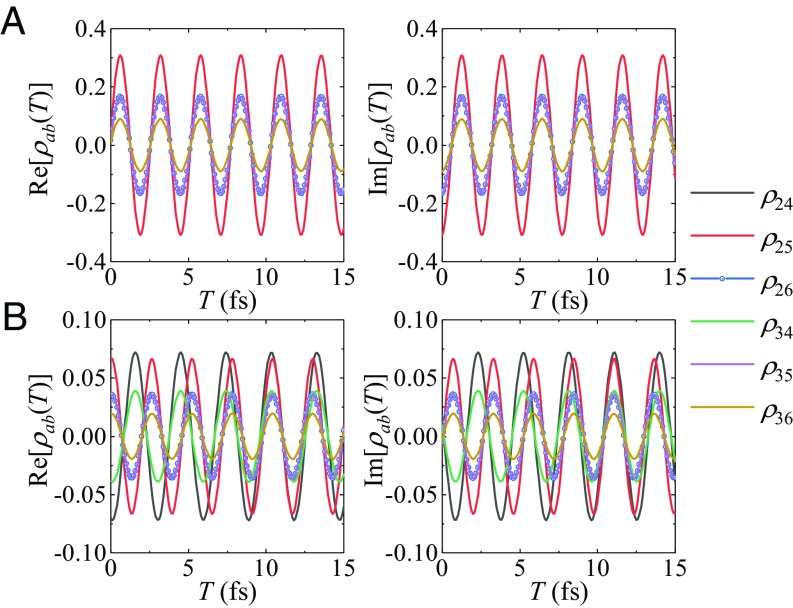
Fig. 3 depicts the time evolution of the six off-diagonal elements that dominate the signal. Note that the degenerate excited states ( and in Fig. 1D) do not contribute to the time dependence. The dominating elements are , , , and for point A; and , , , , , and for point B.
Fig. 3.
Time-dependent off-diagonal elements that dominate the dynamics of the signals for the two points A and B marked in Fig. 2B.
A broadband attosecond () off-resonant X-ray pulse is used to probe this electronic wavepacket. The scattered photon is detected at time in several directions . Fig. 4 depicts the scattering pattern in the plane for the two points labeled in Fig. 3B at three time delays . To highlight the changes, we plot the differences for signals at . As shown in Fig. 3, the off-diagonal density matrix elements for point B are smaller compared with A. The signal differences shown in Fig. 4 for point B are weaker than for point A. Several concentric circular rings are observed by pointing the second incoming pulse along the molecule main axis , reflecting the molecule’s cylindrical symmetry. However, when the pulse propagates along , two peaks instead of circular rings are observed at , due to the loss of cylindrical symmetry along . The scattered intensity variations with the time delay are depicted in Fig. 4. The time dependencies at points A and B are very different. For example, for the configuration ( and ) at point A, the signal difference preserves the sign at and , while the sign is reversed for the configuration at point B. This is because different electronic coherences are prepared at the two points, reflecting the different momenta transferred to the electrons by the first diffraction pulse at .
Fig. 4.
Two-photon coincidence scattering patterns for the two points marked in Fig. 2B at three time delays . Left shows the full signal . Center and Right show the signal difference .
The pathways that dominate the signal can be identified from the sum-over-states expression Eq. 3 (for details, see SI Appendix , Fig. S1). Take the configuration in Fig. 4 as an example. At the point A, the dominating pathways are , , and , which are time-independent, because the system is in a population after interaction with the pulse. By resorting to the signal difference , the time-independent pathways can be eliminated. The time dependence of the signal is dominated by the pathways and (and their complex conjugates). Conversely, at point B, the time dependence of the signal difference is dominated by pathways and (and their complex conjugates).
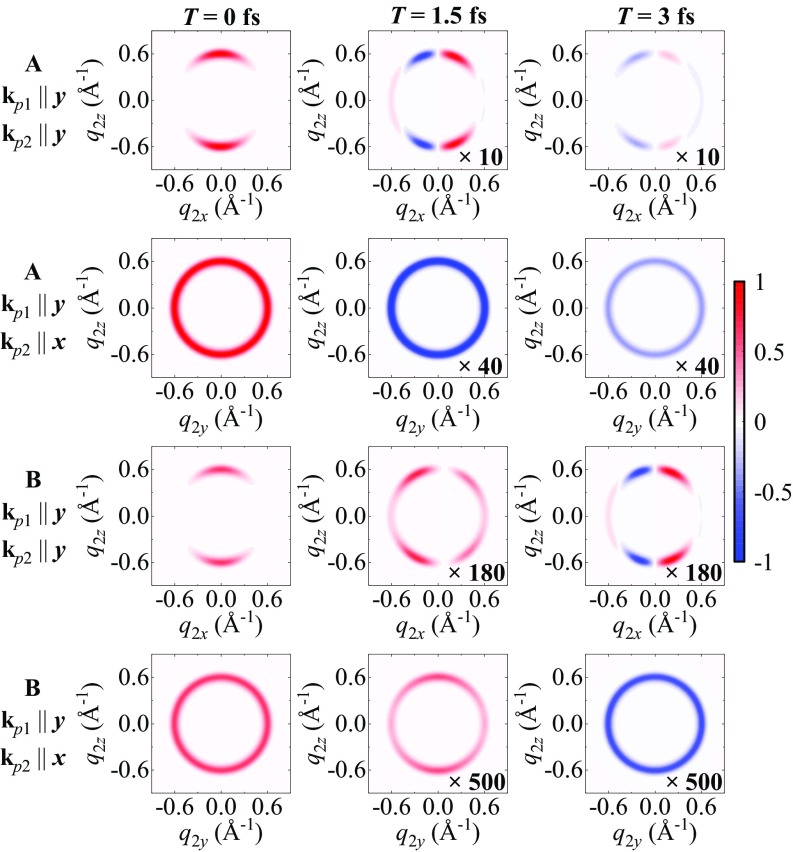
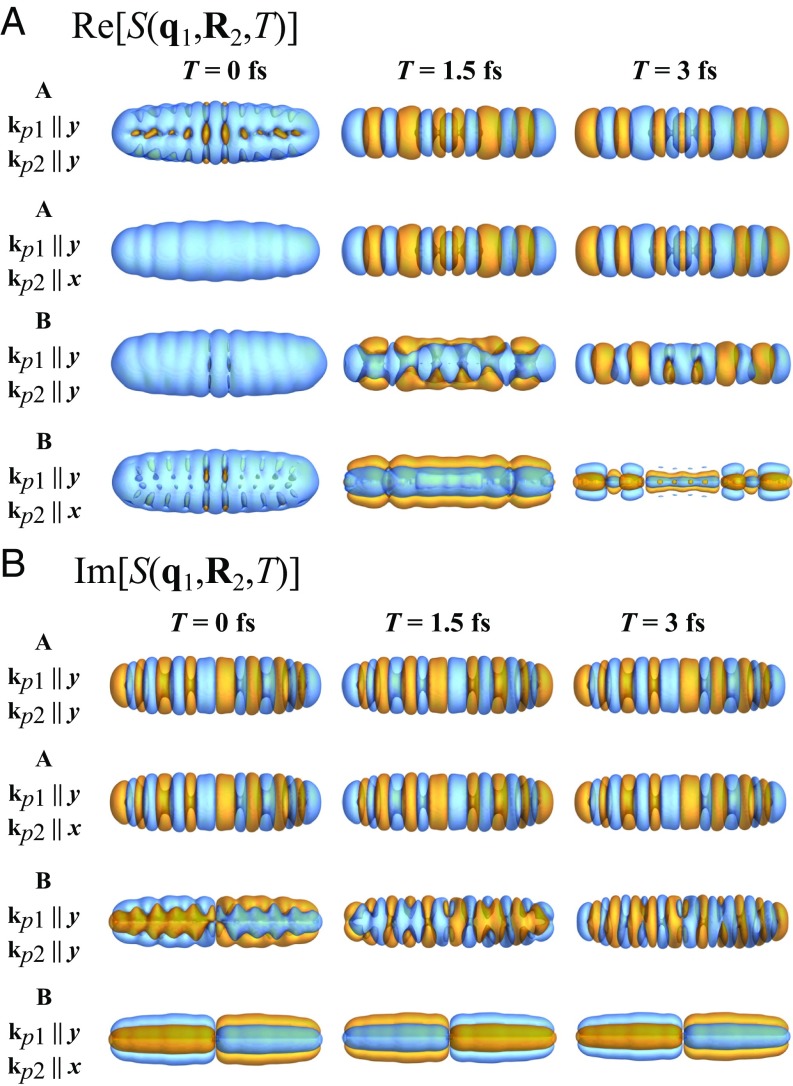
The homodyne-detected two-photon coincidence signal directly images the dynamics of charge-density correlations, corresponding to the scattering pathways in momentum space. Fig. 5 depicts snapshots of the real and the imaginary parts of two-photon coincidence signals vs. for the fixed . Since the diagonal elements of the density matrix (populations) are larger than the coherences with , the signals are dominated by the time-independent () pathways, and the time-independent charge-density correlation functions contribute substantially to the real part of the signals. To highlight the time variation of the signals, Fig. 5 displays in Left and the difference in Center and Right.
Fig. 5.
The real (A) and imaginary (B) parts of the real-space two-photon coincidence signal for points A and B marked in Fig. 2B at three time delays . To highlight the changes, A, Center and Right show the signal differences .
For the pulse configuration at point A, at lacks cylindrical symmetry along , because the charge-density correlation function makes a significant contribution to the signal, and the corresponding charge density is not cylindrically symmetric (SI Appendix, Fig. S2). The imaginary part of is a superposition of the time-dependent correlation functions of charge densities [i.e., with ] and strongly varies with time as shown in Fig. 5B. The signals are cylindrically symmetric along because all contributing transition charge densities have this symmetry. Conversely, for the configuration at point A, the corresponding signals are quite similar to those for the configuration, except for the full signal at . This is because the dominating scattering pathways for these two pulse configurations are the same except that the pathway only contributes to the signals for the configuration. This pathway and the corresponding correlation function are time-independent and do not contribute to the signals and , which can explain the similarities between the signals for the two pulse configurations. The real-space signals at point B can be analyzed similarly. Since different momenta are transferred to the electrons by the pulses, the signals at points A and B are very different, which result from the interference of different scattering pathways.
Conclusions
We have proposed a diffraction technique that makes use of emerging X-ray sources. We demonstrated the physical insight gained by this signal by simulating the off-resonant X-ray scattering signals Eq. 3 from a single linear molecule in the electronic ground state. In the inelastic scattering regime, the signal dynamics is determined by the transition charge densities rather than the diagonal elements of the charge-density matrix and reveals more information about the electronic excitations than the conventional X-ray diffraction. The time- and wavevector-resolved signals are detected by a two-photon coincidence measurement, which reveals the correlation functions of the charge densities in momentum space.
The aforementioned off-resonant X-ray scattering signal Eq. 3 uses homodyne detection, which does not provide the phase of the charge densities. Phase-retrieval algorithms may be used to overcome this problem (53–55). The real-space two-photon coincidence signal Eq. 4 is not a snapshot of the time-dependent charge density, but instead reflects the correlation between several transition charge densities. The signal shows an interference of various scattering pathways in momentum space. By using the density matrix and the sum-over-states expression Eq. 3, the time-dependent and -independent pathways can be clearly discriminated.
The inverse Fourier-transformed signals image the correlation function of charge densities in real space. The real part of the real-space signal is a sum of the time-dependent and -independent charge-density correlation functions, while the imaginary part contains only the time-dependent ones, which corresponds to the time-dependent scattering pathways in momentum space. Broadband attosecond X-ray pulses allow the visualization of time-dependent electron correlations on an ultrafast timescale. The real-space two-photon coincidence signals may be used to examine how correlation effects influence the dynamics of many-electron systems.
In this work, the scattered signal is obtained for a molecule initially in the ground state, and it thus only depends on a single time variable. More elaborate multidimensional measurements can be obtained by using coincidences involving more than two diffractions or by tuning the X-ray frequency at some core molecular resonance. We assume that the molecule is rigid. This simplifies the interpretation of the scattering patterns. It is possible to include nuclear motion between the two diffraction events, and the signal would then contain a signature of both nuclear and electronic wavepackets motion. Moreover, a dynamical process can also be launched by actinic pulses before or in between the scattering events (56). These protocols may offer fascinating new insights into the ultrafast electronic and nuclear dynamics of molecules.
Finally, the 2D diffraction signal presented here only provides even order correlation functions of the charge-density matrix elements that only depend on two wavevectors. Heterodyne detection scheme or incoming quantum state of light may reveal more general correlation functions.
Materials and Methods
The optimized geometry was obtained with density functional theory (DFT) with the functional B3LYP/6-311G(d,p) (57–59). Time-dependent DFT (TDDFT) CAM-B3LYP (60)/6-311G(d,p) calculations were then performed with the Tamm–Dancoff approximation (TDA) (61) by using the NWChem program package (62, 63). Ten valence-excited states were included in the simulations, with energies ranging from 3.03 to . The charge-density matrix elements between valence-excited states and were evaluated by using the configuration interaction coefficients from the TDDFT/TDA results.
Supplementary Material
Acknowledgments
This work was supported by Chemical Sciences, Geosciences, and Biosciences Division, Office of Basic Energy Sciences, Office of Science, US Department of Energy Awards (DOE) DE-FG02-04ER15571 and DE-SC0019484; and National Science Foundation Grant CHE-1663822. J.R.R. was supported by the DOE grant.
Footnotes
The authors declare no conflict of interest.
This article contains supporting information online at www.pnas.org/lookup/suppl/doi:10.1073/pnas.1816730116/-/DCSupplemental.
References
- 1.Rose-Petruck C, et al. Picosecond–milliångström lattice dynamics measured by ultrafast X-ray diffraction. Nature. 1999;398:310–312. [Google Scholar]
- 2.Tomov IV, Oulianov DA, Chen P, Rentzepis PM. Ultrafast time-resolved transient structures of solids and liquids studied by means of X-ray diffraction and EXAFS. J Phys Chem B. 1999;103:7081–7091. [Google Scholar]
- 3.Rousse A, Rischel C, Gauthier JC. Femtosecond X-ray crystallography. Rev Mod Phys. 2001;73:17–31. [Google Scholar]
- 4.Vrakking MJ, Elsaesser T. X-ray photonics: X-rays inspire electron movies. Nat Photonics. 2012;6:645–647. [Google Scholar]
- 5.Minitti MP, et al. Imaging molecular motion: Femtosecond X-ray scattering of an electrocyclic chemical reaction. Phys Rev Lett. 2015;114:255501. doi: 10.1103/PhysRevLett.114.255501. [DOI] [PubMed] [Google Scholar]
- 6.Glownia J, et al. Self-referenced coherent diffraction X-ray movie of ångstrom- and femtosecond-scale atomic motion. Phys Rev Lett. 2016;117:153003. doi: 10.1103/PhysRevLett.117.153003. [DOI] [PubMed] [Google Scholar]
- 7.Rouxel JR, Kowalewski M, Bennett K, Mukamel S. X-ray sum frequency diffraction for direct imaging of ultrafast electron dynamics. Phys Rev Lett. 2018;120:243902. doi: 10.1103/PhysRevLett.120.243902. [DOI] [PubMed] [Google Scholar]
- 8.Hajdu J. Single-molecule X-ray diffraction. Curr Opin Struct Biol. 2000;10:569–573. doi: 10.1016/s0959-440x(00)00133-0. [DOI] [PubMed] [Google Scholar]
- 9.Küpper J, et al. X-ray diffraction from isolated and strongly aligned gas-phase molecules with a free-electron laser. Phys Rev Lett. 2014;112:083002. [Google Scholar]
- 10.Miao J, Ishikawa T, Robinson IK, Murnane MM. Beyond crystallography: Diffractive imaging using coherent X-ray light sources. Science. 2015;348:530–535. doi: 10.1126/science.aaa1394. [DOI] [PubMed] [Google Scholar]
- 11.Singer A, et al. Hanbury Brown–Twiss interferometry at a free-electron laser. Phys Rev Lett. 2013;111:034802. doi: 10.1103/PhysRevLett.111.034802. [DOI] [PubMed] [Google Scholar]
- 12.Shabalin AG, et al. Revealing three-dimensional structure of an individual colloidal crystal grain by coherent X-ray diffractive imaging. Phys Rev Lett. 2016;117:138002. doi: 10.1103/PhysRevLett.117.138002. [DOI] [PubMed] [Google Scholar]
- 13.Mancuso AP, et al. Coherent-pulse 2D crystallography using a free-electron laser X-ray source. Phys Rev Lett. 2009;102:035502. doi: 10.1103/PhysRevLett.102.035502. [DOI] [PubMed] [Google Scholar]
- 14.Bennett K, Biggs JD, Zhang Y, Dorfman KE, Mukamel S. Time-, frequency-, and wavevector-resolved X-ray diffraction from single molecules. J Chem Phys. 2014;140:204311. doi: 10.1063/1.4878377. [DOI] [PMC free article] [PubMed] [Google Scholar]
- 15.Biggs JD, Bennett K, Zhang Y, Mukamel S. Multidimensional scattering of attosecond X-ray pulses detected by photon-coincidence. J Phys B At Mol Opt Phys. 2014;47:124037. [Google Scholar]
- 16.Gorobtsov OY, Lorenz U, Kabachnik NM, Vartanyants IA. Theoretical study of electronic damage in single-particle imaging experiments at X-ray free-electron lasers for pulse durations from 0.1 to 10 fs. Phys Rev E. 2015;91:062712. doi: 10.1103/PhysRevE.91.062712. [DOI] [PubMed] [Google Scholar]
- 17.Xu R, et al. Single-shot three-dimensional structure determination of nanocrystals with femtosecond X-ray free-electron laser pulses. Nat Commun. 2014;5:4061. doi: 10.1038/ncomms5061. [DOI] [PubMed] [Google Scholar]
- 18.Wiedorn MO, et al. Post-sample aperture for low background diffraction experiments at X-ray free-electron lasers. J Synchrotron Radiat. 2017;24:1296–1298. doi: 10.1107/S1600577517011961. [DOI] [PMC free article] [PubMed] [Google Scholar]
- 19.Sun Z, Fan J, Li H, Jiang H. Current status of single particle imaging with X-ray lasers. Appl Sci. 2018;8:132. [Google Scholar]
- 20.Chapman HN. X-ray imaging beyond the limits. Nat Mater. 2009;8:299–301. doi: 10.1038/nmat2402. [DOI] [PubMed] [Google Scholar]
- 21.Huang Z, Lindau I. Free-electron lasers: SACLA hard-X-ray compact FEL. Nat Photonics. 2012;6:505–506. [Google Scholar]
- 22.Peltz C, Varin C, Brabec T, Fennel T. Time-resolved X-ray imaging of anisotropic nanoplasma expansion. Phys Rev Lett. 2014;113:133401. doi: 10.1103/PhysRevLett.113.133401. [DOI] [PubMed] [Google Scholar]
- 23.Guetg MW, et al. Generation of high-power high-intensity short X-ray free-electron-laser pulses. Phys Rev Lett. 2018;120:014801. doi: 10.1103/PhysRevLett.120.014801. [DOI] [PubMed] [Google Scholar]
- 24.Seuring C, et al. Femtosecond X-ray coherent diffraction of aligned amyloid fibrils on low background graphene. Nat Commun. 2018;9:1836. doi: 10.1038/s41467-018-04116-9. [DOI] [PMC free article] [PubMed] [Google Scholar]
- 25.Sartini L, et al. GEMS: Underwater spectrometer for long-term radioactivity measurements. Nucl Instr Methods Phys Res A. 2010;626–627:S145–S147. [Google Scholar]
- 26.Esposito M. Photon-counting detectors for X-ray imaging. In: Russo P, editor. Handbook of X-Ray Imaging: Physics and Technology. CRC; Boca Raton, FL: 2017. pp. 239–260. [Google Scholar]
- 27.Hartmann N, et al. Attosecond time–energy structure of X-ray free-electron laser pulses. Nat Photonics. 2018;12:215–220. [Google Scholar]
- 28.Jungmann-Smith J, et al. Towards hybrid pixel detectors for energy-dispersive or soft X-ray photon science. J Synchrotron Radiat. 2016;23:385–394. doi: 10.1107/S1600577515023541. [DOI] [PMC free article] [PubMed] [Google Scholar]
- 29.Tanaka S, Chernyak V, Mukamel S. Time-resolved X-ray spectroscopies: Nonlinear response functions and Liouville-space pathways. Phys Rev A. 2001;63:063405. [Google Scholar]
- 30.Salam A. Molecular Quantum Electrodynamics: Long-Range Intermolecular Interactions. John Wiley & Sons; New York: 2010. [Google Scholar]
- 31.Chernyak VY, Saurabh P, Mukamel S. Non-linear non-local molecular electrodynamics with nano-optical fields. J Chem Phys. 2015;143:164107. doi: 10.1063/1.4934231. [DOI] [PubMed] [Google Scholar]
- 32.Schülke W. Electron Dynamics by Inelastic X-Ray Scattering. Vol 7 Oxford Univ Press; Oxford: 2007. [Google Scholar]
- 33.Mukamel S, Rahav S. Advances in Atomic, Molecular, and Optical Physics. Vol 59. Elsevier; Amsterdam: 2010. Ultrafast nonlinear optical signals viewed from the molecule’s perspective: Kramers–Heisenberg transition-amplitudes versus susceptibilities; pp. 223–263. [Google Scholar]
- 34.Comin R, et al. Broken translational and rotational symmetry via charge stripe order in underdoped YBa2Cu3O6+y. Science. 2015;347:1335–1339. doi: 10.1126/science.1258399. [DOI] [PubMed] [Google Scholar]
- 35.Schattschneider P, Lichte H. Correlation and the density-matrix approach to inelastic electron holography in solid state plasmas. Phys Rev B. 2005;71:045130. [Google Scholar]
- 36.Meisburger SP, Thomas WC, Watkins MB, Ando N. X-ray scattering studies of protein structural dynamics. Chem Rev. 2017;117:7615–7672. doi: 10.1021/acs.chemrev.6b00790. [DOI] [PMC free article] [PubMed] [Google Scholar]
- 37.Broten N, Oka T, Avery L, MacLeod J, Kroto H. The detection of HC9N in interstellar space. Astrophys J. 1978;223:L105–L107. [Google Scholar]
- 38.Iida M, Ohshima Y, Endo Y. Laboratory detection of HC9N using a Fourier transform microwave spectrometer. Astrophys J. 1991;371:L45. [Google Scholar]
- 39.McCarthy M, Levine E, Apponi A, Thaddeus P. Experimental structures of the carbon chains HC7N, HC9N, and HC11N by isotopic substitution. J Mol Spectrosc. 2000;203:75–81. doi: 10.1006/jmsp.2000.8149. [DOI] [PubMed] [Google Scholar]
- 40.Wakabayashi T, Saikawa M, Wada Y, Minematsu T. Isotope scrambling in the formation of cyanopolyynes by laser ablation of carbon particles in liquid acetonitrile. Carbon. 2012;50:47–56. [Google Scholar]
- 41.Forte G, et al. The effects of liquid environments on the optical properties of linear carbon chains prepared by laser ablation generated plasmas. Appl Surf Sci. 2013;272:76–81. [Google Scholar]
- 42.Szczepaniak U, Kołos R, Gronowski M, Guillemin JC, Crépin C. Low temperature synthesis and phosphorescence of methylcyanotriacetylene. J Phys Chem A. 2017;122:89–99. doi: 10.1021/acs.jpca.7b09728. [DOI] [PubMed] [Google Scholar]
- 43.Thaddeus P, McCarthy M. Carbon chains and rings in the laboratory and in space. Spectrochim Acta A Mol Biomol Spectrosc. 2001;57:757–774. doi: 10.1016/s1386-1425(00)00442-x. [DOI] [PubMed] [Google Scholar]
- 44.Qi J, Chen M, Wu W, Zhang Q, Au C. Parity alternation of interstellar molecules cyanopolyynes HCnN (n = 1–17) Chem Phys. 2009;364:31–38. [Google Scholar]
- 45.Vichietti RM, Haiduke RL. The infrared fundamental intensities of some cyanopolyynes. Spectrochim Acta A Mol Biomol Spectrosc. 2012;90:1–11. doi: 10.1016/j.saa.2012.01.005. [DOI] [PubMed] [Google Scholar]
- 46.Vichietti R, Haiduke R. A theoretical systematic study of a series of isocyanopolyynes. Spectrochim Acta A Mol Biomol Spectrosc. 2013;114:197–204. doi: 10.1016/j.saa.2013.05.066. [DOI] [PubMed] [Google Scholar]
- 47.Szczepaniak U, et al. Cryogenic photochemical synthesis and electronic spectroscopy of cyanotetracetylene. J Phys Chem A. 2017;121:7374–7384. doi: 10.1021/acs.jpca.7b07849. [DOI] [PubMed] [Google Scholar]
- 48.Dorfman KE, Bennett K, Zhang Y, Mukamel S. Nonlinear light scattering in molecules triggered by an impulsive X-ray Raman process. Phys Rev A. 2013;87:053826. doi: 10.1103/PhysRevA.87.053826. [DOI] [PMC free article] [PubMed] [Google Scholar]
- 49.Bennett K, Kowalewski M, Mukamel S. Probing electronic and vibrational dynamics in molecules by time-resolved photoelectron, Auger-electron, and X-ray photon scattering spectroscopy. Faraday Disc. 2015;177:405–428. doi: 10.1039/c4fd00178h. [DOI] [PMC free article] [PubMed] [Google Scholar]
- 50.Son SK, Young L, Santra R. Impact of hollow-atom formation on coherent X-ray scattering at high intensity. Phys Rev A. 2011;83:033402. [Google Scholar]
- 51.Motomura K, et al. Sequential multiphoton multiple ionization of atomic argon and xenon irradiated by X-ray free-electron laser pulses from SACLA. J Phys B At Mol Opt Phys. 2013;46:164024. [Google Scholar]
- 52.Murphy B, et al. Femtosecond X-ray-induced explosion of at extreme intensity. Nat Commun. 2014;5:4281. doi: 10.1038/ncomms5281. [DOI] [PubMed] [Google Scholar]
- 53.Miao J, Charalambous P, Kirz J, Sayre D. Extending the methodology of X-ray crystallography to allow imaging of micrometre-sized non-crystalline specimens. Nature. 1999;400:342–344. [Google Scholar]
- 54.Elser V. Phase retrieval by iterated projections. J Opt Soc Am A. 2003;20:40–55. doi: 10.1364/josaa.20.000040. [DOI] [PubMed] [Google Scholar]
- 55.Miao J, Ishikawa T, Anderson EH, Hodgson KO. Phase retrieval of diffraction patterns from noncrystalline samples using the oversampling method. Phys Rev B. 2003;67:174104. [Google Scholar]
- 56.Bennett K, Kowalewski M, Rouxel JR, Mukamel S. Monitoring molecular nonadiabatic dynamics with femtosecond X-ray diffraction. Proc Natl Acad Sci USA. 2018;115:6538–6547. doi: 10.1073/pnas.1805335115. [DOI] [PMC free article] [PubMed] [Google Scholar]
- 57.Becke AD. Density-functional thermochemistry. III. The role of exact exchange. J Chem Phys. 1993;98:5648–5652. [Google Scholar]
- 58.Stephens P, Devlin F, Chabalowski C, Frisch MJ. Ab initio calculation of vibrational absorption and circular dichroism spectra using density functional force fields. J Phys Chem. 1994;98:11623–11627. [Google Scholar]
- 59.Yang W, Ayers PW. Computational Medicinal Chemistry for Drug Discovery. CRC; Boca Raton, FL: 2003. Density-functional theory; pp. 103–132. [Google Scholar]
- 60.Yanai T, Tew DP, Handy NC. A new hybrid exchange–correlation functional using the Coulomb-attenuating method (CAM-B3LYP) Chem Phys Lett. 2004;393:51–57. [Google Scholar]
- 61.Hirata S, Head-Gordon M. Time-dependent density functional theory within the Tamm–Dancoff approximation. Chem Phys Lett. 1999;314:291–299. [Google Scholar]
- 62.Valiev M, et al. NWChem: A comprehensive and scalable open-source solution for large scale molecular simulations. Comput Phys Commun. 2010;181:1477–1489. [Google Scholar]
- 63.Lopata K, Van Kuiken BE, Khalil M, Govind N. Linear-response and real-time time-dependent density functional theory studies of core-level near-edge X-ray absorption. J Chem Theory Comput. 2012;8:3284–3292. doi: 10.1021/ct3005613. [DOI] [PubMed] [Google Scholar]
Associated Data
This section collects any data citations, data availability statements, or supplementary materials included in this article.


