

Abstract
Introduction:
The level of the presynaptic protein growth-associated protein 43 (GAP-43) in cerebrospinal fluid (CSF) has previously been shown to be increased in Alzheimer’s disease (AD) and thus may serve as an outcome measure in clinical trials and facilitate earlier disease detection.
Methods:
We developed an enzyme-linked immunosorbent assay for CSF GAP-43 and measured healthy controls (n = 43), patients with AD (n = 275), or patients with other neurodegenerative diseases (n = 344). In a subpopulation (n = 93), CSF GAP-43 concentrations from neuropathologically confirmed cases were related to Aβ plaques, tau, α-synuclein, and TDP-43 pathologies.
Results:
GAP-43 was significantly increased in AD compared to controls and most neurodegenerative diseases and correlated with the magnitude of neurofibrillary tangles and Aβ plaques in the hippocampus, amygdala, and cortex. GAP-43 was not associated to α-synuclein or TDP-43 pathology.
Discussion:
The presynaptic marker GAP-43 is associated with both diagnosis and neuropathology of AD and thus may be useful as a sensitive and specific biomarker for clinical research.
Keywords: GAP-43, CSF biomarker, Alzheimer’s disease, Differential diagnosis, Enzyme-linked immunosorbent assay
1. Background
Alzheimer’s disease (AD) patients constitute a heterogeneous group, and patients with other neurodegenerative diseases such as frontotemporal lobar degeneration (FTD), dementia with Lewy bodies (DLB), and Parkinson’s disease (PD) often display similar symptoms and mixed pathologies, which complicates the diagnosis [1,2]. In addition to clinical evaluation, three core cerebrospinal fluid (CSF) biomarkers are currently used for diagnosis of AD; the 42 amino acid form of amyloid β (Aβ42), total-tau (T-tau), and phosphorylated tau (P-tau), reflecting amyloid pathology, neurodegeneration, and tangle pathology, respectively, are included in the diagnostic criteria for AD [3,4]. Recently, disease-modifying drugs targeting Aβ pathology, such as β-secretase inhibitors and the anti-Aβ antibody aducanumab, have shown promising results [5,6] highlighting an increasing need to correctly identify patients with AD pathology. Furthermore, such therapeutics is expected to be most effective at the early stages of AD before neuronal damage is too widespread.
It is known that pathological changes due to AD occur long before clinical symptoms appear. Therefore, it is important to diagnose patients as early as possible. It is widely recognized that synaptic dysfunction is an early core feature of AD and synaptic dysfunction and loss is highly correlated to cognitive decline [7–10]. Thus, additional biomarkers reflecting synaptic dysfunction and loss may further improve differential diagnosis, be useful as outcome markers in clinical trials, provide novel disease stage information, and enable earlier diagnosis in combination with the core biomarkers.
Growth-associated protein 43 (GAP-43) is a presynaptic protein highly expressed during neuronal development and synaptogenesis and thereafter in the hippocampus and association cortices in the adult human brain [11–13]. Furthermore, GAP-43 is involved in the regulation of axonal outgrowth, synaptic plasticity, and learning and memory functions [14–19], and previous postmortem brain studies of GAP-43 reported decreased protein expression in frontal cortex and regional increases in the hippocampus of patients with AD [20–22]. In a recent explorative study including 280 proteins, it was shown that the fluorescence intensity per bead identity and sample for CSF GAP-43 was increased in preclinical and clinical AD compared to controls, while there were no significant changes in PD or DLB patients compared to controls [23]. However, assay characterization was not provided. Previous CSF quantification of GAP-43 in the early 2000s showed a decrease in PD but normal or only slightly increased concentration in AD compared to neurological controls [24,25]. Discrepancies between the studies may be due to assay differences or the lack of knowledge at the time regarding differential diagnosis leading to mixed patient cohorts. Current knowledge on differential diagnosis allows for more homogeneous patient cohorts, which increases the chances of finding actual AD-specific biomarkers. Therefore, we developed and validated a novel enzyme-linked immunosorbent assay (ELISA) for quantification of GAP-43 in CSF and analyzed a large, well-characterized cohort including controls and clinically diagnosed AD patients and other dementia patients. A subpopulation of patients was neuropathologically assessed for amyloid, tau, α-synuclein, TDP pathology, and neuron loss in several different brain regions allowing for the first time an evaluation of associations between CSF GAP-43 concentration and several dementia pathologies. Furthermore, GAP-43 CSF concentration was tested for association with global cognition and decline over a 2-year period using the Mini–Mental State Examination (MMSE) score. The following hypotheses were tested: (1) CSF GAP-43 is especially affected in AD and useful for differential diagnosis; (2) CSF GAP-43 quantification is associated to cognitive decline; and (3) CSF GAP-43 is associated with AD pathology.
2. Methods
2.1. Participants
2.1.1. Pilot study
The pilot study included 15 AD patients and 12 controls. Demographics are summarized in Supplementary Table 1. Aβ42, T-tau, and P-tau were used for neurochemical classification of the patients into AD or control groups.
2.1.2. Clinical validation study
The clinical validation study included 662 participants from the University of Pennsylvania Integrated NeuroDegenerative Disease Database [26], comprising participants without signs of neurodegenerative diseases serving as controls (n = 43), mild cognitive impairment (MCI) (n = 84), AD (n = 275), amyotrophic lateral sclerosis (ALS) (n = 53, of which ALS with MCI n = 3, ALS with FTD n = 9), behavioral variant FTD (bvFTD, n = 39), noncognitively impaired PD (n = 28), PD with MCI (n = 14), PD with dementia (n = 15), DLB (n = 27), logopenic variant of primary progressive aphasia (lvPPA, n = 10), semantic dementia variant of primary progressive aphasia (svPPA, n = 16), progressive nonfluent aphasia variant of primary progressive aphasia (naPPA, n = 15), progressive supranuclear palsy (n = 18), corticobasal syndrome (n = 19), and posterior cortical atrophy (PCA, n = 6) patients. CSF sampling was performed according to standard operating procedures of the Alzheimer’s Disease Neuroimaging Initiative (www.adni-info.org/).
MMSE score was available for 593 subjects. Two-year follow-up MMSE scores were available for 305 subjects, and the decline in MMSE score per year was used to analyze the association between GAP-43 and cognitive decline.
In 93 patients, Braak neurofibrillary tau staging and Consortium to Establish a Registry for Alzheimer’s Disease (CE-RAD) score was performed as previously described [26]. Furthermore, postmortem examination and scoring of tau, thioflavin/amyloid, α-synuclein, and TDP-43 pathology, as well as amyloid angiopathy, gliosis, and neuron loss, was carried out on brain sections from 17 brain regions: amygdala, cornu ammonis/subiculum-hippocampus, entorhinal cortex-hippocampus, midfrontal cortex, angular gyrus, superiormidtemporal cortex, anterior cingulate cortex, occipital (visual, calcarine) cortex, caudate/putamen, globus pallidus, thalamus, midbrain, substantia nigra–midbrain, pons, locus coeruleuspons, medulla, and dentate nucleuscerebellum. Sections were processed and histologically (thioflavin S) or immunohistochemically stained (phosphorylated tau, α-synuclein, TDP-43) and graded using a five-point scale (0 = none, 0.5 = rare, 1 = mild, 2 = moderate, 3 = severe) as previously described [26,27]. GAP-43 concentrations across this scale were compared for the mentioned stains across the 17 brain regions, after merging data from points 0 and 0.5 due to low numbers. Genomic DNA was extracted as described elsewhere [26], for determination of APOE allele status using two SNPs (rs7412 and rs429358), genotyped by TaqMan allelic discrimination as-says (Thermo-Fisher, USA).
2.2. Ethics
The pilot study on leftover aliquots from clinical routine analyses followed a procedure approved by the Ethics Committee at University of Gothenburg (EPN140811). The clinical validation study was conducted in accordance with the provisions of the Helsinki declaration and approved by regional ethics committee.
2.3. AD biomarker quantification
In the clinical validation study, quantification of CSF T-tau, P-tau, and Aβ42 was performed on the Luminex platform (Luminex Corporation, Austin, TX) using the multiplexed AlzBio3 (Fujirebio, Ghent, Belgium) kit as instructed in kit inserts. For biomarker correlation analysis, ALS patients were merged, due to the low number of patients per group. Patients with variants of primary progressive aphasia were similarly merged for correlation analysis.
2.4. Brain homogenization, western blotting, and immunoprecipitation
Brain samples were taken from the superior parietal gyrus of AD subjects. Homogenization of brain tissue, western blotting, and immunoprecipitation of CSF was performed as previously described [28], with minor modifications (see Supplementary Material for a detailed description). Full-length recombinant GAP-43 protein was produced in house (see Supplementary Material) and compared to endogenous GAP-43 protein by western blotting in the brain and CSF.
2.5. In-house GAP-43 sandwich ELISA
The ELISA was developed in house combining the mouse monoclonal GAP-43 antibody NM4 (Fujirebio) and a polyclonal GAP-43 antibody (ABB-135, Nordic Biosite, Täby, Sweden) with a C-terminal epitope. For detailed description, see Supplementary Material. The analyses were performed by board-certified laboratory technicians blinded to clinical information. During sample runs in the clinical evaluation study, the repeatability CV% of control samples, with the concentrations 3157 pg/mL and 857 pg/mL, was 5.5% versus 11% and the interassay CV% was 6.9% versus 15.6% across 18 ELISA plates.
2.6. In-house GAP-43 ELISA validation
The performance of the novel ELISA was evaluated using leftover CSF samples from clinical routine of the Neurochemistry laboratory, Sahlgrenska University Hospital, Mölndal, Sweden (see Supplementary Material for an evaluation of precision, LLOQ, recovery, and sample dilution linearity).
2.7. Statistical analysis
Statistical analysis was performed using SPSS version 23.00 (IBM, NY, USA) and GraphPad Prism 7.0 (GraphPad Inc., CA, USA). As the biomarker data were not normally distributed, nonparametric statistics were used. Unless otherwise stated, demographics and clinical characteristics were summarized using medians and interquartile ranges for biomarkers and analyzed by Mann-Whitney U-test, Kruskal-Wallis test, and chisquare test. Comparisons of biomarker concentrations were performed using Kruskal-Wallis test and Spearman rank correlations. Statistical tests were two sided with significance threshold value of P < .05. The significance level was adjusted to P < .003 to compensate for multiple comparisons for associations of CSF GAP-43 and pathology severity across 17 brain regions.
3. Results
3.1. GAP-43 detection in brain and CSF by western blotting
To ensure specificity of the antibodies used for quantification of GAP-43 by ELISA, brain and CSF samples were processed for western blotting and GAP-43 was detected as a single band around 43 kDa in soluble and insoluble protein fractions of brain extracts by the antibodies NM4 and ABB-135 (Supplementary Fig. 1A). After immunoprecipitation of CSF with the same antibodies, a band corresponding to GAP-43 was detected aligning with that of recombinant GAP-43 (Supplementary Fig. 1B).
3.2. In-house ELISA characterization
Results from assay characterization are summarized in Supplementary Table 2. CSF GAP-43 quantification with NM4-ABB135 immunoassay was stable after one to four freeze thaw cycles (n = 9; 100.9%–107.9%), and various storage temperatures (n = 7; 94.8%–103.5%, percentage of ‒80° C stored aliquot concentration).
3.3. Two-fold increase of GAP-43 in AD pilot study
The novel GAP-43 ELISA was tested in a pilot study including 12 AD patients and 15 control subjects. Control subjects were significantly younger than AD subjects; how-ever, no correlation of GAP-43 with age was detected. CSF GAP-43 concentration was twofold higher in the AD patients compared to controls (P = .001, Supplementary Fig. 2). Based on these results, a clinical follow-up study was performed to validate the findings.
3.4. Demographics of clinical validation study
Demographics of participants in the validation study are provided in Table 1. The clinical AD group was age and gender matched to controls and MCI patients. Age correlated weakly with CSF GAP-43 across the study population (rs = 0.11, P =.004), but not in separate clinical diagnostic groups. Across all diagnostic groups, GAP-43 concentrations were higher in females than in males (median female: 2880 pg/mL, median male: 2547 pg/mL, P = .001) and remained significant only in the AD group after division by clinical diagnosis (median AD female: 3489 pg/mL, median AD male: 3023 pg/mL, P =.017). No statistically significant differences in GAP-43 concentrations were detected based on ethnicity, education years, handedness, or MAPT H1/H2 haplotypes.
Table 1.
Demographics of participants in the clinical evaluation study
| Patient group | No. | Age (mean, SD) | Gender (F%) |
APOE ε4 alleles (%) |
MMSE score (%, mean, SD) | GAP-43 (pg/mL) | T-tau (pg/mL) | Aβ1−42 (pg/mL) | P-tau (pg/mL) | ||
|---|---|---|---|---|---|---|---|---|---|---|---|
| 0 | 1 | 2 | |||||||||
| Control | 43 | 69 (9.1) | 69.8 | 70.7 | 26.8 | 2.3 | 28.9 (2.4) | 2334±(1104) | 52±(25) | 250±(111) | 17±(10) |
| MCI | 84 | 72 (8.9) | 46.4* | 51.2 | 27.4 | 3.6 | 26.1 (3.5) | 2372±(1972) | 58±(54) | 176±(104) | 16±(25) |
| AD | 275 | 71.2 (9.2) | 58.2 | 34.2 | 38.5 | 13.1 | 21.2 (5.8) | 3202±(1800) | 106±(81) | 135±(57) | 37±(29) |
| ALS | 53 | 58 (11.5)*,††† | 26.4***,††† | 73.6 | 20.8 | 1.9 | 26.8 (4) | 2078±(1228) | 49±(33) | 272±(104) | 11±(6) |
| FTD | 39 | 61 (7.7)*,††† | 30.8**,†† | 66.7 | 25.6 | 2.6 | 25.4 (3.6) | 2319±(1274) | 62±(38) | 243±(145) | 14±(10) |
| PD | 28 | 65.9 (7.2) | 32.1**,† | 85.7 | 10.7 | / | 28.7 (1.6) | 2349±(1033) | 45±(21) | 283±(64) | 18±(15) |
| PD-MCI | 14 | 63.4 (5.7) | 14.3**,† | 61.5 | 38.5 | / | 28.4 (1.3) | 2022±(812) | 39±(19) | 214±(71) | 18±(20) |
| PD-demented | 15 | 74.3 (6.9) | 20*,† | 66.7 | 33.3 | / | 25.6 (4.6) | 2550±(1038) | 47±(32) | 262±(72) | 22±(14) |
| DLB | 27 | 73 (9.2) | 44.4 | 44.4 | 29.6 | 7.4 | 19.4 (6.6) | 2195±(2303) | 51±(50) | 414±(38) | 15±(22) |
| PPA (logopenic) | 10 | 62.6 (6.1) | 60 | 33.3 | 66.7 | / | 22.5 (5.7) | 3350±(2346) | 139±(64) | 131±(31) | 39±(16) |
| PPA (PNFA) | 16 | 63.7 (9.4) | 43.3 | 43.8 | 43.8 | 12.5 | 22.5 (4.9) | 2350±(1851) | 59±(45) | 224±(110) | 17±(17) |
| PPA (SD) | 15 | 62.5 (8.1) | 66.7 | 80 | 13.3 | 6.7 | 22.9 (5.3) | 3040±(2212) | 94±(62) | 289±(101) | 15±(13) |
| PSP | 18 | 70.2 (9.2) | 55.6 | 88.9 | 11.1 | 0 | 26.4 (4.3) | 1772±(1811) | 50±(39) | 210±(144) | 12±(8) |
| CBS | 19 | 66.2 (7.2) | 57.9 | 73.7 | 21.1 | 5.3 | 24.5 (4) | 3200±(2103) | 76±(45) | 225±(109) | 21±(13) |
| PCA | 6 | 60 (6.2) | 83.3 | 50 | 33.3 | 0 | 22.8 (5.5) | 2264±(1859) | 53±(82) | 206±(184) | 26±(26) |
Abbreviations: SD, standard deviation; F, female; MMSE, Mini–Mental State Examination; GAP-43, growth-associated protein 43; MCI, mild cognitive impairment; AD, Alzheimer’s disease; ALS, amyotrophic lateral sclerosis; FTD, frontotemporal dementia; PD, Parkinson’s disease; DLB, dementia with Lewy bodies; PPA, primary progressive aphasia; PSP, progressive supranuclear palsy; CBS, corticobasal syndrome; PCA, posterior cortical atrophy.
NOTE. Biomarker concentrations are median and interquartile range.
NOTE.
Indicates differences compared to control group
P < .05. †Indicates differences compared to Alzheimer’s disease group
P <.05
P < .001
P < .0001.
3.5. CSF GAP-43 concentration in AD and MCI patients
CSF GAP-43 concentrations were significantly increased in clinical AD patients compared to controls (P <.0001), but not in clinical MCI patients (Fig. 1A). Of all the patients included in the study, 56 had a definitive Alzheimer’s neuropathological diagnosis, and there was a trend toward increased CSF GAP-43 concentrations in this group compared to clinical AD. To identify possible clinical misdiagnosed patients, a neurochemical cutoff based on the INNO-BIA AlzBio3 T-tau/Aβ42 ratio (AD positive: ratio >0.48, T-tau: 93 pg/mL and Aβ42: 192 pg/mL) suggested by Shaw et al. [29] was applied to the clinical AD group. The ratio identified 209 biomarker-defined AD biomarker-positive patients out of the 275 clinically diagnosed patients and CSF GAP-43 concentrations were significantly higher in AD biomarker-positive compared to biomarker-negative clinical AD patients (P <.001, Fig. 1B). Furthermore, patients without a positive T-tau/Aβ42 ratio displayed GAP-43 concentrations equal to controls (Fig. 1B). MCI patients were similarly divided by the T-tau/Aβ42 cutoff, and the biomarker-positive MCI group had significantly increased CSF GAP-43 concentrations compared to the biomarker-positive MCI group (P <.0001, Fig. 1C).
Figure 1, Clinical evaluation of CSF GAP-43 quantification in control, MCI and Alzheimer’s disease and differential diagnoses to Alzheimer’s disease.
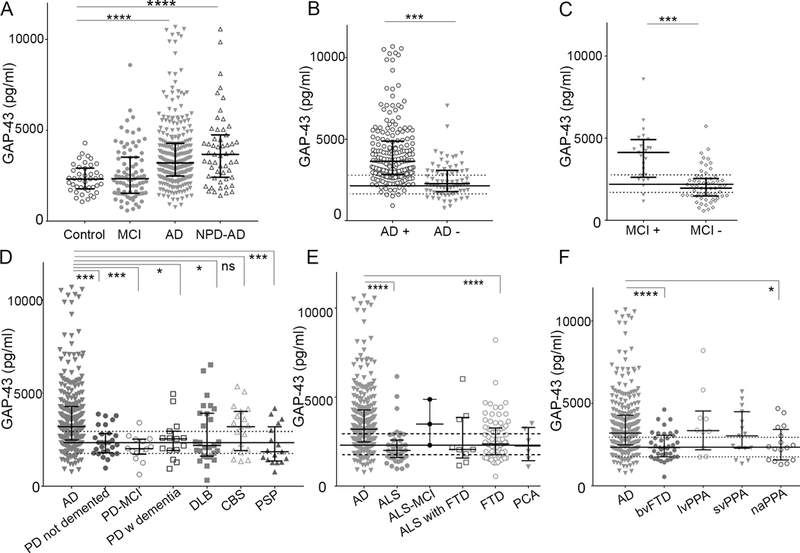
A, CSF GAP-43 concentration was increased in patients with a clinical Alzheimer’s disease diagnosis, whereas clinical MCI patients were similar to control level. The median CSF GAP-43 concentration was particularly increased in a group of AD patients with a neuropathologically confirmed AD diagnosis (NPD AD). B, Applying a neurochemical cut off (IB AlzBio3 T-Tau/ IB AlzBio3 Aβ42 ratio (>0.48 = AD)), identified a large proportion of clinical Alzheimer’s disease patients with lower GAP-43 concentrations which were biomarker negative. C, MCI patients with a T-tau/Aβ42 ratio above the cut off had increased GAP-43 concentration whereas MCI patients below the cut off were similar to control. D, CSF GAP-43 concentration was increased in clinical AD patients compared to PD patients without dementia, with MCI or demented, DLB patients and progressive supranuclear palsy, whereas patients with CBS displayed comparable levels. E, CSF GAP-43 concentration was increased in clinical AD patients compared to ALS and FTD, whereas there was no significant difference to ALS with MCI, ALS with FTD, and PCA patients. F, CSF GAP-43 concentration was increased in clinical AD patients compared to bvFTD and naPPA, whereas lvPPA and sdPPA variants displayed comparable levels. The solid and dotted lines indicate the median and IQR of the neurochemical control group. Concentrations are medians with interquartile range. *; p<0.05, ***: p<0.001, ****: p<0.0001, ns: not significant. AD: Alzheimer’s disease, NPD AD: neuropathologically confirmed Alzheimer’s disease, MCI: mild cognitive impairment, AD + : Clinical Alzheimer’s disease patients with a positive T-Tau/Aβ42 ratio, AD - : Clinical Alzheimer’s disease patients with a negative T-Tau/Aβ42 ratio, MCI + : Clinical MCI patients with a positive T-Tau/Aβ42 ratio, MCI - : Clinical MCI patients with a negative T-Tau/Aβ42 ratio, PD: Parkinson’s disease, PSP: progressive supranuclear palsy, ALS: Amyotrophic lateral sclerosis, bvFTD: behavioural variant frontotemporal lobar degeneration, PCA: primary cortical atrophy, lvPPA: logopenic variant of primary progressive aphasia, sdPPA: semantic dementia variant of primary progressive aphasia, naPPA: progressive nonfluent aphasia variant of primary progressive aphasia.
3.6. CSF GAP-43 concentration in AD differential diagnoses
Apart from AD patients, only lvPPA patients had altered CSF GAP-43 concentration compared to controls (P = .01, Fig. 1F). The CSF GAP-43 concentrations in AD patients were compared in three subgroups of differential diagnoses: (1) Parkinsonian disorders and Parkinson’s disease; (2) ALS; and (3) atypical AD and subgroups of FTD diagnoses.
CSF GAP-43 concentrations in clinical AD patients were significantly increased compared to both Parkinson’s disease and Parkinsonian disorders (nondemented P = .0002, demented P = .027, with MCI; P = .0002), DLB (P =.018), and progressive supranuclear palsy (P =.0004), while there were no differences in the concentrations between AD and corticobasal syndrome patients (P > .99, Fig. 1D). Eighteen percent of corticobasal syndrome patients had a T-tau/Aβ42 ratio indicative of AD.
ALS (P <.0001) and bvFTD (P <.0001) both had significantly lower GAP-43 concentrations compared to AD (Fig. 1E and F). The ALS patients with additional MCI or additional FTD were not significantly different from AD patients (P > .999 and P = .138, respectively, Fig. 1E).
The FTD spectrum includes several related disorders in which progressive degeneration of the frontal and temporal lobes is common [30,31]. On the basis of clinical phenotypes, we compared AD to FTD subgroups and atypical AD; PCA, bvFTD, and PPA of which the later was further divided into naPPA, lvPPA, and svPPA [30]. naPPA had significantly lower GAP-43 concentrations (P = .022, Fig. 1F), whereas PCA (P = .182), lvPPA, and svPPA patients had similar CSF GAP-43 concentrations as AD patients (both P > .99, Fig. 1F). Seventy percent of patients with lvPPA and 13% of patients with svPPA had T-tau/Aβ42 ratios indicative of AD.
3.7. CSF GAP-43 concentration correlates with core AD biomarkers
Biomarker correlations were performed in patient groups with at least 10 patients and are presented in detail in Table 2. Strong correlations were found between GAP-43 and T-tau in all clinical groups. Furthermore, GAP-43 correlated moderately with P-tau in MCI patients, AD, ALS, DLB, progressive supranuclear palsy, PD with MCI, and weakly in FTD patients and controls. A weak negative correlation was found between GAP-43 concentration and Ab42 in clinical AD and surprisingly a moderate positive correlation with Ab42 in ALS patients (Table 2).
Table 2.
Spearman’s correlation analysis of GAP-43 concentration with CSF biomarkers of Alzheimer’s disease pathology
| IB AlzBio3 T-tau (pg/mL) |
IB AlzBio3 Aβ42 (pg/mL) |
IB AlzBio3 PTau (pg/mL) |
|||||||
|---|---|---|---|---|---|---|---|---|---|
| Diagnostic group | rs | P | n | rs | P | n | rs | P | n |
| Control | 0.841 | <.0001 | 42 | −0.083 | .595 | 43 | 0.356 | .019 | 43 |
| All MCI | 0.908 | <.0001 | 83 | −0.066 | .551 | 83 | 0.649 | <.0001 | 83 |
| AD | 0.818 | <.0001 | 261 | −0.131 | .034 | 262 | 0.516 | <.0001 | 262 |
| ALS | 0.806 | <.0001 | 52 | 0.531 | <.0001 | 53 | 0.456 | .001 | 52 |
| FTD | 0.752 | <.0001 | 32 | 0.149 | .408 | 33 | 0.384 | .03 | 32 |
| PD not demented | 0.639 | <.0001 | 26 | 0.346 | .083 | 26 | 0.055 | .791 | 26 |
| PD-MCI | 0.7 | .005 | 14 | −0.407 | .149 | 14 | 0.569 | .034 | 14 |
| PD with dementia | 0.688 | .007 | 14 | 0.368 | .177 | 15 | 0.45 | .092 | 15 |
| DLB | 0.892 | <.0001 | 18 | −0.077 | .753 | 19 | 0.522 | .022 | 19 |
| PPA | 0.782 | <.0001 | 31 | 0.092 | .621 | 31 | 0.207 | .265 | 31 |
| PSP | 0.829 | <.0001 | 17 | 0.437 | .08 | 17 | 0.692 | .002 | 17 |
| Corticobasal syndrome | 0.676 | .011 | 13 | 0.407 | .168 | 13 | −0.58 | .851 | 13 |
Abbreviations: MCI, mild cognitive impairment; AD, Alzheimer’s disease; ALS, amyotrophic lateral sclerosis; FTD, frontotemporal dementia; PD, Parkinson’s disease; DLB, dementia with Lewy bodies; PPA, primary progressive aphasia; PSP, progressive supranuclear palsy.
3.8. CSF GAP-43 concentration correlates with cognitive decline and AD pathology
CSF GAP-43 concentrations correlated weakly with MMSE scores when including all diagnostic groups (rs = −0.21, P <.0001, n = 593, Fig. 2A), but no significant correlations were detected in clinical subgroups. In addition, the longitudinal decrease in MMSE score per year correlated weakly with increasing GAP-43 concentration (rs = 20.26, P =.0001, n = 305, Fig. 2B). Similar to MMSE scores, there were no correlations of GAP-43 with MMSE change per year when dividing the cohort by clinical diagnosis. CSF GAP-43 correlated with Braak neurofibrillary tau staging (rs = 0.41, P = .0001) and was significantly higher in stage V–VI compared to 0 Braak scores (P = .001, n = 91, Fig. 3A). Furthermore, GAP-43 correlated with CERAD score of Aβ deposition across all diagnostic groups (rs = 0.37, P <.0001) and was significantly higher for score C compared to 0 (P =.001, n = 92, Fig. 3B). GAP-43 concentration was negatively correlated to brain weight (rs = 20.30, P =.003, n = 94) but not associated to hippocampal sclerosis.
Figure 2, CSF GAP-43 concentration is associated with cognitive decline.
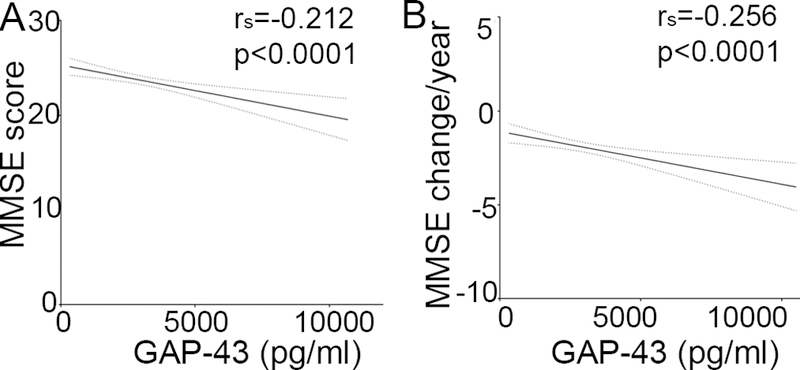
A, Lower MMSE scores was correlated to higher CSF GAP-43 concentration across all diagnostic groups. B, MMSE change per year across all diagnostic groups indicates increasing concentration of CSF GAP-43 with larger decline in MMSE. Abbreviation: MMSE: Mini mental state examination.
Figure 3, CSF GAP-43 concentration is associated with disease severity.
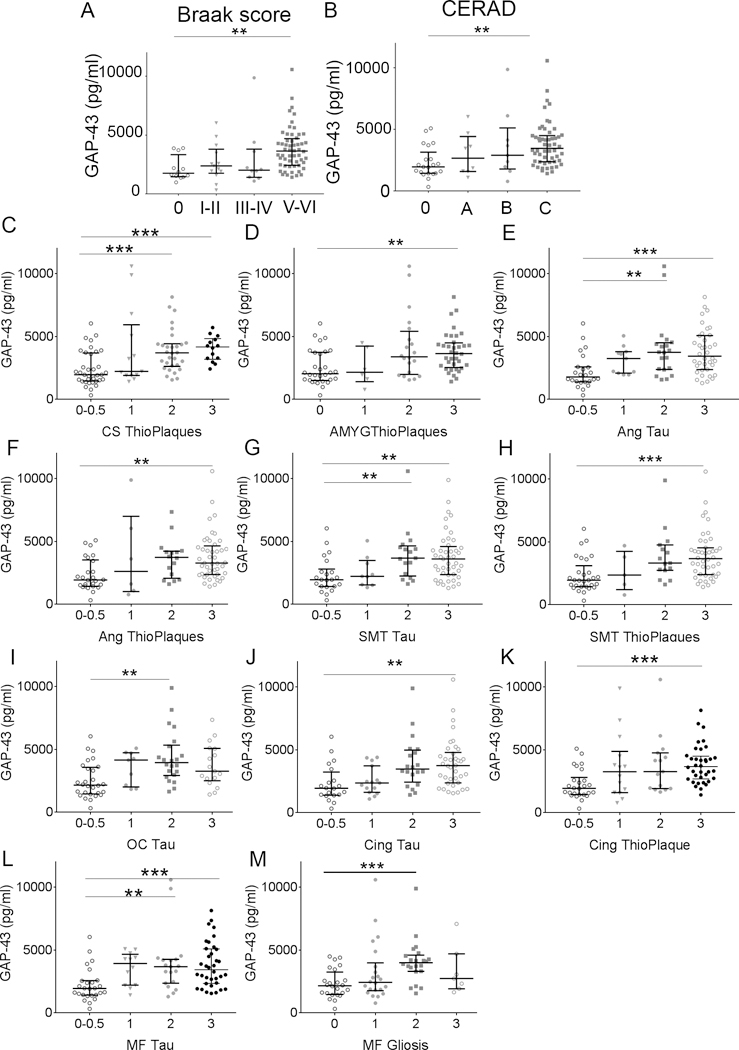
A, CSF GAP-43 concentration was increased in patients with high Braak scores (0 to V-VI; p = 0.0027). B, CSF GAP-43 concentration was increased in patients with high CERAD scores (0 to C; p = 0.0012). C-M, GAP-43 concentration increased with amyloid plaque and/or Tau pathology (0 = none, 0.5 = rare, 1 = mild, 2 = moderate, 3 = severe) in CA/subiculum hippocampus region (CS), amygdala (Amyg), angular gyrus (Ang), superior-middle temporal cortex (SMT) occipital cortex (OC), anterior cingulate cortex (Cing), mid-frontal cortex (MF), and gliosis in mid-frontal cortex. Scores 0 and 0.5 were merged due to low numbers in the 0.5 core group. **; p < 0.003, ***; p < 0.001.
Examination and scoring of tau, thioflavin/amyloid, α-synuclein and TDP-43 pathology, amyloid angiopathy, gliosis, and neuron loss carried out in 17 brain regions revealed that CSF GAP-43 concentration was specifically associated with AD pathology. GAP-43 concentration increased significantly with severity scores of amyloid pathology in the CA/subiculum hippocampus region and amygdala (Fig. 3C and D), and severity of both tau and amyloid pathology in the angular gyrus, superiormidtemporal cortex, and anterior cingulate cortex (Fig. 3E–H, J and K). In the occipital cortex, GAP-43 was increased with tau pathology (Fig. 3I). In the midfrontal cortex, GAP-43 increased with only tau pathology and gliosis (Fig. 3L and M). No difference was found in GAP-43 concentration across the severity grades of α-synuclein, amyloid angiopathy, and TDP-43 pathology in any brain region.
3.9. CSF GAP-43 concentration in APOE ε4 carriers
GAP-43 concentration was higher in subjects with one or two APOE ε4 alleles compared to subjects with no APOE ε4 alleles (0 vs. 1; P <.0001, vs. 2; P <.0001, Fig. 4A). There was also a statistically significant decrease in GAP-43 concentration in subjects with one or two APOE ε3 alleles compared to subjects with no APOE ε3 allele (0 vs. 2; P = .0001, 1 vs. 2; P < .0001, Fig. 4B). When stratified based on clinical diagnosis, GAP-43 was only increasing with the number of APOE ε4 alleles in AD patients (n = 236, P = .022, n (0) = 94, n (1) = 106, n (2) = 36; pairwise comparison: 0 vs. 1; P = .028, vs. 2; P = .046, Fig. 4C) and MCI patients (P = .038, n (0) = 43 n(1) = 23, n (2) = 3, pairwise comparison 0 vs. 1; P = .03, vs. 2; P =.242, Fig. 4D), but not in the other neurodegenerative diseases or controls.
Figure 4, GAP-43 concentration increased with the number of APOE ε4 alleles.
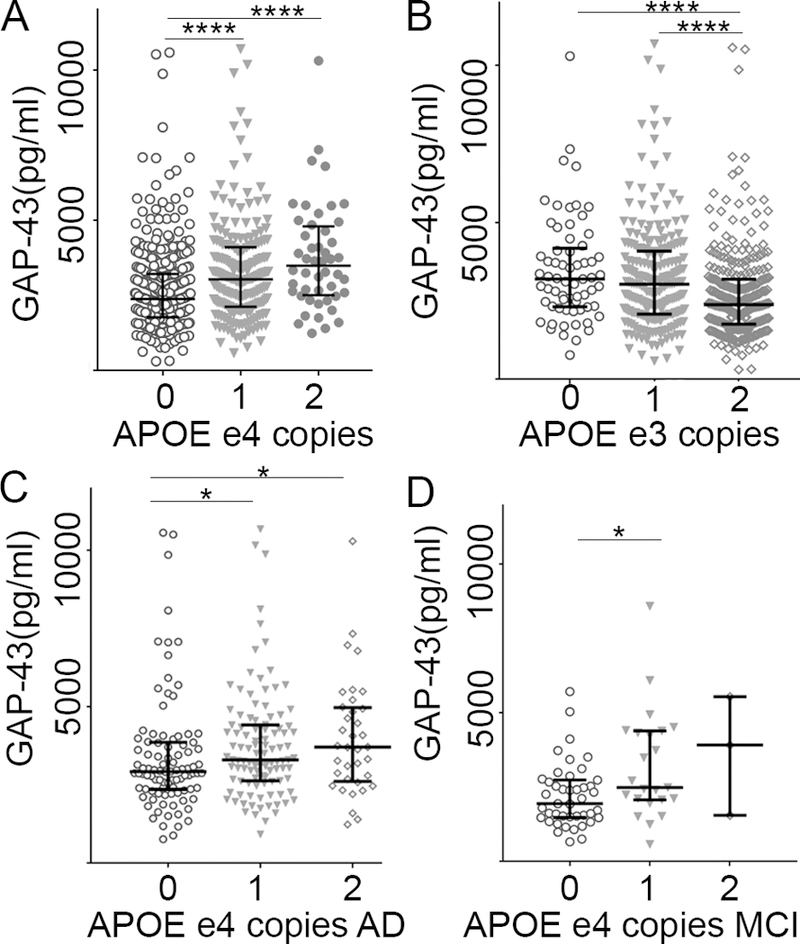
A, GAP-43 concentration increased with the number of APOE ε4 alleles across all diagnostic groups. B, GAP-43 concentration decreased with the number of APOE ε3 alleles across all diagnostic groups. C, GAP-43 concentration increased with the number of APOE ε4 alleles in AD and D, MCI. *; p < 0.05, ****; p < 0.0001. AD: Alzheimer’s disease, MCI: mild cognitive impairment patients.
4. Discussion
In this study, we quantified CSF GAP-43 in patients with different neurodegenerative dementias, including for the first time a large number of neuropathologically confirmed AD patients and important differential diagnoses such as several frontotemporal dementia diagnoses and PD and Parkinsonian disorders. Our results are in line with previous findings reporting increased CSF GAP-43 levels in AD [23,24], and patients with MCI due to AD [23]. However, the GAP-43 increase was more pronounced in our study compared to two previous studies [24,25], which may be due to assay differences or mixed patient cohorts at the time. We showed that GAP-43 can be reliably quantified in CSF by a novel in-house sandwich ELISA. Importantly, using this cohort, we show that CSF GAP-43 is associated with AD pathology, specifically increased in patients with high Braak neurofibrillary tangle stages and CERAD scores and in patients with moderate to severe tau and Aβ neuropathology, particularly in the hippocampus, amygdala, temporal and occipital lobe. As there was only one association to gliosis and no associations to the extent of TDP-43, α-synuclein, or amyloid angiopathy, we conclude that these pathologies have no major influence on GAP-43 CSF concentration. These findings suggest that CSF GAP-43 could be an AD-specific biomarker as the concentrations follow amyloid and tau deposition in the brain and is not increased to the same extremes in any other neurological disease tested here. The positive correlation of GAP-43 with biomarker levels of T-tau and P-tau and the negative correlation with Aβ42 are in line with the findings of increased GAP-43 con-centration with increased severity of tau and amyloid deposition in the brain. This indicates that there is a specific association between synaptic, tau, and amyloid pathology in AD; however, the biological connection between the three is yet to be demonstrated. Furthermore, low MMSE score and decline in MMSE score over time were weakly associated to higher GAP-43 concentration when analyzed in all the groups. The lack of association in subgroups may be due to several converging factors. GAP-43 concentrations could be saturated in AD patients resulting in a lack of correlation to MMSE change over time. As GAP-43 is a regulator of synaptic plasticity and regenerative axonal growth and induced by both injury and cognitive stimulation [18,19,32], there is also a possibility that GAP-43 increases with improvement in MMSE. Further studies are necessary to clarify this. GAP-43 was specifically increased in AD when compared to most other dementia disorders analyzed, and therefore, it could become useful for differential diagnosis. CSF GAP-43 concentrations in patients with corticobasal syndrome, PCA, lvPPA and svPPA were not significantly different from AD patients, which is expected as these clinical syndromes often have underlying AD pathology [1,33–35]. Several of these patients had a neurochemical T-tau/Aβ42 ratio indicative of AD pathology which may partly explain the elevated CSF GAP-43 concentrations. For comparison, a study by Lee et al. reported presence of AD pathology in 32% of clinical corticobasal syndrome patients, whereas 17% of these patients in our study had a positive AD biomarker profile [35]. A substantial proportion of patients with variants of primary progressive aphasia are known to display AD pathology [36,37], and CSF biomarker profile, based on Aβ42/Aβ40, PIB PET, T-tau, and P-tau analysis [38–40]. The low number of patients in the PCA group makes it inappropriate to draw definite conclusions regarding this group.
It has been reported that evaluations of novel biomarkers may underestimate their potential due to a proportion of clinically misdiagnosed patients. Several studies suggest an increased accuracy of the diagnosis, based on simultaneous neuropathological assessment or when using neurochemical cutoffs based on tau and Aβ42 quantification [1,29]. We applied a neurochemical T-tau/Aβ42 ratio cutoff described in the study by Shaw et al., to reclassify the clinical AD patients. The biomarker-positive AD group had GAP-43 concentrations similar to the neuropathologically confirmed AD group indicating a valid classification. The neurochemical division of the MCI patients indicates that GAP-43 may be useful to predict conversion from MCI to AD; future longitudinal studies should address this further.
Unexpectedly, there was a strong positive correlation of GAP-43 concentration with Aβ42 selectively in ALS patients. Peripheral levels of amyloid precursor protein and Aβ species have been reported to increase with disease onset in both ALS mouse models and patients and suggested to be directly involved in nerve degeneration [41–43]. This finding could also reflect that this is the only disease group included which does not have significant Aβ pathology (only 7.5% biomarker-positive ALS patients) and CSF concentrations of Aβ42 and GAP-43 are the result of secretion in normally functioning synapses. Possibly, the GAP-43 concentration reflects a concurrent increase with Aβ42 concentration in ALS patients due to neurodegeneration; however, neither biomarker reaches the level of AD patients.
Furthermore, GAP-43 was especially high in AD and MCI patients who were also APOE ε4 carriers, suggesting that this phenotype is connected to an early synaptic vulnerability leading to the early cognitive decline.
In conclusion, CSF concentration of the presynaptic protein GAP-43 is specifically increased in tau- and amyloid-positive individuals and could therefore be used as a marker of synaptic dysfunction in AD, provide an additional outcome measure in clinical trials, and help to separate patients with AD from patients with other forms of neurodegenerative diseases.
Supplementary Material
RESEARCH IN CONTEXT.
Systematic review: We reviewed studies investigating the presynaptic protein growth-associated protein 43 (GAP-43) in cerebrospinal fluid (CSF) as a biomarker for Alzheimer’s disease, identifying five research articles using the search terms “GAP-43,” “cerebrospinal fluid,” and “Alzheimer’s” in the PubMed database. One exploratory study indicated that CSF GAP-43 may be increased in preclinical Alzheimer’s disease and another suggested a decrease in Parkinson’s disease although no larger biomarker study was conducted.
Interpretation: Our findings suggest that CSF GAP-43 concentration is specifically associated to Alzheimer’s disease pathology and correlated with cognitive decline, whereas no connection was found to the extent of α-synuclein and TDP-43 pathology.
Future directions: CSF GAP-43 may be useful as a synaptic outcome marker in clinical trials of Alzheimer’s disease drugs and could facilitate early and differential diagnosis. The results need to be replicated in other cohorts, and longitudinal studies would be highly interesting to determine how early GAP-43 is affected.
Acknowledgments
The authors are grateful to Stiftelsen för gamla tjänarinnor, Demensfonden, Stiftelsen Sigurd och Elsa Goljes Minne, the Swedish and European Research Councils, Swedish State Support for Clinical Research (ALFGBG), Frimurarestiftelsen, Alzheimerfonden, Hjärnfonden, the Torsten Söderberg Foundation, and the Knut and Alice Wallenberg Foundation for funding. The funding sources had no involvement in the study.
H.Z. is a cofounder of Brain Biomarker Solutions in Gothenburg AB, a GU Ventures-based platform company at the University of Gothenburg, and has served at advisory boards for Roche Diagnostics, Eli Lilly, and Pharmasum Therapeutics. K.B. has served as a consultant or at advisory boards for Alzheon, Biogen, Eli Lilly, Fujirebio Europe, IBL International, and Roche Diagnostics and is a cofounder of Brain Biomarker Solutions in Gothenburg AB, a GU Venture-based platform company at the University of Gothenburg. V.K. and M.V. are employees of Fujirebio Europe NV. D.A.W. has personal fees for consultation from GE Health-care; grants from Avid Radiopharmaceuticals, Eli Lilly, Merck, Functional Neuromodulation, and Biogen outside the submitted work. The remaining authors have no conflicts to declare.
References
- [1].Toledo JB, Brettschneider J, Grossman M, Arnold SE, Hu WT, Xie SX, et al. CSF biomarkers cutoffs: the importance of coincident neuropathological diseases. Acta Neuropathol 2012;124:23–35. [DOI] [PMC free article] [PubMed] [Google Scholar]
- [2].Toledo JB, Gopal P, Raible K, Irwin DJ, Brettschneider J, Sedor S, et al. Pathological alpha-synuclein distribution in subjects with coincident Alzheimer’s and Lewy body pathology. Acta Neuropathol 2016; 131:393–409. [DOI] [PMC free article] [PubMed] [Google Scholar]
- [3].Blennow K, Hampel H, Weiner M, Zetterberg H. Cerebrospinal fluid and plasma biomarkers in Alzheimer disease. Nat Rev Neurol 2010; 6:131–44. [DOI] [PubMed] [Google Scholar]
- [4].Dubois B, Feldman HH, Jacova C, Hampel H, Molinuevo JL, Blennow K, et al. Advancing research diagnostic criteria for Alzheimer’s disease: the IWG-2 criteria. Lancet Neurol 2014;13:614–29. [DOI] [PubMed] [Google Scholar]
- [5].Sevigny J, Chiao P, Bussiere T, Weinreb PH, Williams L, Maier M, et al. The antibody aducanumab reduces Abeta plaques in Alzheimer’s disease. Nature 2016;537:50–6. [DOI] [PubMed] [Google Scholar]
- [6].Vassar R BACE1 inhibitor drugs in clinical trials for Alzheimer’s dis-ease. Alzheimers Res Ther 2014;6:89. [DOI] [PMC free article] [PubMed] [Google Scholar]
- [7].DeKosky ST, Scheff SW. Synapse loss in frontal cortex biopsies in Alzheimer’s disease: correlation with cognitive severity. Ann Neurol 1990;27:457–64. [DOI] [PubMed] [Google Scholar]
- [8].Terry RD, Masliah E, Salmon DP, Butters N, DeTeresa R, Hill R, et al. Physical basis of cognitive alterations in Alzheimer’s disease: synapse loss is the major correlate of cognitive impairment. Ann Neurol 1991; 30:572–80. [DOI] [PubMed] [Google Scholar]
- [9].Sze CI, Bi H, Kleinschmidt-DeMasters BK, Filley CM, Martin LJ. Selective regional loss of exocytotic presynaptic vesicle proteins in Alzheimer’s disease brains. J Neurol Sci 2000;175:81–90. [DOI] [PubMed] [Google Scholar]
- [10].Selkoe DJ. Alzheimer’s disease is a synaptic failure. Science 2002; 298:789–91. [DOI] [PubMed] [Google Scholar]
- [11].Neve RL, Finch EA, Bird ED, Benowitz LI. Growth-associated protein GAP-43 is expressed selectively in associative regions of the adult human brain. Proc Natl Acad Sci U S A 1988;85:3638–42. [DOI] [PMC free article] [PubMed] [Google Scholar]
- [12].De la Monte SM, Federoff HJ, Ng SC, Grabczyk E, Fishman MC. GAP-43 gene expression during development: persistence in a distinctive set of neurons in the mature central nervous system. Brain Res Dev Brain Res 1989;46:161–8. [DOI] [PubMed] [Google Scholar]
- [13].Riascos D, Nicholas A, Samaeekia R, Yukhananov R, Mesulam MM, Bigio EH, et al. Alterations of Ca(2)(1)-responsive proteins within cholinergic neurons in aging and Alzheimer’s disease. Neurobiol Aging 2014;35:1325–33. [DOI] [PMC free article] [PubMed] [Google Scholar]
- [14].Aigner L, Arber S, Kapfhammer JP, Laux T, Schneider C, Botteri F, et al. Overexpression of the Neural Growth-Associated Protein Gap-43 Induces Nerve Sprouting in the Adult Nervous-System of Transgenic Mice. Cell 1995;83:269–78. [DOI] [PubMed] [Google Scholar]
- [15].Skene JHP, Jacobson RD, Snipes GJ, Mcguire CB, Norden JJ, Freeman JA. A Protein-Induced during Nerve Growth (Gap-43) Is a Major Component of Growth-Cone Membranes. Science 1986;233:783–6. [DOI] [PubMed] [Google Scholar]
- [16].Routtenberg A, Cantallops I, Zaffuto S, Serrano P, Namgung U. Enhanced learning after genetic overexpression of a brain growth protein. Proc Natl Acad Sci U S A 2000;97:7657–62. [DOI] [PMC free article] [PubMed] [Google Scholar]
- [17].Holahan MR, Honegger KS, Routtenberg A. Ectopic growth of hippocampal mossy fibers in a mutated GAP-43 transgenic mouse with impaired spatial memory retention. Hippocampus 2010;20:58–64. [DOI] [PMC free article] [PubMed] [Google Scholar]
- [18].Allegra Mascaro AL, Cesare P, Sacconi L, Grasselli G, Mandolesi G, Maco B, et al. In vivo single branch axotomy induces GAP-43-dependent sprouting and synaptic remodeling in cerebellar cortex. Proc Natl Acad Sci U S A 2013;110:10824–9. [DOI] [PMC free article] [PubMed] [Google Scholar]
- [19].Young EA, Owen EH, Meiri KF, Wehner JM. Alterations in hippocampal GAP-43 phosphorylation and protein level following contextual fear conditioning. Brain Res 2000;860:95–103. [DOI] [PubMed] [Google Scholar]
- [20].Davidsson P, Blennow K. Neurochemical dissection of synaptic pathology in Alzheimer’s disease. Int Psychogeriatr 1998;10:11–23. [DOI] [PubMed] [Google Scholar]
- [21].Bogdanovic N, Davidsson P, Volkmann I, Winblad B, Blennow K. Growth-associated protein GAP-43 in the frontal cortex and in the hippocampus in Alzheimer’s disease: an immunohistochemical and quantitative study. J Neural Transm (Vienna) 2000;107:463–78. [DOI] [PubMed] [Google Scholar]
- [22].Rekart JL, Quinn B, Mesulam MM, Routtenberg A. Subfield-specific increase in brain growth protein in postmortem hippocampus of Alzheimer’s patients. Neuroscience 2004;126:579–84. [DOI] [PubMed] [Google Scholar]
- [23].Remnestal J, Just D, Mitsios N, Fredolini C, Mulder J, Schwenk JM, et al. CSF profiling of the human brain enriched proteome reveals associations of neuromodulin and neurogranin to Alzheimer’s disease. Proteomics Clin Appl 2016;10:1242–53. [DOI] [PMC free article] [PubMed] [Google Scholar]
- [24].Sjogren M, Davidsson P, Gottfries J, Vanderstichele H, Edman A, Vanmechelen E, et al. The cerebrospinal fluid levels of tau, growth-associated protein-43 and soluble amyloid precursor protein correlate in Alzheimer’s disease, reflecting a common pathophysiological process. Dement Geriatr Cogn Disord 2001;12:257–64. [DOI] [PubMed] [Google Scholar]
- [25].Sjogren M, Minthon L, Davidsson P, Granerus AK, Clarberg A, Vanderstichele H, et al. CSF levels of tau, beta-amyloid(1–42) and GAP-43 in frontotemporal dementia, other types of dementia and normal aging. J Neural Transm 2000;107:563–79. [DOI] [PubMed] [Google Scholar]
- [26].Toledo JB, Van Deerlin VM, Lee EB, Suh E, Baek Y, Robinson JL, et al. A platform for discovery: The University of Pennsylvania Integrated Neurodegenerative Disease Biobank. Alzheimers Dement 2014;10:477–484.e1. [DOI] [PMC free article] [PubMed] [Google Scholar]
- [27].Yarchoan M, Xie SX, Kling MA, Toledo JB, Wolk DA, Lee EB, et al. Cerebrovascular atherosclerosis correlates with Alzheimer pathology in neurodegenerative dementias. Brain 2012;135:3749–56. [DOI] [PMC free article] [PubMed] [Google Scholar]
- [28].Ohrfelt A, Zetterberg H, Andersson K, Persson R, Secic D, Brinkmalm G, et al. Identification of novel alpha-synuclein isoforms in human brain tissue by using an online nanoLC-ESI-FTICR-MS method. Neurochem Res 2011;36:2029–42. [DOI] [PMC free article] [PubMed] [Google Scholar]
- [29].Shaw LM, Vanderstichele H, Knapik-Czajka M, Clark CM, Aisen PS, Petersen RC, et al. Cerebrospinal fluid biomarker signature in Alzheimer’s disease neuroimaging initiative subjects. Ann Neurol 2009; 65:403–13. [DOI] [PMC free article] [PubMed] [Google Scholar]
- [30].Gorno-Tempini ML, Hillis AE, Weintraub S, Kertesz A, Mendez M, Cappa SF, et al. Classification of primary progressive aphasia and its variants. Neurology 2011;76:1006–14. [DOI] [PMC free article] [PubMed] [Google Scholar]
- [31].Rascovsky K, Hodges JR, Knopman D, Mendez MF, Kramer JH, Neuhaus J, et al. Sensitivity of revised diagnostic criteria for the behavioural variant of frontotemporal dementia. Brain 2011;134:2456–77. [DOI] [PMC free article] [PubMed] [Google Scholar]
- [32].Hulsebosch CE, DeWitt DS, Jenkins LW, Prough DS. Traumatic brain injury in rats results in increased expression of Gap-43 that correlates with behavioral recovery. Neurosci Lett 1998;255:83–6. [DOI] [PubMed] [Google Scholar]
- [33].Forman MS, Farmer J, Johnson JK, Clark CM, Arnold SE, Coslett HB, et al. Frontotemporal dementia: clinicopathological correlations. Ann Neurol 2006;59:952–62. [DOI] [PMC free article] [PubMed] [Google Scholar]
- [34].Alladi S, Xuereb J, Bak T, Nestor P, Knibb J, Patterson K, et al. Focal cortical presentations of Alzheimer’s disease. Brain 2007; 130:2636–45. [DOI] [PubMed] [Google Scholar]
- [35].Lee SE, Rabinovici GD, Mayo MC, Wilson SM, Seeley WW, DeArmond SJ, et al. Clinicopathological correlations in corticobasal degeneration. Ann Neurol 2011;70:327–40. [DOI] [PMC free article] [PubMed] [Google Scholar]
- [36].Giannini LAA, Irwin DJ, McMillan CT, Ash S, Rascovsky K, Wolk DA, et al. Clinical marker for Alzheimer disease pathology in logopenic primary progressive aphasia. Neurology 2017; 88:2276–84. [DOI] [PMC free article] [PubMed] [Google Scholar]
- [37].Grossman M Primary progressive aphasia: clinicopathological correlations. Nat Rev Neurol 2010;6:88–97. [DOI] [PMC free article] [PubMed] [Google Scholar]
- [38].Louwersheimer E, Keulen MA, Steenwijk MD, Wattjes MP, Jiskoot LC, Vrenken H, et al. Heterogeneous Language Profiles in Patients with Primary Progressive Aphasia due to Alzheimer’s Disease. J Alzheimers Dis 2016;51:581–90. [DOI] [PubMed] [Google Scholar]
- [39].Paraskevas GP, Kasselimis D, Kourtidou E, Constantinides V, Bougea A, Potagas C, et al. Cerebrospinal fluid biomarkers as a diagnostic tool of the underlying pathology of primary progressive aphasia. J Alzheimers Dis 2017;55:1453–61. [DOI] [PubMed] [Google Scholar]
- [40].Ikeda M, Tashiro Y, Takai E, Kurose S, Fugami N, Tsuda K, et al. CSF levels of Abeta1–38/Abeta1–40/Abeta1–42 and (11)C PiB-PET studies in three clinical variants of primary progressive aphasia and Alzheimer’s disease. Amyloid 2014;21:238–45. [DOI] [PubMed] [Google Scholar]
- [41].Bryson JB, Hobbs C, Parsons MJ, Bosch KD, Pandraud A, Walsh FS, et al. Amyloid precursor protein (APP) contributes to pathology in the SOD1(G93A) mouse model of amyotrophic lateral sclerosis. Hum Mol Genet 2012;21:3871–82. [DOI] [PubMed] [Google Scholar]
- [42].Koistinen H, Prinjha R, Soden P, Harper A, Banner SJ, Pradat PF, et al. Elevated levels of amyloid precursor protein in muscle of patients with amyotrophic lateral sclerosis and a mouse model of the disease. Mus-cle Nerve 2006;34:444–50. [DOI] [PubMed] [Google Scholar]
- [43].Rabinovich-Toidman P, Rabinovich-Nikitin I, Ezra A, Barbiro B, Fogel H, Slutsky I, et al. Mutant SOD1 Increases APP Expression and Phosphorylation in Cellular and Animal Models of ALS. PLoS One 2015;10:e0143420. [DOI] [PMC free article] [PubMed] [Google Scholar]
Associated Data
This section collects any data citations, data availability statements, or supplementary materials included in this article.