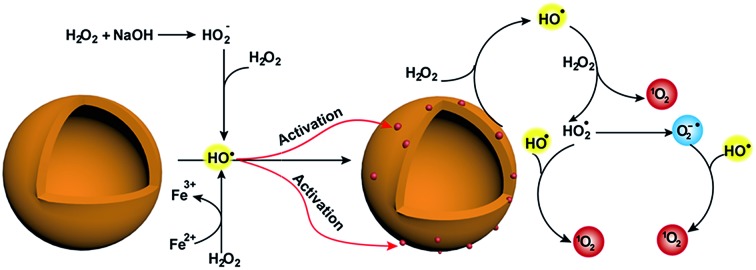
 Activated MoS2-QDs exhibit a promising capability for the generation of reactive oxygen species.
Abstract
Reactive oxygen species (ROS) generation is of intense interest because of its crucial role in many fields. Here we demonstrate that MoS2-QDs exhibit a promising capability for the generation of reactive oxygen species, which leads to enhanced chemiluminescence. We discovered that the unique performance is due to hydroxyl radical activation increasing the active catalytic sites on molybdenum sulphide quantum dots (MoS2-QDs). The reactive oxygen species, such as hydroxyl radicals (˙OH), superoxide radicals (˙O2–) and singlet oxygen (1O2) have been efficiently generated from H2O2 solution in alkaline conditions. In particular, the maximum ˙OH yield was enhanced significantly (9.18 times) compared to the Fe(ii)/H2O2 Fenton system under neutral conditions. These findings not only enrich our understanding of the fascinating performance of MoS2 QDs, but also provide a new pathway for ROS generation in all kinds of pH environment.
Introduction
Reactive oxygen species (ROS) is a collective term for oxygen free radicals and molecules including superoxide radicals (˙O2–), hydroxyl radicals (˙OH) and singlet oxygen (1O2), which possess high reactivity compared to molecular O2. Generation of abundant ROS is of immense interest in environmental and biological sciences.1 To date, the ROS are usually generated using a photocatalytic process via light-activated photosensitizers or a chemical process via iron-mediated Fenton reaction.2 However, the photocatalytic process suffers from undesirable bio-damage by ultra-violet (UV) radiation and low reactive oxygen species production. This has restricted the role of photo-catalysis for biomedical applications.3 The Fenton reaction can generate adequate ROS, however, this requires acidic conditions (pH = 3–4). Therefore, alternative reactions and conditions for ROS generation need to be pursued.
Nanoscale molybdenum sulphides (MoS2) have gained widespread application in photo-responsive, energy storage and biosensor devices.4 Besides, MoS2 has been used as an excellent electro-catalyst for the hydrogen evolution reaction (HER).5 However, the performance of molybdenum sulphide-quantum dots (MoS2-QDs) toward chemiluminescence (CL) based on ROS generation has not been explored.
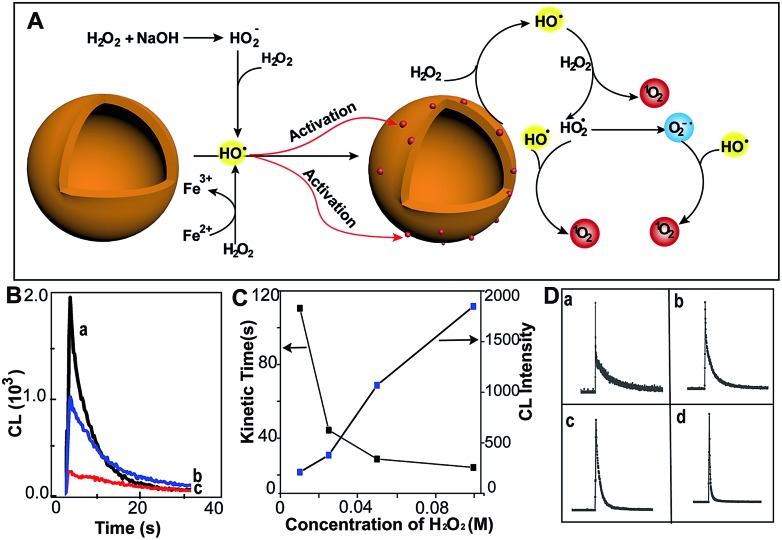
Here, we demonstrate the excellent capability of MoS2-QDs to generate ROS from hydrogen peroxide in alkaline solution, which gives rise to CL emission (Fig. 1A). The hydroxyl radicals (˙OH) from intrinsic reactions such as H2O2 in alkaline medium and the Fe(ii)/H2O2 Fenton system activate MoS2-QDs and generate active catalytic sites on their surface. These active sites then facilitate the conversion of H2O2 to generate a sufficient amount of ROS, which leads to a strong CL-emission.
Fig. 1. MoS2-QDs promote the generation of reactive oxygen species and induce chemiluminescence with H2O2 in alkaline conditions. (A) Schematic illustration of ROS generation by MoS2-QDs. (B) The CL spectrum of injection order with (a) injection of MoS2-QDs into a mixture of H2O2 + NaOH, (b) injection of NaOH into a mixture of H2O2 + MoS2-QDs and (c) injection of H2O2 into a mixture of MoS2-QDs + NaOH. (C) The dose-dependence of H2O2 concentration on kinetic decay time and CL intensity by injection of MoS2-QDs into a H2O2–NaOH solution. (D) The CL kinetic curve at H2O2 concentrations of (a) 0.01, (b) 0.025, (c) 0.05, and (d) 0.1 M.
Results and discussion
The MoS2-QDs were prepared by solvothermal treatment in N,N-dimethylformamide (DMF), as proposed by Wang et al.6 The MoS2-QDs exhibited an average size of ∼3.7 nm (Fig. S1, ESI†). The as-prepared product (0.9 mg ml–1) was dispersed in water and a transparent pale-yellow solution was obtained, which exhibited a strong fluorescence emission over a wide range of excitation wavelengths (Fig. S2, ESI†).
The chemiluminescence (CL) was produced by MoS2-QDs and H2O2. A stronger CL was obtained with injection of the MoS2-QD suspension into a pre-mixed H2O2/NaOH solution, whereas those with the addition of H2O2 to NaOH/MoS2-QDs or with the addition of NaOH to H2O2/MoS2-QDs, exhibited relatively weaker CL-emission (Fig. 1B). We found that the CL was not only correlated to the injection order, but also to the NaOH concentration. The CL intensity was found to increase with increasing concentration of NaOH and no CL emission was found under acidic or neutral conditions. This was attributed to the remarkable decomposition of H2O2 in alkaline medium7 (80% and 15% at pH = 13 and 10.5 respectively) (Fig. S3, ESI†). The results suggested that the decomposition of H2O2 plays an important role in the enhanced CL-emission with the addition of MoS2-QDs. The hydroxyl radical (˙OH) generation from H2O2 in the presence of base is given in eqn (1) and (2). Perhydroxyl ions (HO2–) were formed through the decomposition of H2O2 in base; then the HO2– reacted with undissociated H2O2 molecules to produce hydroperoxide radicals (HO2˙) and ˙OH.8
| H2O2 + OH– → H2O + HO2– | 1 |
| HO2– + H2O2 → HO2˙ + ˙OH + OH– | 2 |
Ouyang et al. have reported that intrinsic defects can be generated to activate and increase the number of catalytic sites on MoS2.9 The ˙OH is a strong oxidizing agent, which has a redox potential of 2.8 V,10 therefore, the production of ˙OH leads to radical attack on the MoS2-QDs and generates defects. This increases the effective catalytic sites of the MoS2-QDs and hence facilitates the further decomposition of H2O2. The occurrence of defects was evidenced by the short lifetime of about 5.2 ns of the MoS2-QDs (Fig. S4, ESI†). To clarify the role of ˙OH in the strong CL-emission of the MoS2-QD/H2O2 system, experiments with H2O2 at different concentrations were performed. We found that the CL-emission intensity of the MoS2-QD/H2O2 system is dependent on the concentration of H2O2 (Fig. 1C). With increasing [H2O2] from 0.01 M to 0.1 M, the intensity of CL increased progressively. The CL kinetic decay time was also found to be dependent on the H2O2 concentration. A flash CL-emission was observed at high H2O2 concentration (0.1 M), whereas a relatively slower decay was observed at low concentration (Fig. 1D).
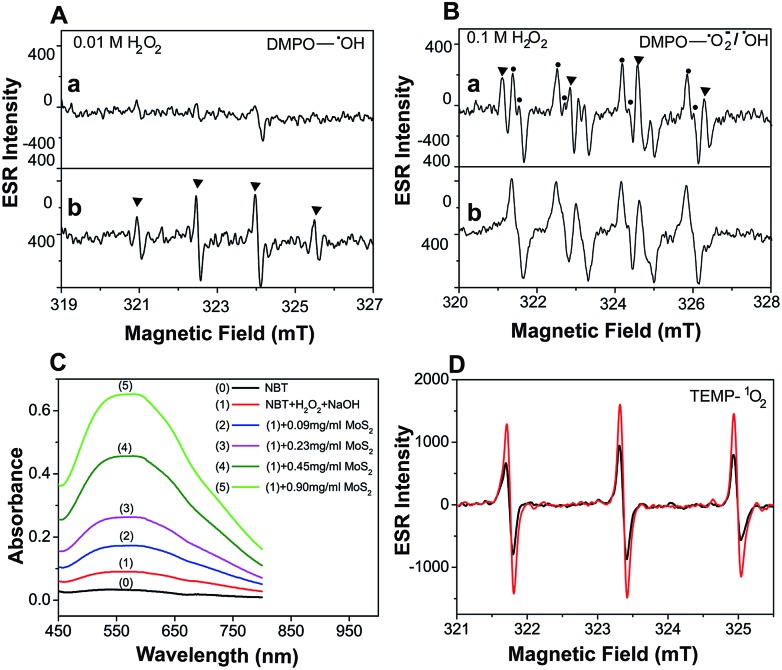
Electron Spin Resonance (ESR) spectroscopy was performed to directly examine the generation of ˙OH under different H2O2 conditions. A larger yield of ˙OH was observed as [H2O2] was increased (Fig. 2A(a) and B(a)). This provides clear evidence that activation of the MoS2-QDs is highly dependent on ˙OH formation. No obvious ESR signals for DMPO–OH were observed without MoS2-QDs, while the ˙OH was significantly enhanced in the presence of activated MoS2-QDs at [H2O2] = 0.01 M in NaOH (0.1 M) (Fig. 2A(b)). In addition, we found the signal for DMPO–OH and DMPO–˙O2– (ref. 11) in the presence of MoS2-QDs is stronger than that in the absence of MoS2-QDs at H2O2 = 0.1 M in NaOH (0.1 M) (Fig. 2B(b)). These results suggest the dependence of ˙OH generation on H2O2 concentration and the ability of the MoS2-QDs for ROS generation, which leads to the strong CL-emission of the MoS2-QD/H2O2 system.
Fig. 2. Evaluation of the enhancement of ˙OH, ˙O2– and 1O2 production by MoS2-QDs in the H2O2–NaOH system. (A) ESR spectrum of 5,5-dimethyl-1-pyrroline N-oxide (DMPO) with ˙OH obtained from 0.01 M H2O2 in 0.1 M NaOH (a), and the same as the above conditions but with MoS2-QDs (b). (B) ESR spectrum of DMPO with ˙OH or ˙O2– obtained from 0.1 M H2O2 in 0.1 M NaOH (a), and the same as the above conditions but with MoS2-QDs (b). (C) The absorbance of NBT in the H2O2–NaOH system with the addition of MoS2-QDs. (D) ESR spectrum of TEMP with 1O2 production from H2O2–NaOH (black) and MoS2-QDs–H2O2–NaOH (red).
Moreover, the UV-vis spectra (Fig. 2C) with nitrotetrazolium blue chloride (NBT) as a superoxide radical (˙O2–) probe12 and ESR spectra (Fig. 2D) with 2,2,6,6-tetramethyl-4-piperidine (TEMP) as a singlet oxygen (1O2) probe13 also showed a significant increase in ˙O2– and 1O2 production in the presence of MoS2-QDs. The generation pathways of ˙O2– and 1O2via radical reactions are given in eqn (3)–(7).14,15 We hypothesized that the active sites induced by ˙OH were responsible for the generation of ˙OH, ˙O2–, and 1O2 by facilitating the conversion of H2O2 into more ROS.
| ˙OH + H2O2 → HO2˙ + H2O | 3 |
| HO2˙ + OH– → ˙O2– + H2O | 4 |
 |
5 |
| ˙OH + HO2˙ → H2O + O2 + 1O2 | 6 |
| ˙OH + ˙O2– → OH– + 1O2 | 7 |
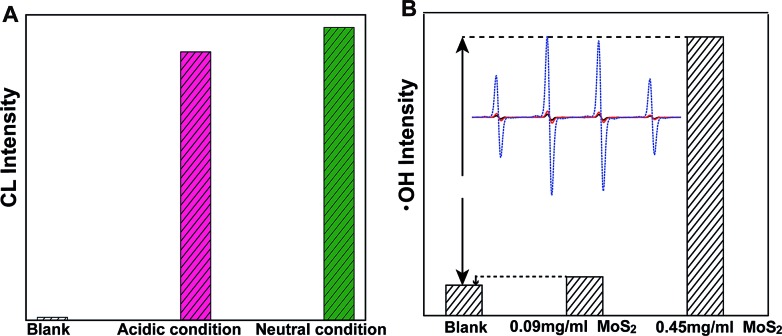
In order to further evaluate the dependence of MoS2-QD activation and CL-emission on the generation and concentration of ˙OH, a classic ˙OH generation Fenton system was investigated. We found that, MoS2-QDs strongly enhanced the CL-emission of the Fe2+/H2O2 system. It was striking that equivalent CL-emission was produced under both neutral and acidic conditions (Fig. 3A). Besides, ˙OH generation was significantly accelerated and compared to the Fe2+/H2O2 system, a 9.18 times greater yield of ˙OH was observed (Fig. 3B). These results confirmed the hypothesis of ROS generation through ˙OH-activated MoS2-QDs.
Fig. 3. Enhancement of chemiluminescence and hydroxyl radical (˙OH) production by MoS2-QDs in the Fe2+–H2O2 system (A) the chemiluminescence of Fe2+–H2O2 (blank); and the CL produced by the addition of MoS2-QDs to the Fe2+–H2O2 system under acidic (pH = 3.7) and neutral conditions. (B) The hydroxyl radicals generated from Fe2+–H2O2 (blank) and from the addition of MoS2-QDs with a concentrations of 0.09 mg ml–1 and 0.45 mg ml–1. The inset in panel B is the ESR spectrum of DMPO with ˙OH generated from Fe2+–H2O2 (black) and with the addition of MoS2-QDs with concentrations of 0.09 mg ml–1 (red) and 0.45 mg ml–1 (blue).
To further verify the generation of ˙OH, the Fenton-oxidation of tetramethylbenzidine (TMB) was introduced, which is known to be oxidized by ˙OH.16 In the absence of MoS2-QDs, TMB was oxidized slowly and reached a maximum absorbance intensity (λmax = 652 nm) after 60 s. Nevertheless, in presence of MoS2-QDs, a rapid strong absorbance at 652 nm was observed (Fig. S5, ESI†), indicating a rapid formation of the bluish oxidized TMB because of ˙OH being generated in large amounts. This confirmed that MoS2-QD driven Fenton reaction can effectively produce ˙OH.
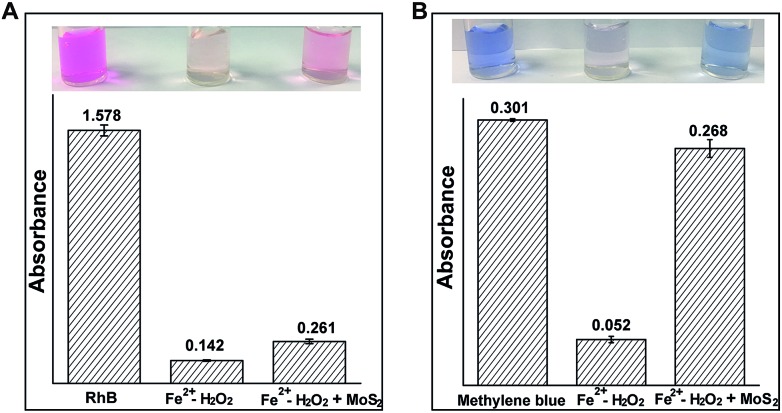
The generation of ˙OH can effectively degrade organic contaminants.17 Therefore, phenol, pyrocatechol, rhodamine B (RhB) and methylene blue (MB) were used to find the degradation efficiency and fate of ˙OH in the Fenton (Fe2+/H2O2) and MoS2-QD supported Fenton system. Phenolic compound concentrations were measured by using 4-aminoantipyrine for the colorimetric determination.18 As expected, a significant decrease of phenol and pyrocatechol (Fig. S6, ESI†) was observed when phenol or pyrocatechol were incubated with the MoS2-QD supported Fe2+/H2O2 system as compared to the traditional Fe2+/H2O2 Fenton system, indicating a higher degradation efficiency for phenolic compounds with the Fe2+/H2O2–MoS2-QD system. In addition, the degradation of RhB and MB has been detected by the UV-visible method. In the presence of MoS2-QDs, MoS2-QDs were found to significantly inhibit both RhB and MB degradation efficiency (Fig. 4). Moreover, the presence of MoS2-QDs showed a more negative influence on MB degradation, inhibiting the efficiency of MB degradation by 72%, as well as that of RhB degradation efficiency by 8%. This difference towards RhB and MB degradation is probably attributable to the lower reactivity of MB compared to RhB in the Fe2+/H2O2–MoS2-QD system, because of significant structural differences between the two different organic fractions (RhB and MB). It has been found previously that ˙OH could be consumed by injection of holes into semiconductor nano-materials.19 The selective degradation of phenolic compounds as compared to RhB and MB is probably due to the higher reaction rate of ˙OH with phenolic compounds (k ≈ 1010 M–1 s–1),20 which makes phenolic compounds more competitive for reacting with ˙OH rather than MoS2-QDs in the degradation process. In contrast, ˙OH reacts with MoS2-QDs preferentially rather than the aromatic heterocyclic compounds, such as RhB and MB, due to the one order of magnitude lower rate (k ≈ 109 M–1 s–1).21 These results strongly indicated that a rapid reaction of MoS2-QDs with ˙OH (and ˙O2–) forming hole-injection ((MoS2)˙+ QDs) and electron-injection ((MoS2)˙– QDs) species (eqn (8) and (9)) occurred.
| MoS2-QDs + ˙OH → (MoS2)˙+ QDs + OH– | 8 |
| MoS2-QDs + ˙O2– → (MoS2) ˙– QDs + O2 | 9 |
Fig. 4. The influence of MoS2-QDs on organic contaminant degradation in the Fe2+–H2O2 Fenton system. (A) The absorbance of rhodamine B at 554 nm in the Fe2+–H2O2 and Fe2+–H2O2 + MoS2-QD systems; (B) the absorbance of methylene blue at 626 nm in the Fe2+–H2O2 and Fe2+–H2O2 + MoS2-QD systems. The solution conditions were 0.01 M H2O2, 0.45 mg ml–1 MoS2-QDs, 1 mM Fe2+, 5 μg ml–1 RhB and 5 μg ml–1 MB.
The annihilation of (MoS2)˙+ and (MoS2)˙– resulted in energy release in the form of CL emission,22 which has been clarified through a CL-emission spectrum. The CL emission spectrum was centered at 490 nm and 550 nm, which may contain overlap of 1O2 and MoS2 emission23 (Fig. S7, ESI†). To verify that this emission was from the recombination of (MoS2)˙+ and (MoS2)˙– and not from the overlap of 1O2 and MoS2-QD emission, the CL-emission was recorded in D2O as a solvent instead of H2O, because 1O2 possesses a 13 times longer lifetime in D2O than in H2O.24 Generally, if the CL emission originated from 1O2, one would expect alteration of the kinetic reaction in D2O. However, no obvious change was observed, indicating no contribution of the 1O2 to the CL-emission due to the annihilation of electron–hole combination of (MoS2)˙+ QDs and (MoS2)˙– QDs (Fig. S8, ESI†).
Conclusions
For the first time, we have demonstrated the excellent capability of MoS2-QDs toward ROS generation. We explored that the synergistic effect of enhanced ROS production and ROS depletion were the main factors leading to the CL-emission of MoS2-QDs with H2O2 in alkaline medium; and with the Fenton reagent under neutral and acidic conditions. These findings present a new pathway for ROS generation over the whole pH-range. Thus, MoS2-QDs have potential applications for degradation of organic pollutants and chemo-dynamic therapy.
Conflicts of interest
There are no conflicts to declare.
Supplementary Material
Acknowledgments
This work was supported by the National Natural Science Foundation of China (Nos. 21435002, 21621003) and JSPS RONPAKU (Ph.D. Dissertation) Program.
Footnotes
†Electronic supplementary information (ESI) available. See DOI: 10.1039/c8sc03511c
References
- (a) Wang H., Jiang S., Shao W., Zhang X., Chen S., Sun X., Zhang Q., Luo Y., Xie Y. J. Am. Chem. Soc. 2018;140:3474–3480. doi: 10.1021/jacs.8b00719. [DOI] [PubMed] [Google Scholar]; (b) Gilson R. C., Black L. C. L., Lane D. D., Achilefu S. Angew. Chem., Int. Ed. 2017;129:10857–10860. doi: 10.1002/anie.201704458. [DOI] [PMC free article] [PubMed] [Google Scholar]; (c) Bai J., Jia X. D., Zhen W., Cheng W., Jiang X. Angew. Chem., Int. Ed. 2018;140:106–109. doi: 10.1021/jacs.7b11114. [DOI] [PubMed] [Google Scholar]
- (a) Li Y., Zhang W., Niu J. F., Chen Y. S. ACS Nano. 2012;6:5164–5173. doi: 10.1021/nn300934k. [DOI] [PubMed] [Google Scholar]; (b) Yang C., Dong W., Cui G., Zhao Y., Shi X., Xia X., Tang B., Wang W. RSC Adv. 2017;7:23699–23708. [Google Scholar]; (c) Zheng Y., Zhang D., Shah S., Li H., Lin J. Chem. Commun. 2017;53:5657–5660. doi: 10.1039/c7cc02041d. [DOI] [PubMed] [Google Scholar]
- (a) Shah S., Lin L., Zheng Y., Zhang D., Lin J. Phys. Chem. Chem. Phys. 2017;19:21604–21611. doi: 10.1039/c7cp03724d. [DOI] [PubMed] [Google Scholar]; (b) Zhang C., Bu W., Ni D., Zhang S., Li Q., Yao Z., Zhang J., Yao H., Wang Z., Shi J. Angew. Chem., Int. Ed. 2016;55:2101–2106. doi: 10.1002/anie.201510031. [DOI] [PubMed] [Google Scholar]
- (a) Sanchez O., Lembke D., Kayci M., Radenovic A., Kis A. Nat. Nanotechnol. 2013;8:497–501. doi: 10.1038/nnano.2013.100. [DOI] [PubMed] [Google Scholar]; (b) Lin Y., Dumcenco D., Huang Y., Suenaga K. Nat. Nanotechnol. 2014;9:391–396. doi: 10.1038/nnano.2014.64. [DOI] [PubMed] [Google Scholar]; (c) Zhu C., Zeng Z., Li H., Li F., Fan C., Zhang H. J. Am. Chem. Soc. 2013;135:5998–6001. doi: 10.1021/ja4019572. [DOI] [PubMed] [Google Scholar]
- (a) Li G., Zhang D., Yu Y., Huang S., Yang W., Cao L. J. Am. Chem. Soc. 2017;139:16194–16200. doi: 10.1021/jacs.7b07450. [DOI] [PubMed] [Google Scholar]; (b) Shi Y., Zhou Y., Yang D., Xu W., Wang C., Wang F., Xu J., Xia X., Chen H. J. Am. Chem. Soc. 2017;139:15479–15485. doi: 10.1021/jacs.7b08881. [DOI] [PubMed] [Google Scholar]; (c) Zhao X., Zhu H., Yang X. Nanoscale. 2014;6:10680–10685. doi: 10.1039/c4nr01885k. [DOI] [PubMed] [Google Scholar]
- Wang J., Tan X., Pang X., Liu L., Tan F., Li N. ACS Appl. Mater. Interfaces. 2016;8:24331–24338. doi: 10.1021/acsami.6b08391. [DOI] [PubMed] [Google Scholar]
- Spalek O., Balej J., Pasek I. J. Chem. Soc., Faraday Trans. 1. 1982;78:2349–2359. [Google Scholar]
- Hebeish A., Bayazeed A., Abdel Gawad B. I., Basily S. K., El-Bazza S. Starch. 1984;10:344–349. [Google Scholar]
- Ouyang Y., Ling C., Chen Q., Wang Z., Shi L., Wang J. Chem. Mater. 2016;28:4390–4396. [Google Scholar]
- Kong L., Fang G., Kong Y., Xie M., Natarajan V., Zhou D., Zhan J. J. Hazard. Mater. 2018;357:109–118. doi: 10.1016/j.jhazmat.2018.05.065. [DOI] [PubMed] [Google Scholar]
- Zhou N., Qiu T., Ping L., Yang L. Magn. Reson. Chem. 2006;44:38–44. doi: 10.1002/mrc.1730. [DOI] [PubMed] [Google Scholar]
- Reybier K., Ayala S., Alies B., Rodrigues J. V., Rodriguez S. B., Penna G., Collin F., Gomes C. M., Hureau C., Faller P. Angew. Chem., Int. Ed. 2016;55:1085–1089. doi: 10.1002/anie.201508597. [DOI] [PubMed] [Google Scholar]
- Zheng Y., Dou X., Li H., Lin J.-M. Nanoscale. 2016;8:4933–4937. doi: 10.1039/c5nr08943c. [DOI] [PubMed] [Google Scholar]
- Ivanova I., Trofimova S., Piskarev I., Aristova N., Burhina O., Soshnikova O. J. Biophys. Chem. 2012;3:88–100. [Google Scholar]
- Lin Z., Chen H., Zhou Y. n., Ogawa N., Lin J.-M. J. Environ. Sci. 2012;24:550–557. doi: 10.1016/s1001-0742(10)60639-0. [DOI] [PubMed] [Google Scholar]
- Zhang W., Hu S., Yin J., He W., Lu W., Ma M., Gu N., Zhang Y. J. Am. Chem. Soc. 2016;138:5860–5865. doi: 10.1021/jacs.5b12070. [DOI] [PubMed] [Google Scholar]
- Zhang W., Su Y., Zhang X., Yang Y., Guo X. RSC Adv. 2016;6:64626–64633. [Google Scholar]
- Munaf E., Zein R., Kurniadi R., Kurniadi I. Environ. Technol. 1997;18:355–358. [Google Scholar]
- Li Y., Zheng Y., Zhang D., Li H., Ma Y., Lin J. M. Chin. Chem. Lett. 2017;28:184–188. [Google Scholar]
- Buxton G., Greenstock C., Helman W., Ross A. B. J. Phys. Chem. Ref. Data. 1988;17:513–861. [Google Scholar]
- Haag W., Yao C. Environ. Sci. Technol. 1992;26:1005–1013. [Google Scholar]
- Chen B., Wang F., Yao W., Lin Z., Zhang X., Luo S., Zheng L., Lin X. Anal. Methods. 2018;10:474–480. [Google Scholar]
- Adam W., Kazakov D. V., Kazakov V. P. Chem. Rev. 2005;105:3371–3387. doi: 10.1021/cr0300035. [DOI] [PubMed] [Google Scholar]
- Huang R., Choe E., Min D. B. J. Food Sci. 2004;69:726–732. [Google Scholar]
Associated Data
This section collects any data citations, data availability statements, or supplementary materials included in this article.


