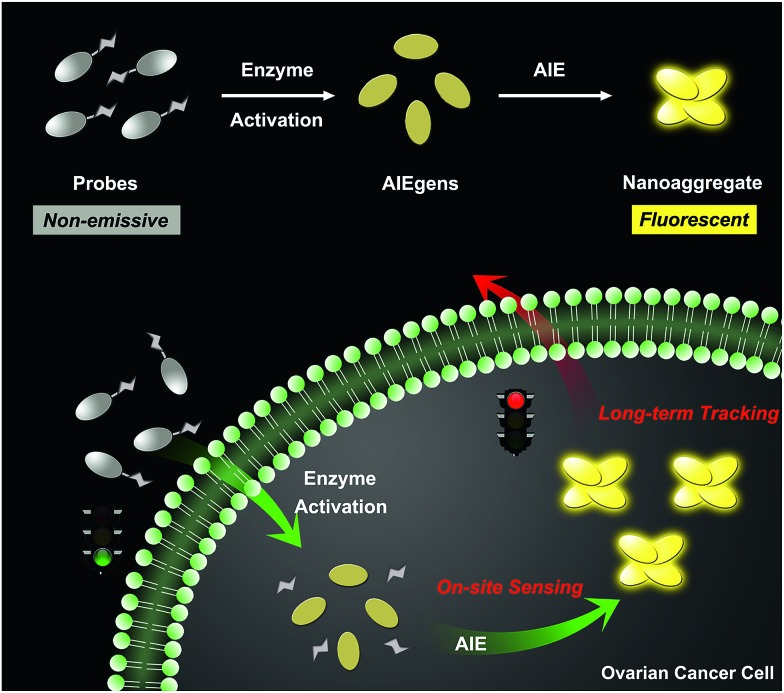
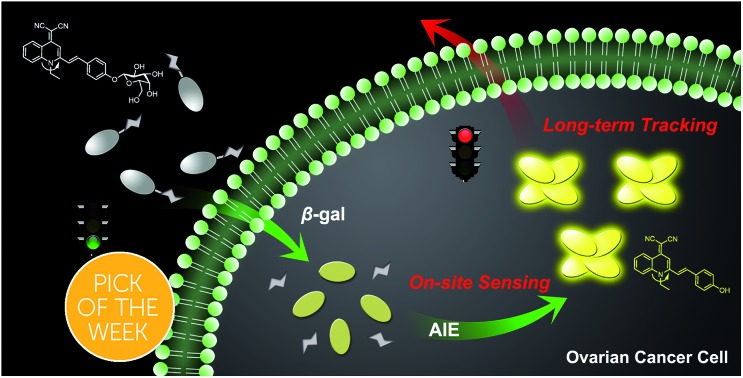
 We describe an enzyme-regulated liberation strategy to in situ generate AIEgen nanoaggregates for on-site sensing and long-term tracking of β-galactosidase in ovarian cancer cells.
Abstract
Development of fluorescent probes for on-site sensing and long-term tracking of specific biomarkers is particularly desirable for the early detection of diseases. However, available small-molecule probes tend to facilely diffuse across the cell membrane or remain at the activation site but always suffer from the aggregation-caused quenching (ACQ) effect. Here we report an enzyme-activatable aggregation-induced emission (AIE) probe QM–βgal, which is composed of a hydrophilic β-galactosidase (β-gal)-triggered galactose moiety and a hydrophobic AIE-active fluorophore QM–OH. The probe is virtually non-emissive in aqueous media, but when activated by β-gal, specific enzymatic turnover would liberate hydrophobic AIE luminogen (AIEgen) QM–OH, and then highly fluorescent nanoaggregates are in situ generated as a result of the AIE process, allowing for on-site sensing of endogenous β-gal activity in living cells. Notably, taking advantage of the improved intracellular retention of nanoaggregates, we further exemplify QM–βgal for long-term (∼12 h) visualization of β-gal-overexpressing ovarian cancer cells with high fidelity, which is essential for biomedicine and diagnostics. Thus, this enzyme-activatable AIE probe not only is a potent tool for elucidating the roles of β-gal in biological systems, but also offers an enzyme-regulated liberation strategy to exploit multifunctional probes for preclinical applications.
Introduction
On-site sensing and long-term tracking are increasingly important for real-time observation of dynamic cell migration, division, and lysis to gain deep insights into the pathogenesis of tumors in diagnostics.1–5 Small-molecule fluorescent probes have been broadly utilized for monitoring of biomarkers in living systems,6–13 but unfortunately, the modality of on-site sensing and long-term imaging with high resolution is still rarely realized by available probes. The main obstacles are that these small-molecule probes often tend to diffuse across the cell membrane and could be extruded out to adjacent tissues (diffusion away from detection sites) on activation,14–18 due to the concentration gradient of newly freed fluorochromes between the cellular interior and exterior. A conventional solution to this issue would be to adopt bioorthogonal reaction-based strategies, such as azide–alkyne click reaction19,20 and quinone methide chemistry.21 However, covalent attachment of fluorophores to the cellular proteins possibly disrupts their folding patterns and causes dysfunction, thus leading to undesirable effects on metabolism of the cells or tissues. In particular, even the remaining probes at the activation site may still suffer from the notorious aggregation-caused quenching (ACQ) effect,22–27 compromising spatiotemporal resolution and failing to persistently provide in situ information at the molecular level. Therefore, a new generation of molecular probes capable of on-site measurement and long-term visualization of targeted biomolecules or cells in live biological samples is of high demand.
With this in mind, we envisioned that aggregation-induced emission (AIE) materials may be a kind of promising candidate to tackle the aforementioned intractable issues. In contrast to conventional ACQ fluorescent dyes, AIE luminogens (AIEgens) are non-emissive as an isolated molecule but become highly fluorescent in the aggregate state because of the restriction of intramolecular motion.28–37 In particular, the more the AIEgens aggregate, the brighter their emission becomes, making them suitable for long-term tracking of biomolecules with high fidelity in living systems.38–43 Indeed, despite significant advances of AIEgens as fluorescent materials in biosensing and bioimaging, probes with simultaneous on-site sensing and long-term tracking mode by using AIEgens are scarcely reported.
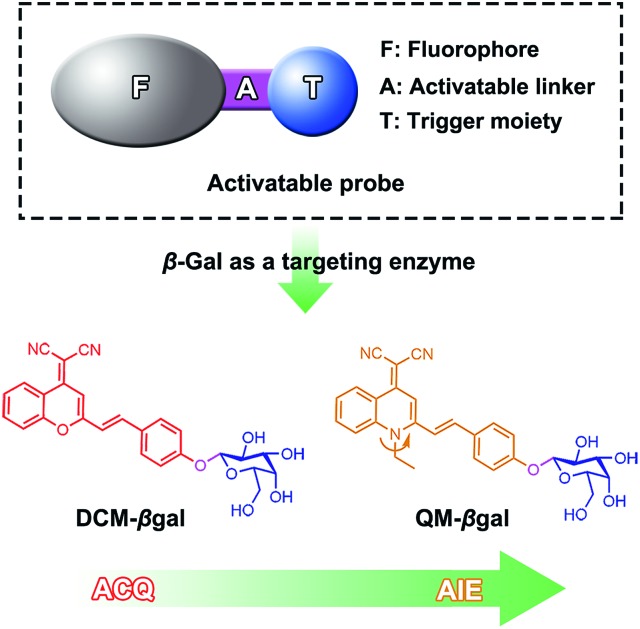
Herein, we describe an enzyme-regulated liberation strategy to in situ generate AIEgen nanoaggregates with improved intracellular retention for high-fidelity bioimaging. As depicted in Scheme 1, our design rationale is based on the fact that highly efficient enzyme-catalyzed reaction would liberate hydrophobic AIEgens, and then they can in situ form nanoaggregates at the activation site with intensive emission, facilitating diffusion-resistant on-site sensing of enzyme activity in living cells. Further, the retention effect of nanoaggregates enables long-term tracking enzyme activity in living systems. Specifically, an enzyme-activatable AIE fluorescent probe, named QM–βgal (Scheme 2), is elaborated, in which a hydrophobic AIE-active fluorophore QM–OH is utilized as a signal reporter and a hydrophilic galactose moiety as the β-galactosidase (β-gal)-triggered unit. Meanwhile, the reported ACQ probe DCM–βgal was used as a control.25 β-Gal, a glycoside hydrolase, was chosen as a targeting enzyme because it is an important biomarker for primary ovarian cancers and cell senescence.44,45 By virtue of in situ enzyme-catalyzed conversion and intracellular retention characteristics of nanoaggregates, QM–βgal is able to perform on-site sensing and long-term trapping of β-gal activity in ovarian cancer cells. Our results demonstrate that this probe provides an ideal molecular tool to better understand the biological roles of β-gal, making a breakthrough in capturing high-fidelity information about intracellular enzyme activity, which is unattainable by using traditional small-molecule probes.
Scheme 1. Schematic illustration of an enzyme-regulated liberation strategy for on-site sensing and long-term tracking.
Scheme 2. Enzyme-activatable probes for β-gal activity sensing.
Results and discussion
Design of an enzyme-activatable probe liberating AIEgens
Quinoline-malononitrile (QM) derivatives are one kind of typical AIE-active material, which have been widely employed for fluorescent sensors, imaging agents, optical waveguides, and drug delivery applications.31,46–50 In this work, we report a simple but efficient enzyme-activatable AIE-active probe based on AIEgen QM–OH with a para-position phenolic group protected by a β-galactopyranoside unit. Our design rationale is depicted in Scheme 1. QM–βgal consists of two parts: (1) a hydrophobic AIEgen QM–OH as a signal reporter and (2) a β-galactopyranoside unit endowing the probe with water solubility as a β-gal-responsive moiety. QM–βgal is a highly water-soluble species to render it almost nonfluorescent in aqueous solution. After being specifically hydrolyzed by β-gal, hydrophobic AIE-active QM–OH can be released and aggregated with a remarkable light-up fluorescent signal, which enables diffusion-resistant on-site localization and long-term trapping of endogenous β-gal activity in living cells. The molecular structures of the probe and intermediates were further confirmed to be right by 1H and 13C NMR and high-resolution mass spectroscopy (HRMS, in the ESI†).
Photophysical properties of QM–βgal and QM–OH
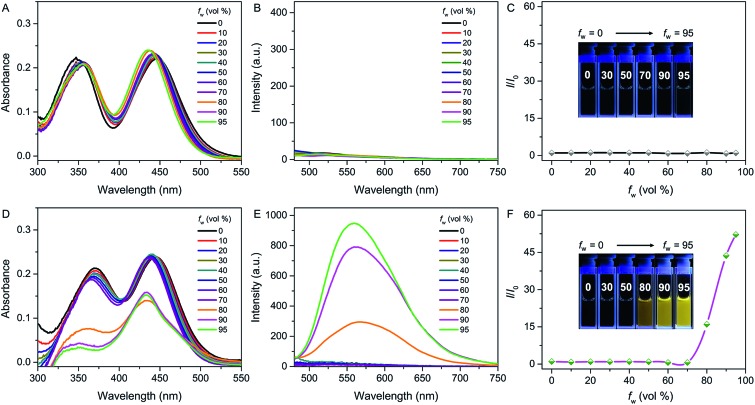
The photophysical properties of both QM–βgal and QM–OH were initially evaluated in water/dimethyl sulfoxide (DMSO) mixtures with different water fractions (fw). The absorption of both compounds covers the range of 300–500 nm with two peaks at 355 and 434 nm, respectively. We observed that the absorbance of QM–βgal always stays relatively unchanged with increasing fw (Fig. 1A), but that of QM–OH apparently descends once the fw is more than 70 vol% (Fig. 1D), which is caused by the scattering effect of nanoaggregates. As expected, QM–βgal endowed with good water solubility is virtually nonfluorescent in different water/DMSO mixtures (Fig. 1B and C), with a quantum yield (Φ) of 0.05 using fluorescein as a reference, because of its free motions in the molecularly dissolved state; while the emission of QM–OH increases quickly and monotonously when the fw is higher than 70 vol%, yielding a luminous yellow signal with an emission maximum at ∼560 nm. Specifically, at fw = 95 vol%, the fluorescence intensity of QM–OH is ca. 52-fold higher than its intrinsic fluorescence intensity in the benign solvent DMSO (Φ = 0.70, Fig. 1E and F). The impressive fluorescence is highly linked with the formation of QM–OH aggregates, which is confirmed by dynamic light scattering (DLS, Fig. S1†) and scanning electron microscope (SEM, Fig. S2†) measurements. The effective diameter of QM–OH in water/DMSO (fw = 95 vol%) is ∼150 nm. In contrast, no DLS signal was detected for QM–βgal solution, implying that it has good water solubility. These results indicate that the fluorescence of QM–OH can be revitalized in the aggregation state.
Fig. 1. Spectral properties of QM–βgal and QM–OH with different water fractions (fw) in a mixture of water/DMSO. (A) Absorption spectra, (B) emission spectra, and (C) I/I0 plots of QM–βgal (10 μM); (D) absorption spectra, (E) emission spectra, and (F) I/I0 plots of QM–OH (10 μM), where I is the fluorescence intensity at 560 nm and I0 is the fluorescence intensity of QM–βgal or QM–OH in 0% water, λex = 434 nm. Inset: images of (C) QM–βgal and (F) QM–OH with various fw under UV lamp illumination.
In situ generation of QM–OH nanoaggregates by β-gal activation
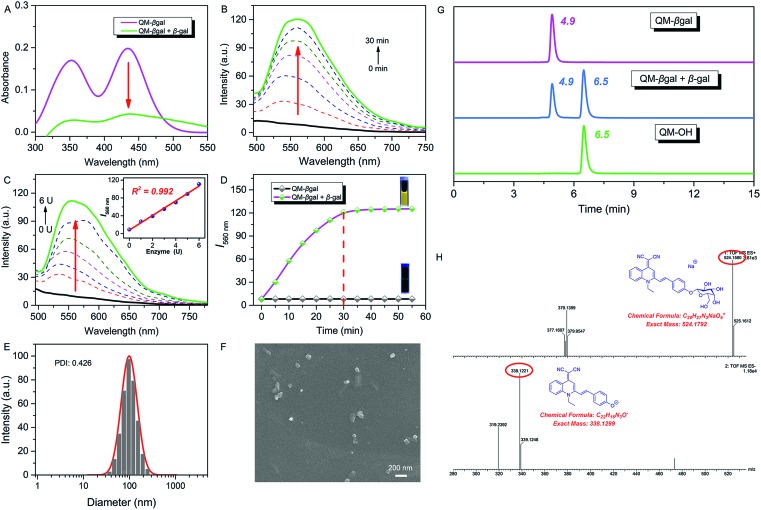
Subsequently, we focused on in situ generation of nanoaggregates and investigated the optical response of the as-prepared probe to β-gal in aqueous solution (PBS/DMSO = 95 : 5, v/v, 50 mM, pH = 7.4) at 37 °C. After addition of 6 U β-gal, the absorbance of QM–βgal decreased obviously (Fig. 2A), in accordance with that of QM–OH nanoaggregates (Fig. 1D). As shown in Fig. 2B, a quick and steady fluorescence increment at 560 nm was observed, with a Stokes shift up to ca. 125 nm. Significantly, a ca. 15-fold higher fluorescence intensity than the intrinsic fluorescence of the probe was obtained. Meanwhile, we found that increased fluorescence intensity has an apparently positive correlation with the concentration of β-gal (Fig. 2C), which is an indication of higher extent of enzymatic turnover and in situ generation of AIEgen nanoaggregates.
Fig. 2. (A) Absorption and (B) time-dependent fluorescence spectra of QM–βgal (10 μM) with 6 U β-gal in aqueous solution (PBS/DMSO = 95 : 5, v/v, 50 mM, pH = 7.4) at 37 °C. (C) Fluorescence spectra of QM–βgal (10 μM) upon treatment with increasing concentrations of β-gal (0–6 U). Inset (C): fluorescence intensity I560 nm as a function of β-gal concentration. (D) Fluorescence intensity I560 nm as a function of time, λex = 434 nm. (E) DLS data and (F) SEM of the ensemble system of QM–βgal and β-gal. (G) Reverse-phase HPLC chromatogram of QM–βgal, QM–βgal reaction with β-gal for 20 min, and QM–OH. The eluent is methanol/H2O (v/v, 8 : 2) mixed solvent. The flow rate is 0.6 mL min–1, and the detection wavelength is 434 nm. (H) HRMS demonstrating the enzyme-activatable mechanism and showing the cleavage product QM–OH.
The fluorescence intensity has a good linear relationship with β-gal in 0–6 U (R2 = 0.992, inset of Fig. 2C) and the detection limit of QM–βgal for β-gal was calculated to be as low as 1.0 × 10⁻³ U mL–1 (Fig. S3†). Moreover, the enzyme response rate was tested using time-course fluorescence profiles. After incubation with β-gal, the fluorescence intensity of the probe progressively increases in the early stage and gradually levels off at around 30 min (Fig. 2D), indicative of the rapid and efficient conversion of the substrate by β-gal. For the ensemble system of QM–βgal and β-gal, we also observed in situ generation of about 100 nm nanoaggregates by DLS and SEM characterization (Fig. 2E and F).
We speculated that the β-galactopyranoside as a leaving group could be specifically cleaved by β-gal, accompanied by in situ release of AIEgen QM–OH. To prove this, HPLC and HRMS analyses were systemically performed. As illustrated in Fig. 2G, the retention time of free QM–βgal and QM–OH is 4.9 and 6.5 min, respectively. After reaction with β-gal for 20 min, QM–βgal exhibited an intense peak with a retention time at 6.5 min, suggesting that QM–βgal is a substrate of β-gal and the sensing product is exclusively QM–OH. Actually, the product peak has a longer retention time of 6.5 min, demonstrating that its hydrophobicity is increased as compared to that of QM–βgal (4.9 min). Moreover, the cleavage product was further unambiguously confirmed by HRMS analysis. In the ensemble system of QM–βgal and β-gal, the peaks of QM–βgal and its cleavage product were found at m/z 524.1580 and 338.1221, respectively (Fig. 2H). All these results collectively substantiate that enzyme-catalyzed reaction in situ produces QM–OH nanoaggregates with bright fluorescence.
Selectivity and photostability
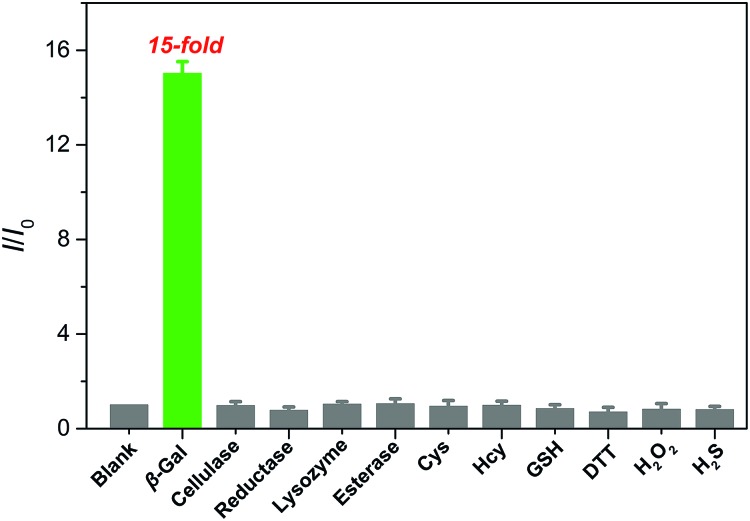
The selectivity of QM–βgal was investigated by monitoring its fluorescence response after exposure to various potentially interfering species, including enzyme species, amino acids, and biomolecules in aqueous solution (PBS/DMSO = 95 : 5, v/v, 50 mM, pH = 7.4) at 37 °C. As shown in Fig. 3, an approximately 15-fold increase in fluorescence intensity was only observed toward β-gal, while the presence of 100 equiv. of other enzyme species (cellulase, reductase, lysozyme, and esterase), amino acids (cysteine and homocysteine), and biomolecules (glutathione, dithiothreitol, hydrogen peroxide, and hydrogen sulfide) could give negligible fluorescence changes as low as the basal level under identical conditions. Considering the ionic strength is one of key factors for probe performance in biosensing, the fluorescence intensity of the probe with different concentrations of sodium chloride (NaCl) was measured. Increasing the concentration of NaCl from 0 to 960 mM, almost negligible changes in the fluorescence spectrum of the probe were obtained (Fig. S4A†), proving that ionic strength does not affect the fluorescence properties of the probe. Additionally, its fluorescence properties did not change either after incubation with Dulbecco's Modified Eagle Medium (DMEM) and Roswell Park Memorial Institute (RPMI 1640) medium, containing fetal bovine serum, amino acids, salts, glucose, and vitamins (Fig. S4B†). These data verify the superior selectivity of QM–βgal for β-gal over other competitive analytes and its potential utility as an activatable bioprobe for detecting β-gal in living cells.
Fig. 3. Fluorescence responses of QM–βgal (10 μM) upon incubation with β-gal (6 U) and various other analytes (100 equiv.) in aqueous solution (PBS/DMSO = 95 : 5, v/v, 50 mM, pH = 7.4) at 37 °C, λex = 434 nm. I/I0 represents the fluorescence intensity ratio at 560 nm, and I0 is the fluorescence intensity of free QM–βgal.
Photostability is another key factor to assess the performance of fluorophores for biomedical applications, especially for long-term tracking and bioimaging in disease diagnostics.51,52 Herein, time-dependent photobleaching measurements with lasting irradiation (Hamamatsu, LC8 Lightningcure, 300 W) were carried out for testing the photostability of QM–βgal and QM–OH, and the commercial contrast agent indocyanine green (ICG) was taken as a control. The fluorescence intensity of ICG rapidly decreased and reached a minimum level after ca. 1 min, suggesting ICG is subject to irreversible photobleaching. However, 88% of QM–OH fluorescence intensity still remained after exposing to high-density light for 1 min. Further, the fluorescence half-time of QM–OH is 21-fold longer than that of ICG (Fig. S5 and S6†), indicating that the QM fluorophore has excellent photostability and is suitable for long-term tracking and imaging.
On-site sensing of endogenous β-gal in living cells
Having established that QM–βgal could respond selectively to β-gal in aqueous solution with in situ formation of AIEgen nanoaggregates, we next explored its ability to on-site monitor endogenous β-gal in living cells. In this study, human ovarian carcinoma cells (SKOV-3 cells) with endogenous overexpressed β-gal were selected as the cell model,53,54 and human embryonic kidney cells (293T cells) without expressed β-gal as a negative control. Initially, the cytotoxicity of QM–βgal and its hydrolysate QM–OH was examined by a commonly used MTT assay. The results show the low cytotoxicity of QM–βgal and QM–OH in living cells (Fig. S7†).
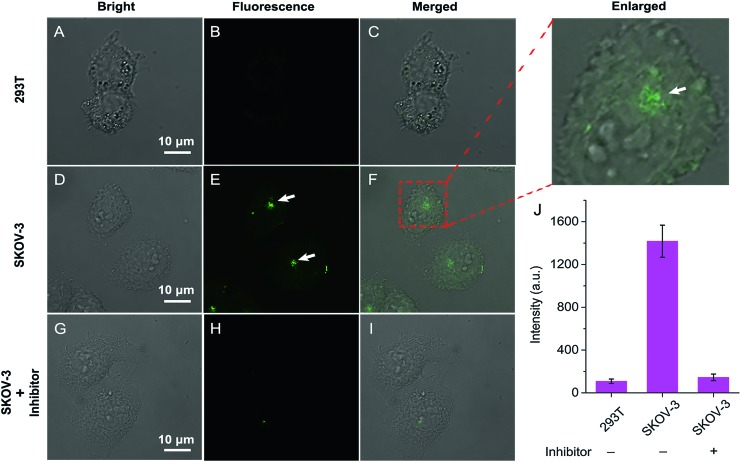
Fig. 4 shows confocal laser scanning microscopy (CLSM) images of 293T and SKOV-3 living cells loaded with QM–βgal for 0.5 h. As depicted in Fig. 4B, virtually no fluorescence signal was observed in 293T cells, in accordance with the weak fluorescence spectrum of QM–βgal (Fig. 1B). In sharp contrast, SKOV-3 cells cultured with QM–βgal displayed a clear light-up fluorescence signal, indicating that the probe has been activated by intracellular β-gal. Notably, intracellular unique bright spots mainly located in a local site rather than in the whole cytoplasm indicated that in situ generation of AIEgen nanoaggregates enables on-site sensing of β-gal activity (Fig. 4E). Meanwhile, when SKOV-3 cells were exposed to 1 mM d-galactose (an inhibitor of β-gal)55 for 0.5 h and then treated with QM–βgal for 0.5 h, the light-up fluorescence signal in the cells was obviously suppressed (Fig. 4H), manifesting that the obtained intracellular fluorescence is specifically activated by endogenous β-gal activity.
Fig. 4. CLSM images of 293T and SKOV-3 cells incubated with QM–βgal (10 μM) for 0.5 h: (A–C) 293T cells, (D–F) SKOV-3 cells, and (G–I) SKOV-3 cells pretreated with 1 mM inhibitor for 0.5 h. The fluorescence emission is 500–650 nm, λex = 404 nm. (J) Averaged fluorescence intensity in various cells. Error bars represent the standard deviation (±S.D.) with n = 3.
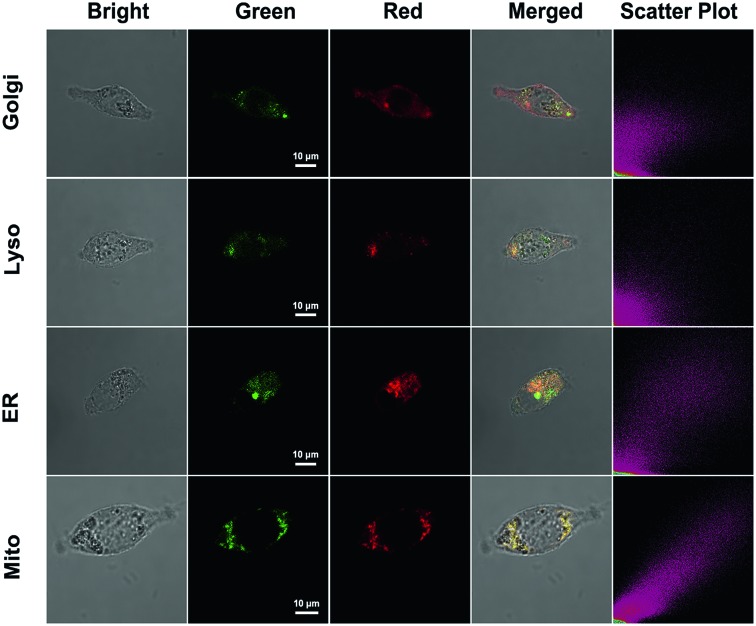
The subcellular colocalization of the fluorescence signal from QM–βgal was further performed in SKOV-3 cells by co-staining with commercially available Golgi-Tracker Red, Lyso-Tracker Red, ER-Tracker Red, and Mito-Tracker Red (Fig. 5). The green channel fluorescence of AIEgen nanoaggregates showed good overlap with the red channel fluorescence of Mito-Tracker Red and ER-Tracker Red, with Pearson's correlation coefficient of 0.933 and 0.835 (Table S1†), respectively, indicating that QM–OH tends to mainly accumulate in mitochondria and endoplasmic reticulum.
Fig. 5. CLSM images for intracellular localization of QM–βgal in SKOV-3 cells. Cells were incubated with QM–βgal (10 μM) for 2 h and then co-stained with 0.3 mg mL–1 Golgi-Tracker Red for 30 min, 75 nM Lyso-Tracker Red DND-99 for 60 min, 1 μM ER-Tracker Red (BODIPY® TR Glibenclamide) for 30 min, or 200 nM Mito-Tracker Red for 30 min. The green channel at 500–580 nm, λex = 404 nm. The red channel at 610–630 nm for Golgi-Tracker Red and ER-Tracker Red, 590–610 nm for Lyso-Tracker Red DND-99 and Mito-Tracker Red, λex = 561 nm.
Long-term tracking of β-gal-overexpressing living cells with high-fidelity
The inspiring results of the on-site sensing of endogenous β-gal activity encouraged us to study whether probe QM–βgal is good for long-term tracking of β-gal-overexpressing living cells with high spatiotemporal resolution. Previous studies reported that the exocytosis rate of nanoparticles is slower than that of small molecules and decreases with increasing size of the nanoparticle.56–58 That is, compared with small molecules, nanoparticles could improve intracellular retention owing to their size effect. Thus, taking advantage of the intrinsic AIE nature, spontaneously forming nanoaggregates with a light-up fluorescent readout, we sought to generalize its applicability to improve intracellular retention, increase signal fidelity, and achieve long-time tracking of β-gal-overexpressing living cells with reliable and high-contrast fluorescent signals.
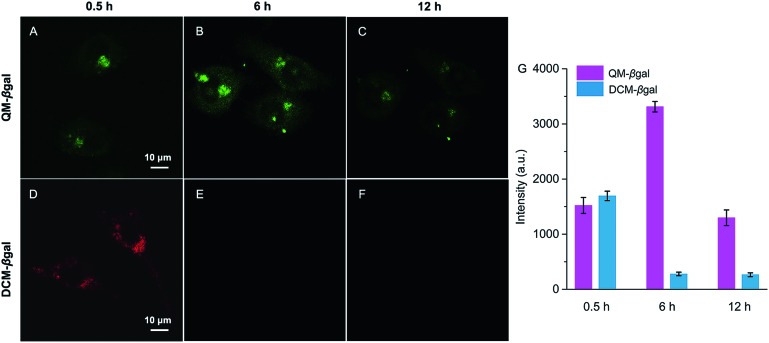
To verify our strategy, the reported probe DCM–βgal by functionalizing a traditional ACQ fluorophore DCM with a β-galactopyranoside group was chosen as a control (Scheme 2).25 After being treated with DCM–βgal or QM–βgal for 0.5 h, SKOV-3 ovarian cancer cells afforded an obvious fluorescence enhancement (Fig. 6A and D), implying that both of them are capable of visualizing intracellular β-gal levels. Significantly, upon prolonging the incubation time from 0.5 to 6 h, the fluorescence signal was barely observed in the DCM–βgal-treated SKOV-3 cells (Fig. 6E) due to its diffusion and ACQ effect. In contrast, a remarkable fluorescence increase accompanied by bright dots was clearly captured in the QM–βgal-treated SKOV-3 cells (Fig. 6B), and an about 12-fold higher fluorescence intensity than that of DCM–βgal-treated cells was observed (Fig. 6G), since the internalized nanoaggregates according to the AIE process do not easily leak out of cells during prolonged incubation. When the incubation time was increased to 12 h, although intracellular fluorescence intensity was slightly attenuated, the signal obtained with QM–βgal was restricted in the local region with low background fluorescence (Fig. 6C), which enables long-term and precise tracing of SKOV-3 ovarian cancer cells. Altogether, these results demonstrate that the AIE-active strategy in our design greatly improved the long-term tracking capability of QM–βgal with high resolution.
Fig. 6. Time-dependent CLSM images of SKOV-3 cells incubated with (A–C) QM–βgal (10 μM) and (D–F) DCM–βgal (10 μM). Fluorescence emission of QM–βgal and DCM–βgal is 500–650 nm (λex = 404 nm) and 605–725 nm (λex = 561 nm), respectively. (G) Averaged fluorescence intensity in cells with different incubation times. Error bars represent standard deviation (±S.D.) with n = 3.
Conclusions
In summary, guided by an enzyme-regulated liberation strategy, we have developed an AIE probe, QM–βgal, for on-site sensing and long-term tracking of β-gal activity. QM–βgal is almost non-emissive in aqueous media, but after being internalized into cells and activated by β-gal, enzymatic turnover would specifically release AIEgen QM–OH. Simultaneously, strongly emissive nanoparticles were in situ generated according to the AIE characteristic, providing a preferable method for on-site sensing of endogenous β-gal activity in living cells. Significantly, aided by its outstanding intracellular accumulation, we successfully demonstrate the applicability of QM–βgal for long-term tracking of β-gal-overexpressing living cells with high resolution. Meanwhile, QM–βgal features excellent selectivity, high photostability, and low cytotoxicity. This work not only provides an ideal tool in the study of the biological functions of enzymes, but also offers an enzyme-regulated liberation strategy for the design of high-fidelity AIEgen probes in preclinical applications.
Conflicts of interest
There are no conflicts to declare.
Supplementary Material
Acknowledgments
This work was supported by the NSFC/China (21788102, 21421004, 21636002 and 21622602), National Postdoctoral Program for Innovative Talents (BX201700075), National Key Research and Development Program (2017YFC0906902 and 2016YFA0200300), Scientific Committee of Shanghai (14ZR1409700 and 15XD1501400), Program of Introducing Talents of Discipline to Universities (B16017), and Open Funding Project of the State Key Laboratory of Bioreactor Engineering.
Footnotes
†Electronic supplementary information (ESI) available. See DOI: 10.1039/c8sc04266g
References
- Taylor A., Wilson K. M., Murray P., Fernig D. G., Levy R. Chem. Soc. Rev. 2012;41:2707–2717. doi: 10.1039/c2cs35031a. [DOI] [PubMed] [Google Scholar]
- Liu H., Li K., Hu X., Zhu L., Rong Q., Liu Y., Zhang X., Hasserodt J., Qu F., Tan W. Angew. Chem., Int. Ed. 2017;56:11788–11792. doi: 10.1002/anie.201705747. [DOI] [PubMed] [Google Scholar]
- Li K., Hu X., Liu H., Xu S., Huan S., Li J., Deng T., Zhang X. Anal. Chem. 2018;90:11680–11687. doi: 10.1021/acs.analchem.8b03335. [DOI] [PubMed] [Google Scholar]
- Wang Z., Chen S., Lam J. W. Y., Qin W., Kwok R. T. K., Xie N., Hu Q., Tang B. Z. J. Am. Chem. Soc. 2013;135:8238–8245. doi: 10.1021/ja312581r. [DOI] [PubMed] [Google Scholar]
- Pu K., Shuhendler A. J., Jokerst J. V., Mei J., Gambhir S. S., Bao Z., Rao J. Nat. Nanotechnol. 2014;9:233–239. doi: 10.1038/nnano.2013.302. [DOI] [PMC free article] [PubMed] [Google Scholar]
- Burke H. M., Gunnlaugsson T., Scanlan E. M. Chem. Commun. 2015;51:10576–10588. doi: 10.1039/c5cc02793d. [DOI] [PubMed] [Google Scholar]
- Sun W., Guo S., Hu C., Fan J., Peng X. Chem. Rev. 2016;116:7768–7817. doi: 10.1021/acs.chemrev.6b00001. [DOI] [PubMed] [Google Scholar]
- Wang S., Chen L., Jangili P., Sharma A., Li W., Hou J., Qin C., Yoon J., Kim J. S. Coord. Chem. Rev. 2018;374:36–54. [Google Scholar]
- Yang M., Fan J., Zhang J., Du J., Peng X. Chem. Sci. 2018;9:6758–6764. doi: 10.1039/c8sc02578a. [DOI] [PMC free article] [PubMed] [Google Scholar]
- Wu B., Lin Y., Li B., Zhan C., Zeng F., Wu S. Anal. Chem. 2018;90:9359–9365. doi: 10.1021/acs.analchem.8b01968. [DOI] [PubMed] [Google Scholar]
- He X., Li L., Fang Y., Shi W., Li X., Ma H. Chem. Sci. 2017;8:3479–3483. doi: 10.1039/c6sc05712h. [DOI] [PMC free article] [PubMed] [Google Scholar]
- Kim E., Kumar R., Sharma A., Yoon B., Kim H. M., Lee H., Hong K. S., Kim J. S. Biomaterials. 2017;122:83–90. doi: 10.1016/j.biomaterials.2017.01.009. [DOI] [PubMed] [Google Scholar]
- Guo Z., Zhu W., Shen L., Tian H. Angew. Chem., Int. Ed. 2007;46:5549–5553. doi: 10.1002/anie.200700526. [DOI] [PubMed] [Google Scholar]
- Yang Y., Zhao Q., Feng W., Li F. Chem. Rev. 2013;113:192–270. doi: 10.1021/cr2004103. [DOI] [PubMed] [Google Scholar]
- Wu D., Sedgwick A. C., Gunnlaugsson T., Akkaya E. U., Yoon J., James T. D. Chem. Soc. Rev. 2017;46:7105–7123. doi: 10.1039/c7cs00240h. [DOI] [PubMed] [Google Scholar]
- Kamiya M., Asanuma D., Kuranaga E., Takeishi A., Sakabe M., Miura M., Nagano T., Urano Y. J. Am. Chem. Soc. 2011;133:12960–12963. doi: 10.1021/ja204781t. [DOI] [PubMed] [Google Scholar]
- Li L., Zhang C., Chen G. Y. J., Zhu B., Chai C., Xu Q., Tan E., Zhu Q., Lim K., Yao S. Q. Nat. Commun. 2014;5:3276. doi: 10.1038/ncomms4276. [DOI] [PubMed] [Google Scholar]
- Yin J., Kwon Y., Kim D., Lee D., Kim G., Hu Y., Ryu J., Yoon J. J. Am. Chem. Soc. 2014;136:5351–5358. doi: 10.1021/ja412628z. [DOI] [PubMed] [Google Scholar]
- Yang P. Y., Wang M., Li L., Wu H., He C. Y., Yao S. Q. Chem.–Eur. J. 2012;18:6528–6541. doi: 10.1002/chem.201103322. [DOI] [PubMed] [Google Scholar]
- Gasser G., Pinto A., Neumann S., Sosniak A. M., Seitz M., Merz K., Heumann R., Metzler-Nolte N. Dalton Trans. 2012;41:2304–2313. doi: 10.1039/c2dt12114j. [DOI] [PubMed] [Google Scholar]
- Doura T., Kamiya M., Obata F., Yamaguchi Y., Hiyama T. Y., Matsuda T., Fukamizu A., Noda M., Miura M., Urano Y. Angew. Chem., Int. Ed. 2016;55:9620–9624. doi: 10.1002/anie.201603328. [DOI] [PubMed] [Google Scholar]
- Sun X., Xu Q., Kim G., Flower S. E., Lowe J. P., Yoon J., Fossey J. S., Qian X., Bull S. D., James T. D. Chem. Sci. 2014;5:3368–3373. [Google Scholar]
- Wu X., Sun X., Guo Z., Tang J., Shen Y., James T. D., Tian H., Zhu W. J. Am. Chem. Soc. 2014;136:3579–3588. doi: 10.1021/ja412380j. [DOI] [PubMed] [Google Scholar]
- Li Y., Sun Y., Li J., Su Q., Yuan W., Dai Y., Han C., Wang Q., Feng W., Li F. J. Am. Chem. Soc. 2015;137:6407–6416. doi: 10.1021/jacs.5b04097. [DOI] [PubMed] [Google Scholar]
- Gu K., Xu Y., Li H., Guo Z., Zhu S., Zhu S., Shi P., James T. D., Tian H., Zhu W. J. Am. Chem. Soc. 2016;138:5334–5340. doi: 10.1021/jacs.6b01705. [DOI] [PubMed] [Google Scholar]
- Liu Z., Zhou X., Miao Y., Hu Y., Kwon N., Wu X., Yoon J. Angew. Chem., Int. Ed. 2017;56:5812–5816. doi: 10.1002/anie.201702114. [DOI] [PubMed] [Google Scholar]
- Qi Y., Huang Y., Li B., Zeng F., Wu S. Anal. Chem. 2018;90:1014–1020. doi: 10.1021/acs.analchem.7b04407. [DOI] [PubMed] [Google Scholar]
- Mei J., Hong Y., Lam J. W. Y., Qin A., Tang Y., Tang B. Z. Adv. Mater. 2014;26:5429–5479. doi: 10.1002/adma.201401356. [DOI] [PubMed] [Google Scholar]
- Mei J., Leung N. L. C., Kwok R. T. K., Lam J. W. Y., Tang B. Z. Chem. Rev. 2015;115:11718–11940. doi: 10.1021/acs.chemrev.5b00263. [DOI] [PubMed] [Google Scholar]
- Li D., Yu J. Small. 2016;12:6478–6494. doi: 10.1002/smll.201601484. [DOI] [PubMed] [Google Scholar]
- Guo Z., Shao A., Zhu W. J. Mater. Chem. C. 2016;4:2640–2646. [Google Scholar]
- Cheng Y., Dai J., Sun C., Liu R., Zhai T., Lou X., Xia F. Angew. Chem., Int. Ed. 2018;57:3123–3127. doi: 10.1002/anie.201712803. [DOI] [PubMed] [Google Scholar]
- Gui S., Huang Y., Hu F., Jin Y., Zhang G., Yan L., Zhang D., Zhao R. Anal. Chem. 2015;87:1470–1474. doi: 10.1021/ac504153c. [DOI] [PubMed] [Google Scholar]
- Shi X., Yu C. Y. Y., Su H., Kwok R. T. K., Jiang M., He Z., Lam J. W. Y., Tang B. Z. Chem. Sci. 2017;8:7014–7024. doi: 10.1039/c7sc01054k. [DOI] [PMC free article] [PubMed] [Google Scholar]
- Yang J., Ren Z., Xie Z., Liu Y., Wang C., Xie Y., Peng Q., Xu B., Tian W., Zhang F., Chi Z., Li Q., Li Z. Angew. Chem., Int. Ed. 2017;56:880–884. doi: 10.1002/anie.201610453. [DOI] [PubMed] [Google Scholar]
- Li Q., Li Z. Sci. China: Chem. 2015;58:1800–1809. [Google Scholar]
- Zhang Y., Li D., Li Y., Yu J. Chem. Sci. 2014;5:2710–2716. [Google Scholar]
- Kwok R. T. K., Leung C. W. T., Lam J. W. Y., Tang B. Z. Chem. Soc. Rev. 2015;44:4228–4238. doi: 10.1039/c4cs00325j. [DOI] [PubMed] [Google Scholar]
- Nicol A., Kwok R. T. K., Chen C., Zhao W., Chen M., Qu J., Tang B. Z. J. Am. Chem. Soc. 2017;139:14792–14799. doi: 10.1021/jacs.7b08710. [DOI] [PubMed] [Google Scholar]
- Yuan Y., Zhang C., Xu S., Liu B. Chem. Sci. 2016;7:1862–1866. doi: 10.1039/c5sc03583j. [DOI] [PMC free article] [PubMed] [Google Scholar]
- Fan Z., Li D., Yu X., Zhang Y., Cai Y., Jin J., Yu J. Chem.–Eur. J. 2015;22:3681–3685. doi: 10.1002/chem.201504377. [DOI] [PubMed] [Google Scholar]
- Yuan Y., Zhang C., Gao M., Zhang R., Tang B. Z., Liu B. Angew. Chem., Int. Ed. 2014;54:1780–1786. doi: 10.1002/anie.201408476. [DOI] [PubMed] [Google Scholar]
- Feng G., Yuan Y., Fang H., Zhang R., Xing B., Zhang G., Zhang D., Liu B. Chem. Commun. 2015;51:12490–12493. doi: 10.1039/c5cc03807c. [DOI] [PubMed] [Google Scholar]
- Chatterjee S. K., Bhattacharya M., Barlow J. J. Cancer Res. 1979;39:1943–1951. [PubMed] [Google Scholar]
- Dimri G. P., Lee X., Basile G., Acosta M., Scott G., Roskelley C., Medrano E. E., Linskens M., Rubelj I., Pereira-Smith O. Proc. Natl. Acad. Sci. U. S. A. 1995;92:9363–9367. doi: 10.1073/pnas.92.20.9363. [DOI] [PMC free article] [PubMed] [Google Scholar]
- Shao A., Guo Z., Zhu S., Zhu S., Shi P., Tian H., Zhu W. Chem. Sci. 2014;5:1383–1389. [Google Scholar]
- Shao A., Xie Y., Zhu S., Guo Z., Zhu S., Guo J., Shi P., James T. D., Tian H., Zhu W. Angew. Chem., Int. Ed. 2015;54:7275–7280. doi: 10.1002/anie.201501478. [DOI] [PubMed] [Google Scholar]
- Wang M., Xu Y., Liu Y., Gu K., Tan J., Shi P., Yang D., Guo Z., Zhu W., Guo X., Cohen Stuart M. A. ACS Appl. Mater. Interfaces. 2018;10:25186–25193. doi: 10.1021/acsami.8b08159. [DOI] [PubMed] [Google Scholar]
- Shi C., Guo Z., Yan Y., Zhu S., Xie Y., Zhao Y. S., Zhu W., Tian H. ACS Appl. Mater. Interfaces. 2013;5:192–198. doi: 10.1021/am302466m. [DOI] [PubMed] [Google Scholar]
- Yao S., Shao A., Zhao W., Zhu S., Shi P., Guo Z., Zhu W., Shi J. RSC Adv. 2014;4:58976–58981. [Google Scholar]
- Wu X., Zhu W. Chem. Soc. Rev. 2015;44:4179–4184. doi: 10.1039/c4cs00152d. [DOI] [PubMed] [Google Scholar]
- Liu X., Qiao Q., Tian W., Liu W., Chen J., Lang M. J., Xu Z. J. Am. Chem. Soc. 2016;138:6960–6963. doi: 10.1021/jacs.6b03924. [DOI] [PubMed] [Google Scholar]
- Hung M., Zhang X., Yan D., Zhang H., He G., Zhang T., Shi D. Cancer Lett. 1992;61:95–103. doi: 10.1016/0304-3835(92)90166-s. [DOI] [PubMed] [Google Scholar]
- Asanuma D., Sakabe M., Kamiya M., Yamamoto K., Hiratake J., Ogawa M., Kosaka N., Choyke P. L., Nagano T., Kobayashi H., Urano Y. Nat. Commun. 2015;6:6463. doi: 10.1038/ncomms7463. [DOI] [PMC free article] [PubMed] [Google Scholar]
- Portaccio M., Stellato S., Rossi S., Bencivenga U., Mohy Eldin M. S., Gaeta F. S., Mita D. G. Enzyme Microb. Technol. 1998;23:101–106. [Google Scholar]
- Jin H., Heller D. A., Sharma R., Strano M. S. ACS Nano. 2009;3:149–158. doi: 10.1021/nn800532m. [DOI] [PubMed] [Google Scholar]
- Panyam J., Labhasetwar V. Pharm. Res. 2003;20:212–220. doi: 10.1023/a:1022219003551. [DOI] [PubMed] [Google Scholar]
- Zhou L., Lv F., Liu L., Shen G., Yan X., Bazan G. C., Wang S. Adv. Mater. 2018;30:1704888. doi: 10.1002/adma.201704888. [DOI] [PubMed] [Google Scholar]
Associated Data
This section collects any data citations, data availability statements, or supplementary materials included in this article.


