Abstract
Over the past decade, there has been a substantial increase in the number of beverage products containing added vitamins and minerals. Often viewed as a healthier choice by consumers, the metabolic impacts of excessive vitamin consumption are relatively unknown, especially in children. The aim of this study was to examine the effects of a widely available, vitamin fortified beverage (5h Energy Decaffeinated) on insulin sensitivity, metabolic hormones and serum metabolomic responses in adolescents. Twenty adolescents (13-19y, 10M/10F) completed two randomized trials, consuming either coloured water as placebo (PL) or a vitamin fortified, sugar free beverage (FB, 1.5ml/kg) 40min prior to a modified oral glucose tolerance test (OGTT, 1.75g/kg glucose). Samples were collected at baseline and at 30, 45, 60, 90 and 120min during the OGTT. No differences in blood glucose response were observed between the treatments. However, compared to PL, postprandial plasma C-peptide and insulin excursion was significantly greater with FB, resulting in a 28% decline in the insulin sensitivity index. This was accompanied by elevated GLP-1, glucagon and PYY responses with FB compared to PL. Serum metabolomics (1H-NMR) analysis also revealed perturbations to vitamin B-linked one carbon metabolism flux with FB consumption that became more pronounced over time. These included a transient reduction in homocysteine flux accompanied by increases in betaine, vitamin B6, vitamin B12, choline, folate and taurine. Although these impacts are likely short-lived, results show that beverages fortified with excessive amounts of vitamins are not metabolically inert, but likely result in greater insulin secretion, differential gut hormone secretion and elevated one-carbon flux to process the excessive vitamin loads.
Introduction
Discretionary fortification refers to the addition of micronutrients such as vitamins and minerals to foods and beverages by manufacturers. In recent years, the sales of discretionary fortified beverages (FB), including vitamin waters, juices and energy drinks have flourished with a 638% increase in sales over the past 12 years [1, 2]. On average, these novel beverages contain 4 to 5 micronutrients, often in quantities well in excess of the Estimated Average Requirements (EAR) [3]. In fact, 83% of recently analyzed beverages in this category contained at least 1 nutrient exceeding EAR for children and most contained 3 or more nutrients in excess [4].
Although advertised as a convenient way for consumers to meet their daily micronutrient requirements and improve health [5], concerns have been raised over the growing consumption of fortified foods and beverages, especially in pediatric populations [6]. While there is limited data on how beverage fortification has altered micronutrient intakes, it is clear that there has been a sharp increase in consumption with 8.5% of U.S. adolescents consuming FB weekly, with increased prevalence among older teens [7–9]. Expectedly, increased consumption has also been accompanied by an elevated caloric intake from fortified sources in the past decade [10]. While most fortifications pose no harm for consumers, a subcategory of FB with excessive vitamin levels has emerged. Such products are often marketed to, and consumed by adolescents [4].
Given this, the purpose of the present study was to examine the impacts of FB consumption, containing excessive levels of B-vitamins, on glucose metabolism, incretin responses and metabolomics profiles in adolescents. In particular, we were interested in how FB consumption affected responsiveness to a subsequent glucose load. Secondary aims were to examine the metabolic impacts of excessive B-vitamins, common FB additives, employing a proton nuclear magnetic resonance spectroscopy-based metabolomics (1H-NMR) approach. As individual responses to vitamin B metabolism are known to be impacted by genetics [11, 12], a precursory examination of gene-metabolite interactions using common B-vitamin linked variants (single nucleotide polymorphisms, SNPs) was also conducted.
Materials and methods
Subjects and study design
This study was approved by the Conjoint Health Research Ethics Board at the University of Calgary (REB14-1093) and registered at ClinicalTrials.gov (NCT03512496). Twenty healthy adolescents (10 male, 10 female) aged 13–19 years were recruited from the community (Alberta, Canada). Informed consents (child assent and parent consent) were obtained and basic demographic information, anthropometric measures including height, weight, waist circumference and body fat was collected. Self-report tanner staging was assessed as described [13, 14]. Menstrual phase was recorded, but not controlled in female participants.
In this randomized, double-blind, cross-over trial, participants completed two trials, placebo (PL, coloured water) and fortified beverage (FB, 5 Hour Energy™ Decaffeinated), separated by at least 1 week. The composition of FB is shown in the S1 Table. FB was administered based on body mass (1.5ml/kg) and equivalent to a 13-year-old (~38kg) consuming one bottle (57ml) of the beverage [15].
On the day of the trial, participants arrived at the laboratory following an overnight fast. An indwelling catheter was placed in the antecubital vein by a nurse to facilitate repeated blood sampling. Following baseline blood sampling, subjects consumed the test beverages and rested for 40min before undergoing a modified oral glucose tolerance test (OGTT, 1.75g/kg to a maximum of 75g, Trutol, Thermo Fisher, USA). Additional blood samples were collected at 0, 30, 45, 60, 90 and 120min. A study schematic of design and time points of blood collection is provided in S1 Fig.
Laboratory analyses
Blood samples collected at each time point were centrifuged and serum aliquots were frozen at -80°C for subsequent analyses. For metabolic hormones, blood was drawn into cooled EDTA vacutainer containing inhibitors: diprotinin-A (0.034g/L; MP Biomedicals), protease inhibitor (1g/L; Sigma Aldrich), and Roche Pefabloc (1g/L). Plasma glucose concentrations were analyzed by the use of a colorimetric-based glucose oxidase assay (Cayman Chemical, USA). A total of nine metabolic hormone biomarkers were simultaneously quantified via Human Metabolic Array 9-Plex (Eve Technologies, Canada) using the Bio-Plex 200 system (Bio-Rad, USA) according to protocol. The 9-Plex consisted of C-Peptide, ghrelin (active), glucose-dependent insulinotropic peptide (GIP), glucagon-like peptide-1 (GLP-1, active), glucagon, insulin, leptin, monocyte chemo attractant protein 1 (MCP-1), and total pancreatic polypeptide YY (PYY). Assay sensitivities ranged from 0.6-87pg/mL.
Serum metabolite profiling
Serum metabolites of samples collected from three time-points i.e., baseline (prior to drink consumption), 30 and 120min of OGTT were analyzed and profiled by 1H NMR spectroscopy (Bruker Advance 600, Canada) as previously described by our laboratory [16]. Briefly, serum samples (350 μL) were first filtered through pre-washed 10-kDa ultra centrifugal filters, and the filtrate was transferred to phosphate buffer containing NaN3 and dimethyl silapentane sulfonate (DSS). Samples were brought to a final volume of 450 μL with D2O, so that the concentration of DSS in the sample remained at 0.5M, before the analysis. Resultant data was individually processed and profiled using Chenomx NMR Suite 7.5 (Chenomx, Canada).
Preliminary SNP analysis
As B-vitamin linked genetic variants regulate flux and elimination, a precursory examination of gene-metabolite interactions was conducted. All participants provided 5mL of saliva in a genetic analysis tube containing a preservative (Genotek, Canada). Comprehensive genotyping for polymorphisms at defined loci was conducted (933 202 SNP Chip, Illumina, OmniExpress Plus Genotyping BeadChip). In order to examine gene-metabolic interactions, the literature was assessed for high global frequency alleles affecting vitamin B metabolism. The goal was a proof of principle inquiry based on high B vitamin intake from the FB rather than a comprehensive genetic analysis or genome wide association study. Our group has previously used this approach with high sensitivity during nutritional challenges [17]. Vitamin B linked one carbon metabolism SNPs examined in this study and their primary associated function are shown in S2 Table and included rs4654748 (ALPL), rs1999594 (MTHFR), rs651852 (BHMT), rs2851391 (CBS), rs1801222 (CUBN) and rs526934 (TCN) [11, 12, 18].
Statistical analyses
Area-under-the-curve (AUC) was calculated using the trapezoidal method [19]. Shapiro-Wilk confirmed normality, paired-samples t-test was conducted to identify treatment affects (Prism 7.03, GraphPad, USA). Expected genotype frequencies where calculated based on their Global Minor Allele Frequency (GMAF) as previously described [20] and compared with their observed frequencies by a chi-squared test to ensure Hardy-Weinberg equilibrium. A two-way ANOVA was applied to detect gene-metabolite interactions of the serum samples collected from the OGTT. Statistical significance was set at p<0.05.
For metabolomics, multivariate data analyses and model validation were performed in R (version 3.3.2) using “ropls” package [21] as described. Principal component analysis (PCA) and supervised orthogonal partial least square discriminant analysis (OPLS-DA) were applied to evaluate metabolite patterns with treatment. Model validation was performed using a ten-fold cross-validation method [22, 23]. The average ratio of total sum of squared errors (Q2Y) was compared to the percentage of Y variance captured in the total model (R2Y). Metabolites with Variable Importance in Projection (VIP) value more than 1 and raw p value ≤0.05 (independent t-test) were considered to be significant [21].
Results
Subjects
A total of twenty healthy adolescents participated in the study, and all completed both arms of the study. Basic anthropometric data is presented on Table 1. None of the participants showed any adverse effects to the consumption of the FB.
Table 1. Basic demographic and anthropometric information of participants.
| Parameter | Mean (SD) |
|---|---|
| Age (years) | 17 ± 2.2 |
| Gender | 10M;10F |
| BMI (kg/m2) | 22.6 ± 4.4 |
| Body fat % | 20.3 ± 5.6 |
| Body lean % | 76.3 ± 5.5 |
| Waist Circumference (cm) | 76.8 ± 10.5 |
| Tanner stage count | 4.3 ± 0.8 |
| Fasting blood glucose (mmol/l) | 4.5 ± 0.4 |
| Fasting insulin (pmol/l) | 89.9 ± 44.9 |
| Blood Pressure Systolic (mmHg) | 122.4 ± 16.3 |
| Blood Pressure Diastolic (mmHg) | 66.6 ± 9.5 |
Laboratory analyses
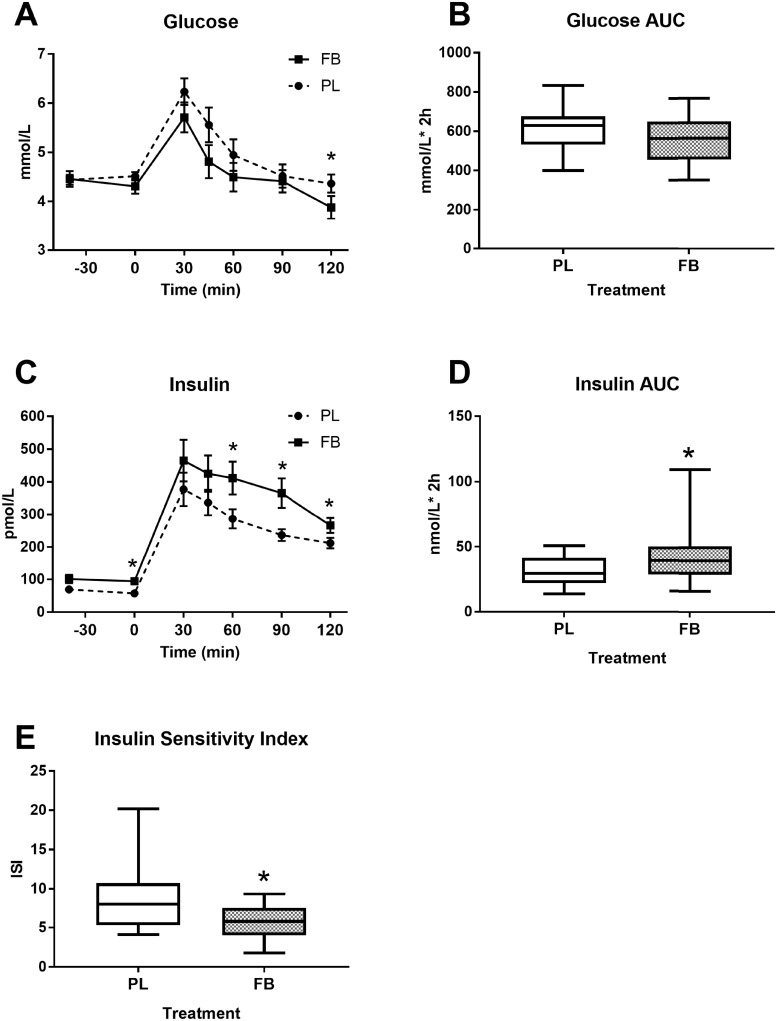
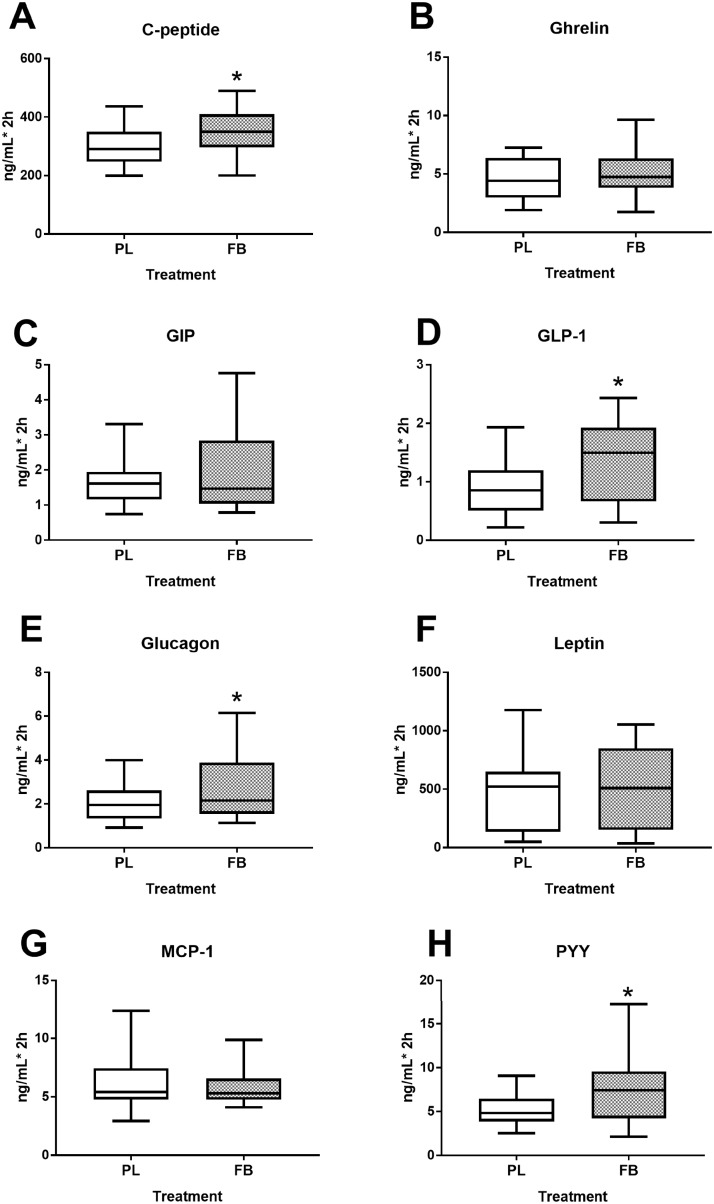
Plasma glucose and insulin excursion over time is shown in Fig 1. Concentrations of glucose reached an apogee at 30min and continued to fall thereafter. Even though AUC for glucose (Fig 1B) was not significantly different between the groups (p = 0.111), its concentration tended to be lower in FB group compared to PL group at several time-points (p = 0.012, Fig 1A). On the other hand, plasma insulin AUC (Fig 1D) was significantly (p = 0.003) higher in the FB group compared to PL group. Insulin sensitivity as assessed by the composite Matsuda Insulin Sensitivity Index (ISI) [24] was 28% lower with FB (p = 0.002, Fig 1E). Likewise, AUC of other metabolic hormones including C-peptide (p = 0.017), GLP-1 (p<0.001), glucagon (p = 0.015) and PYY (p = 0.001) were elevated in FB group compared to PL. However, AUC of ghrelin, GIP, leptin and MCP-1 did not differ between the treatment groups (Fig 2).
Fig 1. Plasma glucose and insulin excursion in response to an OGTT.
Figures show glucose concentration over time (A), glucose AUC (B), insulin concentration over time; (C), insulin AUC (D) and the composite Matsuda index (E). Values represent the means ± SE, n = 20. *Indicates significant difference between PL and FB at p≤0.05.
Fig 2. Impact of a FB administration on metabolic hormone responses to an OGTT.
Levels reflect AUC for the OGTT (0–120 minutes) for C-Peptide (A), Ghrelin (B), GIP (C), GLP-1 (D), Glucagon (E), Leptin (F), MCP-1 (G), and PYY (H). Values represent the means ± SE, n = 20. *Indicates significant difference between PL and FB at p≤0.05.
Serum metabolite profiling
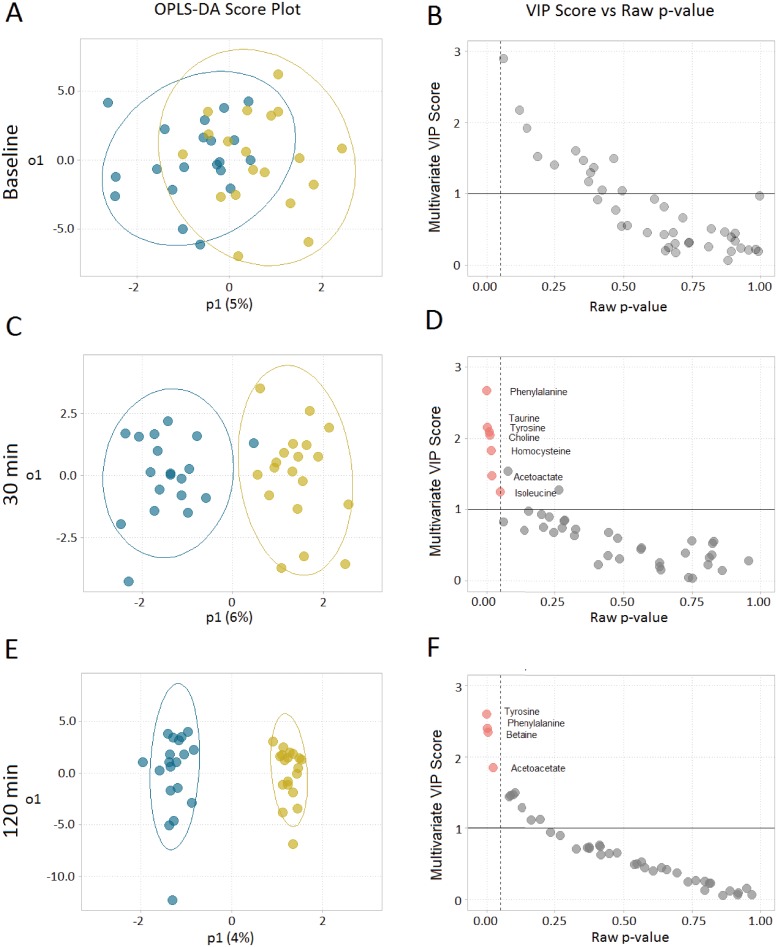
Metabolomics analysis was performed on serum samples collected at baseline, 30 min and 120 min of OGTT. A total of 42 metabolites (S3 Table) were detected by 1H-NMR spectroscopy. At baseline, there was no separation between treatment groups, and the OPLS-DA model was not significant (p>0.05). However, there was an incremental separation of the two treatment groups over time at 30 and 120min indicating a strong effect of FB on circulating serum metabolites (Fig 3A, 3C and 3E). Cross validation metrics for OPLS-DA models at 30min and 120min were R2Y = 0.84, Q2 = 0.673, p<0.001 and R2Y = 0.972, Q2 = 0.639, p<0.001 respectively. Both models demonstrated separation between treatments (p<0.05) within acceptable limits of both fit and predictive ability (R2 > 0.7, Q2 > 0.5). Significant metabolites identified by our model were: phenylalanine, taurine, tyrosine, choline, homocysteine, acetoacetate and isoleucine for 30min (Fig 3D); and tyrosine, phenylalanine, betaine and acetoacetate for 120min (Fig 3F).
Fig 3. Serum metabolomics analysis in response to FB consumption at 0, 30 and 120min.
OPLS-DA scores (A, C, E) and corresponding metabolites (B, D, F), red dots indicate significant metabolites (raw p-value ≤0.05 and VIP > 1), derived from the 1H-NMR spectra show progressive separation of treatments over time. n = 20.
Precursory gene-metabolite interactions
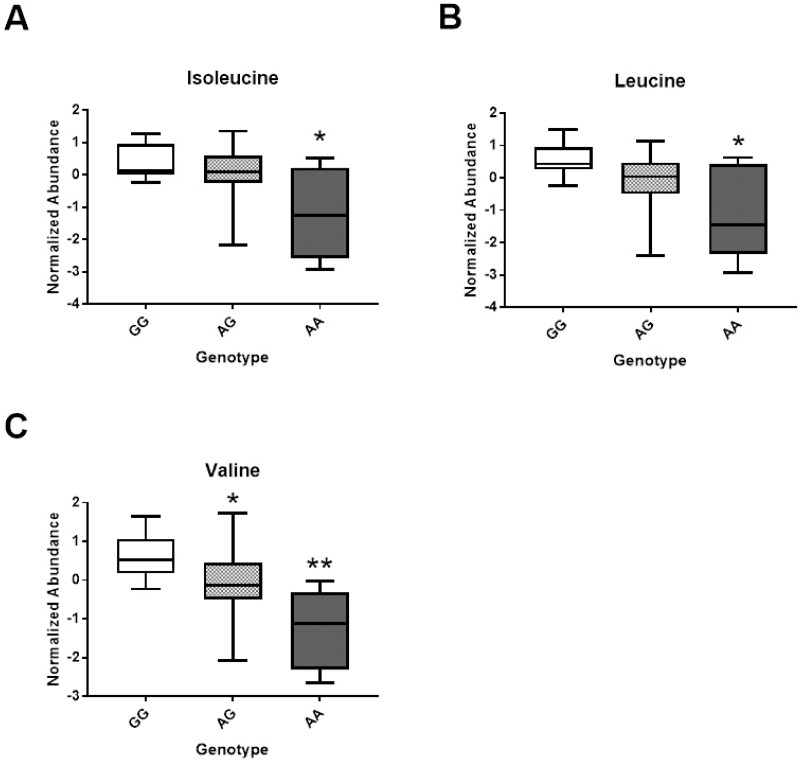
Although limited by our small sample size, we undertook an exploratory examination of gene-metabolite interactions within our study. Genotype distributions for all selected SNPs were not different from expected, Hardy-Weinberg equilibrium ratios, χ2 (p>0.05). Examination of gene-metabolite interactions showed a significant main genetic effect of rs651852, betaine-homocysteine s-methyltransferase (BHMT) for isoleucine, leucine and valine concentrations (Fig 4A–4C) at 120min. Individuals with homozygous A allele in rs651852 had significantly lower serum concentrations of the above branched-chain amino acids compared to their G allele counterparts. All other SNPs examined including rs1801222, rs526934, rs4654748, rs1999594 and rs2851391 exhibited a significant treatment effect only; but did not show either main genetic or interaction effect (S4 Table). These novel findings will require validation in a larger cohort to be confirmed.
Fig 4. Preliminary analysis of gene-metabolite interactions with FB administration.
Box plots for significant main gene effects for rs651852, BHMT polymorphism are shown for Isoleucine (A), Leucine (B) and Valine (C), * or ** represent significant difference (p<0.05) between genotypes.
Discussion
Vitamin containing FB are widely consumed by adolescents [7, 8]. This study evaluated the impact of a highly fortified vitamin B containing cocktail on glucose metabolism, metabolic hormone responses and metabolite profiles in adolescents. Major findings of the current study are as follows: (i) the ingested FB disproportionately increased the insulin response to an oral glucose challenge; (ii) the FB differentially affected the secretion of metabolic hormones and (iii) FB transiently altered one carbon, B-vitamin linked amino acid metabolism in response to ingestion. These results suggest that FB could have metabolic impacts that are ingredient and concentration dependent.
To decipher the impact of an FB on glucose and insulin responses, adolescent subjects consumed PL or FB followed 40 minutes later by a standard OGTT. This time was chosen as it allowed for full absorption of the FB and its subsequent impacts on glucose tolerance to be realized. Results showed no difference in glucose levels with FB consumption, both glucose peak and total area under the curve during the OGTT remained unchanged between treatments. However, examination of insulin levels revealed a 24% increase over the OGTT along with significantly elevated C-peptide levels with FB consumption. These responses resulted in a 28% decline in the composite ISI, an indicator of glucose disposal relative to insulin levels. The FB employed in the present study, 5h Energy Decaffeinated, contained several insulinogenic ingredients including sucralose and free amino acids [25, 26]. Higher insulin concentrations without altered glycemia with acute sucralose consumption has been previously reported [27]. Likewise, there is a growing body of evidence showing that the consumption of artificial sweeteners may disrupt glucose homeostasis and is positively associated with host metabolic derangements including obesity, diabetes and cardiovascular disease with chronic consumption [26, 28, 29].
Next, we examined the influence of FB ingestion on gastrointestinal hormone profiles in response to the OGTT. The incretins GLP-1 and GIP are gut-derived hormones that potentiate postprandial insulin secretion [30] and are necessary for normal glucose tolerance [31]. In the present study, we show significantly higher levels of GLP-1, PYY and glucagon with a glucose load with FB pretreatment compared to the PL group. The observed increases in PYY levels with FB consumption were most likely a result of the high levels of free amino acids in the FB including tyrosine and phenylalanine [32]. Augmented GLP-1 secretion with FB may have also resulted from the sucralose contained in the beverage. This finding is consistent with previous observations showing diet soda consumption (containing artificial sweeteners) to elevate GLP-1 secretion in healthy adolescents [33].
Common in many FB, our test beverage also contained levels of B vitamins (B6, folic acid and B12) at concentrations above recommended levels. Of note, the Recommended Dietary Allowance (RDA) for vitamin B6 and B12 range from 1.0–1.3mg/d and 1.8–2.4μg/d for children aged 9-18y respectively [3]. The test beverage contained 40mg of vitamin B6 and 500μg of vitamin B12 which are 3000% and 20000% of the RDA (S1 Table). Perhaps more concerning is this proximity to its upper limit (UL) of ingredients with either a single serving or multiple servings per day. For example, a single serving is below the B6 UL of 60mg per day for 9-13y, but more than one serving would exceed this limit. Although B-vitamins play crucial roles in numerous enzymatic reactions, high doses have been associated with toxicity [34, 35]. Whilst toxicity is unlikely due to high tolerance limits [34], several servings of FB might be a concern to young children and adolescents due to their lower body mass.
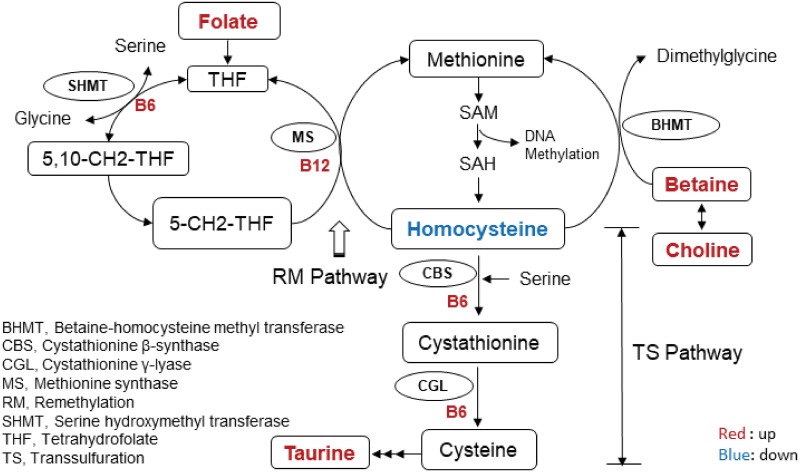
To gain insight into the metabolic alterations resulting from FB ingestion, a metabolomics approach was employed. Results demonstrated no difference in serum metabolites at baseline between the two treatments. However, at both early (30 min) and late time points (120 min), a progressive separation of profiles was observed, reflecting absorption and distribution of FB ingredients throughout the circulation. Ingested FB components appearing in the metabolomics analysis included taurine, phenylalanine, tyrosine and choline (administered as citicoline). Unexpectedly, differences in a number of other metabolites that were not ingested as part of the FB were also observed between treatments including homocysteine, betaine and acetoacetate. These differences implicate shifts in the pathways governing these metabolites including vitamin B-linked one carbon metabolism with FB ingestion. Notably, we show homocysteine levels to be reduced 30min after the glucose challenge with the FB. This is likely due to an increase in clearance, from activation of the B-vitamin-dependent enzymes linked to sulfur amino acid metabolism either through the remethylation or transsulfuration pathways (Fig 5). Additionally, choline (an ingredient in FB) is converted to betaine (p<0.05 at 120min) resulting in further augmentation of homocysteine clearance through the BHMT enzyme system. Similar alterations and reduced homocysteine levels have been observed with supplementation of both betaine and choline in the diet [36, 37]. Atkinson et al.[36] observed a significant decrease in plasma total homocysteine concentrations of healthy men 4h after consuming a betaine and choline-rich meal, supporting our finding that the FB consumed in this study likely resulted in alterations to pathways governing vitamin B-linked one carbon metabolism.
Fig 5. Schematic of the pathways and metabolites in B-vitamin-linked one carbon metabolism affected by FB consumption in adolescents.
Affected metabolites are highlighted. Red indicates upregulation while blue indicates a downregulation with FB administration.
Upon examination of metabolite profiles with FB, we noted some variable patterns that led us to examine the influence of genetic variation for enzymes related to vitamin B-metabolism. Our laboratory has found that the contribution of genetic variation to metabolic flux can often be revealed with a targeted nutritional challenge (FB administration in this case) [17]. Our preliminary analysis revealed one SNP to significantly interact with metabolite profiles in response to the FB challenge, rs651852 (BHMT). Described as a central ‘short cut’ through the methylation cycle, this enzyme is central to converting homocysteine to methionine which donates a methyl group to DNA, proteins, lipids, and other intracellular metabolites [38]. In the present study, this one carbon metabolism gene polymorphism significantly influenced serum isoleucine, leucine and valine concentrations, with the minor allele resulting in lower concentrations at 120min post FB ingestion. This novel finding indicates that genetic variance likely alters the metabolic responsiveness to FB consumption, although this needs to be confirmed in a larger cohort.
While this study shows FB to have metabolic impacts in adolescents, it must be emphasized that our FB was administered as a commercially available mixed ingredient product. As such, it is not possible to pinpoint specific responses to a single nutrient, and the observed responses are likely product and ingredient specific. From a clinical standpoint, the finding related to the impact of FB on glucose tolerance warrants further investigation. A 28% reduction in the ISI in healthy adolescents following FB consumption could be exaggerated in overweight and obese adolescents. There may also be consequences for healthy eating. The greater the intake of discretionarily fortified foods and beverages, the lower the intake of fruits and vegetables, milk products, meats and alternatives suggesting the replacement of healthy eating practices with convenience foods and beverages such as vitamin loaded FB [39].
In conclusion, this study identified metabolic impacts of a highly fortified vitamin beverage on glucose metabolism, metabolic hormones and serum metabolites in adolescents. Although these impacts are likely short-lived, results show that beverages fortified with high amounts of vitamins are not metabolically inert, but likely result in greater insulin secretion, differential hormone secretion and elevated one-carbon flux to process the excessive vitamin loads. Given this, ongoing evaluation of products with levels of fortification of vitamins and minerals that exceed the Recommended Dietary Allowance appears warranted.
Supporting information
(EPS)
(EPS)
(EPS)
(EPS)
Treatments are given at baseline which is -40 min before the OGGT. Blood samples collected from all time-points starting from 0 min till 120 min were used for quantifying different analytes including glucose, insulin, and gut hormones. The samples collected at baseline, 30 min and 120 min were used for metabolomics. FB, Functional beverage.
(EPS)
Acknowledgments
The authors gratefully acknowledge the technical assistance of Claire Gougeon, a pediatric nurse at the Alberta Children’s Hospital for her work in catheter placement.
Data Availability
All relevant data are within the manuscript and its Supporting Information files.
Funding Statement
The research was funded by the Alberta Children’s Hospital Research Institute and the Natural Sciences and Engineering Research Council of Canada (JS). SM is funded through an Eyes High Postdoctoral Fellowship and an Alberta Innovates Health Solutions Postdoctoral Fellowship. The funders had no role in study design, data collection and analysis, decision to publish, or preparation of the manuscript.
References
- 1.Harris JL, Munsell CR. Energy drinks and adolescents: what’s the harm? Nutr Rev. 2015;73(4):247–57. 10.1093/nutrit/nuu061 . [DOI] [PubMed] [Google Scholar]
- 2.Jones AC, Veerman J.L., Hammond D. Health and Economic Impacts of Sugary Drinks in Canada-Research Summary. Heart and Strock. 2017. [Google Scholar]
- 3.Dietary Reference Intakes for Thiamin, Riboflavin, Niacin, Vitamin B6, Folate, Vitamin B12, Pantothenic Acid, Biotin, and Choline The National Academies Collection: Reports funded by National Institutes of Health. Washington (DC)1998. [PubMed] [Google Scholar]
- 4.Dachner N, Mendelson R, Sacco J, Tarasuk V. An examination of the nutrient content and on-package marketing of novel beverages. Appl Physiol Nutr Metab. 2015;40(2):191–8. 10.1139/apnm-2014-0252 . [DOI] [PubMed] [Google Scholar]
- 5.Dwyer JT, Woteki C, Bailey R, Britten P, Carriquiry A, Gaine PC, et al. Fortification: new findings and implications. Nutr Rev. 2014;72(2):127–41. 10.1111/nure.12086 . [DOI] [PubMed] [Google Scholar]
- 6.Hoyte C. The toxicity of energy drinks: myth or reality? Clin Toxicol (Phila). 2013;51(8):729–30. 10.3109/15563650.2013.825268 . [DOI] [PubMed] [Google Scholar]
- 7.Kumar GS, Park S, Onufrak S. Association between reported screening and counseling about energy drinks and energy drink intake among U.S. adolescents. Patient Educ Couns. 2014;94(2):250–4. 10.1016/j.pec.2013.09.026 . [DOI] [PubMed] [Google Scholar]
- 8.Gallimberti L, Buja A, Chindamo S, Vinelli A, Lazzarin G, Terraneo A, et al. Energy drink consumption in children and early adolescents. Eur J Pediatr. 2013;172(10):1335–40. 10.1007/s00431-013-2036-1 . [DOI] [PubMed] [Google Scholar]
- 9.Sylvetsky AC, Jin Y, Clark EJ, Welsh JA, Rother KI, Talegawkar SA. Consumption of Low-Calorie Sweeteners among Children and Adults in the United States. J Acad Nutr Diet. 2017;117(3):441–8 e2. 10.1016/j.jand.2016.11.004 . [DOI] [PMC free article] [PubMed] [Google Scholar]
- 10.Hennessy A, Hannon EM, Walton J, Flynn A. Impact of voluntary food fortification practices in Ireland: trends in nutrient intakes in Irish adults between 1997–9 and 2008–10. Br J Nutr. 2015;113(2):310–20. Epub 2014/12/18. 10.1017/S0007114514003651 . [DOI] [PubMed] [Google Scholar]
- 11.Hazra A, Kraft P, Lazarus R, Chen C, Chanock SJ, Jacques P, et al. Genome-wide significant predictors of metabolites in the one-carbon metabolism pathway. Hum Mol Genet. 2009;18(23):4677–87. 10.1093/hmg/ddp428 [DOI] [PMC free article] [PubMed] [Google Scholar]
- 12.Tanaka T, Scheet P, Giusti B, Bandinelli S, Piras MG, Usala G, et al. Genome-wide association study of vitamin B6, vitamin B12, folate, and homocysteine blood concentrations. Am J Hum Genet. 2009;84(4):477–82. 10.1016/j.ajhg.2009.02.011 [DOI] [PMC free article] [PubMed] [Google Scholar]
- 13.Marshall WA, Tanner JM. Variations in the pattern of pubertal changes in boys. Arch Dis Child. 1970;45(239):13–23. [DOI] [PMC free article] [PubMed] [Google Scholar]
- 14.Marshall WA, Tanner JM. Variations in pattern of pubertal changes in girls. Arch Dis Child. 1969;44(235):291–303. [DOI] [PMC free article] [PubMed] [Google Scholar]
- 15.Centers for Disease Control and Prevention. Growth charts. Data Table for Weight-for-age Chart. https://www.cdc.gov/growthcharts/html_charts/wtage.htm. Updated August 24, 2001. Accessed October 13, 2017. [updated August 24, 2001].
- 16.Paul HA, Bomhof MR, Vogel HJ, Reimer RA. Diet-induced changes in maternal gut microbiota and metabolomic profiles influence programming of offspring obesity risk in rats. Sci Rep. 2016;6:20683 10.1038/srep20683 [DOI] [PMC free article] [PubMed] [Google Scholar]
- 17.Connors KE, Karlos AE, Gnatiuk EA, Shearer J, Reimer RA, Hittel DS. SORT1 Protective Allele Is Associated With Attenuated Postprandial Lipaemia in Young Adults. Circ-Cardiovasc Gene. 2014;7(5):576–82. 10.1161/Circgenetics.114.000534 [DOI] [PubMed] [Google Scholar]
- 18.Zinck JW, de Groh M, MacFarlane AJ. Genetic modifiers of folate, vitamin B-12, and homocysteine status in a cross-sectional study of the Canadian population. Am J Clin Nutr. 2015;101(6):1295–304. 10.3945/ajcn.115.107219 . [DOI] [PubMed] [Google Scholar]
- 19.Yeh KC, Kwan KC. A comparison of numerical intergrating algorithms by trapezoial, lagrange, and spline approximation. Journal of Pharmacokinetics and Biopharmaceutics. 1978;6(1):79–98. [DOI] [PubMed] [Google Scholar]
- 20.Gordish-Dressman H, Devaney JM. Statistical and Methodological Considerations in Exercise Genomics In: Pescatello LS, Rother SM, editors. Exercise Genomics. New York: Humana Press; 2010. [Google Scholar]
- 21.Thevenot EA, Roux A, Xu Y, Ezan E, Junot C. Analysis of the Human Adult Urinary Metabolome Variations with Age, Body Mass Index, and Gender by Implementing a Comprehensive Workflow for Univariate and OPLS Statistical Analyses. J Proteome Res. 2015;14(8):3322–35. 10.1021/acs.jproteome.5b00354 [DOI] [PubMed] [Google Scholar]
- 22.Xia JG, Sinelnikov IV, Han B, Wishart DS. MetaboAnalyst 3.0-making metabolomics more meaningful. Nucleic Acids Res. 2015;43(W1):W251–W7. 10.1093/nar/gkv380 [DOI] [PMC free article] [PubMed] [Google Scholar]
- 23.Eriksson L, Trygg J, Wold S. CV-ANOVA for significance testinf of PLS and OPLS models. Journal of Chemometrics. 2008;22:594–600. [Google Scholar]
- 24.Matsuda M, DeFronzo RA. Insulin sensitivity indices obtained from oral glucose tolerance testing—Comparison with the euglycemic insulin clamp. Diabetes Care. 1999;22(9):1462–70. 10.2337/diacare.22.9.1462 [DOI] [PubMed] [Google Scholar]
- 25.Palmnas MS, Cowan TE, Bomhof MR, Su J, Reimer RA, Vogel HJ, et al. Low-dose aspartame consumption differentially affects gut microbiota-host metabolic interactions in the diet-induced obese rat. Plos One. 2014;9(10):e109841 10.1371/journal.pone.0109841 [DOI] [PMC free article] [PubMed] [Google Scholar]
- 26.Suez J, Korem T, Zeevi D, Zilberman-Schapira G, Thaiss CA, Maza O, et al. Artificial sweeteners induce glucose intolerance by altering the gut microbiota. Nature. 2014;514(7521):181–6. 10.1038/nature13793 . [DOI] [PubMed] [Google Scholar]
- 27.Sylvetsky AC, Brown RJ, Blau JE, Walter M, Rother KI. Hormonal responses to non-nutritive sweeteners in water and diet soda. Nutr Metab (Lond). 2016;13:71 10.1186/s12986-016-0129-3 [DOI] [PMC free article] [PubMed] [Google Scholar]
- 28.Swithers SE. Artificial sweeteners produce the counterintuitive effect of inducing metabolic derangements. Trends Endocrinol Metab. 2013;24(9):431–41. 10.1016/j.tem.2013.05.005 [DOI] [PMC free article] [PubMed] [Google Scholar]
- 29.Sylvetsky Meni AC, Swithers SE, Rother KI. Positive association between artificially sweetened beverage consumption and incidence of diabetes. Diabetologia. 2015;58(10):2455–6. 10.1007/s00125-015-3694-5 [DOI] [PMC free article] [PubMed] [Google Scholar]
- 30.Campbell JE, Drucker DJ. Pharmacology, Physiology, and Mechanisms of Incretin Hormone Action. Cell Metab. 2013;17(6):819–37. 10.1016/j.cmet.2013.04.008 [DOI] [PubMed] [Google Scholar]
- 31.Muscelli E, Mari A, Casolaro A, Camastra S, Seghieri G, Gastaldelli A, et al. Separate impact of obesity and glucose tolerance on the incretin effect in normal subjects and type 2 diabetic patients. Diabetes. 2008;57(5):1340–8. 10.2337/db07-1315 [DOI] [PubMed] [Google Scholar]
- 32.van der Klaauw AA, Keogh JM, Henning E, Trowse VM, Dhillo WS, Ghatei MA, et al. High protein intake stimulates postprandial GLP1 and PYY release. Obesity (Silver Spring). 2013;21(8):1602–7. 10.1002/oby.20154 . [DOI] [PMC free article] [PubMed] [Google Scholar]
- 33.Brown RJ, Walter M, Rother KI. Effects of diet soda on gut hormones in youths with diabetes. Diabetes Care. 2012;35(5):959–64. 10.2337/dc11-2424 [DOI] [PMC free article] [PubMed] [Google Scholar]
- 34.Snodgrass SR. Vitamin neurotoxicity. Mol Neurobiol. 1992;6(1):41–73. . [DOI] [PubMed] [Google Scholar]
- 35.Harb JN, Taylor ZA, Khullar V, Sattari M. Rare cause of acute hepatitis: a common energy drink. BMJ Case Rep. 2016;2016 10.1136/bcr-2016-216612 [DOI] [PMC free article] [PubMed] [Google Scholar]
- 36.Atkinson W, Elmslie J, Lever M, Chambers ST, George PM. Dietary and supplementary betaine: acute effects on plasma betaine and homocysteine concentrations under standard and postmethionine load conditions in healthy male subjects. American Journal of Clinical Nutrition. 2008;87(3):577–85. 10.1093/ajcn/87.3.577 [DOI] [PubMed] [Google Scholar]
- 37.Olthof MR, Brink EJ, Katan MB, Verhoef P. Choline supplemented as phosphatidylcholine decreases fasting and postmethionine-loading plasma homocysteine concentrations in healthy men. American Journal of Clinical Nutrition. 2005;82(1):111–7. 10.1093/ajcn.82.1.111 [DOI] [PubMed] [Google Scholar]
- 38.Obeid R. The metabolic burden of methyl donor deficiency with focus on the betaine homocysteine methyltransferase pathway. Nutrients. 2013;5(9):3481–95. 10.3390/nu5093481 [DOI] [PMC free article] [PubMed] [Google Scholar]
- 39.Sacco JE, Tarasuk V. Discretionary addition of vitamins and minerals to foods: implications for healthy eating. Eur J Clin Nutr. 2011;65(3):313–20. 10.1038/ejcn.2010.261 . [DOI] [PubMed] [Google Scholar]
Associated Data
This section collects any data citations, data availability statements, or supplementary materials included in this article.
Supplementary Materials
(EPS)
(EPS)
(EPS)
(EPS)
Treatments are given at baseline which is -40 min before the OGGT. Blood samples collected from all time-points starting from 0 min till 120 min were used for quantifying different analytes including glucose, insulin, and gut hormones. The samples collected at baseline, 30 min and 120 min were used for metabolomics. FB, Functional beverage.
(EPS)
Data Availability Statement
All relevant data are within the manuscript and its Supporting Information files.


