Abstract
cAMP is a universal second messenger regulating a plethora of processes in the kidney. Two downstream effectors of cAMP are PKA and exchange protein directly activated by cAMP (Epac), which, unlike PKA, is often linked to elevation of [Ca2+]i. While both Epac isoforms (Epac1 and Epac2) are expressed along the nephron, their relevance in the kidney remains obscure. We combined ratiometric calcium imaging with quantitative immunoblotting, immunofluorescent confocal microscopy, and balance studies in mice lacking Epac1 or Epac2 to determine the role of Epac in renal water-solute handling. Epac1−/− and Epac2−/− mice developed polyuria despite elevated arginine vasopressin levels. We did not detect major deficiencies in arginine vasopressin [Ca2+]i signaling in split-opened collecting ducts or decreases in aquaporin water channel type 2 levels. Instead, sodium–hydrogen exchanger type 3 levels in the proximal tubule were dramatically reduced in Epac1−/− and Epac2−/− mice. Water deprivation revealed persisting polyuria, impaired urinary concentration ability, and augmented urinary excretion of Na+ and urea in both mutant mice. In summary, we report a nonredundant contribution of Epac isoforms to renal function. Deletion of Epac1 and Epac2 decreases sodium–hydrogen exchanger type 3 expression in the proximal tubule, leading to polyuria and osmotic diuresis.—Cherezova, A., Tomilin, V., Buncha, V., Zaika, O., Ortiz, P. A., Mei, F., Cheng, X., Mamenko, M., Pochynyuk, O. Urinary concentrating defect in mice lacking Epac1 or Epac2.
Keywords: collecting duct, AQP2, NHE-3, urea, water deprivation
Exchange protein directly activated by cAMP (Epac) is a relatively new addition to the intricate cAMP signaling network (1–3). Epac accounts for the downstream transduction pathway activated by increased cAMP levels, which operates independently from the classic PKA-dependent phosphorylation events (4, 5). Epac serves as a guanine–nucleotide exchange factor for the small G protein Rap to initiate a variety of cellular processes, including MAPK/ERK activation, mobilization of intracellular [Ca2+]i, and exocytosis (6, 7). The cAMP-binding affinity of 2 known Epac isoforms, Epac1 and Epac2, is similar to that of PKA (6). Both isoforms are ubiquitously expressed in different tissues, though Epac1 predominates in the kidney, ovary, skeletal muscle, thyroid, and brain, and Epac2 expression is the most robust in the CNS, adrenal gland, and pancreas (1). Altered Epac signaling cascades or Epac mutations have been identified in a variety of diseases, including Alzheimer disease, autism, depression, cancer development and metastasis, arrhythmias, heart failure, hyperalgesia, polycystic kidney disease, and ischemic kidney injury (8, 9).
Epac1 and Epac2 protein expression was found almost in all nephron segments from the proximal tubule to collecting duct (CD) of rodent and human kidney (10). The expression pattern of both isoforms is similar but not identical, and demonstrated preferentially apical localization, indicating their potentially unique contribution to water-solute transport and cellular proliferation (10). Implementation of Epac-selective cAMP analogs, such as 8-(4-chloro-phenylthio)-2′-O-methyladenosine-3′,5′-cyclic monophosphate (8-pCPT-2′-O-Me-cAMP) (11), indicated that Epac-dependent pathway contributes to various hormonal actions in the nephron. This includes arginine vasopressin (AVP)-mediated intracellular Ca2+ mobilization from the endoplasmic reticulum stores (12, 13), aquaporin water channel type 2 (AQP2), urea transporter urea transporter type A (UT-A) 1 trafficking to the apical membrane (14, 15), and long-term AVP-induced AQP2 expression (16) in the CD. Moreover, 8-pCPT-2′-O-Me-cAMP regulates the sodium–hydrogen exchanger 3 (NHE-3) activity in the proximal tubule cells (17). However, physiologic relevance of Epac signaling as well as synergy or primacy of the individual Epac isoforms for renal function in vivo remains to be determined.
Using mice with targeted deletion of Epac1 or Epac2, we identified nonredundant roles of both Epac isoforms in urinary production at the baseline and after 24 h of water deprivation. Ablation of either isoform did not significantly compromise AVP-induced [Ca2+]i signals or the major contributing mechanisms of water reabsorption in the CD, AQP2 and UT-A1, potentially pointing to their redundancy. In contrast, Epac1 or Epac2 knockout dramatically decreased NHE-3 abundance in the proximal tubule, leading to a urinary concentrating defect due to osmotic diuresis present in these mice.
MATERIALS AND METHODS
Reagents and animals
All chemicals and materials were from MilliporeSigma (Burlington, MA, USA), VWR (Radnor, PA, USA), and Tocris (Ellisville, MO, USA) unless noted otherwise and were at least of reagent grade. Animal use and welfare adhered to the Guide for the Care and Use of Laboratory Animals [National Institutes of Health (NIH), Bethesda, MD, USA] following protocols reviewed and approved by the Animal Care and Use Committee of the University of Texas Health Science Center at Houston. For experiments, 6- to 10-wk-old Epac wild-type (WT), and Epac1−/−, and Epac2−/− mice were used. Generation of mice lacking Epac isoforms has been previously described (18, 19).
Systemic measurements
Mice were acclimated for 1 d in metabolic cages (3600M021; Techniplast, West Chester, PA, USA) with free access to water and standard rodent chow (0.8% K+, 0.3% Na+; TD.7012; Envigo, Madison, WI, USA). After acclimation, 24-h urine samples were collected and water intake was measured. As necessary, mice were further deprived of water for 24 h, as previously described (20). Urine osmolarity was measured in duplicate using a freezing-point depression osmometer (Model 3320; Advanced Instruments, Norwood, MA, USA). Urinary creatinine concentration was assessed with the QuantiChrom Creatinine Assay Kit (DICT-500; BioAssay Systems, Hayward, CA, USA) utilizing the improved Jaffé method (21). Na+ concentration was measured using a Jenway PFP7 Flame photometer (Bibby Scientific, Burlington, NJ, USA). Urinary AVP and urinary/serum urea were assayed with Vasopressin Arg8-Vasopressin ELISA Kit (Enzo Life Sciences, Farmingdale, NY, USA) and Urea TR12421 Kit (Thermo Fisher Scientific, Waltham, MA, USA), respectively, according to the manufacturer’s instructions.
Western blot analysis
Immediately after dissection, kidneys were placed on ice, decapsulated, and homogenized in 5× of ice-cold lysis buffer containing 5% sorbitol, 5 mM histidine/imidazole (pH = 7.5) supplemented with Complete Mini Protease, and PhosStop phosphatase inhibitor cocktails (Roche Diagnostics, Rotkreuz, Switzerland). The homogenates were centrifuged at 1000 g for 15 min at +4°C, and sediment was discarded. Protein concentration was determined with a Bradford assay using bovine serum albumin as a standard. The samples (50 μg/lane) were separated on 10% polyacrylamide gels at 150 V for 65 min and transferred to a nitrocellulose membrane for 1.5 h at 100 V. Equal protein load was verified by Ponceau red staining using standard procedures (Supplemental Fig. S1). We used the primary antibodies against anti-AQP2 (1:1000, AQP2-002; Alomone Labs, Jerusalem, Israel), anti–Na+-K+-Cl− cotransporter type 2 (SLC12A1; NKCC2; rabbit polyclonal, 1:1000, ANT-072; Alomone Labs), anti–NHE-3, pS552 NHE-3 (mouse monoclonal, 1:100, sc-136368, sc-53962; Santa Cruz Biotechnology, Dallas, TX, USA), anti-Na+/H+ exchanger regulatory factor isoform 1 (NHERF1; mouse monoclonal, 1:1000, sc-271552; Santa Cruz Biotechnology), anti-pT96T101 NKCC2 (rabbit polyclonal, 1:2000, gift of B. Forbush, Yale University, New Haven, CT, USA), anti-pT53 thiazide-sensitive Na+-Cl− cotransporter (SLC12A3) (NCC; rabbit polyclonal, 1:1000; p1311-53; PhosphoSolutions, Aurora, CO, USA), anti–α subunit of epithelial Na+ channel (αENaC; rabbit polyclonal, 1:2000, SPC-405; StressMarq Biosciences, Victoria, BC, Canada), anti–UT-A1/2 (C domain; rabbit polyclonal, 1:1000, gift of J. M. Sands, Emory University, Atlanta, GA, USA). Upon washout (3 times for 10 min in Tris-buffered saline with Tween), the membrane was incubated with peroxidase-conjugated goat anti-rabbit (1:10,000; Jackson ImmunoResearch Laboratories, West Grove, PA, USA) and goat anti-mouse (1:30,000; Jackson ImmunoResearch Laboratories) secondary antibodies for 1 h 30 min at room temperature. Blots were quantified by ImageJ 1.50 software (Image Processing and Analysis in Java; NIH; https://imagej.nih.gov/ij/). The intensities of the studied protein bands were normalized to the total signal of the respective line in Ponceau red staining.
Immunofluorescent confocal microscopy in kidney sections
Kidneys were removed and placed in Optimal Cutting Temperature (OCT). Compound (Tissue-Tek 4583; Sakura, Torrance, CA, USA), snap frozen on dry ice, and placed into −80°C. Transverse-cut 6 µm thick sections were made on CM 1850 cryostat (Leica, Wetzlar, Germany). The sections were fixed with 10% neutral buffer formalin for 10 min at +4°C. After that, the sections were allowed to warm to room temperature. They were then washed 3 times in PBS, and permeabilized with 0.1% Triton X-100 for 10 min after washout with PBS and blockade of nonspecific binding with 10% normal goat serum (Jackson ImmunoResearch Laboratories) for an hour at room temperature. Sections were further incubated overnight with anti-AQP2 (1:5000, AQP2-002; Alomone Labs) or anti–NHE-3 (1:500, AB3085; Millipore, Burlington, MA, USA) followed by secondary antibodies Alexa Fluor 488 (1/2000, A11070; Thermo Fisher Scientific). The labeled kidney sections were mounted with Fluoromount-G mounting media (Southern Biotechnology, Birmingham, AL, USA) and imaged with a Nikon A1R confocal microscope (Nikon, Tokyo, Japan), as previously described (20, 22).
Isolation of individual CDs
The procedure for isolation of the CDs from Epac WT, Epac1−/−, and Epac2−/− mice suitable for Ca2+ imaging closely followed the protocols previously published by our group (22–24). Kidneys were cut into thin slices (<1 mm) with slices placed into ice-cold solution contained (mM): 150 NaCl, 5 KCl, 1 CaCl2, 2 MgCl2, 5 glucose, and 10 HEPES (pH 7.35). CDs were visually identified by their morphologic features (pale color, coarse surface, and in some cases bifurcations) and were mechanically isolated from kidney slices by microdissection using a watchmaker forceps under a stereomicroscope. Isolated CDs were attached to 5 × 5-mm coversheets coated with poly-l-lysine. A coversheet containing a CD was placed in a perfusion chamber mounted on an inverted Nikon Eclipse Ti Microscope and perfused with a bath solution at room temperature. CDs were split opened with 2 sharpened micropipettes controlled with different micromanipulators to gain access to the apical membrane. The tubules were used within 2 h of isolation.
[Ca2+]i imaging
Intracellular calcium levels were measured in individual cells within split-opened area of freshly isolated CDs using Fura-2 fluorescence ratiometric imaging as previously described (23–25). Briefly, split-opened CDs were loaded with Fura-2 by incubation with 2 μM Fura-2/AM in a bath solution for 40 min at room temperature. Subsequently, tissue samples were washed and incubated for additional 10 to 15 min before experimentation. CDs were placed in an open-top imaging study chamber (RC-26GLP; Warner Instruments, Hamden, CT, USA) constantly perfused at 1.5 ml/min with a bottom coverslip viewing window and the chamber attached to the microscope stage of a Nikon Ti-S Wide-Field Fluorescence Imaging System integrated with a Lambda XL light source (Sutter Instrument, Novato, CA, USA) and QIClick 1.4 megapixel monochrome CCD camera (QImaging, Surrey, BC Canada) via NIS Elements 4.3 imaging software (Nikon). Cells were imaged with a ×40 Nikon Super Fluor objective, and regions of interest were drawn for individual cells. The Fura-2 fluorescence intensity ratio was determined by excitation at 340 and 380 nm and by calculating the ratio of the emission intensities at 511 nm in the usual manner every 5 s. The changes in the ratio were converted into changes in intracellular calcium, as previously well documented (26). No significant Fura-2 bleaching and leakage were detected during the timeline of experiments. At least 6 individual CDs (∼10 cells in each) from at least 3 mice were used for each experimental set. For AVP-induced [Ca2+]i responses, the peak was calculated as the difference of the highest intracellular calcium concentration (which is around 180 s) and the respective baseline (average, 60–120 s) for each selected region of interest (i.e., individual cell). The plateau value was calculated as the difference of averaged [Ca2+]i at the interval of 410 to 430 s and the respective baseline.
Data analysis
All summarized data are reported as means ± sem. Statistical comparisons were made using 1-way ANOVA with post hoc Tukey test or 1-way repeated measures ANOVA with post hoc Bonferroni test (for paired experiments within the same group). A value of P < 0.05 was considered significant.
RESULTS
Epac1 or Epac2 knockouts develop polyuria
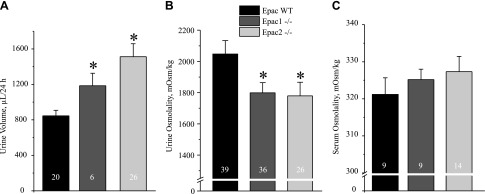
We first investigated the relevance of Epac for renal water handling and urinary production using genetically modified mouse models lacking one of Epac isoforms (Epac1 or Epac2). As summarized in Fig. 1A, Epac1−/− and Epac2−/− mice had significantly greater 24 h urinary output compared to WT controls: 846 ± 62 µl in Epac WT, 1185 ± 140 µl in Epac1−/−, and 1512 ± 145 µl in Epac2−/−. Water intake was also higher in Epac knockout animals (Supplemental Fig. S2A) despite similar body weight (Supplemental Fig. S2B). Consistently, spot urinary osmolarities were moderately but significantly lower in Epac1−/− and Epac2−/− mice: 1799 ± 64 mOsm and 1779 ± 87 mOsm, respectively, compared to 2047 ± 86 mOsm in Epac WT mice (Fig. 1B). The same observations were made for urinary creatinine levels (Supplemental Fig. S3). Serum osmolarities were slightly higher: 325 ± 2 mOsm/kg in Epac1−/− animals and 327 ± 2 mOsm/kg in Epac2−/− animals; however, this was not significantly different from 321 ± 4 mOsm/kg in Epac WT animals (Fig. 1C). These results point to disturbed renal water handling in mice lacking Epac isoforms.
Figure 1 .
Epac1−/− and Epac2−/− mice developed polyuria. A) Summary graph comparing 24 h urinary volume in age-matched Epac WT, Epac1−/−, and Epac2−/− mice placed in metabolic cages. B) Summary graph of urine spot osmolarity of Epac WT, Epac1−/−, and Epac2−/− mice in unstressed condition. C) Summary graph comparing serum osmolarity of Epac WT, Epac1−/−, and Epac2−/− mice. Number of mice indicated on each bar. *P < 0.05 vs. Epac WT, estimated by 1-way ANOVA.
Deletion of Epac1 or Epac2 does not perturb AVP-dependent [Ca2+]i signaling in the CD and does not decrease AQP2 levels
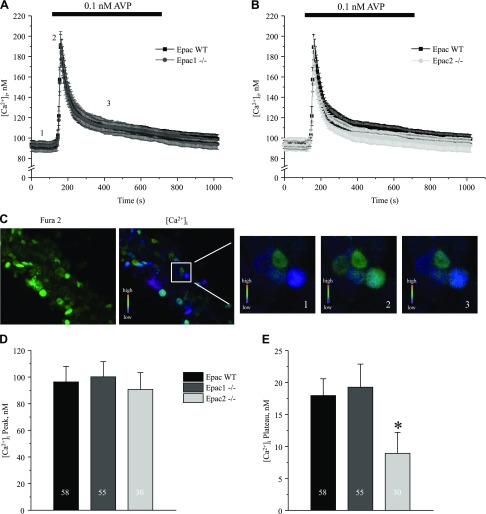
Accumulated evidence demonstrates the importance of both cAMP-dependent and [Ca2+]i-mediated pathways in the stimulation of AQP2 water transport by AVP (13, 14, 27). Furthermore, it has been proposed that AVP increases [Ca2+]i in an Epac-dependent manner in cultured mpkCCD cells (15). Thus, we next investigated how deletion of Epac isoforms affects AVP-dependent [Ca2+]i signaling in freshly isolated split-opened CD from Epac WT, Epac1−/−, and Epac2−/− mice. Application of AVP (0.1 nM) produced a transient [Ca2+]i peak followed by a sustained plateau (Fig. 2A–C). To our surprise, deletion of Epac1 had no measurable effect (Fig. 2A), and Epac2 deficiency resulted in a marginal reduction (Fig. 2B) of the AVP-induced [Ca2+]i signal in native CD cells. Neither deletion affected the amplitude of AVP-induced [Ca2+]i peak (Fig. 2D), and the AVP-induced [Ca2+]i plateau was mildly yet significantly decreased in CD cells from Epac2−/− mice (Fig. 2E).
Figure 2 .
AVP-induced [Ca2+]i responses in split-opened CDs from Epac1−/− and Epac2−/− mice. A) Average time courses of [Ca2+]i responses to application of 0.1 nM AVP (black bar on top) recorded in CD cells from Epac WT (black) and Epac1−/− (gray) mice. B) Average time courses of [Ca2+]i responses to application of 0.1 nM AVP (black bar on top) recorded in CD cells from Epac WT (black) and Epac2−/− (light gray) mice. C) Representative micrographs of a typical split-opened CD after loading with Fura-2 at 380 nm excitation (left) and [Ca2+]i pseudocolor image (right) used to examine AVP [Ca2+]i signaling. Square region is further expanded to demonstrate color changes at baseline (time point 1), AVP-induced [Ca2+]i peak (time point 2), and sustained plateau (time point 3), as shown in A. D, E) Summary graphs compare average magnitudes of peak (D) and plateau (E) of AVP-induced response in CD cells from Epac WT, Epac1−/−, and Epac2−/− mice. *P < 0.05 vs. [Ca2+]i plateau in Epac WT. Number of cells in each group is indicated on each bar. At least 6 CDs from 3 different experimental animals were used for each treatment.
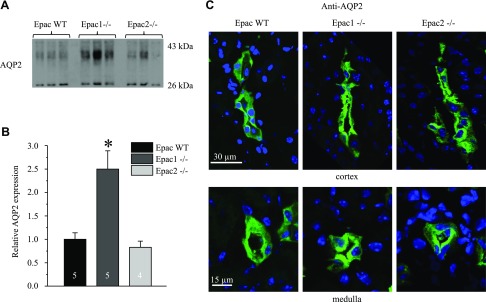
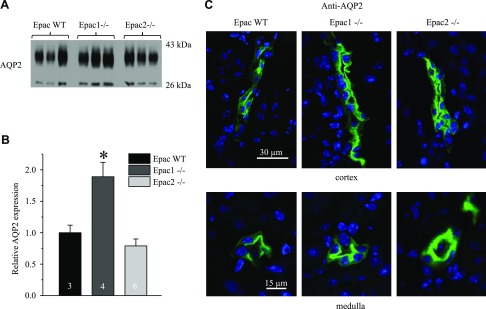
To further gain insights into a putative role of Epacs in CD water transport, we next assessed AQP2 levels in Epac WT, Epac1−/−, and Epac2−/− mice. Unexpectedly, Epac1 deletion resulted in a more than 2-fold increase in AQP2 abundance, whereas no significant changes were detected in Epac2−/− mice (Fig. 3A, B). We next visualized subcellular AQP2 distribution in kidney sections of Epac WT and Epac isoform knockouts. As expected, AQP2 reporting signal was predominantly cytosolic in cortical and medullary CD of Epac WT mice (Fig. 3C). In contrast, we detected much stronger AQP2 staining in the apical region of CD cells of Epac1−/− and Epac2−/− mice (Fig. 3C), pointing to compensatory targeting of the water channel to the apical membrane. Taken together, our results argue against deficient water transport in the CD as the underlying mechanism of polyuria in Epac1−/− and Epac2−/− mice.
Figure 3 .
AQP2 expression and localization in Epac1−/− and Epac2−/− mice. A) Representative Western blots from whole kidney lysates of Epac WT, Epac1−/−, and Epac2−/− mice probed with anti-AQP2 antibodies. AQP2 is present as upper duplet of glycosylated bands around 37 kDa and lower nonglycosylated band at 29 kDa. B) Summary graph comparing total renal AQP2 expression (both glycosylated and nonglycosylated forms) in Epac WT, Epac1−/−, and Epac2−/− mice from Western blots similar to that shown in A. Intensity values were normalized to total signal of respective lines in Ponceau red staining (Supplemental Fig. S1). *P < 0.05 vs. Epac WT. Number of mice in each group is indicated on each bar. C) Representative confocal micrographs of cortical (top) and medullary (bottom) CDs in transverse-cut kidney sections probed with anti-AQP2 (pseudocolor green) from Epac WT, Epac1−/−, and Epac2−/− mice. Nuclear DAPI staining is shown in pseudocolor blue.
Epac1 and Epac2 knockouts demonstrate symptoms of osmotic diuresis
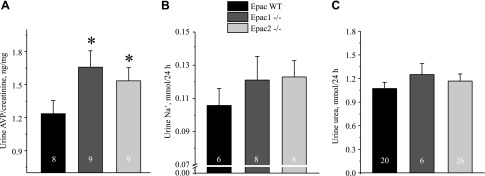
We next tested whether altered water balance in Epac1−/− and Epac2−/− mice could be due to impaired AVP release. However, both mutants showed significantly greater 24 h AVP levels in urine compared to the values in Epac WT animals (Fig. 4A). These results also suggested that the perturbed renal water handling is not driven by primary polydipsia in Epac1−/− and Epac2−/− mice. Moreover, Epac1 and Epac2 knockouts showed a tendency to excrete more sodium (Fig. 4B) and comparable excretion of urea (Fig. 4C). Urea serum levels between strains were similar: 21.6 ± 0.9 mg/dl [(n = 5), Epac WT], 18.2 ± 0.4 mg/dl [(n = 4), Epac1−/−], and 19.4 ± 1.1 mg/dl [(n = 4), Epac2−/−]. The average food intake was also comparable between strains: 0.14 ± 0.02 mg/g body weight/24 h (Epac WT), 0.13 ± 0.02 mg/g body weight/24 h (Epac1−/−), and 0.12 ± 0.03 mg/g body weight/24 (Epac2−/−). These data, taken together, indicate a defect in sodium reabsorption upstream of the CD causing osmotic diuresis, whereas increased AVP levels and trafficking of AQP2 to the apical membrane represent a compensatory response.
Figure 4 .
Lack of apparent solute wasting in Epac1−/− and Epac2−/− mice at baseline. Summary graphs show averaged AVP normalized to respective creatinine (A), Na+ (B), and urea (C) levels in 24 h urine samples from Epac WT, Epac1−/−, and Epac2−/− mice placed in metabolic cages. *P < 0.05 vs. Epac WT. Number of mice in each group is indicated on each bar.
Deletion of Epac isoforms diminishes NHE-3 expression
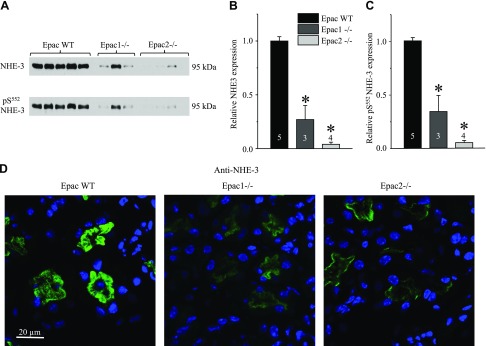
Published evidence shows that Epac1 and Epac2 are expressed in multiple segments of renal nephron, from the proximal tubule to the inner medullary CD of rodents and humans (10). Thus, we next investigated how ablation of Epac1 and Epac2 affects expression patterns of the major Na+ transporting systems along the renal nephron. As shown in the Western blots of whole kidney homogenates (Fig. 5A) and a summary graph (Fig. 5B), the lack of Epac1 and Epac2 greatly diminishes expression of NHE-3 (SLC9A3), the major transcellular Na+ reabsorptive pathway in the proximal tubule. The same is also true for the phosphorylated pS552 inactive NHE-3 form (Fig. 5A, C), localized to the base of brush border of proximal tubule cells (28). Consistently, NHE-3 reporting fluorescent signal was dramatically lower in the cortical renal sections of Epac1−/− and Epac2−/− compared to Epac WT mice on the same laser settings (Fig. 5C). At the same time, we did not observe notable changes in subcellular NHE-3 localization between WT and knockouts because the signal was almost exclusively restricted to the brush border of proximal tubule cells (Fig. 5C and Supplemental Fig. S4). Moreover, renal expression of NHERF1, the major NHE-3 adaptor protein (29), was unchanged in Epac1−/− but significantly reduced in Epac2−/− (Supplemental Fig. S5), indicating discrete mechanisms of reduced NHE-3 expression upon deletion of Epac isoforms.
Figure 5 .
Deletion of Epac isoforms drastically diminishes NHE-3 expression in proximal tubule. A) Representative Western blots from whole kidney lysates of Epac WT, Epac1−/−, and Epac2−/− mice probed with antibodies against Na+/H+ exchanger SLC9A3, NHE-3 (top), and phospho-pS552 NHE-3 (bottom) forms. B, C) Summary graph comparing total renal NHE-3 expression (B) and phosphorylated pS552 NHE-3 levels (C) in Epac WT, Epac1−/−, and Epac2−/− from Western blots similar to that shown in A. Intensity values were normalized to total protein signal after Ponceau red staining. D) Representative confocal micrographs (using same laser power excitation) of cortical regions in transverse-cut kidney sections probed with anti–NHE-3 (pseudocolor green) from Epac WT, Epac1−/−, and Epac2−/− mice. Nuclear DAPI staining is shown in pseudocolor blue. *P < 0.05 vs. Epac WT. Number of mice in each group is indicated on each bar.
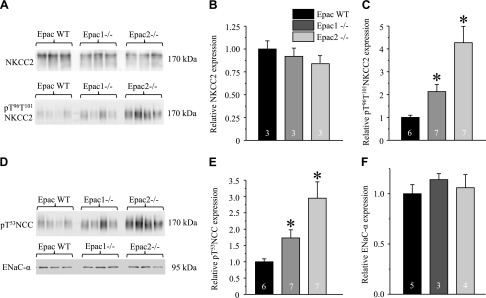
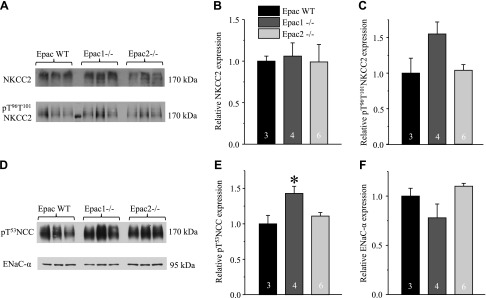
Total (cellular) expression of NKCC2 (SLC12A1) in the ascending limb of Henle loop was not different among Epac WT, Epac1−/−, and Epac2−/− mice (Fig. 6A, B). In contrast, the active form of NKCC2 phosphorylated at T96 and T101 (pT96T101 NKCC2) was more abundant in Epac knockouts (Fig. 6A, C), pointing to a compensatory response to reduced NHE-3 levels. Similarly, phosphorylated pT53 active form of the thiazide-sensitive Na+-Cl− cotransporter (NCC, SLC12A3) in the distal convoluted tubule (Fig. 6D, E) was also higher in Epac knockouts (Fig. 6D, E), whereas no significant changes were observed in the expression of full-length of αENaC sodium channel in the connecting tubule and the CD (Fig. 6D, F) in Epac1−/− and Epac2−/− compared to the values in Epac WT. Overall, our results support the view that decreased NHE-3-dependent Na+ reabsorption in the proximal tubule is the primary cause of osmotic diuresis in Epac1−/− and Epac2−/− mice, despite compensatory response in the distal nephron segments.
Figure 6 .
Expression of major Na+ transporting systems in distal tubule and CD in Epac1−/− and Epac2−/− mice. A) Representative Western blots from whole kidney lysates of Epac WT, Epac1−/−, and Epac2−/− mice probed with antibodies against Na+/K+/Cl− cotransporter SLC12A1, NKCC2 (top), and phospho-pT96T101 NKCC2 (bottom) forms. B, C) Summary graph comparing total renal NKCC2 expression (B) and phosphorylated pT96T101 NKCC2 levels (C) in Epac WT, Epac1−/−, and Epac2−/− from Western blots similar to that shown in A. D) Representative Western blots from whole kidney lysates of Epac WT, Epac1−/−, and Epac2−/− mice probed with antibodies against phosphorylated pT53 form of thiazide-sensitive Na+/Cl− cotransporter SLC12A3, NCC (top), and full-length αENaC (bottom). E, F) Summary graph comparing total renal pT53 NCC expression (E) and αENaC (F) in Epac WT, Epac1−/−, and Epac2−/− from Western blots similar to that shown in D. Intensity values were normalized to total protein signal after Ponceau red staining. *P < 0.05 vs. Epac WT. Number of mice in each group is indicated on each bar.
Diminished urinary concentrating ability and persisting osmotic diuresis in Epac1−/− and Epac2−/− mice
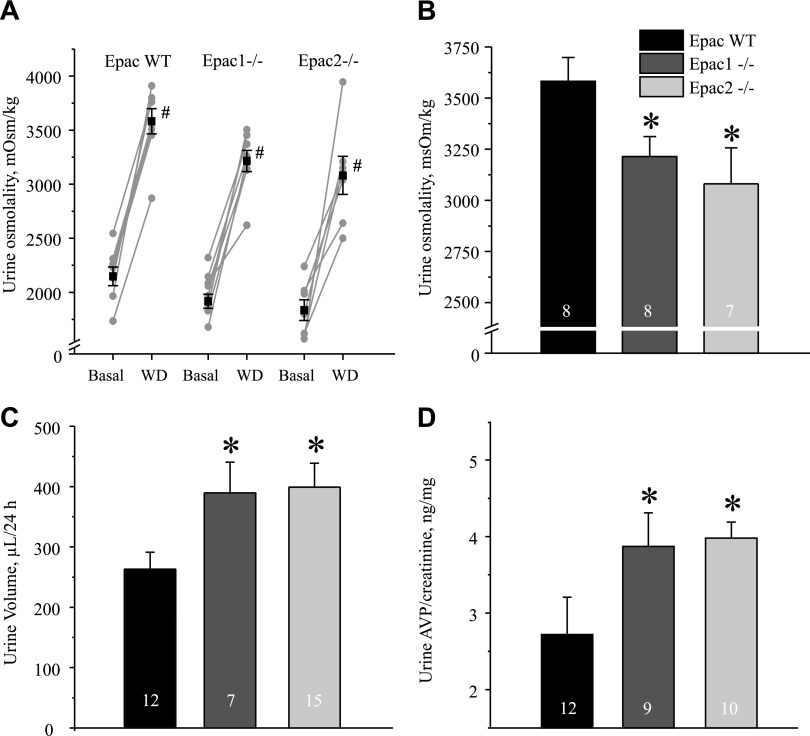
We next investigated how deletion of Epac isoforms interferes with AVP-dependent renal water conservation. For this, we examined urinary concentrating ability in Epac1−/− and Epac2−/− mice in response to 24 h of water deprivation. Both knockout strains were able to produce concentrated urine (Fig. 7A). However, the maximal urinary osmolarity was modestly but significantly lower in Epac1−/− (3214 ± 97 mOsm) and in Epac2−/− (3080 ± 176 mOsm) animals compared to 3582 ± 116 mOsm, the value observed in Epac WT control animals (Fig. 7A, B). Consistently, urinary volume was significantly lower in Epac WT animals (263 ± 28 µl) compared to 390 ± 50 µl in Epac1−/− and 399 ± 39 µl in Epac2−/− animals after 24 h of water deprivation (Fig. 7C). Urine AVP levels were significantly higher in Epac1−/− and Epac2−/− mice compared to the respective values in Epac WT animals (Fig. 7D). This suggests that the diminished urinary concentrating ability in mutants is not due to the deficiency in AVP release.
Figure 7 .
Epac1−/− and Epac2−/− mice have impaired urinary concentrating ability. A) Summary graphs of changes in urinary osmolarity at baseline (basal) and after 24 h of water deprivation (WD) for Epac WT, Epac1−/−, and Epac2−/− mice placed in metabolic cages. Individual paired experiments are shown by connected lines. B) Summary graph of urine osmolarity after 24 h of water deprivation in Epac WT, Epac1−/−, and Epac2−/− mice. C, D) Summary graphs of urine volume (C) and urinary AVP normalized to respective creatinine levels (D) in Epac WT, Epac1−/−, and Epac2−/− mice subjected to 24 h of water deprivation. *P < 0.05 vs. Epac WT. #P < 0.05 vs. respective value under baseline conditions. Number of mice in each group is indicated on each bar.
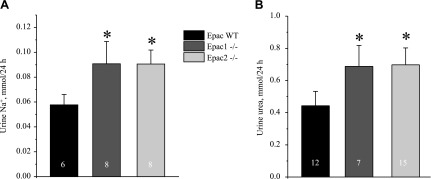
Urine sodium (Fig. 8A) and urea (Fig. 8B) levels were significantly higher in Epac1 and Epac2 knockouts after 24 h of water deprivation, suggesting increased excretion of osmoles and persisting osmotic diuresis despite high AVP levels.
Figure 8 .
Augmented urinary sodium and urea excretion in water-deprived Epac1−/− and Epac2−/− mice. Summary graphs showing averaged Na+ (A) and urea (B) levels in urine samples from Epac WT, Epac1−/−, and Epac2−/− mice placed in metabolic cages after 24 h of water deprivation. *P < 0.05 vs. Epac WT. Number of mice in each group is indicated on each bar.
Deletion of Epacs does not perturb AVP signaling in CD
AVP governs urinary concentrating ability largely by stimulating osmotically driven AQP2-dependent water reabsorption in the CD and accumulation of urea via UT-A1/3 transporters in the inner medullary part of CD (30). Thus, we next tested whether impaired urinary concentrating ability in Epac knockouts could be due to reduced AQP2 and UT-A1 levels after water deprivation. However, AQP2 levels were similar in Epac2−/− mice and ∼2-folds elevated in Epac1−/− compared to Epac WT mice under this condition (Fig. 9B). This pattern of AQP2 expression between tested strains fully recapitulated that observed in unstressed conditions (Fig. 3B). Furthermore, we detected prominent localization of AQP2-reporting fluorescent signal in both cortical and medullary CD of Epac WT, Epac1−/−, and Epac2−/− animals (Fig. 9C), as is expected in the presence of high AVP after water deprivation.
Figure 9 .
AQP2 expression in Epac1−/− and Epac2−/− mice after water deprivation. A) Representative Western blots from whole kidney lysates of Epac WT, Epac1−/−, and Epac2−/− mice subjected to 24 h of water deprivation probed with anti-AQP2 antibodies. AQP2 is present as upper duplet of glycosylated bands around 37 kDa and lower nonglycosylated band at 29 kDa. B) Summary graph comparing total renal AQP2 expression (both glycosylated and nonglycosylated forms) in Epac WT, Epac1−/−, and Epac2−/− from Western blots similar to that shown in A. Intensity values were normalized to total signal of respective lines in Ponceau red staining. Number of mice in each group is indicated on each bar. C) Representative confocal micrographs of cortical (top) and medullary (bottom) CDs in transverse cut kidney sections probed with anti-AQP2 (pseudocolor green) from Epac WT, Epac1−/−, and Epac2−/− mice subjected to 24 h of water deprivation. Nuclear DAPI staining is shown in pseudocolor blue. Number of mice in each group is indicated on each bar. *P < 0.05 vs. Epac WT.
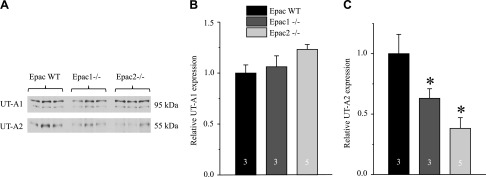
Renal UT-A1 levels were comparable between Epac WT and knockout animals (Fig. 10A, B). In contrast, UT-A2 levels, expressed in the thin descending limb (31), were significantly reduced by ∼50% in both Epac1−/− and Epac2−/− mice (Fig. 10A, C). Taken together, these experiments argue against distorted AVP action in the CD of water-deprived Epac1−/− and Epac2−/− mice. In contrast, reduced UT-A2 levels in the thin descending limb might contribute to the augmented urea excretion in Epac knockout upon water deprivation (Fig. 8B).
Figure 10 .
Decreased UT-A2 urea transporter levels in Epac1−/− and Epac2−/− mice after water deprivation. A) Representative Western blots from whole kidney lysates of Epac WT, Epac1−/−, and Epac2−/− mice subjected to 24 h of water deprivation probed with anti–UT-A1 (top) and anti–UT-A2 (bottom) antibodies. UT-A1 is present as a duplet of upper glycosylated and bottom nonglycosylated bands around 95 kDa. B, C) Summary graph comparing total renal UT-A1 (B) and UT-A2 (C) expression Epac WT, Epac1−/−, and Epac2−/− from Western blots similar to that shown in A. Intensity values were normalized to total protein signal after Ponceau red staining. *P < 0.05 vs. Epac WT. Number of mice in each group is indicated on each bar.
Expression of major Na+ renal transporters in water-deprived Epac1−/− and Epac2−/− mice
Finally, we investigated how 24 h of water deprivation test affects expression of Na+ transporters in the renal tubule of Epac WT, Epac1−/−, and Epac2−/− animals. We detected a significant decrease in the levels of both total and pS552 NHE-3 in the proximal tubule of Epac knockouts (Fig. 11A–C). No significant changes were detected in the total expression of NKCC2 in water-deprived Epac WT, Epac1−/−, and Epac2−/− animals (Fig. 12A, B). Phosphorylated pT96T101 NKCC2 levels in the ascending limb were not statistically different in Epac WT and Epac isoform knockout animals (Fig. 12A, C). Similarly, pT53 NCC was only mildly higher in Epac1−/− mice, whereas Epac2−/− mice had similar expression of this active NCC form compared to Epac WT mice (Fig. 12D, E). No changes in full-length αENaC expression were detected between tested strains. Previous studies have demonstrated that AVP is a potent regulator of NKCC2 and NCC activity (32, 33). Thus, comparable abundance of active pT96T101 NKCC2 and pT53 NCC forms in water-deprived WT control and Epac knockout animals (as opposed to baseline conditions; Fig. 6) likely reflects the saturation of AVP-driven compensatory responses in Epac knockouts under water deprivation.
Figure 11 .
Diminished NHE-3 expression persists in water-deprived Epac1−/− and Epac2−/− mice. A) Representative Western blots from whole kidney lysates of 24 h water-deprived Epac WT, Epac1−/−, and Epac2−/− mice probed with antibodies against Na+/H+ exchanger SLC9A3, NHE-3 (top), and phospho-pS552 NHE-3 (bottom) forms. B, C) Summary graph comparing total renal NHE-3 expression (B) and phosphorylated pS552 NHE-3 levels (C) in Epac WT, Epac1−/−, and Epac2−/− from Western blots similar to that shown in A. Intensity values were normalized to total protein signal after Ponceau red staining. *P < 0.05 vs. Epac WT. Number of animals in each group is indicated on each bar.
Figure 12 .
Expression of major Na+ transporting systems in distal tubule and CD in water-deprived Epac1−/− and Epac2−/− mice. A) Representative Western blots from whole kidney lysates of 24 h water-deprived Epac WT, Epac1−/−, and Epac2−/− mice probed with antibodies against Na+/K+/Cl− cotransporter SLC12A1, NKCC2 (top) ,and phospho-pT96T101 NKCC2 (bottom) forms. B, C) Summary graph comparing total renal NKCC2 expression (B) and phosphorylated pT96T101 NKCC2 levels (C) in Epac WT, Epac1−/−, and Epac2−/− mice from Western blots similar to that shown in A. D) Representative Western blots from whole kidney lysates of Epac WT, Epac1−/−, and Epac2−/− mice probed with antibodies against phosphorylated pT53 form of thiazide-sensitive Na+/Cl− cotransporter SLC12A3, NCC (top), and full-length αENaC (bottom). E, F) Summary graph comparing total renal pT53 NCC expression (E) and αENaC (F) in Epac WT, Epac1−/−, and Epac2−/− from Western blots similar to that shown in D. Intensity values were normalized to total protein signal after Ponceau red staining. *P < 0.05 vs. Epac WT. Number of mice in each group is indicated on each bar.
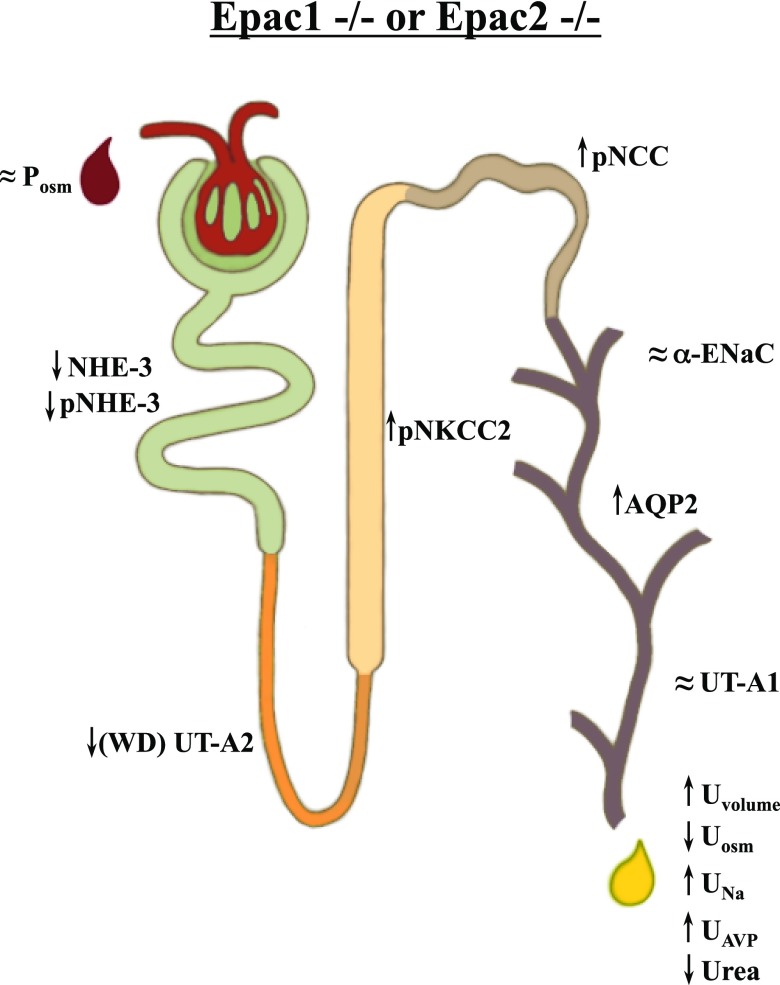
Overall, we show that deletion of Epac1 or Epac2 isoforms elicits a profound alteration in renal water handling (Fig. 13). Both knockouts are able to maintain nearly normal serum osmolarity at the expense of elevated AVP and increased urinary production/water intake. Reduction of proximal tubule NHE-3 levels results in increased fluid delivery to the distal nephron segments and partial compensation by NKCC2, NCC, and AQP2 (mostly in Epac1−/− mice).
Figure 13 .
Principal scheme of changes in renal water handling and abundance of major transporters and channel along nephron upon deletion of Epac1 and Epac2. Up and down arrows indicate significant increases and decreases, respectively. ≈, no significant changes detected.
DISCUSSION
Deregulated Epac-dependent pathways have been associated with the development of a wide spectrum of pathologies, including cancer, diabetes, cardiovascular pathologies, polycystic kidney disease, inflammation, pain, and learning deficiencies (8, 9). Significant progress has been made toward the development of pharmacologic tools to selectively target Epac1 and -2 (34–36) with the potential to implement them in clinic. In this regard, animal models lacking individual Epac isoforms, Epac1−/− or Epac2−/−, allow careful examination of potential off-target effects of such inhibition. Previous studies have revealed a broad expression of both isoforms in the proximal and distal segments of the nephron in rodents and humans (10), indicating their potential contribution in transport function by the kidney. Here we report that deficiency of either Epac isoform significantly compromises renal water handling and attenuates urinary concentrating ability. While the overall phenotype is similar in both knockouts, we demonstrate the nonredundant role of Epac1 and Epac2, particularly for NHE-3 expression in the proximal tubule, whereas the lack of individual isoforms was not essential for blunting of the AVP-dependent AQP2 regulation in the distal nephron. Urine-concentrating defect in Epac1−/− and Epac2−/− mice persisted despite elevated AVP levels, arguing for indispensable contribution of the cAMP-Epac pathways for renal function.
We found a marked reduction of NHE-3 expression upon deletion of either Epac isoform (by 75% in Epac1−/− mice and over 90% in Epac2−/− mice; Fig. 5). Despite being a major pathway for transcellular Na+ reabsorption in the proximal tubule (37), the role of NHE-3 in regulation of renal sodium handling and blood pressure control is considered to be limited mostly due to autoregulation via the tubuloglomerular feedback mechanism. However, Fenton et al. (38) have demonstrated that renal tubule–specific NHE-3 knockout leads to hypotension in mice fed both low- and high-NaCl diets. Moreover, these mice developed polyuria, showed reduced urinary concentrating ability, and had a tendency to excrete more Na+ in urine. Of interest, the overall renal phenotype of Epac1 or Epac2 deletion in our study is closely reminiscent of that present in tubule-specific NHE-3 knockout (38). This supports the notion of the major contribution of the transporter in the distorted renal water-solute handling in Epac1−/− and Epac2−/− mice. Deletion of NHE-3 in the intestine results in diarrhea and a high mortality rate in mice (39, 40). The lack of similar symptoms and comparable food intake in Epac1−/− and Epac2−/− mice indicates that regulation of NHE-3 by Epac isoforms is restricted to the kidney.
However, our findings that knockout of Epac isoforms reduces NHE-3 expression are somewhat unexpected. NHE-3 is known to be inhibited by elevated cAMP followed by PKA-dependent phosphorylation at serine 552, and this pathway has been proposed to mediate inhibitory actions of dopamine and parathyroid hormone on NHE-3 (41, 42). Moreover, application of cAMP analogs, preferentially stimulating PKA and Epac pathways, inhibits NHE-3 activity without changes in expression or localization at the brush border membrane (17). NHE-3 function and expression critically depend on the interaction with cytoskeleton via protein adaptors NHERF1 and ezrin (29). Deletion of NHERF1 decreases NHE-3 abundance in small and large intestines (43), and prevents its inhibition by cAMP in renal proximal tubule cells (44). Of interest, Epac1 is capable of directly interacting and binding to NHERF1 to control cystic fibrosis transmembrane conductance regulator endocytosis in human airway epithelial cells (45). While we did not detect changes in renal NHERF1 expression in Epac1−/− mice, deletion of Epac2 resulted in a significant reduction of NHERF1 levels (Supplemental Fig. S5), indicating its role in controlling NHE-3 activity by the cAMP-Epac pathway. Thus, it is possible that Epacs, in addition to participating in cAMP-induced control NHE-3 activity, also increase NHE-3 abundance by stabilizing its interaction with cytoskeleton at the brush border membrane via a mechanism at least partially involving NHERF1. Future studies are necessary to carefully examine this hypothesis. It should be also noted that NHE-3 is also expressed in the thick ascending limb (46). However, the existing abundant clinical and basic evidence do not support a contribution of NHE-3 at this site for the countercurrent mechanism. In contrast, NKCC2-mediated Na+ reabsorption plays the commanding role in generation of hypertonic interstitial medullary environment (47, 48). Apically localized NHE-3 in the thick ascending limb was shown to contribute significantly to urinary acidification particularly when NKCC2 was inhibited by furosemide (49). Thus, it is highly unlikely that putative decrease in NHE-3 expression in the thick ascending limb plays a role in urinary concentration defect in Epac1−/− and Epac2−/− mice, particularly in the presence of an increased phosphorylated active form of NKCC2 (Fig. 6A, C).
CD is the principal site of controlled water reabsorption by the kidney. It is well recognized that AVP governs water permeability of the CD principal cells by promoting synthesis and translocation of AQP2 water channel to the apical plasma membrane (50, 51). Inability of AVP to stimulate AQP2-dependent osmotic water reabsorption has devastating consequences on systemic water balance, leading to dehydration and severe urinary water wasting, as exemplified by nephrogenic diabetes insipidus (52). Activation of the G-protein–coupled arginine vasopressin type 2 receptor leads to an increased intracellular concentration of cAMP to initiate an intricate and complex signaling network of AVP actions in the CD (53). Abundant experimental evidence identified a critical role of cAMP-activated PKA in AQP2 phosphorylation at the Ser256 residue, leading to channel trafficking to the apical plasma membrane acutely increasing AVP-dependent CD water permeability (51, 54). Moreover, prolonged elevations of AVP stimulate AQP2 synthesis via mechanisms involving cAMP responsive binding protein and [Ca2+]i-dependent calcineurin–nuclear factor of activated T cells (55–57). Epac1 and -2 are prominently expressed in the CD cells (10). Abundant published evidence implicates cAMP-Epac pathway in both short-term regulation of AQP2 trafficking to the apical plasma membrane in perfused inner medullary CD (15) and in long-term regulation of AQP2 expression by AVP in cultured mpkCCD cells (16). It is possible that cooperative actions of both Epac isoforms are required because deletion of either Epac1 or Epac2 does not decrease AQP2 levels at the baseline (Fig. 3) and after 24 h of water deprivation (Fig. 9). We previously demonstrated that deletion of Epac1 does not lead to up-regulation of Epac2 (18). Thus, further studies are required to carefully investigate potential alterations in AQP2 regulation by AVP upon deletion of both Epac isoforms. The observed preferentially apical AQP2 localization in kidney sections from Epac1−/− and Epac2−/− mice (Figs. 3C and 9C) reflects a compensatory mechanism triggered by increased AVP levels in knockouts (Fig. 7D). This is also consistent with increased phosphorylation of NKCC2 and NCC (Fig. 6), known to be stimulated by AVP and, in the case of the former, independently of Epac (58, 59).
It is well described that AVP binding to arginine vasopressin type 2 receptor in principal cells induces elevations in [Ca2+]i. This occurs due to the initial Ca2+ release from the ryanodine- but not inositol 1,4,5-trisphosphate–dependent stores followed by store-operated Ca2+ entry to account for the sustained elevation of [Ca2+]i (13, 14, 20). Interestingly these [Ca2+]i responses are cAMP but not PKA dependent (12), possibly involving Epac activation (15). cAMP-Epac pathway was demonstrated to mediate Ca2+ release from the endoplasmic reticulum stores in different cell types, including pancreatic β cells (60) and cardiac myocytes (61). Epac-selective cAMP agonist (8-pCPT-2′-O-Me-cAMP) recapitulated AVP-dependent [Ca2+]i elevations and promoted AQP2 trafficking to the apical plasma membrane even in the presence of PKA inhibition (15). However, we did not detect any measurable changes in the amplitude of AVP-induced [Ca2+]i peak, which reflects Ca2+ release from the endoplasmic reticulum stores after deletion of Epac1 or Epac2 (Fig. 2). One possible explanation is that lack of either isoform can be fully compensated by its counterpart because both Epac1 and Epac2 are expressed in the CD principal cells (10). Further studies are required to investigate how deletion of both isoforms simultaneously affects AVP-dependent signaling and trafficking of AQP2. We did find, however, that Epac2 deletion moderately decreases the amplitude of AVP-induced Ca2+ plateau in CD cells (Fig. 2B, E). Our group recently demonstrated a critical role of store-operated Ca2+ entry in generating this sustained elevation of [Ca2+]i, with its dysfunction leading to decreased AQP2 expression and partial nephrogenic diabetes insipidus (20). Thus, it is possible that Epac2 but not Epac1 deletion interferes with AVP-dependent store-operated Ca2+ entry. Consistently, AQP2 levels were significantly lower in Epac2−/− mice compared to Epac1−/− in unstressed conditions (Fig. 3) and after water deprivation (Fig. 9).
Our results show that Epac1 and Epac2 play a role in the regulation of renal urea handling. While there were no differences in urea excretion compared to Epac WT at baseline (Fig. 4C), both knockouts exhibited significantly augmented urea levels in the urine after water deprivation (Fig. 8B). Indeed, a critical role of urea recycling and accumulation in the renal medulla is well recognized during antidiuretic conditions (30). This process depends critically on urea reabsorption in the inner medullary CD via UT-A1, and to a much lesser extent via UT-A3 (30, 62). AVP increases phosphorylation and apical accumulation of UT-A1/3 to stimulate urea reabsorption by acting via both cAMP-PKA and cAMP-Epac pathways (63). Although we did not detect significant differences in UT-A1 abundance between Epac knockouts and Epac WT (Fig. 10A, B), this does not exclude potential alterations in subcellular localization of the transporter, which could be a focus of further investigation on this topic. Interestingly, we found ∼50% reduction of the AVP-responsive UT-A2 urea transporter expressed in the thin descending limb (Fig. 10A, C). UT-A2–deficient mice demonstrate impaired urinary concentrating ability and decreased medullary urea accumulation, particularly when fed a low-protein diet (64). Thus, this might also contribute to the observed augmented urea excretion in Epac1−/− and Epac2−/− animals.
In summary, we demonstrate that genetic deletion of Epac1 and Epac2 perturbs renal water-solute transport, leading to urinary concentrating defect and osmotic diuresis, and that this defect cannot be fully compensated by elevated AVP levels. Both isoforms have a nonredundant contribution to the transport in proximal nephron segments, whereas minimal defects were detected in the distal nephron, likely indicating that Epac1 and Epac2 are interchangeable at these sites. Further studies with concomitant deletion of both isoforms are required to fully uncover potential synergy of both isoforms for renal water-solute handling. It is also possible that Epac-dependent pathways might be critical for adaptations to dietary regiments, i.e., salt intake and regulation of acid–base balance. Thus, additional considerations need to be done with respect to alterations in kidney function and, by extension, systemic water–electrolyte balance upon pharmacologic inhibition of Epac to treat diseases in the clinical setting.
Supplementary Material
This article includes supplemental data. Please visit http://www.fasebj.org to obtain this information.
ACKNOWLEDGMENTS
The authors thank Alicia McDonough (Keck School of Medicine, University of Southern California, Los Angeles, CA, USA) for the insights and advice on technical aspects of renal transporter detection; and Svetlana Cherezova for her invaluable help with schematic illustration of the nephron. This research was supported by U.S. National Institutes of Health (NIH) National Institute of Diabetes and Digestive and Kidney Diseases Grants DK095029 and DK119170 (to O.P.), American Heart Association (AHA) Grant 17GRNT33660488 (to O.P.), American Society of Nephrology Ben J. Lipps Research Fellowship (to V.T.), AHA-15SDG25550150 (to M.M.), and NIH National Institute of General Medical Sciences Grants GM066170 and GM122536 (to X.C.). The authors declare no conflicts of interest.
Glossary
- 8-pCPT-2′-O-Me-cAMP
8-(4-chloro-phenylthio)-2′-O-methyladenosine-3′,5′-cyclic monophosphate
- αENaC
α subunit of epithelial Na+ channel
- AQP2
aquaporin water channel type 2
- AVP
arginine vasopressin
- CD
collecting duct
- Epac
exchange protein directly activated by cAMP
- NCC
thiazide-sensitive Na+-Cl− cotransporter (SLC12A3)
- NHE-3
sodium–hydrogen exchanger type 3 (SLC9A3)
- NHERF1
Na+/H+ exchanger regulatory factor isoform 1
- NKCC2
Na+-K+-Cl− cotransporter type 2 (SLC12A1)
- UT-A1/2/3
urea transporter type A1/2/3
- WT
wild type
Footnotes
This article includes supplemental data. Please visit http://www.fasebj.org to obtain this information.
AUTHOR CONTRIBUTIONS
X. Cheng, M. Mamenko, and O. Pochynyuk designed research studies; A. Cherezova, V. Tomilin, V. Buncha, O. Zaika, F. Mei, M. Mamenko, and O. Pochynyuk conducted experiments; P. A. Ortiz provided reagents; O. Pochynyuk wrote the report; P. A. Ortiz, X. Cheng, and M. Mamenko edited the manuscription; and A. Cherezova, V. Tomilin, V. Buncha, O. Zaika, P. A. Ortiz, X. Cheng, M. Mamenko, and O. Pochynyuk approved the final version.
REFERENCES
- 1.Gloerich, M., Bos, J. L. (2010) Epac: defining a new mechanism for cAMP action. Annu. Rev. Pharmacol. Toxicol. 50, 355–375 10.1146/annurev.pharmtox.010909.105714 [DOI] [PubMed] [Google Scholar]
- 2.Schmidt, M., Dekker, F. J., Maarsingh, H. (2013) Exchange protein directly activated by cAMP (Epac): a multidomain cAMP mediator in the regulation of diverse biological functions. Pharmacol. Rev. 65, 670–709 10.1124/pr.110.003707 [DOI] [PubMed] [Google Scholar]
- 3.Robichaux III, W. G., Cheng, X. (2018) Intracellular cAMP sensor EPAC: physiology, pathophysiology, and therapeutics development. Physiol. Rev. 98, 919–1053 10.1152/physrev.00025.2017 [DOI] [PMC free article] [PubMed] [Google Scholar]
- 4.Kawasaki, H., Springett, G. M., Mochizuki, N., Toki, S., Nakaya, M., Matsuda, M., Housman, D. E., Graybiel, A. M. (1998) A family of cAMP-binding proteins that directly activate Rap1. Science 282, 2275–2279 10.1126/science.282.5397.2275 [DOI] [PubMed] [Google Scholar]
- 5.de Rooij, J., Zwartkruis, F. J., Verheijen, M. H., Cool, R. H., Nijman, S. M., Wittinghofer, A., Bos, J. L. (1998) Epac is a Rap1 guanine–nucleotide–exchange factor directly activated by cyclic AMP. Nature 396, 474–477 10.1038/24884 [DOI] [PubMed] [Google Scholar]
- 6.Holz, G. G., Kang, G., Harbeck, M., Roe, M. W., Chepurny, O. G. (2006) Cell physiology of cAMP sensor Epac. J. Physiol. 577, 5–15 10.1113/jphysiol.2006.119644 [DOI] [PMC free article] [PubMed] [Google Scholar]
- 7.Banerjee, U., Cheng, X. (2015) Exchange protein directly activated by cAMP encoded by the mammalian rapgef3 gene: structure, function and therapeutics. Gene 570, 157–167 10.1016/j.gene.2015.06.063 [DOI] [PMC free article] [PubMed] [Google Scholar]
- 8.Wang, P., Liu, Z., Chen, H., Ye, N., Cheng, X., Zhou, J. (2017) Exchange proteins directly activated by cAMP (EPACs): emerging therapeutic targets. Bioorg. Med. Chem. Lett. 27, 1633–1639 10.1016/j.bmcl.2017.02.065 [DOI] [PMC free article] [PubMed] [Google Scholar]
- 9.Lezoualc’h, F., Fazal, L., Laudette, M., Conte, C. (2016) Cyclic AMP sensor EPAC proteins and their role in cardiovascular function and disease. Circ. Res. 118, 881–897 10.1161/CIRCRESAHA.115.306529 [DOI] [PubMed] [Google Scholar]
- 10.Li, Y., Konings, I. B., Zhao, J., Price, L. S., de Heer, E., Deen, P. M. (2008) Renal expression of exchange protein directly activated by cAMP (Epac) 1 and 2. Am. J. Physiol. Renal Physiol. 295, F525–F533 10.1152/ajprenal.00448.2007 [DOI] [PubMed] [Google Scholar]
- 11.Enserink, J. M., Christensen, A. E., de Rooij, J., van Triest, M., Schwede, F., Genieser, H. G., Døskeland, S. O., Blank, J. L., Bos, J. L. (2002) A novel Epac-specific cAMP analogue demonstrates independent regulation of Rap1 and ERK. Nat. Cell Biol. 4, 901–906 10.1038/ncb874 [DOI] [PubMed] [Google Scholar]
- 12.Balasubramanian, L., Sham, J. S., Yip, K. P. (2008) Calcium signaling in vasopressin-induced aquaporin-2 trafficking. Pflugers Arch. 456, 747–754 10.1007/s00424-007-0371-7 [DOI] [PubMed] [Google Scholar]
- 13.Yip, K. P. (2002) Coupling of vasopressin-induced intracellular Ca2+ mobilization and apical exocytosis in perfused rat kidney collecting duct. J. Physiol. 538, 891–899 10.1113/jphysiol.2001.012606 [DOI] [PMC free article] [PubMed] [Google Scholar]
- 14.Chou, C. L., Yip, K. P., Michea, L., Kador, K., Ferraris, J. D., Wade, J. B., Knepper, M. A. (2000) Regulation of aquaporin-2 trafficking by vasopressin in the renal collecting duct. Roles of ryanodine-sensitive Ca2+ stores and calmodulin. J. Biol. Chem. 275, 36839–36846 10.1074/jbc.M005552200 [DOI] [PubMed] [Google Scholar]
- 15.Yip, K. P. (2006) Epac-mediated Ca2+ mobilization and exocytosis in inner medullary collecting duct. Am. J. Physiol. Renal Physiol. 291, F882–F890 10.1152/ajprenal.00411.2005 [DOI] [PubMed] [Google Scholar]
- 16.Kortenoeven, M. L., Trimpert, C., van den Brand, M., Li, Y., Wetzels, J. F., Deen, P. M. (2012) In mpkCCD cells, long-term regulation of aquaporin-2 by vasopressin occurs independent of protein kinase A and CREB but may involve Epac. Am. J. Physiol. Renal Physiol. 302, F1395–F1401 10.1152/ajprenal.00376.2011 [DOI] [PubMed] [Google Scholar]
- 17.Honegger, K. J., Capuano, P., Winter, C., Bacic, D., Stange, G., Wagner, C. A., Biber, J., Murer, H., Hernando, N. (2006) Regulation of sodium–proton exchanger isoform 3 (NHE3) by PKA and exchange protein directly activated by cAMP (EPAC). Proc. Natl. Acad. Sci. USA 103, 803–808 10.1073/pnas.0503562103 [DOI] [PMC free article] [PubMed] [Google Scholar]
- 18.Yan, J., Mei, F. C., Cheng, H., Lao, D. H., Hu, Y., Wei, J., Patrikeev, I., Hao, D., Stutz, S. J., Dineley, K. T., Motamedi, M., Hommel, J. D., Cunningham, K. A., Chen, J., Cheng, X. (2013) Enhanced leptin sensitivity, reduced adiposity, and improved glucose homeostasis in mice lacking exchange protein directly activated by cyclic AMP isoform 1. Mol. Cell. Biol. 33, 918–926 10.1128/MCB.01227-12 [DOI] [PMC free article] [PubMed] [Google Scholar]
- 19.Pereira, L., Cheng, H., Lao, D. H., Na, L., van Oort, R. J., Brown, J. H., Wehrens, X. H., Chen, J., Bers, D. M. (2013) Epac2 mediates cardiac β1-adrenergic–dependent sarcoplasmic reticulum Ca2+ leak and arrhythmia. Circulation 127, 913–922 10.1161/CIRCULATIONAHA.12.148619 [DOI] [PMC free article] [PubMed] [Google Scholar]
- 20.Mamenko, M., Dhande, I., Tomilin, V., Zaika, O., Boukelmoune, N., Zhu, Y., Gonzalez-Garay, M. L., Pochynyuk, O., Doris, P. A. (2016) Defective store-operated calcium entry causes partial nephrogenic diabetes insipidus. J. Am. Soc. Nephrol. 27, 2035–2048 10.1681/ASN.2014121200 [DOI] [PMC free article] [PubMed] [Google Scholar]
- 21.Mamenko, M., Zaika, O., Doris, P. A., Pochynyuk, O. (2012) Salt-dependent inhibition of epithelial Na+ channel–mediated sodium reabsorption in the aldosterone-sensitive distal nephron by bradykinin. Hypertension 60, 1234–1241 10.1161/HYPERTENSIONAHA.112.200469 [DOI] [PMC free article] [PubMed] [Google Scholar]
- 22.Berrout, J., Jin, M., Mamenko, M., Zaika, O., Pochynyuk, O., O’Neil, R. G. (2012) Function of transient receptor potential cation channel subfamily V member 4(TRPV4) as a mechanical transducer in flow-sensitive segments of the renal collecting duct system. J. Biol. Chem. 287, 8782–8791 10.1074/jbc.M111.308411 [DOI] [PMC free article] [PubMed] [Google Scholar]
- 23.Mamenko, M., Zaika, O. L., Boukelmoune, N., Berrout, J., O’Neil, R. G., Pochynyuk, O. (2013) Discrete control of TRPV4 channel function in the distal nephron by protein kinases A and C. J. Biol. Chem. 288, 20306–20314 10.1074/jbc.M113.466797 [DOI] [PMC free article] [PubMed] [Google Scholar]
- 24.Mamenko, M., Zaika, O., O’Neil, R. G., Pochynyuk, O. (2013) Ca2+ imaging as a tool to assess TRP channel function in murine distal nephrons. Methods Mol. Biol. 998, 371–384 10.1007/978-1-62703-351-0_29 [DOI] [PubMed] [Google Scholar]
- 25.Zaika, O., Mamenko, M., Berrout, J., Boukelmoune, N., O’Neil, R. G., Pochynyuk, O. (2013) TRPV4 dysfunction promotes renal cystogenesis in autosomal recessive polycystic kidney disease. J. Am. Soc. Nephrol. 24, 604–616 10.1681/ASN.2012050442 [DOI] [PMC free article] [PubMed] [Google Scholar]
- 26.Grynkiewicz, G., Poenie, M., Tsien, R. Y. (1985) A new generation of Ca2+ indicators with greatly improved fluorescence properties. J. Biol. Chem. 260, 3440–3450 [PubMed] [Google Scholar]
- 27.Yip, K. P., Sham, J. S. (2011) Mechanisms of vasopressin-induced intracellular Ca2+ oscillations in rat inner medullary collecting duct. Am. J. Physiol. Renal Physiol. 300, F540–F548 10.1152/ajprenal.00544.2009 [DOI] [PMC free article] [PubMed] [Google Scholar]
- 28.Yang, L. E., Sandberg, M. B., Can, A. D., Pihakaski-Maunsbach, K., McDonough, A. A. (2008) Effects of dietary salt on renal Na+ transporter subcellular distribution, abundance, and phosphorylation status. Am. J. Physiol. Renal Physiol. 295, F1003–F1016 10.1152/ajprenal.90235.2008 [DOI] [PMC free article] [PubMed] [Google Scholar]
- 29.Donowitz, M., Mohan, S., Zhu, C. X., Chen, T. E., Lin, R., Cha, B., Zachos, N. C., Murtazina, R., Sarker, R., Li, X. (2009) NHE3 regulatory complexes. J. Exp. Biol. 212, 1638–1646 10.1242/jeb.028605 [DOI] [PMC free article] [PubMed] [Google Scholar]
- 30.Klein, J. D., Blount, M. A., Sands, J. M. (2011) Urea transport in the kidney. Compr. Physiol. 1, 699–729 [DOI] [PubMed] [Google Scholar]
- 31.Wade, J. B., Lee, A. J., Liu, J., Ecelbarger, C. A., Mitchell, C., Bradford, A. D., Terris, J., Kim, G. H., Knepper, M. A. (2000) UT-A2: a 55-kDa urea transporter in thin descending limb whose abundance is regulated by vasopressin. Am. J. Physiol. Renal Physiol. 278, F52–F62 10.1152/ajprenal.2000.278.1.F52 [DOI] [PubMed] [Google Scholar]
- 32.Giménez, I., Forbush, B. (2003) Short-term stimulation of the renal Na-K-Cl cotransporter (NKCC2) by vasopressin involves phosphorylation and membrane translocation of the protein. J. Biol. Chem. 278, 26946–26951 10.1074/jbc.M303435200 [DOI] [PubMed] [Google Scholar]
- 33.Pedersen, N. B., Hofmeister, M. V., Rosenbaek, L. L., Nielsen, J., Fenton, R. A. (2010) Vasopressin induces phosphorylation of the thiazide-sensitive sodium chloride cotransporter in the distal convoluted tubule. Kidney Int. 78, 160–169 10.1038/ki.2010.130 [DOI] [PubMed] [Google Scholar]
- 34.Zhu, Y., Chen, H., Boulton, S., Mei, F., Ye, N., Melacini, G., Zhou, J., Cheng, X. (2015) Biochemical and pharmacological characterizations of ESI-09 based EPAC inhibitors: defining the ESI-09 “therapeutic window.” Sci. Rep. 5, 9344 10.1038/srep09344 [DOI] [PMC free article] [PubMed] [Google Scholar]
- 35.Tsalkova, T., Mei, F. C., Li, S., Chepurny, O. G., Leech, C. A., Liu, T., Holz, G. G., Woods, V. L., Jr., Cheng, X. (2012) Isoform-specific antagonists of exchange proteins directly activated by cAMP. Proc. Natl. Acad. Sci. USA 109, 18613–18618 10.1073/pnas.1210209109 [DOI] [PMC free article] [PubMed] [Google Scholar]
- 36.Almahariq, M., Tsalkova, T., Mei, F. C., Chen, H., Zhou, J., Sastry, S. K., Schwede, F., Cheng, X. (2013) A novel EPAC-specific inhibitor suppresses pancreatic cancer cell migration and invasion. Mol. Pharmacol. 83, 122–128 10.1124/mol.112.080689 [DOI] [PMC free article] [PubMed] [Google Scholar]
- 37.Palmer, L. G., Schnermann, J. (2015) Integrated control of Na transport along the nephron. Clin. J. Am. Soc. Nephrol. 10, 676–687 10.2215/CJN.12391213 [DOI] [PMC free article] [PubMed] [Google Scholar]
- 38.Fenton, R. A., Poulsen, S. B., de la Mora Chavez, S., Soleimani, M., Dominguez Rieg, J. A., Rieg, T. (2017) Renal tubular NHE3 is required in the maintenance of water and sodium chloride homeostasis. Kidney Int. 92, 397–414 10.1016/j.kint.2017.02.001 [DOI] [PMC free article] [PubMed] [Google Scholar]
- 39.Schultheis, P. J., Clarke, L. L., Meneton, P., Miller, M. L., Soleimani, M., Gawenis, L. R., Riddle, T. M., Duffy, J. J., Doetschman, T., Wang, T., Giebisch, G., Aronson, P. S., Lorenz, J. N., Shull, G. E. (1998) Renal and intestinal absorptive defects in mice lacking the NHE3 Na+/H+ exchanger. Nat. Genet. 19, 282–285 10.1038/969 [DOI] [PubMed] [Google Scholar]
- 40.Bradford, E. M., Sartor, M. A., Gawenis, L. R., Clarke, L. L., Shull, G. E. (2009) Reduced NHE3-mediated Na+ absorption increases survival and decreases the incidence of intestinal obstructions in cystic fibrosis mice. Am. J. Physiol. Gastrointest. Liver Physiol. 296, G886–G898 10.1152/ajpgi.90520.2008 [DOI] [PMC free article] [PubMed] [Google Scholar]
- 41.Collazo, R., Fan, L., Hu, M. C., Zhao, H., Wiederkehr, M. R., Moe, O. W. (2000) Acute regulation of Na+/H+ exchanger NHE3 by parathyroid hormone via NHE3 phosphorylation and dynamin-dependent endocytosis. J. Biol. Chem. 275, 31601–31608 10.1074/jbc.M000600200 [DOI] [PubMed] [Google Scholar]
- 42.Wiederkehr, M. R., Di Sole, F., Collazo, R., Quiñones, H., Fan, L., Murer, H., Helmle-Kolb, C., Moe, O. W. (2001) Characterization of acute inhibition of Na/H exchanger NHE-3 by dopamine in opossum kidney cells. Kidney Int. 59, 197–209 10.1046/j.1523-1755.2001.00480.x [DOI] [PubMed] [Google Scholar]
- 43.Broere, N., Chen, M., Cinar, A., Singh, A. K., Hillesheim, J., Riederer, B., Lünnemann, M., Rottinghaus, I., Krabbenhöft, A., Engelhardt, R., Rausch, B., Weinman, E. J., Donowitz, M., Hubbard, A., Kocher, O., de Jonge, H. R., Hogema, B. M., Seidler, U. (2009) Defective jejunal and colonic salt absorption and alteredNa+/H+ exchanger 3 (NHE3) activity in NHE regulatory factor 1 (NHERF1) adaptor protein–deficient mice. Pflugers Arch. 457, 1079–1091 10.1007/s00424-008-0579-1 [DOI] [PMC free article] [PubMed] [Google Scholar]
- 44.Cunningham, R., Steplock, D., Wang, F., Huang, H., e, X., Shenolikar, S., Weinman, E. J. (2004) Defective parathyroid hormone regulation of NHE3 activity and phosphate adaptation in cultured NHERF-1−/− renal proximal tubule cells. J. Biol. Chem. 279, 37815–37821 10.1074/jbc.M405893200 [DOI] [PubMed] [Google Scholar]
- 45.Lobo, M. J., Amaral, M. D., Zaccolo, M., Farinha, C. M. (2016) EPAC1 activation by cAMP stabilizes CFTR at the membrane by promoting its interaction with NHERF1. J. Cell Sci. 129, 2599–2612 10.1242/jcs.185629 [DOI] [PubMed] [Google Scholar]
- 46.Good, D. W., Watts III, B. A. (1996) Functional roles of apical membrane Na+/H+ exchange in rat medullary thick ascending limb. Am. J. Physiol. 270, F691–F699 [DOI] [PubMed] [Google Scholar]
- 47.Danziger, J., Zeidel, M. L. (2015) Osmotic homeostasis. Clin. J. Am. Soc. Nephrol. 10, 852–862 10.2215/CJN.10741013 [DOI] [PMC free article] [PubMed] [Google Scholar]
- 48.Mount, D. B. (2014) Thick ascending limb of the loop of Henle. Clin. J. Am. Soc. Nephrol. 9, 1974–1986 10.2215/CJN.04480413 [DOI] [PMC free article] [PubMed] [Google Scholar]
- 49.de Bruijn, P. I., Larsen, C. K., Frische, S., Himmerkus, N., Praetorius, H. A., Bleich, M., Leipziger, J. (2015) Furosemide-induced urinary acidification is caused by pronounced H+ secretion in the thick ascending limb. Am. J. Physiol. Renal Physiol. 309, F146–F153 10.1152/ajprenal.00154.2015 [DOI] [PubMed] [Google Scholar]
- 50.Knepper, M. A., Kwon, T. H., Nielsen, S. (2015) Molecular physiology of water balance. N. Engl. J. Med. 372, 1349–1358 10.1056/NEJMra1404726 [DOI] [PMC free article] [PubMed] [Google Scholar]
- 51.Wilson, J. L., Miranda, C. A., Knepper, M. A. (2013) Vasopressin and the regulation of aquaporin-2. Clin. Exp. Nephrol. 17, 751–764 10.1007/s10157-013-0789-5 [DOI] [PMC free article] [PubMed] [Google Scholar]
- 52.Bockenhauer, D., Bichet, D. G. (2015) Pathophysiology, diagnosis and management of nephrogenic diabetes insipidus. Nat. Rev. Nephrol. 11, 576–588 10.1038/nrneph.2015.89 [DOI] [PubMed] [Google Scholar]
- 53.Rinschen, M. M., Yu, M. J., Wang, G., Boja, E. S., Hoffert, J. D., Pisitkun, T., Knepper, M. A. (2010) Quantitative phosphoproteomic analysis reveals vasopressin V2-receptor–dependent signaling pathways in renal collecting duct cells. Proc. Natl. Acad. Sci. USA 107, 3882–3887 10.1073/pnas.0910646107 [DOI] [PMC free article] [PubMed] [Google Scholar]
- 54.Fushimi, K., Sasaki, S., Marumo, F. (1997) Phosphorylation of serine 256 is required for cAMP-dependent regulatory exocytosis of the aquaporin-2 water channel. J. Biol. Chem. 272, 14800–14804 10.1074/jbc.272.23.14800 [DOI] [PubMed] [Google Scholar]
- 55.Matsumura, Y., Uchida, S., Rai, T., Sasaki, S., Marumo, F. (1997) Transcriptional regulation of aquaporin-2 water channel gene by cAMP. J. Am. Soc. Nephrol. 8, 861–867 [DOI] [PubMed] [Google Scholar]
- 56.Yasui, M., Zelenin, S. M., Celsi, G., Aperia, A. (1997) Adenylate cyclase–coupled vasopressin receptor activates AQP2 promoter via a dual effect on CRE and AP1 elements. Am. J. Physiol. 272, F443–F450 [DOI] [PubMed] [Google Scholar]
- 57.Li, S. Z., McDill, B. W., Kovach, P. A., Ding, L., Go, W. Y., Ho, S. N., Chen, F. (2007) Calcineurin-NFATc signaling pathway regulates AQP2 expression in response to calcium signals and osmotic stress. Am. J. Physiol. Cell Physiol. 292, C1606–C1616 10.1152/ajpcell.00588.2005 [DOI] [PubMed] [Google Scholar]
- 58.Ecelbarger, C. A., Kim, G. H., Wade, J. B., Knepper, M. A. (2001) Regulation of the abundance of renal sodium transporters and channels by vasopressin. Exp. Neurol. 171, 227–234 10.1006/exnr.2001.7775 [DOI] [PubMed] [Google Scholar]
- 59.Caceres, P. S., Ares, G. R., Ortiz, P. A. (2009) cAMP stimulates apical exocytosis of the renal Na+-K+-2Cl− cotransporter NKCC2 in the thick ascending limb: role of protein kinase A. J. Biol. Chem. 284, 24965–24971 10.1074/jbc.M109.037135 [DOI] [PMC free article] [PubMed] [Google Scholar]
- 60.Kang, G., Joseph, J. W., Chepurny, O. G., Monaco, M., Wheeler, M. B., Bos, J. L., Schwede, F., Genieser, H. G., Holz, G. G. (2003) Epac-selective cAMP analog 8-pCPT-2′-O-Me-cAMP as a stimulus for Ca2+-induced Ca2+ release and exocytosis in pancreatic beta-cells. J. Biol. Chem. 278, 8279–8285 10.1074/jbc.M211682200 [DOI] [PMC free article] [PubMed] [Google Scholar]
- 61.Morel, E., Marcantoni, A., Gastineau, M., Birkedal, R., Rochais, F., Garnier, A., Lompré, A. M., Vandecasteele, G., Lezoualc’h, F. (2005) cAMP-binding protein Epac induces cardiomyocyte hypertrophy. Circ. Res. 97, 1296–1304 10.1161/01.RES.0000194325.31359.86 [DOI] [PubMed] [Google Scholar]
- 62.Klein, J. D., Wang, Y., Mistry, A., LaRocque, L. M., Molina, P. A., Rogers, R. T., Blount, M. A., Sands, J. M. (2016) Transgenic restoration of urea transporter A1 confers maximal urinary concentration in the absence of urea transporter A3. J. Am. Soc. Nephrol. 27, 1448–1455 10.1681/ASN.2014121267 [DOI] [PMC free article] [PubMed] [Google Scholar]
- 63.Wang, Y., Klein, J. D., Blount, M. A., Martin, C. F., Kent, K. J., Pech, V., Wall, S. M., Sands, J. M. (2009) Epac regulates UT-A1 to increase urea transport in inner medullary collecting ducts. J. Am. Soc. Nephrol. 20, 2018–2024 10.1681/ASN.2008121225 [DOI] [PMC free article] [PubMed] [Google Scholar]
- 64.Uchida, S., Sohara, E., Rai, T., Ikawa, M., Okabe, M., Sasaki, S. (2005) Impaired urea accumulation in the inner medulla of mice lacking the urea transporter UT-A2. Mol. Cell. Biol. 25, 7357–7363 10.1128/MCB.25.16.7357-7363.2005 [DOI] [PMC free article] [PubMed] [Google Scholar]
Associated Data
This section collects any data citations, data availability statements, or supplementary materials included in this article.


