

Summary
Directed evolution is a powerful approach for engineering biomolecules and understanding adaptation. However, experimental strategies for directed evolution are notoriously laborintensive and low-throughput, limiting access to demanding functions, multiple functions in parallel, and the study of molecular evolution in replicate. We report OrthoRep, an orthogonal DNA polymerase-plasmid pair in yeast that stably mutates ~100,000-fold faster than the host genome in vivo, exceeding the error threshold of genomic replication that causes singlegeneration extinction. User-defined genes in OrthoRep continuously and rapidly evolve through serial passaging, a highly straightforward and scalable process. Using OrthoRep, we evolved drug-resistant malarial DHFRs in 90 independent replicates. We uncovered a more complex fitness landscape than previously realized, including common adaptive trajectories constrained by epistasis, rare outcomes that avoid a frequent early adaptive mutation, and a suboptimal fitness peak that occasionally traps evolving populations. OrthoRep enables a new paradigm of routine, high-throughput evolution of biomolecular and cellular function.
Keywords: Directed evolution, biomolecular evolution, continuous evolution, orthogonal replication, error threshold, drug resistance
Graphical Abstarct
In Brief
An orthogonal DNA replication system with high mutagenicity allows for continuous directed evolution and investigation into experimental evolutionary trajectories including the adaptive landscape of malarial drug resistance.
Introduction
By subjecting genes to repeated cycles of mutation and functional selection, the field of directed evolution has yielded extraordinary successes, including numerous industrial enzymes and therapeutic proteins, expanded genetic codes, and significant insights into how RNAs and proteins evolve (Davis et al., 2017; Packer and Liu, 2015; Turner, 2009). However, existing approaches to directed evolution are difficult to scale: classical methods rely on onerous rounds of in vitro gene diversification followed by transformation into cells for expression and selection, and a pioneering phage-assisted continuous evolution system requires specialized setups and is largely incompatible with selections based on cellular phenotypes (Esvelt et al., 2011). These shortcomings limit the routine evolution of novel biomolecular functions that require long mutational paths to access, the rapid evolution of enzymes and metabolic pathways that fully integrate with host systems, and the extensive parallelization of directed evolution experiments to discover multiple related functions or to map the scope of adaptive trajectories leading to important properties such as drug resistance.
In principle, the most scalable and experimentally straightforward evolution systems are living cells, since populations of cells will continuously adapt when simply passaged under selective conditions. For example, microbial evolution experiments are routinely run in high-throughput (i.e. scores of replicate lines) to optimize strains, map adaptive landscapes, and understand evolutionary dynamics (Hegreness et al., 2008; Kim et al., 2014; Kryazhimskiy et al., 2012; Kryazhimskiy et al., 2014; Lang et al., 2011; Tenaillon et al., 2012). However, because genomic mutation rates are low, any single gene can only evolve slowly, making the basic passaging of cells a poor approach to the directed evolution of novel biomolecules or specific genes. While it is possible to elevate genomic mutation rates with chemical mutagens or by engineering host DNA polymerases (DNAPs) and repair systems (Badran and Liu, 2015; Herr et al., 2011; Loeb et al., 1999), the large number of essential genes in a cell’s genome sets both soft and hard “speed limits” on mutation rates (Biebricher et al., 2006; Bull et al., 2007; Drake 1991; Herr et al., 2011; Loeb et al., 1999; Nowak and Schuster, 1989; Wilke et al., 2001), making only modest increases sustainable. Furthermore, genome-wide mutagenesis allows adaptation to occur through mutations outside of user-defined genes, which defeats the purpose of most directed evolution experiments that aim to deliver a specific protein or enzyme with new function, and risks the fixation of trivial solutions (e.g. cheater mutations) that satisfy the selection conditions.
We report OrthoRep, a highly-error-prone orthogonal DNAP-DNA plasmid pair in yeast (Ravikumar et al., 2014) that mutates user-defined genes at rates of ~1×10⁻⁵ substitutions per base (s.p.b.) without increasing the genomic mutation rate (~10−10 s.p.b.) at all. This ~100,000-fold mutational acceleration enables the rapid, continuous evolution of genes entirely in vivo. We describe a substantial DNAP engineering effort that yielded highly error-prone orthogonal DNAP variants, show that OrthoRep stably replicates desired genes at error rates above the mutation-induced extinction threshold of the host genome (Herr et al., 2011), and demonstrate the utility of OrthoRep in studying drug resistance. By encoding Plasmodium falciparum DHFR (Wooden et al., 1997) on OrthoRep, we were able to evolve highly resistant PfDHFRs in 90 independent replicates through the simple serial passaging of cells in the presence of the PfDHFR inhibitor, pyrimethamine. Prevailing analyses of PfDHFR resistance focus on a single fitness peak observed widely in the field (Chusacultanachai et al., 2002; Hankins et al., 2001; Japrung et al., 2007; Lozovsky et al., 2009; Sirawaraporn et al., 1997), but our experiment reveals a more complex landscape including other genotypes of similar fitness. We find that a highly adaptive first-step mutation constrains path choice, leading to convergence, but also that rare mutations direct trajectories to alternative outcomes or a suboptimal fitness trap, illustrating the balance between fate and chance in drug resistance. By drastically scaling and simplifying directed evolution, OrthoRep should have widespread utility in the search for new biomolecular and cellular functions and the study of molecular adaptation.
Results
Engineering highly error-prone orthogonal DNAPs for OrthoRep
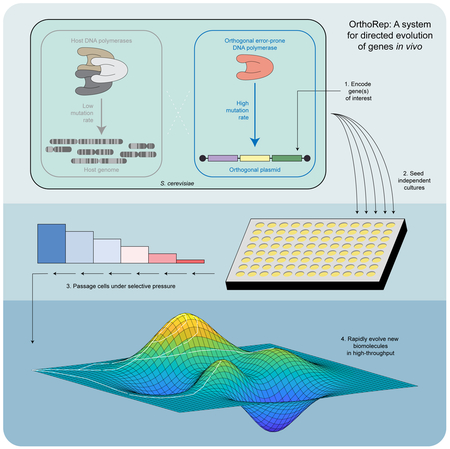
The basis of OrthoRep is a DNA polymerase (TP-DNAP1) that replicates a linear, high-copy, cytoplasmic DNA plasmid, p1, in Saccharomyces cerevisiae (Figure 1A; see Figure S1 for a full description of OrthoRep). Owing to the unique mechanism of p1 replication initiation via protein-priming and the spatial separation of p1 and TP-DNAP1 from nuclear DNA, engineered changes to TP-DNAP1’s properties should not affect the host genome. For example, we previously found that expression of TP-DNAP1 (Y427A) moderately increased the mutation rate of genes encoded on p1 to 3.5×10⁻⁸ s.p.b., while the endogenous mutation rate of genes in the genome (~10−10 s.p.b.) remained unchanged (Ravikumar et al., 2014).
Figure 1. Overview of OrthoRep and engineering of highly error-prone orthogonal DNAPs.

(A) Conceptual illustration of OrthoRep. See Figure S1 for an expanded description.
(B) Mutation rates of 65 basis set TP-DNAP1 variants found from a homology study and a TP-DNAP1 library screen. Variants are ordered by amino acid position in the TP-DNAP1 openreading frame. Residues 1-350, corresponding to the putative TP domain, are not shown. Color-coding indicates regions known to determine fidelity.
(C) Mutation rates of a representative panel of TP-DNAP1s and genomic substitution rates in the presence of highly error-prone variants. TP-DNAP1 substitution rates shown in (B) and (C) were measured with fluctuation tests using p1-encoded leu2 (Q180*). Open circles in (C) represent measurements from independent fluctuation tests, and bars denote median measurements. Genomic substitution rates shown in (C) were determined for strains harboring p1 and each TP-DNAP1 variant as well as for the OrthoRep parent strain, AH22, which lacks p1 and TP-DNAP1. Genomic substitution rates were measured at the URA3 locus in large-scale fluctuation tests and are shown as individual measurements. See Tables S2 and S6 for all mutation rate values, confidence intervals, and other information.
In order to enable accelerated directed evolution experiments in small culture volumes amenable to high-throughput serial passaging, we drastically increased the mutation rate of p1 replication by engineering highly error-prone variants of TP-DNAP1. First, we sought to find a collection of single amino acid mutant TP-DNAP1s with elevated mutation rates. We anticipated that single amino acid changes would yield modest mutators that could then serve as a basis set for building TP-DNAP1s with multiple mutations that act together to reduce fidelity. Indeed, in a study of Escherichia coli Pol I, a combination of three moderately fidelity-reducing mutations in the exonuclease domain, active site, and O-helix resulted in an 80,000-fold increase in Pol I’s error rate (Camps et al., 2003). Initial attempts to populate the TP-DNAP1 basis set, based on homology analysis to related family B DNAPs, (Figure S2A; Table S1) mostly yielded low activity variants (Table S2), due to the idiosyncrasies of protein-priming DNAPs. Mutators identified from this effort (referred to below as Rd1 mutants) seeded our basis set, but we pursued a comprehensive approach to find high-activity variants suitable for combination.
In the largest fidelity screen of a DNAP to date, ~14,000 clones from a scanning saturation mutagenesis library of TP-DNAP1 were assayed for p1 replication activity and substitution mutation rate changes (see Figures S2 and S3, Table S3, and STAR Methods for details.) From this screen, we found 95 promising error-prone TP-DNAP1 candidates (Table S2). After measuring their mutation rates more accurately through large-scale fluctuation tests, we identified 41 unique variants (Rd2 mutants) with error rates up to ~2×10⁻⁷ s.p.b. (Table S2). Unlike Rd1 mutants, Rd2 mutants retained high activity, and on average replicated p1 at only a 2-fold lower copy number than did wild type (w.t.) TP-DNAP1. Only 9 of the Rd2 hits contained mutations at positions considered in the homology-based library design that generated Rd1 hits, indicating that fidelity determinants of TP-DNAP1 can lie outside of the most-conserved regions of DNAPs. Incidentally, we also discovered 210 TP-DNAP1 variants that replicated p1 at a higher copy number than did w.t. TP-DNAP1 (Table S4), and added the mutation from one of these variants to several low-activity mutator TP-DNAP1s to confirm the generality of the activity-boosting phenotype (Table S5). (These variants were not included in subsequent experiments here, but should prove useful in future TP-DNAP1 engineering efforts.) Rd2 hits were combined with Rd1 hits to form a 65-member basis set of mutations that moderately increase the error rate of TP-DNAP1 (Figure 1B).
Using this basis set, we designed, cloned, and screened combinatorial libraries in order to find highly error-prone TP-DNAP1s. To limit combinatorial diversity in our designs, we grouped basis set mutations according to their proximity to DNAP motifs known to affect fidelity (i.e. the A and C motifs in the palm domain, the B motif in the fingers domain, and the Exo I, II, and III motifs in the exonuclease domain (Joyce and Steitz, 1994)) and cloned only inter-motif combinations. We expected that synergy between inter-motif mutations from different domains (e.g. motif A mutations with motif B mutations) would yield super-additive or super-multiplicative reductions in fidelity, as observed with RB69 DNAP and E. coli Pol I, respectively (Bebenek et al., 2001; Camps et al., 2003). We screened a library of motif B mutants crossed with motif A and C mutants and found 46 mutators (Table S2). The most error-prone of these 46 include three TP-DNAP1 variants (Rd3 mutants) with mutation rates of ~1×10⁻⁶ s.p.b., representing a ~400-fold increase over the w.t. TP-DNAP1 mutation rate and a ~10,000-fold increase over the yeast genomic mutation rate. We then crossed these Rd3 mutants with all of the exonuclease domain mutants from our basis set. After screening the resulting library, we obtained four hits (Rd4 mutants), including two highly error-prone variants, TP-DNAP1-4-1 (V574F, I777K, L900S) and TP-DNAP1-4-2 (L477V, L640Y, I777K, W814N), that replicate p1 at mutation rates of ~7×10⁻⁶ s.p.b. and ~1×10⁻⁵ s.p.b., respectively, and that both sustain a p1 copy number of ~5 (Figure 1C; Table S2). Additional rounds of library design and screening should reach even higher error rates, but these two Rd4 mutants are already exceptionally error-prone, so we ended our polymerase engineering effort at this point. As a practical guide, for facile generation of DNA libraries in vivo with TP-DNAP1-4-2, a 1 μL saturated yeast culture is theoretically sufficient for 1-fold coverage of all single mutants of a 1 kb gene and a 200 mL culture is sufficient for all double mutants. With mutational accumulation, highly diverse libraries can be generated in even smaller volumes: 1-fold coverage of all double mutants of a 1 kb gene can be achieved in a 650 μL culture with just 50 generations of propagation.
We found that the high p1 mutation rates driven by error-prone TP-DNAP1s remained completely stable for the longest duration tested (90 generations; Table S2), and genomic mutation rates remain unchanged in the presence of p1 replication by the most error-prone TP-DNAP1, TP-DNAP1-4-2 (Figure 1C; Table 1). Therefore, OrthoRep can durably sustain in vivo mutagenesis with complete orthogonality (i.e. at least ~100,000-fold mutational targeting) to enable continuous evolution experiments. A comparison of OrthoRep to other directed evolution systems is provided in Table S7 and is discussed below.
Table 1. Yeast genomic substitution mutation rates in the presence of OrthoRep.
Per-base substitution rates were measured at the URA3 locus in the presence of TP-DNAP1 variants. Genomic fluctuation tests were performed in the presence of p1 replication by TP-DNAP1 variants by selecting for a p1-encoded marker. AH22 is the parent OrthoRep strain and lacks p1 and TP-DNAP1. Data shown are individual mutation rates, each with a corresponding 95% confidence interval (C.I.) and a count of the number of replicates performed for the fluctuation test.
| TP-DNAP1 | Mutation rate (s.p.b.) |
Lower 95% C.I. (s.p.b.) |
Upper 95% C.I. (s.p.b.) |
Number of replicates |
|---|---|---|---|---|
| None (AH22) | 1.86×10⁻¹⁰ | 1.34×10⁻¹⁰ | 2.50×10⁻¹⁰ | 187 |
| w.t. | 8.73×10⁻¹¹ | 3.47×10⁻¹¹ | 1.77×10⁻¹⁰ | 90 |
| L474W, L640Y, I777K, W814N | 2.17×10⁻¹⁰ | 7.80×10⁻¹¹ | 4.67×10⁻¹⁰ | 90 |
| Y431H, L640Y, I777K, W814N | 2.68×10⁻¹⁰ | 1.53×10⁻¹¹ | 1.18×10⁻⁹ | 90 |
| V574F, I777K, L900S | 1.76×10⁻¹⁰ | 4.37×10⁻¹¹ | 4.55×10⁻¹⁰ | 90 |
| L477V, L640Y, I777K, W814N | 1.98×10⁻¹⁰ | 1.40×10⁻¹⁰ | 2.71×10⁻¹⁰ | 186 |
OrthoRep crosses mutation-induced error thresholds of the yeast genome
OrthoRep can access and sustain mutation rates that untargeted genome mutagenesis cannot. There is a theoretically predicted and empirically observed inverse relationship between the length of an information-encoding polymer, such as a gene or genome, and the tolerable error rate of replication (Biebricher et al., 2006; Bull et al., 2007; Drake 1991; Nowak and Schuster, 1989). At sufficiently high mutation rates, essential genetic information is destroyed every generation, guaranteeing extinction, and even moderately elevated mutation rates can erode fitness (Herr et al., 2011; Wilke et al., 2001). Continuous directed evolution systems fundamentally work by targeting mutagenesis to desired genes in order to bypass the low error thresholds of large cellular genomes, but existing systems still elevate genome-wide mutation rates of cells or phages, falling short of a complete bypass (Badran and Liu, 2015; Camps et al., 2003; Crook et al., 2016; Esvelt et al., 2011; Fabret et al., 2000; Finney-Manchester and Maheshri, 2013; Halperin et al., 2018; Moore et al., 2018). Since OrthoRep is fully orthogonal to genomic replication, it achieves the complete bypass of genomic error thresholds for genes of interest, which should result in the ability to run in vivo continuous evolution for indefinitely large numbers of generation at mutation rates that are exclusively limited by the thresholds of user-selected genes.
In order to demonstrate the limitations of genomic error thresholds on continuous evolution, we experimentally applied high mutation rates to the host genome. This was done by transplanting previously discovered mutations that increase the substitution mutation rate of POL3 (Herr et al., 2011), the primary yeast lagging strand DNAP, into w.t. or mismatch repair-deficient (Δmsh6) versions of AH22, the parent of OrthoRep strains. Mutator phenotypes, verified by fluctuation tests at a genomic locus, were accompanied by severe growth defects and led to immediate extinction in the case of pol3-01, Δmsh6 AH22 (Figure 2A). In agreement with a previous estimate (Herr et al., 2011), the projected mutation rate imposed in this nonviable AH22 strain was 4.72×10⁻⁶ s.p.b., calculated from the individual contribution of pol3-01 and the average effect of MSH6 loss. This mutation rate is presumed to exceed the haploid yeast error-induced extinction threshold thereby killing the host cell (Herr et al., 2011). Since replication of p1 by TP-DNAP1-4-2 occurs at a higher mutation rate than 4.72×10⁻⁶ s.p.b., we conclude that OrthoRep can stably exceed categorical mutation rate limits on replicating cellular genomes.
Figure 2. OrthoRep crosses mutation-induced error thresholds of the yeast genome.

(A) A series of yeast genomic mutator strains spanning mutation rates from the w.t. rate to the extinction threshold (upper limit). OrthoRep’s parent strain, AH22, was modified to express its genomic w.t. POL3 from a plasmid, and POL3 variants were introduced into w.t. or mismatch repair-deficient (Δmsh6) versions of this strain via plasmid shuffle. W.t. POL3 is retained in pre-plasmid shuffle plating controls. Genomic mutation rates were measured ~15 generations after plasmid shuffle. The projected mutation rate of the inviable pol3-01, Δmsh6 strain was calculated as the product of the mutational increases due topol3-01 (58-fold) and Δmsh6 mutations (106-fold, averaged across genotypes). The proofreading deficient pol3-01 allele encodes POL3 (D321A, E323A). T711A, Y808C, H879Y, and S968R are suppressor mutations that reduce the error rate of pol3-01.
(B) Mutational stability of viable genomic mutator strains versus OrthoRep. Strains harboring POL3 variants or OrthoRep with TP-DNAP1-4-2 were passaged in triplicate for 82 or 90 generations, respectively. Afterwards, genomic or OrthoRep substitution mutation rates were measured at the genomic CAN1 locus or with p1-encoded leu2 (Q180*), respectively. Data shown in (A) and (B) are individual measurements with 95% confidence intervals.
See also Table S9.
We also asked whether viable genomic mutator strains could sustain mutagenesis. Four AH22 strains with mutation rates of 1.64×10⁻⁷-5.24×10⁻⁷ s.p.b. were propagated for 82 generations in triplicate, and afterwards, a clone from each was subject to genomic mutation rate measurements via fluctuation tests (Figure 2B). Across replicates, the mutation rate drops an average of 284-fold (Figure 2B), likely due to suppressor mutants that alleviate deleterious genome mutagenesis and overtake the population (Herr et al., 2011). In contrast, mutagenesis on p1 remains constant (Figure 2B). This indicates that in durations relevant to directed evolution experiments, even moderate genome mutagenesis is unsustainable whereas continuous mutagenesis in OrthoRep is sustainable.
High-throughput evolution of PfDHFR reveals adaptive trajectories leading to drug resistance
Sustainable, continuous, and targeted mutagenesis with OrthoRep can be used to understand and predict drug resistance in high-throughput evolution experiments that abundantly sample adaptive trajectories and outcomes. PfDHFR resistance to the antimalarial drug, pyrimethamine, occurs in the wild primarily through four active site mutations (N51I, C59R, S108N, and I164L), but the broader resistance landscape remains largely unknown. Laboratory evolution and landscape-mapping studies have mostly been limited to the quadruple mutant fitness peak (qm-wild) and suggest that resistance reproducibly arises from the crucial S108N mutation, followed by step-wise paths to qm-wild (Chusacultanachai et al., 2002; Hankins et al., 2001; Japrung et al., 2007; Lozovsky et al., 2009; Sirawaraporn et al., 1997; Wooden et al., 1997). We asked whether high-throughput directed evolution of PfDHFR resistance to pyrimethamine would reveal a more complex landscape with additional fitness peaks, including ones that forgo S108N.
We used OrthoRep to evolve PfDHFR resistance to pyrimethamine in 90 independent 0.5 mL cultures (Figure 3A). Based on a well-established yeast model of PfDHFR, we constructed transgenic yeast strains that lack endogenous DHFR and depend on p1-encoded PfDHFR. These strains acquired sensitivity to pyrimethamine and in pilot studies, evolved resistance by accumulating mutations in PfDHFR (Figure S4). We found that resistance arose more commonly and successfully as the mutation rate of p1 was increased (Figure S4), suggesting that OrthoRep could indeed be used to drive rapid PfDHFR evolution. To perform a large-scale resistance evolution experiment, strain OR-Y8, which uses the most mutagenic TP-DNAP1 (TP-DNAP1-4-2) to replicate p1-encoded PfDHFR, was seeded into 90 independent 0.5 mL cultures containing pyrimethamine. Cultures were grown to saturation and uniformly passaged at 1:100 dilutions into media containing gradually increasing pyrimethamine concentrations chosen to maintain strong selection as populations adapted (Figure 3A). After just 13 passages (i.e. 87 generations), 78 surviving populations adapted to media containing the maximum soluble concentration of pyrimethamine (3 mM). (Revival experiments showed that extinction of the 12 replicates was stochastic and that they could also adapt given repeated chances (Table S6).) From Sanger sequencing analysis of bulk adapted populations (see STAR Methods for details), we identified 37 unique protein-coding mutations across all replicates and as many as six amino acid changes in a single population. A large fraction of these mutations are predicted to be adaptive. For example, ten of the 37 mutations have been previously reported to yield pyrimethamine resistance (Chusacultanachai et al., 2002; Hankins et al., 2001; Japrung et al., 2007; Tanaka et al., 1990). In addition to these 37 mutations, several mutations identified in the promoter region increased gene expression (manuscript in preparation); and we hypothesize that some of the observed synonymous mutations in PfDHFR reduce translational suppression mediated by binding of PfDHFR to its own mRNA sequence (Zhang and Rathod, 2002).
Figure 3. High-throughput evolution of PfDHFR resistance to pyrimethamine.

(A) The strain used for evolution (OR-Y8) and the drug regimen to which it was subjected. Evolving lines of OR-Y8 were monitored daily by OD600 measurement and passaged at a 1:100 dilution when 70/90 replicates reached an OD600 of 0.7. Pyrimethamine concentration was uniformly increased if diluted cultures reached the growth cutoff within 72 hours. Evolution was terminated when populations fully adapted to 3 mM pyrimethamine.
(B) PfDHFR and promoter mutations identified in 78 evolved populations from Sanger sequencing. Green, purple, and yellow shading indicates the presence of a mutation at ~20% frequency or higher. For seven commonly observed mutations, frequencies were calculated and are shown with a color on a gray-blue scale. See STAR Methods for SNP analysis details.
(C) Mutation frequencies tracked across all 13 passages from line 60 in (B).
(D) Mutation frequencies tracked across all 13 passages from line 77 in (B). In (C) and (D), populations from each passage were revived from glycerol stocks in the same media condition that they were initially grown in. Mutation frequencies were calculated from Sanger sequencing of revived populations, as in (B).
Adapted populations primarily converged on a region of the PfDHFR resistance landscape that contains previously unidentified S108N-based genotypes as fit as qm-wild. Across all replicates, we observed seven pervasive coding changes (Figure 3B), including 737_738insA, which creates an adaptive C-terminal truncation (Figure 4A). The two most common mutations, C59R and S108N, occur together in 62/78 adapted populations (Figure 3B). Although these mutations are present in qm-wild, only one population accumulated a third mutation from the qm-wild peak (N51I; replicate 17 in Figure 3B). Instead, most populations diverged from qm-wild and acquired combinations of C50R, D54N, or Y57H in addition to C59R and S108N, indicating a new region in the PfDHFR resistance landscape with high fitness. To validate this, we fully mapped the resistance landscape of this region defined by C50R (10000), D54N (01000), Y57H (00100), C59R (00010), and S108N (00001) by constructing and measuring the MIC of all combinations of these five mutations (Figure 4A). We found that this region is indeed highly fit and contains four alleles that have similar or higher pyrimethamine MICs than qm-wild (11110, 10111, 01111 and 11111 in Figure 4A). Since these alleles are close in genotype, differing by only one or two mutations, they approximate a fitness plateau. In replicate lines 16 and 30 of our evolution experiment, this plateau is reached via 01111. Although most replicates in our experiment do not reach this particular plateau, the 00111 intermediate was frequently accessed. In these instances, additional adaptive mutations were often acquired outside of the five-mutation landscape. For example, replicate 9 contains the previously reported C6Y resistance mutation, alongside Y57H, C59R, and S108N. Since 00111 by itself is almost as resistant as genotypes on the plateau, these populations likely achieved comparable fitness atop neighboring peaks in the wider landscape. Taken together, we conclude that our evolution experiments were able to rapidly identify previously unknown solutions to PfDHFR resistance.
Figure 4. Five-mutation PfDHFR fitness landscapes.

(A) A fitness map of a five-mutation PfDHFR landscape defined by C50R, D54N, Y57H, C59R, and S108N. Black arrows show all theoretically possible single-mutation steps in this landscape. The common S108N-dependent pathway is highlighted with a solid green arrow. The rare S108N-independent pathway is highlighted with a dashed yellow arrow.
(B) A fitness map of a five-mutation PfDHFR landscape defined by C50R, D54N, Y57H, C59Y, and S108N. Black arrows show all theoretically possible single-mutation steps in this landscape. Two commonly observed C59Y-based paths are highlighted with magenta arrows. Dashed arrows represent rare mutational steps. In (A) and (B), MIC of pyrimethamine was determined for yeast strains expressing all 32 PfDHFR alleles from each landscape. Data shown are the range of log10(MIC of pyrimethamine (M)) for biological triplicates, with a color on a red-blue scale indicating the median. The mid-point of the red-blue scale is shifted to distinguish highly resistant alleles. n.g., no growth.
Epistasis among mutations in S108N-based trajectories directs adaptation to 01111 and leads to the observed convergence of 00111 across replicate lines. Because S108N is a highly adaptive single mutant, 00001 rapidly and repeatedly fixed first in evolving populations (Figures 3C and S5), and blocked access to the 96/120 possible trajectories in this landscape that start with other first-step mutations. From 00001, access to the fitness plateau is constrained by negative epistasis between S108N and D54N, which is relieved and changes sign only when Y57H and C59R are both present (Figure 4A). (We note that adapted populations in our evolution experiment containing high frequencies of D54N, C59R and S108N without Y57H, typically carry other, potentially compensatory, promoter and coding mutations that take the place of Y57H.) As a result, just eight of the 24 possible paths from 00001 to the plateau avoid inactive PfDHFR intermediates. Adapting populations limited to these paths likely follow the greediest one (Figure 4A). This explains why our experiment finds that evolution, particularly of 00111 and 01111, is largely repeatable.
Notably, 11110 lies on the fitness plateau without requiring S108N (Figure 4A). Three populations in our experiment avoid mutation at S108 (Figure 3B) and can access this unique quadruple mutant. We attribute this to a rare clonal interference event where the 01100 double mutant arises and displaces a population that has nearly fixed 00001 (Figure 3D). One of these replicates additionally fixed C59R to reach 01110, the triple mutant with the highest MIC (replicate 24 in Figure 3B). Stronger selection for pyrimethamine resistance, if feasible, should also fix C50R and lead to 11110 (Figure 4A).
Since 11110 is suppressed by rapid fixation of S108N, weaker early selection or greater population structure (Salverda et al., 2017; Szendro et al., 2013), should allow alternative first-step mutations (e.g. Y57H, C59R) to fix and increase the chance of reaching 11110. Alternatively, random initial mutations created by neutral drift have been shown to direct drug resistance evolution along new trajectories (Salverda et al., 2011). We examined this latter possibility by repeating evolution from a variant of w.t. PfDHFR with a synonymous codon change at S108 (AGA→TCA) that prevents mutation to N through a single substitution. Twelve populations starting from this allele were evolved under the same pyrimethamine regimen described for the large-scale experiment. In this experiment, the ten surviving populations dramatically shifted towards a new, convergent outcome that avoids S108N and fixes D54N instead (Figure 5). Seven of these ten populations reached the 01100 double mutant that can subsequently access 11110. Since different pyrimethamine-resistant mutants should respond differently to other DHFR inhibitors, the existence of S108N-independent outcomes and the ability to steer the population towards these through weaker selection or neutral drift may have implications for drugs schedule design. In the future, we aim to leverage the scalability of OrthoRep, by starting evolution from hundreds of neutral variants of PfDHFR, to capture the scope of trajectories that may be available from standing variation in natural P. falciparum populations and predict selection conditions that may prefer one trajectory over another. Here, we conclude that our large-scale evolution experiment is able to identify a rare path to pyrimethamine resistance that avoids the commonly observed S108N mutation that is crucial in natural PfDHFR resistance.
Figure 5. Alternative evolutionary trajectories directed by a synonymous initial mutation at S108.

(A) PfDHFR and promoter mutations identified in 10 evolved populations from Sanger sequencing. Green, purple, and yellow shading indicates the presence of a mutation at ~20% frequency or higher. See STAR Methods for SNP analysis details.
(B) Percentage of replicates encoding commonly observed mutations, from two PfDHFR evolution experiments. Evolution was started from the w.t. PfDHFR sequence, or from a recoded allele encoding a synonymous codon at S108.
Several adaptive populations in our experiment access the broader landscape beyond 11111. As described above, in some replicates, 00111 serves as a stepping-stone to neighboring fitness peaks through additional mutations like C6Y. In other replicates, we find a suboptimal peak containing C59Y (10121; Figure 4B) at which populations are occasionally trapped (Figure 3B). In replicate 64, D54N fixes with S108T and avoids negative epistasis with S108N. Future analysis will include less frequent candidate adaptive mutations that occur in multiple replicates (e.g. Y35H, I150T, D222N, L251S, T268A from Figure 3B) or fix independently in time (e.g. M249I from Figure S5F). However, our analysis of only the most common adaptive mutations and mutational paths has already uncovered new peaks in the landscape of PfDHFR-mediated drug resistance and provides examples of how epistasis results in evolutionary repeatability, and how the existence of greedy mutations such as S108N can render a highly adaptive outcome (11110) rare through early fixation. In other words, high-throughput directed evolution with OrthoRep enables the discovery of new fit regions of adaptive landscapes and thorough studies of molecular evolution at the level of a single protein.
Discussion
OrthoRep should have immediate utility as a straightforward and widely-accessible platform for continuous directed evolution, because OrthoRep realizes mutagenesis of user-defined genes entirely inside a living cell. Therefore, it does not require low-throughput DNA transformation and extraction steps or custom setups for linking selection to the propagation of successful gene variants like other systems do (Table S7; Barbieri et al., 2017; DiCarlo et al., 2013; Ellefson et al., 2014; Esvelt et al., 2011; Jakočiūnas et al., 2018; Wang et al., 2009). As a consequence, OrthoRep readily integrates with the existing rich ecosystem of cell-based and in vivo yeast genetic selections. For example, OrthoRep is already being used in our lab and others to evolve novel antibodies via yeast surface display (Boder and Wittrup, 1997; McMahon et al., 2018), protein-protein interactions (PPIs) or PPI inhibitors via yeast two-hybrid systems (Fields and Song, 1989), and heterologous metabolic enzymes like PfDHFR that can replace essential yeast functions. The last of these applications may be especially useful in efforts to create humanized yeast models (Kachroo et al., 2015; Truong and Boeke, 2018) or to improve enzymes from difficult-to-transform hosts like plants. More sophisticated selections can also readily interface with OrthoRep, including dominant negative selections for new orthogonal tRNA/aaRS pairs or sequence-specific DNA binding proteins, which may require titration of p1’s copy number (Figure 6); selections utilizing cell-based technologies such as fluorescence-activated cell sorting (FACS), continuous culturing devices (Wong et al., 2018), and droplet screening systems; and other selections that have been developed for rewiring the specificities of biosensors, GPCRs, or transcription factors (Davis, 2017; Packer and Liu, 2015; Turner, 2009). To enable its immediate widespread application, we have established OrthoRep in different yeast backgrounds, including diploids and industrially relevant strains, have constructed a suite of integration vectors for customizing p1 gene expression, and have shown that p1 can stably encode at least 18 kbs of DNA, allowing for the continuous evolution of both individual genes and multi-gene pathways (manuscripts in preparation).
Figure 6. Titratable control of p1 copy number.

TP-DNAP1 encodes a highly conserved catalytic residue at D641. The TP-DNAP1 (D641A) variant is unable to polymerize DNA, but can still compete with fully functional TP-DNAP1 for replication initiation at the TP origin. TP-DNAP1 (D641A) was expressed under the control of the repressible MET3 promoter in a strain expressing w.t. TP-DNAP1 and mKate2 from p1. Strains were grown in SC media supplemented with methionine for two days, after which OD600 and mKate2 fluorescence were measured. Data shown are the mean OD600-normalized mKate2 fluorescence ± standard deviation (measured in arbitrary units (a.u.)) for biological triplicates.
In the longer term, we believe that OrthoRep has a critical architectural advantage that will make it a mainstay among the rapidly growing number of continuous evolution systems that are becoming available (Table S7; Badran and Liu, 2015; Camps et al., 2003; Crook et al., 2016; Esvelt et al., 2011; Fabret et al., 2000; Finney-Manchester and Maheshri, 2013; Halperin et al., 2018; Hess et al., 2016; Ma et al., 2016; Moore et al., 2018). In OrthoRep, the only way a user-defined gene can propagate is if it also gets mutated. This is because there is only one DNAP capable of replicating the target gene in OrthoRep and that DNAP is error-prone. Furthermore, that error-prone DNAP should remain error-prone: it is encoded on a nuclear plasmid (or the host genome) where it experiences no elevation in mutation rate, since OrthoRep is entirely orthogonal. Other fully in vivo continuous evolution systems achieve diversification of the target gene by recruiting mutagenesis machinery that is not essential for the target gene’s replication, which is still carried out by host replication systems. Therefore, rapid evolution may eventually cease when mutations accumulate in the cis-elements that recruit mutagenesis machinery (e.g. promoters (Moore et al., 2018), reverse transcriptase recognition sequences (Crook et al., 2016), gRNA target sequences (Halperin et al., 2018; Hess et al., 2016; Ma et al., 2016), or target sequences for specific DNA-binding domains (Finney-Manchester and Maheshri, 2013)). Furthermore, in these systems, genomic mutation rates are elevated through off-target effects of the mutagenesis machinery, which increases the risk that the mutagenesis machinery itself will become disabled, especially since increases in genomic mutation rates are deleterious. As the field of continuous directed evolution advances to more difficult target activities that require longer and longer mutational trajectories to reach, OrthoRep’s enforced continuity should become increasingly more valuable. Indeed, we have shown here that OrthoRep stably maintains a high mutation rate for at least 90 generations, and in ongoing evolution experiments, have used OrthoRep to sustain a continuously high rate of mutagenesis for over 300 generations.
In addition to this critical distinction of enforced continuous mutagenesis, OrthoRep is unique in a number of additional aspects that should contribute to its long-term utility for directed evolution. First, OrthoRep supports custom and systematically engineerable mutation rates. Already, we have a series of TP-DNAP1s spanning a mutation rate between ~10−9 s.p.b. to ~10−5 s.p.b., which should allow researchers to choose the right level of mutational accumulation for their evolution experiment. Since the supply of beneficial mutations to a gene can change evolutionary outcomes (Desai et al., 2007), this ability to control OrthoRep’s mutation rate should be valuable in directed evolution. In addition, TP-DNAP1s can potentially be engineered with custom mutational spectra (Table S8) or with high in/del rates for specialized experiments, such as the evolutionary optimization of loop regions in protein scaffolds. Ongoing engineering of TP-DNAP1, informed by in vitro characterization and structure determination, should also yield variants that approach the error threshold of a typical 1 kb gene (~10−3), thereby maximizing the mutation rate for continuous in vivo directed evolution. Second, OrthoRep is a fully scalable platform, since it does not require in vitro library construction or specialized equipment. Therefore, it can be used to evolve genes at bioreactor-scale or, as demonstrated here, in small culture volumes in a high-throughput manner with basic serial passaging. To the best of our knowledge, no study has performed directed evolution of a protein in more than 30 replicate experiments, but here, one experimenter easily performed 90 replicates of PfDHFR evolution. In addition to drug resistance and fitness landscape studies, large high-throughput replication of evolution experiments can be used to test and exploit the relationship between adaptive outcomes and mutational supply, gene dosage, population size, population structure, or selection dynamics. Scalability also means that genes can be evolved for many related phenotypes (e.g. biosensors that recognize different substrates) in parallel, expanding the throughput of directed evolution at large. Third, OrthoRep achieves continuous evolution in a eukaryotic host, whereas other well-established systems are primarily prokaryotic. The space of directed evolution problems addressable in a eukaryote is arguably more relevant to human biology and therapeutics, especially considering the sophistication of posttranslational modifications and signaling pathways available to eukaryotes. Furthermore, among eukaryotes, yeast is a particularly privileged host for directed devolution, because it can sustain large population sizes with fast generation times, and the availability of yeast mating should allow for in vivo recombination of genes being evolved on OrthoRep, expanding the modes of diversification available to continuous evolution. In summary, OrthoRep is a unique, simple, and highly stable in vivo continuous evolution system that should enable the routine generation of new biomolecular and cellular functions.
STAR Methods
CONTACT FOR REAGENT AND RESOURCE SHARING
Further information and requests for resources and reagents should be directed to and will be fulfilled by the Lead Contact, Chang C. Liu (ccl@uci.edu).
EXPERIMENTAL MODEL AND SUBJECT DETAILS
All Saccharomyces cerevisiae parent strains used in this study are listed in Table S9. Parent strains do not include OR-Y24-derived strains containing TP-DNAP1 variants or AR-Y432-derived strains containing POL3 variants. Strains AH22 and F102-2 are described previously (Ravikumar et al., 2014; Gunge et al., 1981). All genetic modifications that were made during strain construction were verified by sequencing and phenotyping.
Strains AR-Y285, AR-Y293, AR-Y302, AR-Y401, AR-Y443, and GA-Y109 contain a mixture of w.t. p1 and recombinant p1 containing a yeast selection marker in place of TP-DNAP1. These strains were not propagated beyond the original outgrowth step from the transformation plate, in order to retain a ~50:50 mixture of w.t. and recombinant p1. Glycerol stocks of meta-stable strains stored at −80 °C served as the source for all subsequent yeast transformations of TP-DNAP1 variants.
All yeast strains were grown at 30 °C in selective synthetic complete (SC) media or yeast extract peptone dextrose (YPD) media. Liquid cultures were grown with 200 r.p.m shaking. Solid medium included 1.5% bacto-agar. Nutrient dropouts of SC media are indicated throughout. Media pH was adjusted for fluctuation tests, as described below.
METHODS DETAILS
DNA cloning.
Plasmids used in this study are listed in Table S9. E. coli strain TG1 (Lucigen) was used for all of the DNA cloning steps. All primers used in this study were purchased from IDT. All enzymes for PCR and cloning were obtained from NEB. All individually cloned plasmids (i.e. excluding TP-DNAP1 libraries) were assembled by the Gibson method (Gibson et al., 2009). To clone plasmid 29, a DNA fragment encoding the open-reading frame of PfDHFR (819 bp) was obtained from IDT.
To clone the scanning saturation mutagenesis library of TP-DNAP1, a pool of ~19,000 oligonucleotides (130-200-mers) was obtained from Agilent Technologies and sub-cloned into plasmid 2. The oligo pool was designed as 29 sub-libraries, each covering a 25-50 variable amino acid region of the TP-DNAP1 open-reading frame and flanked by ~25 bp constant regions (Figure S2B). The variable region consisted of a replacement of each amino acid in the w.t. sequence with 19 codons representing the 19 other amino acids. The mutagenic codons were chosen from a 20-codon genetic code with a maximal codon adaptation index for the S. cerevisiae genome (Figure S2C). Constant regions were chosen for efficient PCR amplification. Each sub-library was PCR amplified and assembled into corresponding PCR-amplified plasmid 2 backbones by the Gibson method (Gibson et al., 2009). Assembled sub-libraries were transformed into E. coli at >30-fold coverage of theoretical diversity and plated on selective LB plates. After overnight growth at 37 °C, transformants were scraped from plates and resuspended in 0.9% NaCl for plasmid extraction. Control transformations containing only the plasmid 2 backbones were similarly treated, to verify a low frequency (<5%) of full-length plasmid 2 carry-over. Plasmids were extracted from individual clones of two sub-libraries and subject to analysis via agarose gel electrophoresis and Sanger sequencing.
To clone mutant TP-DNAP1 shuffling libraries, plasmids of the 65 basis set mutants were pooled and crossed by the Gibson method (Gibson et al., 2009). Since many basis set mutations encode mutations outside of strictly conserved motifs, the TP-DNAP1 open-reading frame was segmented into four regions to define broader boundaries for shuffling: the exonuclease domain (amino acids 1-596), motif A (amino acids 597-684), motif B (amino acids 685-819) and motif C (amino acids 820-987). To cross the 7 motif B basis set mutants with the 10 motif A and 8 motif C basis set mutants, the corresponding regions were PCR amplified from individual mutant TP-DNAP1 plasmids, and PCR amplicons from each region were pooled in equimolar ratios. Pooled fragments were assembled with a PCR-amplified plasmid 2 backbone by the Gibson method (Gibson et al., 2009). Assembled libraries were transformed and extracted as described above. Shuffling libraries contained a large fraction of misassembled plasmids, as determined by agarose gel electrophoresis. The desired plasmid population was purified by gel extraction and re-transformation. Both transformation steps retained >100-fold coverage of theoretical library size. Plasmids were extracted from individual clones of the purified libraries and subject to analysis via gel electrophoresis and Sanger sequencing. To cross round-3 mutants with exonuclease basis set mutants, a new region was defined to cover round-3 mutants (amino acids 597-987), and a similar cloning procedure was followed.
Yeast transformation.
All yeast transformations (including p1 integrations) were performed as described previously (Ravikumar et al., 2014). Genomic modifications were made using a CRISPR-Cas9 system for S. cerevisiae (Ryan et al., 2016).
We note the following protocol modifications for library transformations: (i) 10 μg of plasmid DNA was added for each library transformation; (ii) cells were incubated at 30 °C for 45 min with rotation at ~10 r.p.m prior to heat shock; (iii) cells were resuspended in 0.9% NaCl after heat shock and a small portion was plated on selective SC medium to determine library size; (iv) the remaining resuspension was inoculated directly into 50 mL (per transformation) of selective SC media and grown to saturation at 30 °C.
Yeast DNA extraction.
Whole-cell DNA extractions followed the yeast DNA miniprep procedure described previously (Ravikumar et al., 2014). Cytoplasmic plasmid extraction followed the standard whole-cell yeast DNA extraction protocol with a few modifications: (1) cells were washing in 0.9% NaCl prior to treatment with Zymolyase (US Biological); (2) 200 μg/mL proteinase K (Fisher Scientific) was supplemented during SDS treatment for degradation of TP; (3) rotation at ~10 r.p.m was used during Zymolyase treatment.
TP-DNAP1 homology analysis.
A list of 99 homologs to TP-DNAP1 (EMBL accession number: CAA25568.1) was generated via protein BLAST (Altschul et al., 1990) with default settings (Table S1). A multiple sequence alignment of TP-DNAP1 to these homologs was performed using Clustal Omega (Sievers et al., 2014) and the resulting alignment was analyzed using Jalview (Waterhouse et al., 2009).
Amino acid mutations were selected based on three criteria. First, candidate positions should be flanked on both sides by residues with sequence alignment to >75% of homologs. Second, the TP-DNAP1 amino acid at a candidate position should be represented across >25% of homologs. Third, amino acids not present in TP-DNAP1 at a candidate position should be conserved across >25% of homologs. If these criteria were met, then amino acids identified from the third criterion were introduced at the candidate position in TP-DNAP1.
Small-scale p1 fluctuation tests.
All three TP-DNAP1 libraries were screened through small-scale p1 fluctuation tests in the metastable OrthoRep strain, OR-Y24. OR-Y24 contains w.t. p1 and recombinant p1 that lacks w.t. TP-DNAP1, and instead, encodes a standardized fluorescence reporter of p1 copy number (Table S3), and a disabled version of the LEU2 selection marker (leu2 (Q180*)). As described previously (Ravikumar et al., 2014), leu2 (Q180*) contains a C→T mutation at base 538 in LEU2 at a site permissive to all single point mutants that generate missense mutations. Reversion to functional LEU2 can be detected on medium lacking leucine.
Generally, to screen TP-DNAP1 mutants, OR-Y24 strains were transformed with TP-DNAP1 plasmids and the resulting yeast strains were passaged 3-4 times at 1:100 dilutions in SC-UH to fully cure w.t. p1 (Figure S3). Cured strains were diluted 1:10,000 into selective SC media for fluctuation tests. Selective SC media used for p1 fluctuation tests lacked uracil, histidine and tryptophan, and was adjusted to pH 5.8 with NaOH (SC-UHW, pH 5.8). Absence of tryptophan and pH adjustment inhibited growth on reversion medium resulting from nonsense suppression of leu2 (Q180*). Dilutions were split into three 100 μL cultures and one 200 μL culture in 96-well trays, and cultures were grown to saturation for 2-2.5 days. Saturated 200 μL cultures were subject to a copy number measurement, as described below. The remaining three replicates were washed and resuspended in 35 μL 0.9% NaCl. 10 μL was spot plated onto solid SC medium selective for LEU2 revertants. Solid SC medium used for p1 fluctuation tests lacked uracil, histidine, tryptophan and leucine and was adjusted to pH 5.8 with NaOH (SC-UHLW, pH 5.8). Plates were incubated at 30 °C for 5-6 days, and afterwards, colony-count was determined for each spot. See Quantification and Statistical Analysis for a description of mutation rate calculations.
Prior to screening the TP-DNAP1 scanning saturation mutagenesis library, a functional purification was imposed in OR-Y24 to eliminate frame-shifted TP-DNAP1 variants, which were common due to errors in oligonucleotide synthesis. The pilot study shown in Figure S3 confirmed that sub-libraries transformed into OR-Y24 are enriched for full-length TP-DNAP1 variants after two passages in SC media lacking uracil and histidine (SC-UH). To purify the entire scanning saturation mutagenesis library, the remaining 27 TP-DNAP1 plasmid sub-libraries were individually transformed into OR-Y24, and the resulting yeast sub-libraries were passaged twice at 1:100 dilutions in SC-UH. Passaged yeast sub-libraries were individually plated on solid SC medium lacking histidine. For each sub-library, 24 colonies were propagated in small cultures of SC-UH, in order to verify that >90% of clones robustly grow under selection for p1 replication. Afterwards, purified yeast sub-libraries were plated on solid media and colonies from each were individually inoculated into small cultures of SC-UH at ~1-fold coverage of theoretical sub-library diversity. This resulted in a total of 13,625 clones. (This does not include sub-libraries 10-10, which correspond to the putative N-terminal TP of TP-DNAP1, which should not influence fidelity. These sub-libraries were cloned and purified, but omitted from the screen.) The arrayed clones were then cured of w.t. p1 and subject to small-scale p1 fluctuation tests, as described above. Then, 376 clones with the highest relative phenotypic mutation rates were subject to an additional small-scale p1 fluctuation test with six replicates. TP-DNAP1 expression vectors were isolated from 95 yeast clones with the highest relative phenotypic mutation rates and subject to Sanger sequencing. These TP-DNAP1s were characterized with large-scale p1 fluctuation tests, as described below.
Shuffling libraries were screened in a similar manner. From the first combinatorial library, 1520 yeast clones were subject to small-scale p1 fluctuation tests. 188 clones were subject to additional small-scale p1 fluctuation tests and isolated for Sanger sequencing. 46 unique variants with the highest relative phenotypic mutation rates were characterized with large-scale p1 fluctuation tests, as described below. From the second combinatorial library, 744 yeast clones were screened and 58 clones were characterized with additional small-scale p1 fluctuation tests. Four clones were extracted, subject to Sanger sequencing and characterized with large-scale p1 fluctuation tests, as described below.
Large-scale p1 fluctuation tests.
Large-scale fluctuation tests of p1-encoded leu2 (Q180*) were performed to precisely determine per-base substitution rates for individually cloned or isolated TP-DNAP1 variants. Large-scale p1 fluctuation tests are performed similarly to small-scale p1 fluctuation tests, with several modifications. First, large-scale p1 fluctuation tests were typically performed with 36-48 replicates. For highly error-prone TP-DNAP1s obtained from later rounds of screening, fewer replicates (3-16) were used, which is sufficient for similar precision (Foster et al., 2006). Second, p1 copy number was determined by the flow cytometry method, described below. Third, cell titers were measured for each fluctuation test to estimate the average number of cells per culture. Cell resuspensions were diluted and plated on solid SC-UH medium, and colony counts were determined after incubation at 30 °C for 2-3 days. Alternatively, cell resuspensions were diluted and subject to an event-count measurement via flow cytometry. Fourth, inoculums of highly error-prone TP-DNAP1s occasionally contained preexisting mutants, despite the 1:10,000 dilution, so mutant frequencies were estimated by plating precultures on solid SC-UHLW, pH 5.8 medium. Plates were incubated for 2-3 days, in parallel with cultures grown for fluctuation tests. Preculture mutant titers were counted to estimate the number of replicates in the fluctuation test expected to contain preexisting mutants (n). Revertants were counted from all replicates of the fluctuation tests, counts were sorted, and n replicates with the highest counts were omitted from calculations. See Quantification and Statistical Analysis for a description of mutation rate calculations.
p1 copy number assay.
A calibration curve was established to correlate p1 copy number, determined via quantitative PCR (qPCR), with fluorescence of p1-encoded mKate2 (Table S3). Five TP-DNAP1 variants representing a wide range of copy numbers were transformed into OR-Y24 and passaged until w.t. p1 was displaced. The five OR-Y24 strains were grown to saturation, diluted 1:10,000 to mimic p1 fluctuation tests, and grown in triplicate 100 μL cultures and duplicate 40 mL cultures. 100 μL saturated cultures were subject to fluorescence measurement of mKate2 (ex/em = 561 nm/620 nm, bandwidth = 15 nm) on a flow cytometer (Invitrogen Attune NxT). Whole-cell DNA extracts were prepared from 40 mL cultures and used as templates for qPCR measurement of p1-encoded leu2 (Q180*), as described previously (Ravikumar et al., 2014). p1-encoded LEU2 was PCR amplified with qPCR-Leu2F and qPCR-Leu2R; and genomic LEU3 was PCR amplified with qPCR-Leu3F and qPCR-Leu3R using SyBR Green (Fisher Scientific) master mix (see Key Resources Table for oligo sequences). The correlation of mKate2 fluorescence and qPCR-determined p1 copy number had a strong linear fit across p1 copy numbers ranging from 9-90, and had low background (y = 0.048x + 0.206, r2 = 0.954).
KEY RESOURCES TABLE
| REAGENT or RESOURCE | SOURCE | IDENTIFIER |
|---|---|---|
| Bacterial and Virus Strains | ||
| Escherichia coli strain TG1 | Lucigen | Catalog #: 60502 |
| Chemicals, Peptides, and Recombinant Proteins | ||
| 5-FOA | US Biological | Catalog #: F5050 |
| Canavanine | Sigma-Aldrich | Catalog #: C9758 |
| Proteinase K | Fisher Scientific | Catalog #: BP1700 |
| Pyrimethamine | Fisher Scientific | Catalog #: ICN19418025 |
| SyBR Green | Fisher Scientific | Catalog #: FERK0241 |
| Zymolyase | US Biological | Catalog #: Z1000 |
| Experimental Models: Organisms/Strains | ||
| See Table S9 for a list of all yeast strains used in this study | This work | N/A |
| Oligonucleotides | ||
| qPCR-Leu2F: GCTAATGTTTTGGCCTCTTC | IDT | N/A |
| qPCR-Leu2R: ATTTAGGTGGGTTGGGTTCT | IDT | N/A |
| qPCR-Leu3F: CAGCAACTAAGGACAAGG | IDT | N/A |
| qPCR-Leu3R: GGTCGTTAATGAGCTTCC | IDT | N/A |
| Pool of ~19,000 oligonucleotides (130-200-mers) for TP-DNAP1 site saturation mutagenesis library | Agilent Technologies | Catalog #: G5903B |
| Recombinant DNA | ||
| 819bp gene fragment encoding PfDHFR | IDT | gBlock gene fragment (http://www.idtdna.com/pages/products/genes-and-gene-fragments/gblocks-gene-fragments) |
| See Table S9 for a list of all plasmids used in this study | This work | N/A |
| Software and Algorithms | ||
| Protein BLAST | Altschul et al., 1990 | https://blast.ncbi.nlm.nih.gov/Blast.cgi?PROGRAM=blastp&PAGE_TYPE=BlastSearch&LINK_LOC=blasthome |
| Clustal Omega | Sievers et al., 2014 | https://www.ebi.ac.uk/Tools/msa/clustalo/ |
| Jalview | Waterhouse et al., 2009 | http://www.jalview.org/ |
| Mutation Surveyor | Minton et al., 2011; SoftGenetics | https://softgenetics.com/mutationSurveyor.php |
| QSVanalyzer | Carr et al., 2009 | http://dna.leeds.ac.uk/qsv/ |
| MSS Maximum Likelihood Estimator | Foster, 2006 | N/A |
| rSalvador 1.7 | Zheng, 2017 | http://eeeeeric.com/rSalvador/ |
| TIDE | Brinkman et al., 2014 | https://tide.deskgen.com/ |
| PEAR | Zhang et al., 2014 | https://sco.h-its.org/exelixis/web/software/pear/ |
To assay p1 copy number for large-scale p1 fluctuation tests, additional replicates of OR-Y24 strains were grown from the 1:10,000 dilution in triplicate and saturated cultures were subject to fluorescence measurement via flow cytometry. Fluorescence measurements were converted to copy number with the linear calibration curve.
To assay relative p1 copy number for small-scale p1 fluctuation tests, an additional 200 μL culture of OR-Y24 strains were grown from the 1:10,000 dilution. 200 μL saturated cultures were subject to an OD600 measurement and fluorescence measurement of mKate2 (ex/em = 588 nm/633 nm), using a microplate reader (TECAN Infinite M200 PRO). A linear relationship was assumed between p1 copy number and OD600-normalized mKate2 fluorescence. Copy numbers were calculated from normalization to a w.t. TP-DNAP1 control.
For a few large-scale p1 fluctuation tests, p1 copy number was assayed by the method of small-scale p1 fluctuation tests (i.e. microplate reader measurement). For these experiments, mutant TP-DNAP1 p1 copy numbers were calculated by normalization to a w.t. TP-DNAP1 control. The copy number of this control was assumed to be the average w.t. TP-DNAP1 copy number from all large-scale p1 fluctuation tests that used flow cytometry measurements.
Characterization of high activity TP-DNAP1s.
From mKate2 measurements of the 13,625 clones screened with small-scale p1 fluctuation tests, 283 clones exhibiting high fluorescence were chosen for additional characterization. TP-DNAP1 plasmids were isolated from these strains and subject to Sanger sequencing. 210 unique variants were identified and the corresponding plasmids were re-transformed into OR-Y24. Transformed strains were passaged in SC-UH until w.t. p1 was displaced, and subject to p1 copy number measurement in triplicate. Four high copy variants were directly subject to qPCR measurements for validation (unpublished results). To test the suppressor activity of the G410H mutation, which yields increased p1 copy number, this amino acid change was added to several low-activity TP-DNAP1 variants. p1 copy number was similarly assayed for these strains.
Characterization of mutational preferences.
Two additional fluctuation tests, coupled with sequencing, were used to determine mutational preferences of TP-DNAP1s, as described previously (Ravikumar et al., 2014). In one experiment, strain AR-Y302 was used for fluctuation tests. AR-Y302 contains recombinant p1 encoding leu2 (Q180*), which contains two substitutions (538C>T and 540A>G), which create an amber nonsense mutation (TAG) in LEU2. Fluctuation tests can be used to determine the frequency of reversion from leu2 (Q180*) to LEU2. Single point mutations that restore LEU2 from leu2 (Q180*) include T:A→A:T, T:A→C:G, T:A→G:C, G:C→T:A and G:C→C:G. This leaves the G:C→A:T mutation unrepresented. To measure the rate of this final mutation, we used strain AR-Y401, which contains recombinant p1 encoding ura3 (K93R). This disabled allele contains a 278A>G substitution and the only way to restore URA3 is via the G:C→A:T mutation (Ravikumar et al., 2014).
Strains of AR-Y302 containing TP-DNAP1 variants were subject to large-scale p1 fluctuation tests. p1 plasmids were extracted from 50-70 revertant colonies, each from an independent replicate of the fluctuation test. The restored LEU2 alleles were PCR amplified and subject to Sanger sequencing. To calculate individual per-base pair mutation rates, the corresponding per-base substitution rate (measured from fluctuation tests of the corresponding TP-DNAP1 in OR-Y24) was used. Per-base substitution rates calculated from reversion of leu2 (Q180*) is more specifically, the sum of the mutation rates of T:A→A:T, T:A→C:G, and T:A→G:C, weighted in proportion to the number of possible sites at which each mutation can occur and be detected. The relative preferences for these mutations, determined from Sanger sequencing, was used to calculate per-base pair mutation rates.
The G:C→A:T mutation rate is equal to the per-base mutation rate calculated from fluctuation tests of TP-DNAP1s expressed in AR-Y401. Fluctuation tests were performed and analyzed by the large-scale protocol described above. The G:C→A:T mutation rate was proportionally added to the full substitution spectra.
Genomic orthogonality measurements.
Fluctuation tests of the genomic URA3 gene were performed to determine genomic per-base substitution rates, as previously described (Ravikumar et al., 2014). See Quantification and Statistical Analysis for a description of mutation rate calculations.
Characterization of POL3 mutator strains.
To construct POL3 mutator strains, plasmids 19-25 were transformed into AR-Y432 and AR-Y445. Transformants were expanded in selective SC medium and spot plated on selective SC medium or selective SC medium supplemented with 5-FOA (1 g/L) for plasmid shuffle of plasmid 18 via URA3 counter-selection (Boeke et al., 1984).
Fluctuation tests of the genomic CAN1 gene were performed to determine genomic per-base substitution rates. To minimize propagation of POL3 mutator strains, fluctuation tests were performed directly on colonies from plasmid shuffle plates. For each strain, 48 colonies from plasmid shuffle plates were individually scraped and resuspended in 120 μL 0.9% NaCl. 10 μL from each resuspension was diluted and subject to an event counts measurement via flow cytometry. This was done to identify colonies of similar cell count, because fluctuation tests are only appropriate when final population sizes for all replicates are similar. 24 resuspensions with similar event counts were used for fluctuation tests. 90 μL from the 24 resuspensions were mixed and plated onto SC medium lacking arginine and supplemented with 10X canavanine (0.6 g/L). 10 μL from four of the 24 resuspensions was pooled, diluted and titered on solid SC medium. Plates were incubated at 30 °C. Colonies were counted from titer plates after 2-4 days and from spot plates after 3-6 days. Based on titer counts, the average number of generations that occurred during colony formation was ~15. See Quantification and Statistical Analysis for a description of mutation rate calculations.
To test the stability of mutator phenotypes, three colonies from each plasmid shuffle plate were passaged ten times at 1:100 dilutions (67 generations). A single clone from each final population was isolated and subject to CAN1 fluctuation tests. This was performed using a protocol similar to that described previously for URA3 fluctuation tests (Ravikumar et al., 2014), except cultures from CAN1 fluctuation tests were plated onto solid SC medium lacking arginine and supplemented with 10X canavanine (0.6 g/L). See Quantification and Statistical Analysis for a description of mutation rate calculations.
Characterization of p1-PfDHFR strains.
Strains GA-Y109, 149, 151 and 155 expressing PfDHFR from p1 were derived from the parent strain, GA-Y102, via plasmid shuffle. GA-Y077 was constructed from AR-Y292 by concomitant deletion of genomically encoded DFR1 and transformation of a centromeric plasmid encoding PfDHFR. Pilot studies shown in Figure S4 used strains GA-Y077, 151 and 155. The results confirmed that strains dependent on PfDHFR acquire sensitivity to pyrimethamine and evolve resistance exclusively by mutating p1-encoded PfDHFR.
PfDHFR evolution experiments.
In the large-scale experiment, GA-Y229, containing p1-encoded PfDHFR replicated by TP-DNAP1-4-2, was serially passaged for evolution of pyrimethamine resistance. To start evolution, a saturated preculture of GA-Y229 was diluted 1:100 into 90 wells of a 96-well block containing 0.5 mL of selective SC supplemented with 100 μM pyrimethamine. (The remaining 6 wells served as controls, as described below.) The block was sealed and incubated at 30 °C. OD600 was monitored every 24 hours using a microplate reader (TECAN Infinite M200 PRO). When 70/90 experimental replicates reached an OD600 above 0.7, the entire block was passaged at a 1:100 dilution. If this cutoff was reached within 72 hours of the previous dilution, then the concentration of pyrimethamine was increased for all 90 replicates. Otherwise, pyrimethamine concentration remained the same. This was repeated until pyrimethamine concentration reached 3mM, the maximum concentration we were able to dissolve in SC media. The drug regimen proceeded from 100 μM to 500 μM, 1 mM, 2 mM, 2.5 mM and finally 3 mM. This regimen was guided by pilot experiments and designed to maintain strong selection throughout the experiment. Cultures were maintained at 100 μM for one passage, 500 μM for the second passage, 1mM for the third passage, 2 mM for passages 4-5, 2.5 mM for passages 6-7, and 3 mM for passages 8-13. During passage 4, the seal covering the 96-well block was punctured, so the passage was repeated from the passage 3 cultures stored at 4 °C. 50 μL volumes from each passage were stored with 25% glycerol at −80 °C.
Six randomly chosen control wells were filled with selective SC media lacking pyrimethamine, and two of these were seeded with GA-Y229. Media conditions in the control wells were kept the same throughout. No cross-contamination was detected and GA-Y229 grew robustly throughout.
After 70/90 replicates from passage 13 reached an OD600 of 0.7, the entire block was subject to whole-cell yeast DNA extraction. Bulk populations of p1 plasmids served as templates for PCR amplification of PfDHFR, and PCR amplicons were subject to Sanger sequencing. Mixed trace files were automatically annotated using Mutation Surveyor (SoftGenetics; Minton et al., 2011) and called mutations were manually verified. For focused analysis of the C50R, D54N, Y57H, C59R, C59Y and S108N mutations, trace file peak heights at bases 148, 160, 169, 175 and 323 in PfDHFR were converted to frequencies using QSVanalyzer (Carr et al., 2009). Insertion frequencies at base 737 in PfDHFR were calculated from trace files using TIDE (Brinkman et al., 2014). See Quantification and Statistical Analysis for details.
To track the dynamics of PfDHFR evolution, mutational frequencies were tracked across all 13 passages of eight representative replicates. Cultures were inoculated from glycerol stocks into the same media condition they were last grown in. PfDHFR sequencing was performed as described for passage 13 of the large-scale evolution experiment. Mutation frequencies were calculated using QSVanalyzer (Carr et al., 2009) and TIDE (Brinkman et al., 2014). See Quantification and Statistical Analysis for details. (For mutations that did not fully fix in any of the sequenced populations, a homozygous mutant allele was constructed by PCR and the resulting amplicon was similarly subject to Sanger sequencing.)
For evolution of PfDHFR encoding a synonymous initial mutation at S108, strain AR-Y470 was used (Table S9). Strain AR-Y470 was constructed identically to the OrthoRep strain used for large-scale PfDHFR evolution (GA-Y229), with the exception that AR-Y470 was made to encode a mutated version of PfDHFR wherein codon S108 is changed from AGA to TCA. To evolve pyrimethamine resistance, AR-Y470 was serially passaged in a similar manner to the large-scale experiment. First, a saturated preculture of AR-Y470 was diluted 1:100 into 12 wells of a 96-well block containing 0.5 mL of selective SC supplemented with 100 μM pyrimethamine. The block was sealed and incubated at 30 °C. OD600 was monitored every 24 hours using a microplate reader (TECAN Infinite M200 PRO). When 10/12 experimental replicates reached an OD600 above 0.7, the entire block was passaged at a 1:100 dilution. If this cutoff was reached within 72 hours of the previous dilution, then the concentration of pyrimethamine was increased for all 12 replicates. Otherwise, pyrimethamine concentration remained the same. This was repeated until pyrimethamine concentration reached 3mM, the maximum concentration we were able to dissolve in SC media. The drug regimen proceeded from 100 μM to 500 μM, 1 mM, 2 mM, 2.5 mM and finally 3 mM. Cultures were maintained at 100 μM for one passage, 500 μM for passages 2-3, 1mM for the fourth passage, 2 mM for the fifth passage, 2.5 mM for the sixth passage, and 3 mM for passages 7-11. 50 μL volumes from each passage were stored with 25% glycerol at −80 °C.
After 10/12 replicates from passage 11 reached an OD600 of 0.7, the entire block was subject to whole-cell yeast DNA extraction. Bulk populations of p1 plasmids served as templates for PCR amplification of PfDHFR, and PCR amplicons were subject to Sanger sequencing. Mixed trace files were automatically annotated using Mutation Surveyor (SoftGenetics; Minton et al., 2011) and called mutations were manually verified.
PfDHFR MIC assay.
The MIC of pyrimethamine was measured for 50 PfDHFR alleles in the yeast strain, YH5 (Wooden et al., 1997). Plasmids 23-70 in Table S9, are yeast centromeric plasmids that express PfDHFR variants from the weak DFR1 promoter. Plasmids 23-70 were transformed into YH5 (Wooden et al., 1997) and transformations were plated on selective SC medium supplemented with 100 μg/mL dTMP. After 5-6 days of growth at 30 °C, three transformants representing each allele were expanded in selective SC media supplemented with 100 μg/mL dTMP. Cultures were grown for 4 days at 30 °C. Saturated cultures were washed to remove any residual dTMP. Resuspensions were diluted 1:100 into 50 μL volumes of 14 media conditions: YPD supplemented with 100 μg/mL dTMP, YPD, and YPD supplemented with 50 nM, 100 nM, 500 nM, 5 μM, 30 μM, 100 μM, 300 μM, 600 μM, 1 mM, 1.25 mM, 1.5 mM or 2 mM pyrimethamine. Inoculums were transferred into 384-well microplate reader trays, which were then sealed thoroughly to prevent evaporation and grown at 30 °C. Trays were unsealed, subject to OD600 measurement using a microplate reader (TECAN Infinite M200 PRO), resealed, and returned to the 30 °C shaker at 3-6 hour intervals for 7 days. See Quantification and Statistical Analysis for details of MIC analysis.
p1 copy number control.
To titrate p1 copy number, the catalytically inactive TP-DNAP1 (D641A) variant was placed under the control of the repressible MET3 promoter in AR-Y062, which expresses w.t. TP-DNAP1 and the mKate2 reporter from p1. Strains were grown in SC media containing methionine, ranging in concentration from 0 μM to 450 μM, for 2 days at 30 °C. Afterwards, mKate2 fluorescence was measured, as described above, to assay p1 copy number.
QUANTIFICATION AND STATISTICAL ANALYSIS
Small-scale p1 fluctuation tests.
Small-scale fluctuation data were analyzed by the MSS maximum-likelihood estimator method (Foster et al., 2006). Measuring cell titers was infeasible due to the large number of strains, so the average number of cells per culture was assumed to remain constant. Relative phenotypic mutation rates were calculated by normalization to p1 copy number. Information regarding statistical replication is fully described in the Methods Details.
Large-scale p1 fluctuation tests.
To calculate per-base substitution rates, fluctuation data were analyzed by the maximum likelihood method, implemented using newton.LD.plating in rSalvador 1.7 (Zheng, 2017). Phenotypic mutation rates were calculated by normalizing to the average number of cells per culture. Phenotypic mutation rates were divided by the measured p1 copy number and by the number of ways leu2 (Q180*) can revert to LEU2 (2.33 for the ochre codon) to yield per-base substitution rates. 95% confidence intervals were similarly scaled by these factors. All data related to large-scale p1 fluctuation tests are fully described in Table S2. Information regarding statistical replication is fully described in the Methods Details.
Genomic orthogonality measurements.
Fluctuation data were analyzed by the maximum likelihood method, as described for large-scale p1 fluctuation tests. Phenotypic mutation rates were divided by the target size for loss of function of URA3 via base pair substitution (Lang et al., 2008), to yield per-base substitution rates. 95% confidence intervals were similarly scaled by these factors. All data related to large-scale p1 fluctuation tests are fully described in Table 1. Information regarding statistical replication is fully described in the Methods Details.
Characteriation of POL3 mutator strains.
Fluctuation data were analyzed as described above for URA3 fluctuation data, but with mutation frequency parameters for CAN1 (Lang et al., 2008). The Fenton approximation (Fenton, 1960) was used to calculate the predicted rate of the extinct mutator strain. All data related to large-scale p1 fluctuation tests are fully described in Figure 2. Information regarding statistical replication is fully described in the Methods Details.
Quantification of PfDHFR mutation frequencies.
For focused analysis of the C50R, D54N, Y57H, C59R, C59Y and S108N mutations, trace file peak heights at bases 148, 160, 169, 175 and 323 in PfDHFR were converted to frequencies using QSVanalyzer (Carr et al., 2009). The PfDHFR trace file of GA-Y229 served as the template of the homozygous w.t. base, at all five positions. Insertion frequencies at base 737 in PfDHFR were calculated from trace files using TIDE (default settings; Brinkman et al., 2014). Four PfDHFR mutations (Y70C, V125V, V146A, and V195A) were present at high frequency in GA-Y229 prior to pyrimethamine selection, after this strain was bottlenecked through a single cell during plasmid shuffle. These mutations were commonly observed as hitchhikers in evolved cultures, and were excluded from analysis.
Mutation frequencies calculated via QSVanalyzer (Carr et al., 2009) were compared against frequencies calculated from deep sequencing. For deep sequencing analysis, PfDHFR was PCR amplified from DNA extract of two replicate populations. PfDHFR was amplified as two partially overlapping fragments. Amplicons were sent to Quintara Biosciences for library preparation and sequencing. At the sequencing vendor, the amplicons were additionally amplified to incorporate the TruSeq HT i5 and i7 adapters. The amplified libraries were sequenced on an Illumina MiSeq with the 500-cycle v2 reagent kit (Cat #: MS-102-2003). Paired-end reads were merged using PEAR (Zhang et al., 2014). Merged reads containing insertions or deletions were removed from analysis. Mutation frequencies match closely with results obtained from QSVanalyzer (Carr et al., 2009). From one of the replicates, mutation frequencies calculated for the C50R, D54N, Y57H, C59R, C59Y and S108N mutations by QSVanalyzer (Carr et al., 2009) are 2.3%, 60.5%, 66.3%, 95.5%, <1%, and 33.2%, respectively. In comparison, the corresponding frequencies from deep sequencing analysis are <0.1%, 57.1%, 54.7%, 97.3%, <0.1%, and 39.5%, respectively. From the other replicate, mutation frequencies calculated for the C50R, D54N, Y57H, C59R, C59Y and S108N mutations by QSVanalyzer (Carr et al., 2009) are 5.9%, 35.8%, 51.7%, 97.4%, <1%, and 98.6%, respectively. In comparison, the corresponding frequencies from deep sequencing analysis are 2.5%, 34.1%, 52.9%, 99.6%, <0.1%, and 99.9%, respectively.
PfDHFR MIC analysis.
MIC was defined as log10 of the lowest pyrimethamine concentration (in M) at which OD600 remained below 0.25 after 7 days of growth. MIC was individually calculated for three clones of the 50 PfDHFR alleles. In total, 3 clones did not grow robustly in YPD supplemented with dTMP and were omitted from subsequent analysis. Of the 147 clones included in analysis, 6 clones did not exceed the MIC threshold at a low pyrimethamine concentration, but grew robustly at several higher concentrations. In these cases, we attribute failed growth to experimental error, and determined MIC as if growth were sustained in the aberrant condition.
Supplementary Material
Figure S1. An expanded view of OrthoRep, Related to Figure 1
The specific basis for OrthoRep is the p1/2 (also known as the pGKL1/2) plasmid system. p1 and p2 are linear, high-copy, double-stranded DNA plasmids that propagate autonomously in the cytoplasm of S. cerevisiae. TP-DNAP1 expressed from a nuclear plasmid replicates p1. TP-DNAP2 expressed from p2 replicates p2. TP-DNAP1 and TP-DNAP2 use terminal proteins (TPs) covalently attached at the 5’ ends of p1 and p2, respectively, as replication origins for TP-primed replication. All of the accessory components required for replication and transcription are encoded on p2. TP-DNAP1 does not replicate p2 and TP-DNAP2 does not replicate p1 (Arzumanyan et al., 2018), meaning that the high error rate of p1 replication does not affect p2-encoded genes and the low error-rate of p2 replication does not compete with p1 mutagenesis. ORFs with unknown function are indicated. TRF, Terminal Recognition Factor.
Figure S2. Design of TP-DNAP1 mutants by homology analysis and by construction of a scanning saturation mutagenesis library, Related to Figure 1
(A) The architecture of TP-DNAP1 consists of a fusion between the terminal protein, a 3’-5’ proofreading exonuclease domain, and a DNA polymerization domain. Motifs responsible for fidelity in the exonuclease and proofreading domains are highlighted. A multiple sequence alignment between TP-DNAP1 and five closely related family B DNAPs is shown. In the larger homology study described in the main text, multiple sequence alignment with 99 closely related DNAPs (Table S1) was used to identify positions that exhibit amino acid (a.a.) variation and are flanked by conserved residues (STAR Methods). Two candidate positions identified from this study are denoted with arrows. Amino acid variations found at these positions were transplanted into the corresponding location in TP-DNAP1. A total of 87 such TP-DNAP1 mutants were generated and screened in OR-Y24. Twenty-four of the TP-DNAP1 variants displayed elevated mutation rates, but almost 60% of these suffered from low activity, judging by the copy number of p1 (Table S2).
(B) A pool of ~19,000 oligonucleotides ranging in length from 130-200 nt were designed as 30 sets, each encoding a 20-50 amino acid variable region flanked by ~25 bp constant regions. Variable regions mutate each w.t. codon to 19 codons, representing all single amino acid substitutions. Each oligo set was PCR amplified and assembled with corresponding TP-DNAP1 plasmid backbones, yielding 30 full-length TP-DNAP1 plasmid sub-libraries.
(C) The genetic code used for mutagenesis, chosen to maximize the codon adaptation index in S. cerevisiae.
(D) Lengths of variable regions from each oligo set. Oligo sets 3 and 4, which were synthesized separately from the rest, have overlapping variable regions. Oligo sets 1-10 correspond to the putative TP portion of TP-DNAP1.
Figure S3. Functional purification of TP-DNAP1 sub-libraries, Related to Figure 1
(A) A conceptual illustration of OR-Y24, which serves as parent strain for screening TP-DNAP1 variants. OR-Y24 contains a mixture of w.t. p1 and recombinant p1 encoding mKate2, URA3, and leu2(Q180*). mKate2 serves as a reporter of p1 copy number (Table S3) and leu2(Q180*) serves as a reporter of p1 substitution mutation rates. TP-DNAP1 mutants are encoded on a CEN6/ARS4 plasmid and transformed into OR-Y24. If the resulting strain is subject to selection for URA3 in media lacking uracil, recombinant p1 increases in copy number and w.t. p1 decreases in copy number, because they compete for the same source of TP-DNAP1 (Ravikumar et al., 2014). After several passages in media lacking uracil, w.t. p1 is fully cured, and then the strain is used for screening. If, however, an inactive TP-DNAP1 mutant is transformed into OR-Y24, then the resulting strain is driven to extinction under selection for URA3. This is because selection for recombinant p1 causes w.t. p1 to decrease in copy number, which decreases the amount of functional TP-DNAP1 available. This initiates a feedback loop that drops the copy number of both plasmids, leading to extinction (Ravikumar et al., 2014). (Functional TP-DNAP1 variants expressed in trans from the nuclear CEN6/ARS4 plasmid can replicate recombinant p1 at a constant level and thereby rescue growth.)
(B) Due to a high fraction of non-functional frame-shifted variants present in the scanning saturation mutagenesis library of TP-DNAP1, OR-Y24 was used to functionally purify sub-libraries prior to screening. Two representative TP-DNAP1 sub-libraries, 14 and 21, were subject to purification. OR-Y24 cells transformed with sub-libraries 14 or 21 were split and inoculated into outgrowth conditions that were selective only for plasmid uptake (SC-H) or for plasmid uptake and URA3 expression (SC-UH). Selection in SC-UH was maintained for four 1:100 serial passages. After each passage, TP-DNAP1 plasmids were isolated from individual clones and subject to Sanger sequencing. Data shown are the percentage of (n) clones encoding full-length TP-DNAP1 variants.
Figure S4. Pilot studies of p1-PfDHFR evolution, Related to Figures 3-5
(A) Yeast strains dependent on p1-encoded PfDHFR acquired sensitivity to pyrimethamine (pyr). PfDHFR was expressed from p1 in strains that retain or lack DFR1, which encodes yeast’s endogenous DHFR. Strains were grown in selective SC media and plated on solid media with or without 500 μM pyrimethamine. Plates were incubated at 30 °C for 5 days prior to imaging.
(B) Pyrimethamine resistant clones arise in small culture volumes. A yeast strain that encodes PfDHFR on a nuclear plasmid and two OrthoRep strains that encode PfDHFR on p1 at for rapid mutation were grown to saturation in selective SC media and plated on solid media supplemented with pyrimethamine. After 5-6 days of growth at 30 °C, resistant colonies were counted. p1-encoded PfDHFRs carried resistance mutations in all 30 resistant clones sequenced.
(C) OrthoRep strains evolved pyrimethamine resistance in batch culture by rapidly mutating p1-encoded PfDHFR. OrthoRep strains with varying p1 mutation rates were serially passaged in 25 mL cultures, at 1:25 or 1:250 dilutions, in selective SC media initially supplemented with 500 μM pyrimethamine. OD600 was monitored daily and saturated cultures were passaged into gradually increasing drug concentrations as cultures adapted. After strains evolved resistance to 2 mM pyrimethamine, bulk populations of p1 plasmids were extracted and subject to Sanger sequencing. The OrthoRep strain containing w.t. TP-DNAP1 stopped growing in the 500 μM pyrimethamine condition when passaged at 1:250 dilutions.
Figure S5. Dynamics of PfDHFR evolution in six representative populations, Related to Figures 3-5
(A)-(F) Mutation frequencies tracked across all 13 passages from lines 52, 64, 74, 62, 70, and 73 shown in Figure 3, respectively. Populations from each passage were revived from glycerol stocks in the same media condition that they were initially grown in. Mutation frequencies were calculated from Sanger sequencing of revived populations. See STAR Methods for SNP analysis details.
Table S2. All TP-DNAP1 variants characterized by fluctuation tests in this study, Related to Figure 1 and Table 1
All independent measurements of mutation rate are shown, with corresponding 95% confidence intervals and the number of replicates performed for each fluctuation test listed. The number of replicates assayed for determination of p1 copy number is shown as (n).
Table S4. 210 TP-DNAP1 variants that replicate p1 at a higher copy number than w.t. TP-DNAP1, Related to Figure 1
From p1 copy number measurements of 13,625 yeast clones screened in small-scale p1 fluctuation tests, 210 unique variants exhibited elevated copy numbers. Variants were retransformed into OR-Y24 and subject to additional p1 copy number measurements for verification. Data shown are fold-change mean and standard deviation (calculated using equation (5).2 of Frishman, 1975) of biological triplicate measurements of each mutant and 15 measurements of w.t. TP-DNAP1. High activity of four TP-DNAP1 variants was independently validated with qPCR measurements of p1 (unpublished results).
Table S9. List of plasmids and parent yeast strains used in this study, Related to Figures 1-7
Plasmids are listed in entries 1-79 and parent yeast strains are listed in entries 80-114. Plasmids encoding TP-DNAP1 variants listed in Tables S2, S4 and S5 are not included. These were all derived from plasmid 2 (described below). Parent strains do not include derivatives of OR-Y24 containing TP-DNAP1 variants, and derivatives of AR-Y432 and AR-Y435 containing POL3 variants.
Highlights.
OrthoRep: a system for scalable, continuous evolution of user-defined genes in vivo
OrthoRep mutates genes of interest ~100,000-fold faster than the host genome
OrthoRep mutation rates exceed genomic error thresholds
Evolution of drug-resistant malarial DHFRs repeated 90 times
Acknowledgements
We thank members of our group, especially T. Loveless and Z. Zhong for helpful discussions and suggestions. We thank J. Mills for insights and helpful discussions on PfDHFR mutants. We thank S. Ahrar, J. Martell, H. Rishi, and M. Shapiro for valuable comments on the manuscript. This research was funded by the Defense Advanced Research Projects Agency (HR0011-15-2-0031), the National Institutes of Health (1DP2GM119163-01), the Dupont Young Professor Award, the Sloan Research Fellowship, and startup funds from UC Irvine.
Footnotes
Declaration of interests
C.C.L. and A.R. have filed a provisional application with the US Patent and Trademark Office on this work.
Publisher's Disclaimer: This is a PDF file of an unedited manuscript that has been accepted for publication. As a service to our customers we are providing this early version of the manuscript. The manuscript will undergo copyediting, typesetting, and review of the resulting proof before it is published in its final citable form. Please note that during the production process errors may be discovered which could affect the content, and all legal disclaimers that apply to the journal pertain.
References
- Altschul SF, Gish W, Miller W, Myers EW, and Lipman DJ (1990). Basic local alignment search tool. J. Mol. Biol 215, 403–410. [DOI] [PubMed] [Google Scholar]
- Arzumanyan GA, Gabriel KN, Ravikumar A, Javanpour AA, and Liu CC (2018). Mutually orthogonal DNA replication systems in vivo. ACS Synth. Biol 7, 1722–1729. [DOI] [PMC free article] [PubMed] [Google Scholar]
- Badran AH, and Liu DR (2015). Development of potent in vivo mutagenesis plasmids with broad mutational spectra. Nat. Commun 6, 8425. [DOI] [PMC free article] [PubMed] [Google Scholar]
- Barbieri EM, Muir P, Akhuetie-Oni BO, Yellman CM, Isaacs, and Isaacs FJ (2017). Precise editing at DNA replication forks enables multiplex genome engineering in eukaryotes. Cell 171, 1453–1467. [DOI] [PMC free article] [PubMed] [Google Scholar]
- Bebenek A, Dressman HK, Carver GT, Ng S, Petrov V, Yang G, Konigsberg WH, Karam JD, and Drake JW (2001). Interacting fidelity defects in the replicative DNA polymerase of bacteriophage RB69. J. Biol. Chem 276, 10387–10397. [DOI] [PubMed] [Google Scholar]
- Biebricher CK, and Eigen M (2006). What Is a Quasispecies? In Quasispecies: Concept and Implications for Virology, Domingo E, ed. (Springer; ), pp. 1–31. [Google Scholar]
- Boder ET, and Wittrup KD (1997). Yeast surface display for screening combinatorial polypeptide libraries. Nat. Biotechnol 15, 553–557. [DOI] [PubMed] [Google Scholar]
- Boeke JD, La Croute F, and Fink GR (1984). A positive selection for mutants lacking orotidine-5’-phosphate decarboxylase activity in yeast: 5-fluoro-orotic acid resistance. Mol. Gen. Genet 197, 345–346. [DOI] [PubMed] [Google Scholar]
- Brinkman EK, Chen T, Amendola M, and van Steensel B (2014). Easy quantitative assessment of genome editing by sequence trace decomposition. Nucleic Acids Res 42, e168. [DOI] [PMC free article] [PubMed] [Google Scholar]
- Bull JJ, Sanjuan R, and Wilke CO (2007). Theory of lethal mutagenesis for viruses. J. Virol 81, 2930–2939. [DOI] [PMC free article] [PubMed] [Google Scholar]
- Camps M, Naukkarinen J, Johnson BP, and Loeb LA (2003). Targeted gene evolution in Escherichia coli using a highly error-prone DNA polymerase I. Proc. Natl. Acad. Sci. USA 100, 9727–9732. [DOI] [PMC free article] [PubMed] [Google Scholar]
- Carr IM, Robinson JI, Dimitriou R, Markham AF, Morgan AW, and Bonthron DT (2009). Inferring relative proportions of DNA variants from sequencing electropherograms. Bioinformatics 25, 3244–3250. [DOI] [PubMed] [Google Scholar]
- Chusacultanachai S, Thiensathit P, Tarnchompoo B, Sirawaraporn W, and Yuthavong Y (2002). Novel antifolate resistant mutations of Plasmodium falciparum dihydrofolate reductase selected in Escherichia coli. Mol. Biochem. Parasit 120, 61–72. [DOI] [PubMed] [Google Scholar]
- Crook N, Abatemarco J, Sun J, Wagner JM, Schmitz A, and Alper HS (2016). In vivo continuous evolution of genes and pathways in yeast. Nat. Commun 7, 13051. [DOI] [PMC free article] [PubMed] [Google Scholar]
- Davis AM, Plowright AT, and Valeur E (2017). Directing evolution: the next revolution in drug discovery? Nat. Rev. Drug Discov 16, 681–698. [DOI] [PubMed] [Google Scholar]
- Desai MM, Fisher DS, and Murray AW (2007). The speed of evolution and maintenance of variation in asexual populations. Curr. Biol 17, 385–394. [DOI] [PMC free article] [PubMed] [Google Scholar]
- DiCarlo JE, Norville JE, Mali P, Rios X, Aach J, and Church GM (2013). Genome engineering in Saccharomyces cerevisiae using CRISPR-Cas systems. Nucleic Acids Res 41, 4336–4343. [DOI] [PMC free article] [PubMed] [Google Scholar]
- Drake JW (1991). A constant rate of spontaneous mutation in DNA-based microbes. Proc. Natl. Acad. Sci. USA 88, 7160–7164. [DOI] [PMC free article] [PubMed] [Google Scholar]
- Ellefson JW, Meyer AJ, Hughes RA, Cannon JR, Brodbelt JS, and Ellington AD (2014). Directed evolution of genetic parts and circuits by compartmentalized partnered replication. Nat. Biotechnol, 32, 97–101. [DOI] [PubMed] [Google Scholar]
- Esvelt KM, Carlson JC, and Liu DR (2011). A system for the continuous directed evolution of biomolecules. Nature 472, 499–503. [DOI] [PMC free article] [PubMed] [Google Scholar]
- Fabret C, Poncet S, Danielsen S, Borchert TV, Ehrlich SD, and Janniere L (2000). Efficient gene targeted random mutagenesis in genetically stable Escherichia coli strains. Nucleic Acids Res 28, e95. [DOI] [PMC free article] [PubMed] [Google Scholar]
- Fenton L (1960). The Sum of Lognormal Probability Distributions in Scatter Transmission Systems. IEEE T. Commun. Syst 8, 57–67. [Google Scholar]
- Fields S, and Song O (1989). A novel genetic system to detect protein-protein interactions. Nature 340, 245–246. [DOI] [PubMed] [Google Scholar]
- Finney-Manchester SP, and Maheshri N (2013). Harnessing mutagenic homologous recombination for targeted mutagenesis in vivo by TaGTEAM. Nucleic Acids Res 41, e99. [DOI] [PMC free article] [PubMed] [Google Scholar]
- Foster PL (2006). Methods for determining spontaneous mutation rates. Method. Enzymol 409, 195–213. [DOI] [PMC free article] [PubMed] [Google Scholar]
- Frishman F (1975). On the Arithmetic Means and Variances of Products and Ratios of Random Variables In A Modern Course on Statistical Distributions in Scientific Work, Patil GP, Kotz S, Ord JK, eds. (Springer; ), pp. 401–406. [Google Scholar]
- Gibson DG, Young L, Chuang R, Venter JC, Hutchison CA III, and Smith HO (2009). Enzymatic assembly of DNA molecules up to several hundred kilobases. Nat. Methods 6, 343–345. [DOI] [PubMed] [Google Scholar]
- Gunge N, and Sakaguchi K (1981). Intergeneric transfer of deoxyribonucleic acid killer plasmids, pGKLl and pGKL2, from Kluyveromyces lactis into Saccharomyces cerevisiae by cell fusion. J. Bacteriol 147, 155–160. [DOI] [PMC free article] [PubMed] [Google Scholar]
- Halperin SO, Tou CJ, Wong EB, Modavi C, Schaffer DV, and Dueber JE (2018). CRISPR-guided DNA polymerases enable diversification of all nucleotides in a tunable window. Nature 560, 248–252. [DOI] [PubMed] [Google Scholar]
- Hankins EG, Warhurst DC, and Sibley CH (2001). Novel alleles of the Plasmodium falciparum dhfr highly resistant to pyrimethamine and chlorcycloguanil, but not WR99210. Mol. Biochem. Parasit 117, 91–102. [DOI] [PubMed] [Google Scholar]
- Hegreness M, Shoresh N, Damian D, Hartl D, and Kishony R (2008). Accelerated evolution of resistance in multidrug environments. Proc. Natl. Acad. Sci. USA 105, 13977–13981. [DOI] [PMC free article] [PubMed] [Google Scholar]
- Herr AJ, Ogawa M, Lawrence NA, Williams LN, Eggington JM, Singh M, Smith RA, and Preston BD (2011). Mutator suppression and escape from replication error–induced extinction in yeast. PLoS Genet 7, e1002282. [DOI] [PMC free article] [PubMed] [Google Scholar]
- Hess GT, Freśard L, Han K, Lee CH, Li A, Cimprich KA, Montgomery SB, and Bassik MC (2016). Directed evolution using dCas9-targeted somatic hypermutation in mammalian cells. Nat. Methods 13, 1036–1042. [DOI] [PMC free article] [PubMed] [Google Scholar]
- Jakočiūnas T, Pedersen LE, Lis AV, Jensen MK, and Keasling JD (2018). CasPER, a method for directed evolution in genomic contexts using mutagenesis and CRISPR/Cas9. Metab. Eng 48, 288–296. [DOI] [PubMed] [Google Scholar]
- Japrung D, Leartsakulpanich U, Chusacultanachai S, and Yuthavong Y (2007). Conflicting requirements of Plasmodium falciparum dihydrofolate reductase mutations conferring resistance to pyrimethamine-WR99210 combination. Antimicrob. Agents Ch 51, 4356–4360. [DOI] [PMC free article] [PubMed] [Google Scholar]
- Joyce CM, and Steitz TA (1994). Function and structure relationships in DNA polymerases. Annu. Rev. Biochem 63, 777–822. [DOI] [PubMed] [Google Scholar]
- Kachroo AH, Laurent JM, Yellman CM, Meyer AG, Wilke CO, and Marcotte EM (2015). Systematic humanization of yeast genes reveals conserved functions and genetic modularity. Science 348, 921–925. [DOI] [PMC free article] [PubMed] [Google Scholar]
- Kim S, Lieberman TD, and Kishony R (2014). Alternating antibiotic treatments constrain evolutionary paths to multidrug resistance. Proc. Natl. Acad. Sci. USA 111, 14494–14499. [DOI] [PMC free article] [PubMed] [Google Scholar]
- Kryazhimskiy S, Rice DP, and Desai MM (2012). Population subdivision and adaptation in asexual populations of Saccharomyces cerevisiae. Evolution 66, 1931–1941. [DOI] [PubMed] [Google Scholar]
- Kryazhimskiy S, Rice DP, Jerison ER, and Desai MM (2014). Global epistasis makes adaptation predictable despite sequence-level stochasticity. Science 344, 1519–1522. [DOI] [PMC free article] [PubMed] [Google Scholar]
- Lang GI, Botstein D, and Desai MM (2011). Genetic variation and the fate of beneficial mutations in asexual populations. Genetics 188, 647–661. [DOI] [PMC free article] [PubMed] [Google Scholar]
- Lang GI, and Murray AW (2008). Estimating the per-base-pair mutation rate in the yeast Saccharomyces cerevisiae. Genetics 178, 67–82. [DOI] [PMC free article] [PubMed] [Google Scholar]
- Loeb LA, Essigmann JM, Kazazi F, Zhang J, Rose KD, and Mullins JI (1999). Lethal mutagenesis of HIV with mutagenic nucleoside analogs. Proc. Natl. Acad. Sci. USA 96, 1492–1497. [DOI] [PMC free article] [PubMed] [Google Scholar]
- Lozovsky ER, Chookajorn T, Brown KM, Imwong M, Shaw PJ, Kamchonwongpaisan S, Neafsey DE, Weinreich DM, and Hartl DL (2009). Stepwise acquisition of pyrimethamine resistance in the malaria parasite. Proc. Natl. Acad. Sci. USA 106, 12025–12030. [DOI] [PMC free article] [PubMed] [Google Scholar]
- Ma Y, Zhang J, Yin W, Zhang Z, Song Y, and Chang X (2016). Targeted AID-mediated mutagenesis (TAM) enables efficient genomic diversification in mammalian cells. Nat. Methods 13, 1029–1035. [DOI] [PubMed] [Google Scholar]
- McMahon C, Baier AS, Pascolutti R, Wegrecki M, Zheng S, Ong JX, Erlandson SC, Hilger D, Rasmussen SGF, Ring AM, Manglik A, and Kruse AC (2018). Yeast surface display platform for rapid discovery of conformationally selective nanobodies. Nat. Struct. Mol. Biol 25, 289–296. [DOI] [PMC free article] [PubMed] [Google Scholar]
- Minton JAL, Flanagan SE, and Ellard S (2011). Mutation Surveyor: Software for DNA Sequence Analysis In PCR Mutation Detection Protocols, Theophilus BDM and Rapley R, eds. (Humana Press; ), pp. 143–153. [DOI] [PubMed] [Google Scholar]
- Moore CL, Papa LJ III, and Shoulders MD (2018). A processive protein chimera introduces mutations across defined DNA regions in vivo. J. Am. Chem. Soc 140, 11560–11564. [DOI] [PMC free article] [PubMed] [Google Scholar]
- Nowak M, and Schuster P (1989). Error thresholds of replication in finite populations mutation frequencies and the onset of Muller’s ratchet. J. Theor. Biol 137, 375–395. [DOI] [PubMed] [Google Scholar]
- Packer MS, and Liu DR (2015). Methods for the directed evolution of proteins. Nat. Rev. Genet 16, 379–394. [DOI] [PubMed] [Google Scholar]
- Ravikumar A, Arrieta A, and Liu CC (2014). An orthogonal DNA replication system in yeast. Nat. Chem. Biol 10, 175–177. [DOI] [PubMed] [Google Scholar]
- Ryan OW, Poddar S, and Cate JHD (2016). CRISPR–Cas9 genome engineering in Saccharomyces cerevisiae cells. Cold Spring Harbor Protocols 2016, pdb.prot086827. [DOI] [PubMed] [Google Scholar]
- Salverda MLM, Dellus E, Gorter FA, Debets AJM, van der Oost J, Hoekstra RF, Tawfik DS, and de Visser JAGM (2011). Initial mutations direct alternative pathways of protein evolution. PLoS Genet 7, e1001321. [DOI] [PMC free article] [PubMed] [Google Scholar]
- Salverda MLM, Koomen J, Koopmanschap B, Zwart MP, and de Visser JAGM (2017). Adaptive benefits from small mutation supplies in an antibiotic resistance enzyme. Proc. Natl. Acad. Sci. USA 114, 12773–12778. [DOI] [PMC free article] [PubMed] [Google Scholar]
- Sievers F, Wilm A, Dineen D, Gibson TJ, Karplus K, Li W, Lopez R, McWilliam H, Remmert M, Söding J, et al. (2014). Fast, scalable generation of high-quality protein multiple sequence alignments using Clustal Omega. Mol. Syst. Biol 7, 539–539. [DOI] [PMC free article] [PubMed] [Google Scholar]
- Sirawaraporn W, Sathitkul T, Sirawaraporn R, Yuthavong Y, and Santi DV Antifolate-resistant mutants of Plasmodium falciparum dihydrofolate reductase. (1997). Proc. Natl. Acad. Sci. USA 94, 1124–1129. [DOI] [PMC free article] [PubMed] [Google Scholar]
- Tanaka M, Gu HM, Bzik DJ, Li WB, and Inselburg J (1990). Mutant dihydrofolate reductase-thymidylate synthase genes in pyrimethamine-resistant Plasmodium falciparum with polymorphic chromosome duplications. Mol. Biochem. Parasit 42, 83–91. [DOI] [PubMed] [Google Scholar]
- Tenaillon O, Rodríguez-Verdugo A, Gaut RL, McDonald P, Bennett AF, Long AD, and Gaut BS (2012). The molecular diversity of adaptive convergence. Science 335, 457–461. [DOI] [PubMed] [Google Scholar]
- Truong DM, and Boeke JD (2018). Resetting the yeast epigenome with human nucleosomes. Cell 171, 1508–1519. [DOI] [PMC free article] [PubMed] [Google Scholar]
- Turner NJ (2009). Directed evolution drives the next generation of biocatalysts. Nat. Chem. Biol 5, 567–573. [DOI] [PubMed] [Google Scholar]
- Wang HH, Isaacs FJ, Carr PA, Sun ZZ, Xu G, Forest CR, and Church GM (2009). Programming cells by multiplex genome engineering and accelerated evolution. Nature 460, 894–898. [DOI] [PMC free article] [PubMed] [Google Scholar]
- Waterhouse AM, Procter JB, Martin DMA, Clamp M, and Barton GJ (2009). Jalview Version 2—a multiple sequence alignment editor and analysis workbench. Bioinformatics 25, 1189–1191. [DOI] [PMC free article] [PubMed] [Google Scholar]
- Wilke CO, Wang JL, Ofria C, Lenski RE, and Adami C (2001). Evolution of digital organisms at high mutation rates leads to survival of the flattest. Nature 412, 331–333. [DOI] [PubMed] [Google Scholar]
- Wong BG, Mancuso CP, Kiriakov S, Bashor CJ, and Khalil AS (2018). Precise, automated control of conditions for high-throughput growth of yeast and bacteria with eVOLVER. Nat. Biotechnol. 36, 614–623. [DOI] [PMC free article] [PubMed] [Google Scholar]
- Wooden JM, Hartwell LH, Vasquez B, and Sibley CH (1997). Analysis in yeast of antimalarial drugs that target the dihydrofolate reductase of Plasmodium falciparum. Mol. Biochem. Parasit 85, 25–40. [DOI] [PubMed] [Google Scholar]
- Zhang J, Kobert K, Flouri T and Stamatakis A (2014). PEAR: a fast and accurate Illumina Paired-End reAd mergeR. Bioinformatics 30, 614–620. [DOI] [PMC free article] [PubMed] [Google Scholar]
- Zhang K, and Rathod PK (2002). Divergent regulation of dihydrofolate reductase between malaria parasite and human host. Science 296, 545–547. [DOI] [PMC free article] [PubMed] [Google Scholar]
- Zheng Q (2017). rSalvador: An R Package for the Fluctuation Experiment. G3-Genes Genom. Genet 7, 3849–3856. [DOI] [PMC free article] [PubMed] [Google Scholar]
Associated Data
This section collects any data citations, data availability statements, or supplementary materials included in this article.
Supplementary Materials
Figure S1. An expanded view of OrthoRep, Related to Figure 1
The specific basis for OrthoRep is the p1/2 (also known as the pGKL1/2) plasmid system. p1 and p2 are linear, high-copy, double-stranded DNA plasmids that propagate autonomously in the cytoplasm of S. cerevisiae. TP-DNAP1 expressed from a nuclear plasmid replicates p1. TP-DNAP2 expressed from p2 replicates p2. TP-DNAP1 and TP-DNAP2 use terminal proteins (TPs) covalently attached at the 5’ ends of p1 and p2, respectively, as replication origins for TP-primed replication. All of the accessory components required for replication and transcription are encoded on p2. TP-DNAP1 does not replicate p2 and TP-DNAP2 does not replicate p1 (Arzumanyan et al., 2018), meaning that the high error rate of p1 replication does not affect p2-encoded genes and the low error-rate of p2 replication does not compete with p1 mutagenesis. ORFs with unknown function are indicated. TRF, Terminal Recognition Factor.
Figure S2. Design of TP-DNAP1 mutants by homology analysis and by construction of a scanning saturation mutagenesis library, Related to Figure 1
(A) The architecture of TP-DNAP1 consists of a fusion between the terminal protein, a 3’-5’ proofreading exonuclease domain, and a DNA polymerization domain. Motifs responsible for fidelity in the exonuclease and proofreading domains are highlighted. A multiple sequence alignment between TP-DNAP1 and five closely related family B DNAPs is shown. In the larger homology study described in the main text, multiple sequence alignment with 99 closely related DNAPs (Table S1) was used to identify positions that exhibit amino acid (a.a.) variation and are flanked by conserved residues (STAR Methods). Two candidate positions identified from this study are denoted with arrows. Amino acid variations found at these positions were transplanted into the corresponding location in TP-DNAP1. A total of 87 such TP-DNAP1 mutants were generated and screened in OR-Y24. Twenty-four of the TP-DNAP1 variants displayed elevated mutation rates, but almost 60% of these suffered from low activity, judging by the copy number of p1 (Table S2).
(B) A pool of ~19,000 oligonucleotides ranging in length from 130-200 nt were designed as 30 sets, each encoding a 20-50 amino acid variable region flanked by ~25 bp constant regions. Variable regions mutate each w.t. codon to 19 codons, representing all single amino acid substitutions. Each oligo set was PCR amplified and assembled with corresponding TP-DNAP1 plasmid backbones, yielding 30 full-length TP-DNAP1 plasmid sub-libraries.
(C) The genetic code used for mutagenesis, chosen to maximize the codon adaptation index in S. cerevisiae.
(D) Lengths of variable regions from each oligo set. Oligo sets 3 and 4, which were synthesized separately from the rest, have overlapping variable regions. Oligo sets 1-10 correspond to the putative TP portion of TP-DNAP1.
Figure S3. Functional purification of TP-DNAP1 sub-libraries, Related to Figure 1
(A) A conceptual illustration of OR-Y24, which serves as parent strain for screening TP-DNAP1 variants. OR-Y24 contains a mixture of w.t. p1 and recombinant p1 encoding mKate2, URA3, and leu2(Q180*). mKate2 serves as a reporter of p1 copy number (Table S3) and leu2(Q180*) serves as a reporter of p1 substitution mutation rates. TP-DNAP1 mutants are encoded on a CEN6/ARS4 plasmid and transformed into OR-Y24. If the resulting strain is subject to selection for URA3 in media lacking uracil, recombinant p1 increases in copy number and w.t. p1 decreases in copy number, because they compete for the same source of TP-DNAP1 (Ravikumar et al., 2014). After several passages in media lacking uracil, w.t. p1 is fully cured, and then the strain is used for screening. If, however, an inactive TP-DNAP1 mutant is transformed into OR-Y24, then the resulting strain is driven to extinction under selection for URA3. This is because selection for recombinant p1 causes w.t. p1 to decrease in copy number, which decreases the amount of functional TP-DNAP1 available. This initiates a feedback loop that drops the copy number of both plasmids, leading to extinction (Ravikumar et al., 2014). (Functional TP-DNAP1 variants expressed in trans from the nuclear CEN6/ARS4 plasmid can replicate recombinant p1 at a constant level and thereby rescue growth.)
(B) Due to a high fraction of non-functional frame-shifted variants present in the scanning saturation mutagenesis library of TP-DNAP1, OR-Y24 was used to functionally purify sub-libraries prior to screening. Two representative TP-DNAP1 sub-libraries, 14 and 21, were subject to purification. OR-Y24 cells transformed with sub-libraries 14 or 21 were split and inoculated into outgrowth conditions that were selective only for plasmid uptake (SC-H) or for plasmid uptake and URA3 expression (SC-UH). Selection in SC-UH was maintained for four 1:100 serial passages. After each passage, TP-DNAP1 plasmids were isolated from individual clones and subject to Sanger sequencing. Data shown are the percentage of (n) clones encoding full-length TP-DNAP1 variants.
Figure S4. Pilot studies of p1-PfDHFR evolution, Related to Figures 3-5
(A) Yeast strains dependent on p1-encoded PfDHFR acquired sensitivity to pyrimethamine (pyr). PfDHFR was expressed from p1 in strains that retain or lack DFR1, which encodes yeast’s endogenous DHFR. Strains were grown in selective SC media and plated on solid media with or without 500 μM pyrimethamine. Plates were incubated at 30 °C for 5 days prior to imaging.
(B) Pyrimethamine resistant clones arise in small culture volumes. A yeast strain that encodes PfDHFR on a nuclear plasmid and two OrthoRep strains that encode PfDHFR on p1 at for rapid mutation were grown to saturation in selective SC media and plated on solid media supplemented with pyrimethamine. After 5-6 days of growth at 30 °C, resistant colonies were counted. p1-encoded PfDHFRs carried resistance mutations in all 30 resistant clones sequenced.
(C) OrthoRep strains evolved pyrimethamine resistance in batch culture by rapidly mutating p1-encoded PfDHFR. OrthoRep strains with varying p1 mutation rates were serially passaged in 25 mL cultures, at 1:25 or 1:250 dilutions, in selective SC media initially supplemented with 500 μM pyrimethamine. OD600 was monitored daily and saturated cultures were passaged into gradually increasing drug concentrations as cultures adapted. After strains evolved resistance to 2 mM pyrimethamine, bulk populations of p1 plasmids were extracted and subject to Sanger sequencing. The OrthoRep strain containing w.t. TP-DNAP1 stopped growing in the 500 μM pyrimethamine condition when passaged at 1:250 dilutions.
Figure S5. Dynamics of PfDHFR evolution in six representative populations, Related to Figures 3-5
(A)-(F) Mutation frequencies tracked across all 13 passages from lines 52, 64, 74, 62, 70, and 73 shown in Figure 3, respectively. Populations from each passage were revived from glycerol stocks in the same media condition that they were initially grown in. Mutation frequencies were calculated from Sanger sequencing of revived populations. See STAR Methods for SNP analysis details.
Table S2. All TP-DNAP1 variants characterized by fluctuation tests in this study, Related to Figure 1 and Table 1
All independent measurements of mutation rate are shown, with corresponding 95% confidence intervals and the number of replicates performed for each fluctuation test listed. The number of replicates assayed for determination of p1 copy number is shown as (n).
Table S4. 210 TP-DNAP1 variants that replicate p1 at a higher copy number than w.t. TP-DNAP1, Related to Figure 1
From p1 copy number measurements of 13,625 yeast clones screened in small-scale p1 fluctuation tests, 210 unique variants exhibited elevated copy numbers. Variants were retransformed into OR-Y24 and subject to additional p1 copy number measurements for verification. Data shown are fold-change mean and standard deviation (calculated using equation (5).2 of Frishman, 1975) of biological triplicate measurements of each mutant and 15 measurements of w.t. TP-DNAP1. High activity of four TP-DNAP1 variants was independently validated with qPCR measurements of p1 (unpublished results).
Table S9. List of plasmids and parent yeast strains used in this study, Related to Figures 1-7
Plasmids are listed in entries 1-79 and parent yeast strains are listed in entries 80-114. Plasmids encoding TP-DNAP1 variants listed in Tables S2, S4 and S5 are not included. These were all derived from plasmid 2 (described below). Parent strains do not include derivatives of OR-Y24 containing TP-DNAP1 variants, and derivatives of AR-Y432 and AR-Y435 containing POL3 variants.