Nucleic Acids Research, 2014, Vol. 42, No. 15, Pages 9937–9948, https://doi.org/10.1093/nar/gku728
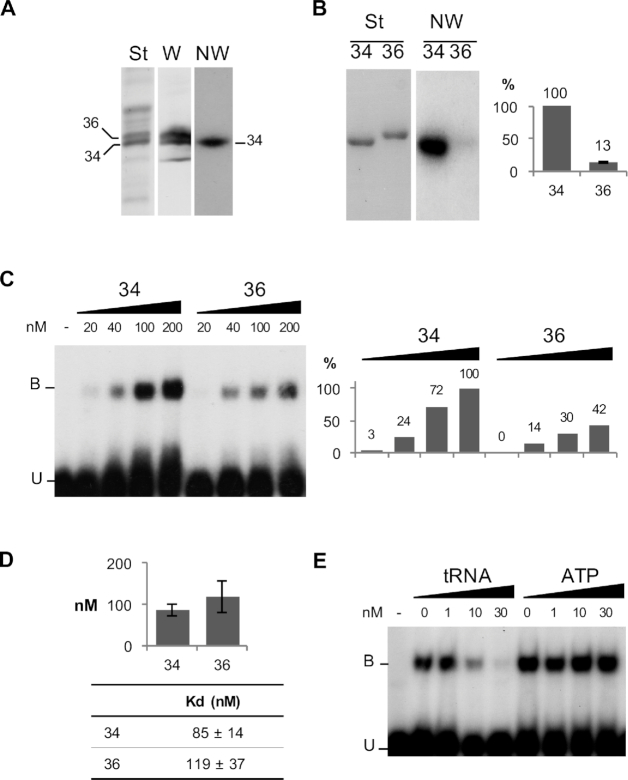
Figure 1A, middle lane, has been unethically manipulated to remove a non-specific band below the two major VDAC34 and VDAC36 bands. The altered background does not affect the overall results and conclusion of this figure, that is that only VDAC34 and not VDAC36 interacts with tRNAs in NorthWestern experiments. A revised Figure 1 is provided below.
Figure 1.
MitochondrialVDAC proteins from Solanum tuberosum differentially interactwith tRNA. (A) VDAC34 interacts with labeled tRNAs. (St) corresponds to the Coomassie blue staining of total mitochondrial outer membrane proteins fractionated on SDS/PAGE and electroblotted onto Immobilon-P membrane. (W) corresponds to the western blot analysis with antibodies raised against S. tuberosum VDAC proteins. The position of the two major VDACs, VDAC34 and VDAC36, is indicated. (NW) corresponds to the northwestern blot analysis. The proteins fixed on the membrane were renatured and incubated with radiolabeled cytosolic Arabidopsis thaliana tRNAAla transcript. (B) Differential interaction was confirmed with the His-tagged purified proteins. (St) corresponds to the Coomassie blue staining of the purified VDAC34 (34) and VDAC36 (36) proteins fractionated by SDS/PAGE and transferred onto nylon membrane. (NW) corresponds to the Northwestern blot analysis with labeled tRNAAla. The histogram shows the percentage of interaction between VDAC36 and tRNA as compared to VDAC34 interaction (100%). It is the average of 11 independent experiments and standard error is indicated for VDAC36. (C) Gel shift assay with 20 to 200 nM of purified VDAC34 or VDAC36 proteins in presence of an excess of labeled tRNAAla (1 nM). Unbound tRNA probe and tRNA probe bound to the VDAC protein are indicated by the letters U and B respectively. The histogram shows the tRNA–VDAC complex signal intensities. The signal intensity observed in presence of 200 nM of VDAC34 was arbitrary taken as 100%. (D) Constant dissociation (Kd) values for VDAC34 and VDAC36. The values are the average of seven and five independent experiments for VDAC34 and VDAC36 respectively and standard errors are indicated. Examples of gel-shift assays and binding curve graphics are shown in supplemental information (Supplemental Figure S3). (E) Gel shift competition assay with 200 nM of VDAC34 and an excess of labeled tRNAAla (1 nM) in presence of increasing amounts of unlabeled tRNAAla or increasing amounts of ATP.
Figure S4B contains undisclosed splicing. In order to facilitate the reading of the NorthWestern data, we have ordered the constructs from the shortest mutant protein (called D7) to the longest mutant protein (D3), but we apologize for not clearly indicating this in the Figure. The raw data used to draw Figure S4B and a new corrected version of Figure S4B are provided in Supplementary Data.
Supplementary Material
SUPPLEMENTARY DATA
Supplementary Data are available at NAR Online.
Associated Data
This section collects any data citations, data availability statements, or supplementary materials included in this article.


