

Abstract
Single cell analysis methods are increasingly being utilized to investigate how individual cells process information and respond to diverse stimuli. Soluble proteins play a critical role in controlling cell populations and tissues, but directly monitoring secretion is technically challenging. Microfabricated well arrays have been developed to assess secretion at the single cell level, but these systems are limited by low detection sensitivity. Semiconductor quantum dots (QD) exhibit remarkably bright and photostable luminescence signal, but to date they have not been evaluated in single cell secretion studies using microfabricated well arrays. Here, we used QDs in a sandwich immunoassay to detect secretion of the soluble cytokine tumor necrosis factor-α (TNF-α) from single cells. To enhance detection sensitivity, we employed two different strategies. First, we used a unique single QD imaging approach, which provided a detection threshold (180 attomolar) that was >100-fold lower than previously reported results using QDs. We also amplified QD binding to each captured TNF-α molecule using the bioorthogonal cycloaddition reaction between trans-cyclooctene and tetrazine, which further lowered detection threshold to 60 attomolar. This is 6 orders of magnitude more sensitive than organic fluorophores that have been used for single cell secretion studies, and far surpasses single molecule resolution within sub-picoliter microwells that are used to assess single cell secretion. Finally, single cell secretion studies were performed using phorbol 12-myristate 13-acetate (PMA) differentiated and lipopolysaccharide (LPS) activated U-937 cells. TNF-α secretion was detected from 3-fold more single cells using the QD-based method in comparison to rhodamine, which was accomplished by extending sensitivity into the range of ~2 to 10,000 molecules captured per microwell. In future work, we will apply this technique to assess immune cell secretion dynamics under diverse stimuli and disease settings. We will also incorporate multiplexing capabilities to evaluate the secretome at the resolution of single molecules.
Keywords: quantum dot, bioorthogonal chemistry, single cell, secretion, macrophage, TNF-α
Graphical Abstract
Introduction
Interest is rapidly growing to interrogate individual cells within diverse populations to obtain insight into the stochastic and heterogeneous nature of biological systems and to identify rare driver cells.1–6 For example, single cell sequencing and protein expression profiling have shown that individual cells process information and respond to stimuli in unique ways.7–9 Additionally, single cell analysis methods have been used to assess tumor heterogeneity, inform therapy decisions, and identify cells possessing metastatic or stem-like properties.10–16 Soluble proteins such as cytokines and growth factors play a critical role in controlling the behavior of diverse cell populations within tissues, but directly monitoring secretion from individual cells is technically challenging. The gold standard for detecting soluble proteins is the enzyme-linked immunosorbent assay (ELISA), but this is a bulk format that averages results over a population of cells.17,18 enzyme-linked immunoSpot (ELISpot) and fluorescence enzyme-linked immunoSpot (FLUOROSpot) address this issue to a degree, but secretion results are not quantitative nor strictly linked to the originating cell. Transcript and protein content can be assessed inside of cells by imaging, flow cytometry, or single cell sequencing, but these methodologies fail to convey direct information about secretion dynamics and/or magnitude. To address these shortcomings, microfabricated arrays have been developed that isolate single cells and their secreted products within sub-picoliter wells.19 A glass slide containing immobilized capture antibody is used to seal the wells, enabling quantitation of secreted products while maintaining the spatial distribution of the cell array. Large scale multiplexing (>40) has also been enabled in this format by spatially patterning different capture antibodies into barcodes on the glass detection slide.20–22 Using this technique, generally termed microengraving, single cell secretion has been monitored for B and T lymphocytes, macrophages, neurons, and tumor cells.20,22–28 Recently, we extended this technique to assess macrophages within engineered adhesive contexts using a three component well array.29 While microengraving has provided valuable insights into secretion heterogeneity, detection has been based on a sandwich immunofluorescence detection scheme that is limited in sensitivity to ~1 ng/ml, or 10 pM, for most soluble proteins. This corresponds to minimum of ~3000 molecules secreted per cell for standard microwell sizes,19 and 30,000 molecules for larger microwells used to barcode capture antibodies.22 By comparison, the detection threshold of standard ELISAs can routinely reach 100 fM, and has been further reduced to ~200 aM using ultrafast polydopamine deposition and to single molecule levels using digital ELISA.30–32 However, these are all bulk assays that cannot be applied to single cell secretion studies. Detection of soluble protein as low as ~3 nM was demonstrated using immunofluorescence and a microfluidic microwell chamber platform.20 This was achieved using a multi-round detection strategy including secondary antibody and avidin/biotin binding, valved microfluidic system, and DNA-based approach to conjugate capture antibody. Further improvement in detection sensitivity using would significantly advance single cell secretion studies by enabling interrogation of earlier time points or evaluation of more subtle activating stimuli, such as physiologically relevant cytokine concentrations and biophysical cues. Furthermore, achieving these goals using a simple immunoassay format and standard microengraving platform would extend this capability to many more research labs.
Nanomaterial probes offer numerous advantages for molecular diagnostics, including unique detection signals, synthetic versatility, and robustness of chemical and physical properties.33–36 These attributes have dramatically improved detection of biological targets under numerous assay formats and analytical modalities.37,38 Applications have primarily focused on cell-associated proteins, but attention has also been given to soluble proteins using sandwich immunoassays. In a seminal study, soluble proteins were captured between magnetic beads and gold nanoparticles, the latter of which was conjugated with DNA bio-barcodes.39 Using this method, prostate-specific antigen was detected at concentrations as low as 30 aM, which remains unmatched to date. Recently, carbon nanotubes were used with dielectrophoretic and hydrodynamic shear force alignment to achieve a detection limit of 100 aM.40 While these nanotechnology-based methods have advanced the limits of detection for soluble targets, they have all utilized bulk assay formats similar to ELISA. Semiconductor quantum dots (QD) exhibit exceptional luminescence intensity and photostability, which has led to their use in sandwich immunoassays.38 Using fluorescence microscopy or waveguides, detection thresholds have consistently been achieved in the high fM range,41–44 and even extended down as low as 25 fM.45 While this represents an impressive three orders of magnitude improvement over immunofluorescence using organic fluorophores, no attempt has been made to further advance detection sensitivity by taking advantage of the fact that single QDs can readily be imaged using standard fluorescence microscopy.46,47 Moveover, QDs have not been explored in single cell secretion studies using the microengraving technique.
To improve the detection power of nanomaterial probes, we pioneered a novel method to amplify binding to biomarker targets that is based on the catalyst-free bioorthogonal cycloaddition reaction between trans-cyclooctene (TCO) and tetrazine.48 This involved tagging the protein of interest with a TCO-modified monoclonal antibody, followed by reaction with tetrazine-modified nanoparticles. Due to the small footprint of the cycloaddition product on a relatively large antibody scaffold, multiple nanoparticles attached to each protein target, which has consistently produced 3 to 10-fold signal enhancement over traditional nanoparticle immunoconjugates (IC).48–50 Recently, we improved the robustness and overall power of our chemical amplification (ChemAmp) technique by increasing the density of reactive TCO moieties on the antibody, which tend to bury within the antibody during bioconjugation procedures.51 To date, the simple yet powerful ChemAmp technique has been employed to detect protein targets on live and fixed human cells, bacteria, and microvesicles using magnetic nanoparticles and QDs,52 but it has not been applied to secreted proteins.
In this work, we evaluate the detection sensitivity of QDs for the inflammatory cytokine tumor necrosis factor-α (TNF-α) using various sandwich immunoassay formats (Fig. 1) and a unique single QD imaging approach. We first optimize the QD sandwich immunoassays in well plates and find that the ChemAmp technique improves detection sensitivity by ~20-fold in comparison to a traditional QD IC and an organic fluorophore, and is comparable in sensitivity to an ELISA. Next we assess the QD IC on glass slides and demonstrate that QD imaging provides a detection threshold of 180 aM. This is >100-fold more sensitive than previously reported QD-based immunoassays and >5 orders of magnitude more sensitive than organic fluorophores. Using the ChemAmp technique, detection threshold is further decreased to 60 aM, but we observe significant homoquenching between QDs at higher TNF-α concentrations due to elevated QD surface density. Thus, we conclude that the ChemAmp technique is only suitable for low TNF-α concentration measurements. Using the QD IC, we perform single cell secretion studies using phorbol 12-myristate 13-acetate (PMA) differentiated and lipopolysaccharide (LPS) activated U-937 cells. We find that 3-fold more single cells are detectable compared to an organic fluorophore. This is accomplished by lowering detection threshold from 10,000 to only 2 or 3 molecules of TNF-α captured per microwell. Thus, we conclude that our QD-based imaging method maximizes detection sensitivity by providing near-single molecule resolution.
Figure 1. Quantum dot (QD)-based immunoassays for detection of TNF-α.
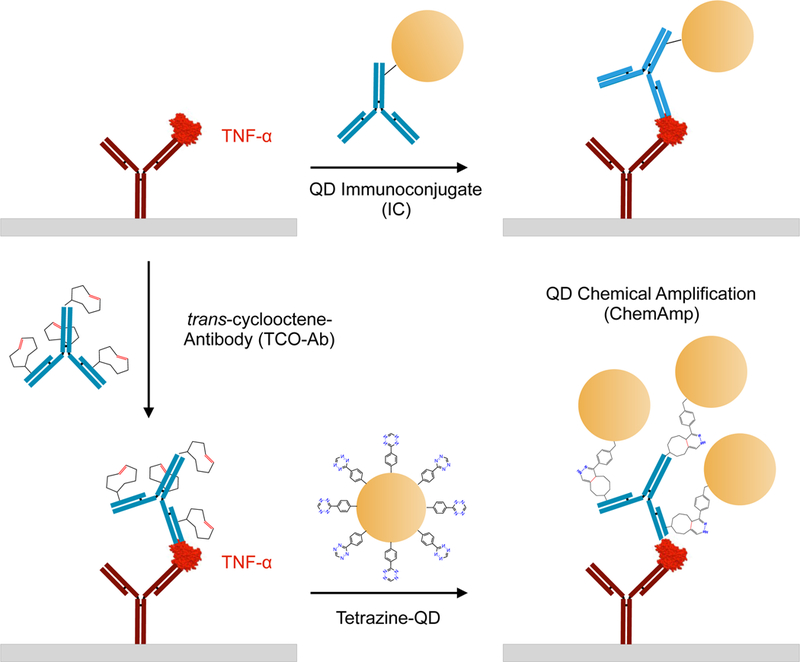
Schematic of sandwich detection schemes using anti-TNF-α capture (red) and detection (blue) antibody pair. (Top) Standard immunoconjugate (IC) format in which the detection antibody is first attached to the QD. (Bottom) Chemical amplification (ChemAmp) technique in which the detection antibody is modified with trans-cyclooctene (TCO), bound to TNF-α, and covalently reacted with tetrazine-modified QDs via bioorthogonal cycloaddition reaction. ChemAmp results in multiple nanoparticles attaching per detection antibody, enhancing detection sensitivity.
Materials and Methods
Materials.
All chemicals were purchased from Sigma-Aldrich (St. Louis, MO) unless otherwise noted. DBCO−amine was purchased from Click Chemistry Tools (Scottsdale, AZ). Heterobifunctional carboxy−(PEG)4−amine, amine-reactive succinimidyl ester (NHS)-azide, NHS-tetramehtylrhodamine (TMR), sulfo-NHS-LC-Biotin, and sulfo-SMCC (sulfosuccinimidyl 4-(N-maleimidomethyl)cyclohexane-1-carboxylate), primary amine-terminated quantum dots (Qdot 605 ITK Amino PEG), NeutrAvidin-horseradish peroxidase (Neutravidin-HRP), and Neutravidin were purchased from Thermo Fisher Scientific (Waltham, MA). Recombinant human tumor necrosis factor-α (TNF-α) and matched monoclonal mouse antibodies for human TNF-α sandwich immunoassays (IgG1κ, clones MAb1 and MAb11) were purchased from BioLegend (San Diego, CA). Absorption measurements were recorded on a Thermo Scientific NanoDrop 2000 spectrophotometer. NHS−tetrazine, NHS−TCO, and DBCO-PEG4-TCO were synthesized as we have previously reported.51,53
Protein conjugations.
Anti-TNF-α capture (MAb1) and detection (MAb11) antibodies were buffer-exchanged into phosphate buffered saline (PBS) using Zeba spin desalting columns (Thermo Scientific) prior to modification. Biotinylated capture antibody was prepared by reacting 250 μg antibody with 5 molar equivalents of sulfo-NHS-LC-Biotin in PBS containing 10% dimethylformamide (DMF) and 0.1 M NaHCO3 (pH 8.4). Detection antibody was similarly modified with either 1000 molar equivalents of NHS-TCO, 50 molar equivalents NHS-azide, or 30 molar equivalents of NHS-TMR fluorescent dye. Neutravidin was modified with maleimide using 10 molar equivalents of sulfo-SMCC. All modified proteins were purified using Zeba spin desalting columns (Thermo Fisher). PEG-TCO modified detection antibody was prepared by reacting azide-modified antibody with 10 molar equivalents of DBCO-PEG4-TCO in PBS containing 10% DMF for 4 h at room temperature. PEG-TCO antibody was buffer-exchanged into PBS using Amicon Ultra-4 centrifugal filtration systems with 10 kD MWCO (EMD Millipore). We note that TCO and PEG-TCO loading conditions were optimized in previous work to provide maximal reactive loading without affecting antibody binding affinity.52 Antibody concentrations were determined by absorption measurement using a NanoDrop 2000 spectrophotometer. TMR modification level was determined to be ~2 dyes/antibody by absorption measurement.
Preparation of quantum dots.
Amine-terminated QD were modified with NHS−tetrazine, as described previously.49 Briefly, 0.8 nmoles of amine-QD and 500 molar equivalents of NHS−tetrazine were combined in PBS containing 5% DMF and 0.01 M NaHCO3, reacted for 3 h at room temperature, and tetrazine-QD were purified into PBS using an Ultra-4 centrifugal filter with 100 kD MWCO. QD immunoconjugates (IC) were prepared by reacting 0.15 nmole tetrazine-QD with 200 μg TCO-modified detection antibody (prepared with 30 molar equivalents TCO-NHS) in 1 ml of PBS containing 1% bovine serum albumin (BSA) (referred to as PBS+) for 3 h at room temperature. QD ICs were purified using Sephacryl S-400 (GE Healthcare) gel filtration media on an AKTA Pure FPLC system (GE Healthcare). Final concentrations were determined by absorption measurements and calibration using the QD stock solution.
Fabrication of PDMS microwell arrays.
Silicon wafer (University Wafer, MA) were fabricated using SU-8 photolithographic techniques. Briefly, SU-8 50 photoresist (MicroChem, MA) was spin-coated onto a 3” silicon wafer to get a uniform 80 mm thick layer. After baking at 95°C for 2 h, the wafer was positioned under a transparency mask containing clear rectangles (90 µm x 90 µm) and was exposed to UV light (AB&M UV Flood Lamp Exposure System), following MicroChem protocol. After 10 minutes of post-exposure bake at 95°C, the wafer was immersed in SU-8 developer for 5 minutes to wash off unpolymerized photoresist. Cleaned and dried wafer was baked at 200°C for 30 minutes to allow SU-8 to crosslink completely. PDMS and curing agent (Dow Corning, MI) were mixed in 10:1 ratio and poured onto the silanized silicone master to produce the microwell array. Microwell height was determined to be 43 µm from microscope images taken in cross-section. Thus, the microwells measured 90 µm x 90 µm x 43 µm, for a volume of ~350 pl. Arrays were then degassed, cured in oven at 65°C, and sterilized with 70% ethanol.
Preparation of detection slides.
Glass microscope slides (25 mm x 75 mm) were first cleaned using Piranha solution (3% H2O2 and concentrated H2SO4 at 1:2 volume ratio) for 30 min, rinsed with double deionized water H2O (dH2O), and dried in an oven for 1 h at 100°C. Slides were then submerged in a solution of 4% (3-mercaptopropyl)trimethoxysilane in 100% ethanol for 1 h, rinsed with ethanol, and dried in the oven for 30 min. Silanized glass slides were stored in a desiccator until use. Prior to experiments with purified TNF-α, a 50 microwell silicon gasket (Grace Bio-Labs, OR) was placed onto the silanized glass slide and 5 µl of PBS containing 1 mg/ml maleimide-modified neutravidin was added to each well. After reacting for 2 h at room temperature, wells were washed with PBS, biotinylated capture antibody was incubated at 10 µg/ml in PBS for 2 h, and wells were blocked with StartingBlock for 15 min at room temperature. Purified TNF-α was then added at concentrations ranging from 500 ag/ml to 1 ng/ml in PBS+ and incubated for 2 h at room temperature. For single cell secretion studies, a 2 cm x 2 cm square region was outlined with a grease pen on silanized detection glass slides, coated with 125 µL of 1 mg/ml maleimide-modified neutravidin for 2 h, rinsed, blocked with 200 µL of PBS+ for 15 min, incubated with 125 µL of biotinylated capture antibody for 2 h at room temperature, and treated with PBS+ for 15 min at room temperature.
U-937 cell culture and differentiation.
The pro-monocytic, human myeloid leukemia cell line U-937 was obtained from ATCC (Manassas, VA) and cultured as recommended in RPMI 1640 medium supplemented with 2 mM L-glutamine, 10 nM HEPES, 1 mM sodium pyruvate, 4.5 g/L glucose, 1.5 g/L sodium bicarbonate, and 10% fetal bovine serum (Thermo Fischer Scientific, MA). For single cell experiments, U-937 cells were seeded at density of 500,000/ml in 12-well plates and differentiated with 50 ng/ml PMA for 48 h, followed by 24 h resting time in culture media. On the day of the experiment, the cells were treated with 4% Trypsin EDTA (Thermo Fisher Scientific, MA), and release was augmented with a cell scraper (Fisher Scientific, NH). Differentiated cells were then seeded onto the PDMS microwells by centrifuging at 700 rpm for 5 min and incubated for at least 1 h before stimulation with 100 ng/ml LPS. Detection glass slides were then inverted over the top of the microwells and sealed using an acrylic housing. TNF-α secretion was interrogated for 24 h at 37°C, followed by imaging cells under bright field using an Olympus IX83 inverted microscope (Olympus, Japan) and a 10x objective (NA 0.3, Olympus) to determine the number of cells present within each microwell.
Detection of TNF-α by ELISA.
Monoclonal human anti-TNF-α capture antibody was coated onto flat, non-tissue culture treated 96-well plates (Thermo Fisher Scientific, IL) by incubating at 5 µg/ml in 0.1 M NaHCO3 (pH 9.2) for 2 h. Wells were then treated with StartingBlock (Thermo Fisher Scientific, MA) for 15 min, and 50 µL of purified human TNF-α (1 pg/ml to 2 ng/ml in PBS+) was added for 2 h at room temperature. After washing with PBS+, biotinylated anti-TNF-α detection antibody was incubated at 5 µg/ml for 30 min, followed by Neutravidin-HRP at 1:500 dilution in PBS+ for another 30 min and a final wash step. Wells were developed by adding 100 µL 1-step Ultra TMB substrate (Thermo Fisher Scientific, IL) and reacting at room temperature for 15 min before quenching with an equal volume of 2 M H2SO4. TMB absorbance at 450 nm was quantified using an Infinite 200 PRO Multimode Reader (TECAN, Switzerland). Concentration was calibrated using the purified human TNF-α results and a linear regression.
Detection of TNF-α using a fluorescent plate reader.
TNF-α capture was performed as described in the previous section, except black 96-well plates (Corning, NY) were used. Detection procedures were performed by incubating TMR, TCO, or PEG-TCO modified detection antibody at 10 µg/ml or QD IC at 5 to 50 nM in PBS+ for 30 min at room temperature. For TCO and PEG-TCO cases, an additional incubation was performed using 5 to 50 nM Tz-QD in PBS+ for 30 min at room temperature to achieve Chemical Amplification (ChemAmp). TMR and QD intensities were quantified using a Fluoroskan Ascent Microplate Fluorometer (Thermo Fisher Scientific, IL) using the following excitation/emission wavelengths: 552/575 nm for TMR or 460/590 nm for QDs.
Detection of TNF-α by fluorescence imaging.
The silicon gasket or PDMS wells were carefully separated from the glass slide, immediately washed with 200 µL ice cold PBS+, and labeled as described for plate assays using TMR-modified detection antibody (10 µg/ml), QD IC (20 nM), or TCO-PEG-modified detection antibody (10 µg/ml) followed by Tz-QD (20 nM) for ChemAmp. After additional washing with ice cold PBS+, a cover slip was mounted in preparation for imaging.
Imaging and analysis.
Glass slides were imaged using an Olympus X83 inverted microscope, TRITC filter set (532–554 nm band-pass excitation, 570–613 nm band-pass emission, Olympus) or single-band QD 605 nm filter set (415–455 nm single band exciter, 590–620 nm single band emitter, QD605-C-OFX, Semrock, NY), and 40x oil-immersion objective (NA 1.3, Olympus). Images were captured using an Orca-R2 CCD camera (Hamamatsu Photonics, Japan) and mManager control software for at least five fields of view per sample using 100 ms and 500 ms integration times for TMR and QD, respectively. Under these conditions, single QDs could readily be resolved on control slides. ImageJ software was then used to quantify mean fluorescence intensity. Briefly, control images were used to optimally set thresholds for brightness and contrast for visualizing single QDs in the image, and these settings were then applied to the remaining conditions. Mean fluorescence intensity was then determined using ImageJ and the built-in measure tool. For single cell studies, the complete series of brightfield (cells) or fluorescence (TNF-α) images were stitched together using Fiji software and the Grid/Collection Stitching plug-in and analyzed. Microwell locations were then defined in the stitched fluorescence images by aligning with the stitched bright field images using the built-in mask, selection, and ROI manager tools. Wells containing either zero (empty wells), one (single cell wells), or multiple cells were manually selected and their ROI stored for later analysis. Afterwards, the defined ROIs for empty and single cell wells were superimposed on the fluorescence images from the detection glass slides and the mean intensity for each ROI was obtained with the built-in multi-measure tool in ImageJ. Matlab was then used to generate mean intensity histograms for single cell and empty well counts. Mean intensity was also determined for the empty wells to determine the limit of detection. We chose to use two standard deviations higher than this mean intensity, which resulted in false positive rates of ~3% for both TMR and QD IC cases. Finally, TNF-α secretion for the positive population was calibrated from intensity measurements obtained using purified TNF-α for both TMR and QD IC, and correction was made for the false-positive rate by removing cells from the low TNF-α concentration range corresponding to 3% of the total population.
Statistical analysis.
Data are presented as the mean ± SEM for at least three independent experiments. To establish statistical significance, two-tailed Student’s t-tests were performed, and p values < 0.05 were considered significant.
Results and Discussion
Detection of TNF-α by ELISA and fluorescence in well plates
We first evaluated TNF-α detection capacity using bulk assays via ELISA and immunofluorescence assays using an organic fluorophore or QDs in 96 well microtiter plates. For all cases, anti-TNF-α capture antibody was physisorbed to the plastic and purified recombinant human TNF-α protein was incubated at concentrations ranging from 1 to 2000 pg/ml. ELISAs conducted using biotinylated anti-TNF-α detection antibody, Neutravidin-HRP, and TMB substrate yielded a detection threshold of ~5 pg/ml, or 300 fM (Fig. 2A). This is consistent with ELISA results in the literature, as well as information provided by the manufacturer. Next we evaluated immunofluorescence-based detection using tetramethylrhodamine (TMR)-modified detection antibody and a fluorescence plate reader. Detection sensitivity was orders of magnitude lower than ELISA, with a threshold of ~300 pg/ml, or 18 pM (Fig. 2B). Finally, we investigated QD-based immunoassays under different formats: QD pre-conjugated with detection antibody to form an immunoconjugate (QD IC) or modified with tetrazine for chemical amplification (ChemAmp) to trans-cyclooctene (TCO)-modified detection antibody (Fig. 1).48 Specifically, ChemAmp was performed using detection antibody that was modified with TCO and a polyethylene glycol (PEG)-TCO conjugate that we have shown provides higher reactivity.51 We initially tested different QD concentrations using 500 pg/ml TNF-α, and found that 20 nM was optimal for all cases (Fig. 2C). This was due to higher background at 50 nM, and similar results were observed at different TNF-α concentrations (see Supplementary Information, Fig. S1). Thus, 20 nM QD concentration was used for all subsequent studies in this work. QD signal response curves attained at different TNF-α concentrations are presented in Fig. 2D. ChemAmp using PEG-TCO yielded significantly greater signal at all TNF-α concentrations. Detection thresholds were ~100 pg/ml (6 pM) for the QD IC, ~30 pg/ml (2 pM) for ChemAmp using TCO-modified detection antibody, and ~3 pg/ml (180 fM) for ChemAmp using PEG-TCO-modified detection antibody. Based on these results, the PEG-TCO format was used for all subsequent ChemAmp experiments in this work. These findings confirm that attachment of QDs using the tetrazine/TCO cycloaddition chemically amplifies binding to a soluble protein in sandwich immunoassays, providing detection sensitivity that is superior to a QD IC. All QD formats provided greater detection sensitivity than the organic fluorophore, and the ChemAmp technique was comparable to an ELISA.
Figure 2. TNF-α detection in microtiter plates.
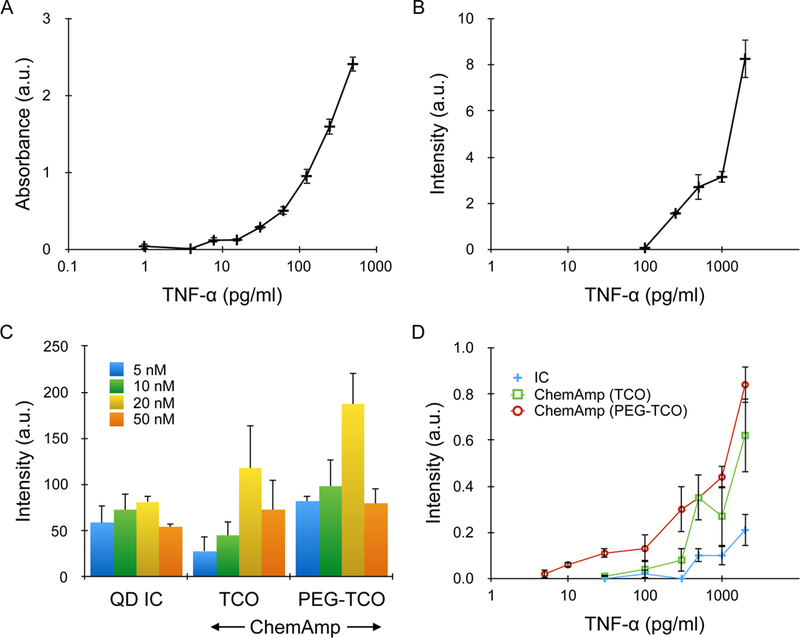
(A) ELISA results performed using biotinylated detection antibody, avidin-HRP, and TMB substrate. Detection threshold, defined as the lowest TNF-α concentration at which signal was significantly above background, was ~5 pg/ml, or 300 fM. (B) Standard immunofluorescence assay performed using rhodamine-labeled detection antibody (TMR), with detection threshold at ~300 pg/ml, or 18 pM. (C) QD results for an IC, as well as the ChemAmp technique using TCO and PEG-TCO modified detection antibodies. TNF-α concentration was 500 pg/ml, and the maximum signal was obtained at 20 nM QD concentration for all cases. The decrease at 50 nM was due to higher background. (D) QD intensities for all 3 detection formats as a function of TNF-α concentration. Detection thresholds were 100 pg/ml (6 pM) for the IC, 30 pg/ml (2 pM) for ChemAmp with TCO-modified detection antibody, and 3 pg/ml (180 fM) for ChemAmp with PEG-TCO-modified detection antibody. All results were background subtracted using the signal obtained from nonspecific QD binding. Error bars represent the standard error from at least three independent experiments.
Detection of TNF-α by imaging
Next we transitioned to fluorescence imaging in preparation for single cell secretion studies. Glass slides were silanized, covalently reacted with Neutravidin, modified with biotinylated capture antibody, and incubated with purified human TNF-α. Fluorescence signal for TMR was only detectable above 1 ng/ml (60 pM; see Supplementary Information, Fig. S2). This was significantly less sensitive than the microtiter plate experiments, but consistent with previous microengraving studies.19,29 We also evaluated QD-based detection for the IC and ChemAmp formats. Images were captured using a QD605 filter cube and sufficient integration time to resolve individual fluorescent spots on control slides, which we presumed were mostly single QDs. Representative images for select TNF-α concentrations are shown in Fig. 3A, and for all concentrations in the Supplementary Information, Fig. S3. After quantifying mean intensity and subtracting the background signal, we found that dynamic range spanned six orders of magnitude in TNF-α concentration for both QD assay formats (Fig. 3B). The QD IC response curve was monotonic, and surprisingly exhibited higher signal levels than the ChemAmp case at all but the high and low extremes. Three distinct regimes were observed for the ChemAmp case, with signal rising very slowly from baseline up to 8 pg/ml, decreasing in the range of 10–30 pg/ml, and finally rising quickly to high TNF-α concentrations. Decreased signal between 10 and 60 pg/ml was highly consistent across all experiments, and can clearly be seen for the 16 pg/ml image in Fig. 3A ii. We attribute this to homoquenching between neighboring QDs, which was confirmed based on by image processing of individual fluorescent spots (see Supplementary Information Results and Discussion, Figs. S4 and S5). Quenching effects were not observed in Fig. 2 or previous work with cells,48,49,51, but likely resulted here due to the planar geometry of the glass substrates and higher overall capture antibody density. Another factor that may have promoted quenching is oligomerization of TNF-α, but this only tends to occur at concentrations in excess of 1 nM or 10 ng/ml.54 The QD IC was not affected by quenching (see Supplementary Information Results and Discussion, Figs. S6 and S7), suggesting that the ChemAmp technique did have higher overall QD density even though signal intensity was lower. Focusing on the low TNF-α range and now comparing directly to background signal, both QD assay formats provided statistically significant detection down to 3 fg/ml, or 180 aM (Fig. 3C and D). This also corresponded to three standard deviations above the mean intensity of the control, which is typically used to define detection threshold.20,23,32 The ChemAmp technique was superior at low TNF-α concentration, primarily due to lower background signal (Figs. 3C and D), which enabled detection threshold to extend down to 1 fg/ml, or 60 aM. This is orders of magnitude more sensitive than standard ELISA and 3-fold more sensitive than enhanced ELISA with ultrafast polydopamine deposition.31 Most importantly, compared to other probe-based methods, it has only been surpassed by bulk methods such as the bio-barcode and digital ELISA assays.32,39 For QD-based immunoassays, the lowest reported detection threshold was ~25 fM, which was attained using a QD IC for two soluble cancer biomarker proteins.45 We have achieved a ~150-fold improvement here using a similar QD IC format, which we attribute to our unique approach to image single QDs. While the ChemAmp technique further improved detection sensitivity by another 3-fold, the complex relationship between intensity and TNF-α concentration would make it difficult to quantify secretion across the full dynamic range of interest. Thus, we conclude that as currently deployed, the ChemAmp technique would only be recommended for detecting the very low concentration range (0.001 to 0.01 pg/ml). Quantitation of higher concentrations could potentially be addressed by image processing, and we describe a potential look-up table approach in the Supplementary Information (see Supplementary Information Results and Discussion, Table S1). The ideal solution would involve directly assessing quenching using a technique such as fluorescence polarization microscopy or fluorescence lifetime imaging microscopy, or eliminating quenching entirely by separating QDs further apart from each other using molecular spacers or a protective shell. These strategies will be pursued in future work.
Figure 3. TNF-α detection by imaging.
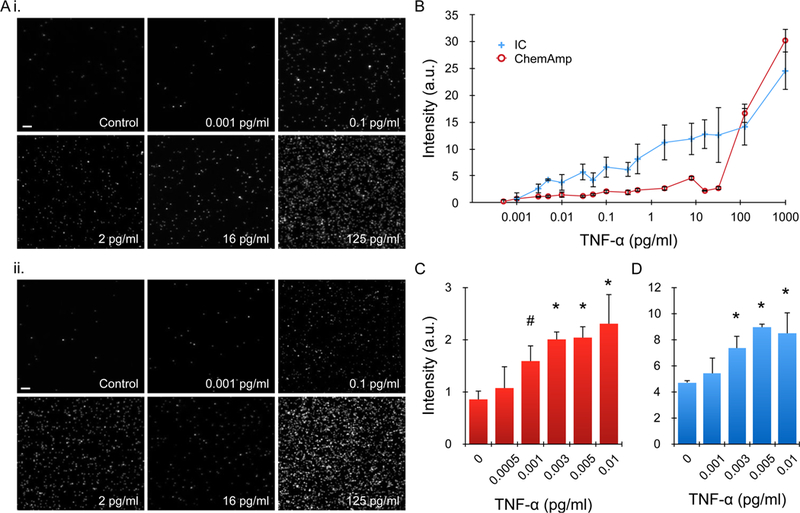
(A) Representative images at select TNF-α concentrations for (i) QD IC and (ii) ChemAmp technique (PEG-TCO case). (B) Average intensity, after background subtraction, obtained across 6 orders of magnitude in TNF-α concentration. The response curve for the QD IC was generally monotonic, while the ChemAmp case was complex. The QD IC also exhibited higher signal at most TNF-α concentrations. (C,D) Mean intensities in the low TNF-α concentration range, including comparisons to control, for (C) ChemAmp and (D) IC cases. Detection thresholds were 1 fg/ml (60 aM) and 3 fg/ml (180 aM), respectively. Scale bars are 100 μm. Error bars represent the standard error from at least three independent experiments. # denotes p < 0.05 and * denotes p < 0.01 when compared to controls.
Detection of TNF-α secretion from single cells
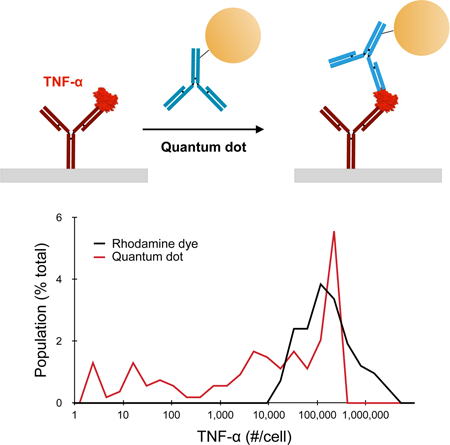
Based on the above findings, we evaluated the QD IC in single cell secretion studies. Experiments were conducted by seeding PMA-treated U-937 cells in an array of 90 × 90 × 43 µm (length x width x height) wells, then quickly adding LPS at 100 µg/ml and sealing the wells with the detection slide. After incubating for 24 h, the microwells were imaged under bright field to determine the number of cells per well. Detection slides were then separated, stained with detection antibody coupled to TMR or QD IC, and imaged by fluorescence microscopy. The collection of images obtained under brightfield and fluorescence were separately stitched together, and then superimposed to identify well borders and classify wells as containing no cells, one cell, or multiple cells. Representative images are displayed in Figs. 4A and B, which qualitatively show that the QD IC provided brighter signals and higher numbers of positive microwells. Next we quantified fluorescence signal for empty and single cell wells, and histograms for a representative experiment are shown for TMR and QD IC in Figs. 4C and D, respectively. The single cell wells largely overlapped with empty wells for TMR, indicating that very few single cells secreted enough TNF-α to be detected. For the QD IC, the dynamic range of intensity was much greater, as was the number of single cell wells that exhibited higher signal than empty well controls. To establish a positive detection criterion, we chose the fluorescence intensity that was two standard deviations higher than the mean intensity signal from empty (no cell) wells.22,26 This resulted in false positive rates of ~3% for both TMR and QD IC cases. We note that it is more common to establish positive detection based on the mean intensity for controls, and then subtract this value from all other conditions. For our data, this approach would have resulted in a false-positive rate of ~45%, and thus our ~3% cut-off was far more stringent. Table 1 summarizes results from three independent experimental replicates for the TMR and QD IC cases. After correcting for the false positive rate, signal was detectable from single cells at a rate of 1–13% for TMR and 18–23% for the QD IC, with averages of approximately 6% and 20%, respectively. Thus, we were able to detect TNF-α secretion from >3-fold more single cells using the QD IC. TNF-α concentration was then quantified using calibration curves and regression analysis and converted to number of molecules secreted per cell (see Supplementary Information, Fig. S8). Finally, we corrected for our false positive rate by removing cells (~3% of the total population) from the lowest concentrations, and the resulting histograms are displayed in Fig. 4E. For TMR, cells were only positive if they secreted at least 10,000 molecules (~60 pM or 1 ng/ml), which is consistent with previous studies.19,29 For the QD IC, ~50% of positive cells secreted >10,000 molecules, and this population had a similar distribution as TMR, except for an abrupt truncation at ~400,000 molecules/cell (~1500 pM or 25 ng/ml) that was most likely due to QD homoquenching. The remaining positive cells secreted TNF-α at levels that could not be detected by TMR, extending all the way down to 1.3 molecules/well (~5 fM or 0.1 pg/ml). We note that obtaining near single molecule resolution is reasonable since 5 fM is ~50-fold higher than the detection threshold determined for the QD IC (180 aM, see 0.1 pg/ml results in Fig. 3). However, it is important to note that these numbers refer to captured TNF-α. At this time we cannot confirm the number of molecules secreted, as this is a function of antibody binding properties and possibly TNF-alpha oligomerization. We can conclude that our QD-based imaging method provides the maximum detection sensitivity possible for single cell secretion studies. Moreover, there is considerable detection potential, as much as 100-fold, remaining to be leveraged for multiplexing purposes. Methods that pattern different capture antibodies into barcodes require larger wells, which dilutes analyte concentration.21,22 Alternatively, multiple capture antibodies can be conjugated to the same surface to enable detection by a set of probes with distinct emission spectra, thus diluting the density of each capture antibody per well.22,24 One or both of these multiplexing strategies could be pursued using our QD-based format while still maintaining detection sensitivity below 5 fM. We do note that the simultaneous use of multiple QDs, even in the IC format, would require careful control of resonance energy transfer (homoquenching and FRET). We also conclude that ~80% of the single cells did not secrete more than one molecule of TNF-α. This corroborates previous work that has established a key role for small numbers of precocious or first responder cells in stimulating larger populations of dendritic cells or macrophages through paracrine signaling.9,29,55,56 To further confirm this interpretation, we performed bulk ELISA experiments using PMA-activated, LSP-stimulated U937 cells and found that secretion rate varied with cell seeding density, and was at least 1,000-fold higher on a per cell basis than single cell studies (see Supplementary Information Results and Fig. S9). Using our QD-based system, we can now confirm that most of the cell population did not respond to LPS at all, while a significant sub-population (~10%) responded weakly by secreting ~2 to 10,000 TNF-α molecules. We will seek to confirm these findings using other cell macrophage cell models, and potentially detection techniques such as single cell RNA sequencing.
Figure 4. Single cell secretion results.
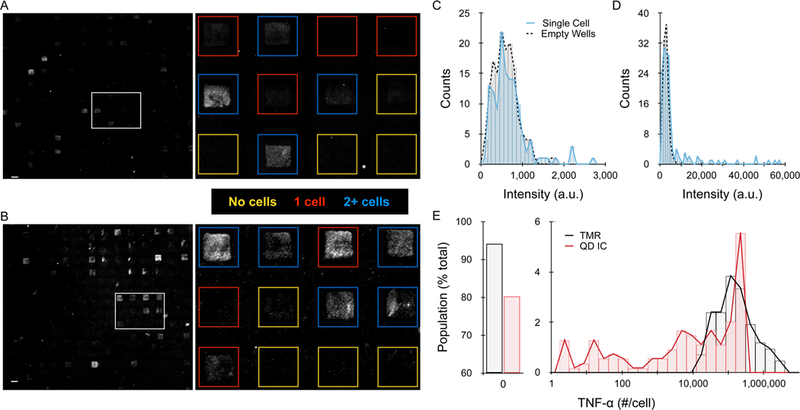
(A,B) Representative detection slide images for (A) TMR and (B) QD IC formats. The dashed box indicates the region that was expanded to the right, with individual wells outlined and color coded based on the presence of 0 (yellow), 1 (red), or multiple (blue) cells as determined by phase contrast imaging. (C,D) Histograms of average well intensity for (C) TMR and (D) QD IC from a representative experimental replicate. Empty well results are indicated by the dotted black line to establish background signals. (E) Histogram of single cell detection results after calibrating TNF-α secretion per cell. Single cells had to secrete >10,000 molecules for detection with TMR, but the QD IC enabled detection down to ~1.3 molecules secreted per cell. Scale bars are 100 μm.
Table 1.
Detection results for single cell secretion experiments for an organic fluorophore (TMR) and QD IC.
| Replicate | TMR (%) | QD IC (%) |
|---|---|---|
| 1 | 4.2 | 18.6 |
| 2 | 12.6 | 18.2 |
| 3 | 0.7 | 22.7 |
| Average | 5.8 +/− 3.5 | 19.8 +/− 1.4 |
Conclusions
In this work, we advanced the detection sensitivity of QD sandwich immunoassays for soluble proteins using single QD imaging and amplification of binding using bioorthogonal chemical reaction, reaching a lower threshold of 60 aM. To our knowledge, this is the lowest detection threshold that has been achieved using a non-enzymatic, probe-based method. Our detection format used a simple sandwich immunoassay and standard fluorescence microscope, and thus comes with additional benefits such as assay speed, simplicity, large dynamic range, and the spatial resolution essential for single cell secretion studies. The QD-based detection method increased the number of single cells that could be interrogated for TNF-α secretion by 3-fold in comparison to an organic fluorophore, which was achieved by extending detection range down to nearly 1 molecule captured per microwell. We acknowledge that organic fluorophore results could be improved using amplification methods such as multi-round labeling,20 FLUOROSpot, or ultrafast polydopamine deposition,31 but these assays are more complex, may be difficult to quantitate, and will still not reach the detection sensitivity of our one-step, non-enzymatic, QD-based assay. Presumably, comparable results could be achieved using a single fluorophore imaging technique such as super resolution microscopy, but this would significantly increase imaging time, complexity, and cost. This study will significantly improve the detection capacity of single cell secretion studies, enabling interrogation at earlier time points and/or lower secretion rates. Future work will investigate the implications of this new capability in biologically relevant models, with a particular focus on assessing macrophage polarization under different microenvironmental stimuli such as well size, shape, and extracellular matrix type using our three-component well system,29 as well as analyzing immune cells isolated from various disease models including solid tumors. We will also adapt the technique to diverse soluble protein targets to validate these findings and enable multiplexing capabilities. We acknowledge that unforeseen challenges may be encountered when we move to in vivo applications, such as oligomerization, or different targets, such as variable antibody binding affinities. Finally, we will explore ways of directly assessing or eliminating the homoquenching effects that we believe complicated analysis of the ChemAmp technique so that we can leverage the lowest detection threshold possible.
Supplementary Material
Acknowledgements
This work was supported by the National Institutes of Health (NIH) National Cancer Institute (NCI) under Award Numbers R21CA206953 and P30CA062203, NIH National Institute of Dental and Craniofacial Research (NIDCR) under Award Number DP2DE023319, and the Interdisciplinary Innovation Initiative in the Henry Samueli School of Engineering at the University of California Irvine. V. H. was supported by the National Science Foundation (NSF) Graduate Research Fellowship Program (DGE-1321846).
Footnotes
Supplementary Information
Methods, Results, and Discussion for image processing and bulk ELISA experiments. Supplementary figures include TNF-α detection using QD in microtiter plates, TNF-α detection by imaging with TMR-modified detection antibody, QD fluorescence images for all TNF-α concentrations, image analysis of fluorescent spots including intensity vs area plots for ChemAmp and QD IC cases, calibration of TNF-α for single cell secretion studies, and bulk TNF-α secretion experiments at different cell densities.
References
- 1.Altschuler SJ and Wu LF, Cell, 2010, 141, 559–63. [DOI] [PMC free article] [PubMed] [Google Scholar]
- 2.Chattopadhyay PK, Gierahn TM, Roederer M and Love JC, Nat. Immunol, 2014, 15, 128–35. [DOI] [PMC free article] [PubMed] [Google Scholar]
- 3.Gawad C, Koh W and Quake SR, Nat. Rev. Genet, 2016, 17, 175–88. [DOI] [PubMed] [Google Scholar]
- 4.Proserpio V and Mahata B, Immunology, 2016, 147, 133–40. [DOI] [PMC free article] [PubMed] [Google Scholar]
- 5.Heath JR, Ribas A and Mischel PS, Nat. Rev. Drug Discov, 2016, 15, 204–16. [DOI] [PMC free article] [PubMed] [Google Scholar]
- 6.Neu KE, Tang Q, Wilson PC and Khan AA, Trends Immunol, 2017, 38, 140–9. [DOI] [PMC free article] [PubMed] [Google Scholar]
- 7.Taniguchi Y, Choi PJ, Li GW, Chen H, Babu M, Hearn J, Emili A and Xie XS, Science, 2010, 329, 533–8. [DOI] [PMC free article] [PubMed] [Google Scholar]
- 8.Trapnell C, Cacchiarelli D, Grimsby J, Pokharel P, Li S, Morse M, Lennon NJ, Livak KJ, Mikkelsen TS and Rinn JL, Nat. Biotechnol, 2014, 32, 381–6. [DOI] [PMC free article] [PubMed] [Google Scholar]
- 9.Shalek AK, Satija R, Shuga J, Trombetta JJ, Gennert D, Lu D, Chen P, Gertner RS, Gaublomme JT, Yosef N, Schwartz S, Fowler B, Weaver S, Wang J, Wang X, Ding R, Raychowdhury R, Friedman N, Hacohen N, Park H, May AP and Regev A, Nature, 2014, 510, 363–9. [DOI] [PMC free article] [PubMed] [Google Scholar]
- 10.Ramsköld D, Luo S, Wang YC, Li R, Deng Q, Faridani OR, Daniels GA, Khrebtukova I, Loring JF, Laurent LC, Schroth GP and Sandberg R, Nat. Biotechnol, 2012, 30, 777–82. [DOI] [PMC free article] [PubMed] [Google Scholar]
- 11.Patel AP, Tirosh I, Trombetta JJ, Shalek AK, Gillespie SM, Wakimoto H, Cahill DP, Nahed BV, Curry WT, Martuza RL, Louis DN, Rozenblatt-Rosen O, Suvà ML, Regev A and Bernstein BE, Science, 2014, 344, 1396–401. [DOI] [PMC free article] [PubMed] [Google Scholar]
- 12.Lawson DA, Bhakta NR, Kessenbrock K, Prummel KD, Yu Y, Takai K, Zhou A, Eyob H, Balakrishnan S, Wang CY, Yaswen P, Goga A and Werb Z, Nature, 2015, 526, 131–5. [DOI] [PMC free article] [PubMed] [Google Scholar]
- 13.Tirosh I, Izar B, Prakadan SM, Wadsworth MH, Treacy D, Trombetta JJ, Rotem A, Rodman C, Lian C, Murphy G, Fallahi-Sichani M, Dutton-Regester K, Lin JR, Cohen O, Shah P, Lu D, Genshaft AS, Hughes TK, Ziegler CG, Kazer SW, Gaillard A, Kolb KE, Villani AC, Johannessen CM, Andreev AY, Van Allen EM, Bertagnolli M, Sorger PK, Sullivan RJ, Flaherty KT, Frederick DT, Jané-Valbuena J, Yoon CH, Rozenblatt-Rosen O, Shalek AK, Regev A and Garraway LA, Science, 2016, 352, 189–96. [DOI] [PMC free article] [PubMed] [Google Scholar]
- 14.Wei W, Shin YS, Xue M, Matsutani T, Masui K, Yang H, Ikegami S, Gu Y, Herrmann K, Johnson D, Ding X, Hwang K, Kim J, Zhou J, Su Y, Li X, Bonetti B, Chopra R, James CD, Cavenee WK, Cloughesy TF, Mischel PS, Heath JR and Gini B, Cancer Cell, 2016, 29, 563–73. [DOI] [PMC free article] [PubMed] [Google Scholar]
- 15.Li H, Courtois ET, Sengupta D, Tan Y, Chen KH, Goh JJL, Kong SL, Chua C, Hon LK, Tan WS, Wong M, Choi PJ, Wee LJK, Hillmer AM, Tan IB, Robson P and Prabhakar S, Nat. Genet, 2017, 49, 708–18. [DOI] [PubMed] [Google Scholar]
- 16.Su Y, Wei W, Robert L, Xue M, Tsoi J, Garcia-Diaz A, Homet Moreno B, Kim J, Ng RH, Lee JW, Koya RC, Comin-Anduix B, Graeber TG, Ribas A and Heath JR, Proc. Natl. Acad. Sci. U. S. A, 2017, 114, 13679–84. [DOI] [PMC free article] [PubMed] [Google Scholar]
- 17.Pilbrough W, Munro TP and Gray P, PLoS One, 2009, 4, e8432. [DOI] [PMC free article] [PubMed] [Google Scholar]
- 18.Yalçın A, Yamanaka YJ and Love JC, Methods Mol Biol, 2012, 853, 211–35. [DOI] [PubMed] [Google Scholar]
- 19.Love JC, Ronan JL, Grotenbreg GM, van der Veen AG and Ploegh HL, Nat. Biotechnol, 2006, 24, 703–7. [DOI] [PubMed] [Google Scholar]
- 20.Ma C, Fan R, Ahmad H, Shi Q, Comin-Anduix B, Chodon T, Koya RC, Liu CC, Kwong GA, Radu CG, Ribas A and Heath JR, Nat. Med, 2011, 17, 738–43. [DOI] [PMC free article] [PubMed] [Google Scholar]
- 21.Lu Y, Chen JJ, Mu L, Xue Q, Wu Y, Wu PH, Li J, Vortmeyer AO, Miller-Jensen K, Wirtz D and Fan R, Anal Chem, 2013, 85, 2548–56. [DOI] [PMC free article] [PubMed] [Google Scholar]
- 22.Lu Y, Xue Q, Eisele MR, Sulistijo ES, Brower K, Han L, Amir E-AD, Pe’er D, Miller-Jensen K and Fan R, Proc. Natl. Acad. Sci. U. S. A, 2015, 112, E607–15. [DOI] [PMC free article] [PubMed] [Google Scholar]
- 23.Han Q, Bradshaw EM, Nilsson B, Hafler DA and Love JC, Lab Chip, 2010, 10, 1391–400. [DOI] [PMC free article] [PubMed] [Google Scholar]
- 24.Han Q, Bagheri N, Bradshaw EM, Hafler DA, Lauffenburger DA and Love JC, Proc. Natl. Acad. Sci. U. S. A, 2012, 109, 1607–12. [DOI] [PMC free article] [PubMed] [Google Scholar]
- 25.Adalsteinsson VA, Tahirova N, Tallapragada N, Yao X, Campion L, Angelini A, Douce TB, Huang C, Bowman B, Williamson CA, Kwon DS, Wittrup KD and Love JC, Integr. Biol. (Camb.), 2013, 5, 1272–81. [DOI] [PMC free article] [PubMed] [Google Scholar]
- 26.Elitas M, Brower K, Lu Y, Chen JJ and Fan R, Lab Chip, 2014, 14, 3582–8. [DOI] [PMC free article] [PubMed] [Google Scholar]
- 27.Yao X, Choudhury AD, Yamanaka YJ, Adalsteinsson VA, Gierahn TM, Williamson CA, Lamb CR, Taplin ME, Nakabayashi M, Chabot MS, Li T, Lee GS, Boehm JS, Kantoff PW, Hahn WC, Wittrup KD and Love JC, Integr. Biol. (Camb.), 2014, 6, 388–98. [DOI] [PMC free article] [PubMed] [Google Scholar]
- 28.Liao MC, Muratore CR, Gierahn TM, Sullivan SE, Srikanth P, De Jager PL, Love JC and Young-Pearse TL, J. Neurosci, 2016, 36, 1730–46. [DOI] [PMC free article] [PubMed] [Google Scholar]
- 29.McWhorter FY, Smith TD, Luu TU, Rahim MK, Haun JB and Liu WF, Integr. Biol. (Camb.), 2016, 8, 751–60. [DOI] [PubMed] [Google Scholar]
- 30.Rissin DM, Kan CW, Campbell TG, Howes SC, Fournier DR, Song L, Piech T, Patel PP, Chang L, Rivnak AJ, Ferrell EP, Randall JD, Provuncher GK, Walt DR and Duffy DC, Nat. Biotechnol, 2010, 28, 595–9. [DOI] [PMC free article] [PubMed] [Google Scholar]
- 31.Li J, Baird MA, Davis MA, Tai W, Zweifel LS, Adams Waldorf KM, Gale M, Rajagopal L, Pierce RH and Gao X, Nat. Biomed. Eng, 2017, 1, 0082. [DOI] [PMC free article] [PubMed] [Google Scholar]
- 32.Decrop D, Pardon G, Brancato L, Kil D, Zandi Shafagh R, Kokalj T, Haraldsson T, Puers R, van der Wijngaart W and Lammertyn J, ACS Appl. Mater. Interfaces, 2017, 9, 10418–26. [DOI] [PubMed] [Google Scholar]
- 33.Alivisatos P, Nat. Biotechnol, 2004, 22, 47–52. [DOI] [PubMed] [Google Scholar]
- 34.Medintz IL, Uyeda HT, Goldman ER and Mattoussi H, Nat. Mater, 2005, 4, 435–46. [DOI] [PubMed] [Google Scholar]
- 35.Anker JN, Hall WP, Lyandres O, Shah NC, Zhao J and Van Duyne RP, Nat. Mater, 2008, 7, 442–53. [DOI] [PubMed] [Google Scholar]
- 36.Haun JB, Yoon TJ, Lee H and Weissleder R, Wiley Interdiscip. Rev. Nanomed. Nanobiotechnol, 2010, 2, 291–304. [DOI] [PubMed] [Google Scholar]
- 37.Giljohann DA and Mirkin CA, Nature, 2009, 462, 461–4. [DOI] [PMC free article] [PubMed] [Google Scholar]
- 38.Chinen AB, Guan CM, Ferrer JR, Barnaby SN, Merkel TJ and Mirkin CA, Chem. Rev, 2015, 115, 10530–74. [DOI] [PMC free article] [PubMed] [Google Scholar]
- 39.Nam JM, Thaxton CS and Mirkin CA, Science, 2003, 301, 1884–6. [DOI] [PubMed] [Google Scholar]
- 40.Li D, Wang C, Sun G, Senapati S and Chang HC, Biosens. Bioelectron, 2017, 97, 143–9. [DOI] [PubMed] [Google Scholar]
- 41.Kerman K, Endo T, Tsukamoto M, Chikae M, Takamura Y and Tamiya E, Talanta, 2007, 71, 1494–9. [DOI] [PubMed] [Google Scholar]
- 42.Yan J, Hu M, He Y, Zhao R, Jiang X, Song S, Wang L and Fan C, Nano Res, 2008, 1, 490–6. [Google Scholar]
- 43.Mukundan H, Xie H, Anderson AS, Grace WK, Shively JE and Swanson BI, Bioconjug. Chem, 2009, 20, 222–30. [DOI] [PubMed] [Google Scholar]
- 44.Hu M, He Y, Song S, Yan J, Lu HT, Weng LX, Wang LH and Fan C, Chem. Commun. (Camb), 2010, 46, 6126–8. [DOI] [PubMed] [Google Scholar]
- 45.Hu M, Yan J, He Y, Lu H, Weng L, Song S, Fan C and Wang L, ACS Nano, 2010, 4, 488–94. [DOI] [PubMed] [Google Scholar]
- 46.Dahan M, Lévi S, Luccardini C, Rostaing P, Riveau B and Triller A, Science, 2003, 302, 442–5. [DOI] [PubMed] [Google Scholar]
- 47.Pinaud F, Clarke S, Sittner A and Dahan M, Nat. Methods, 2010, 7, 275–85. [DOI] [PubMed] [Google Scholar]
- 48.Haun JB, Devaraj NK, Hilderbrand SA, Lee H and Weissleder R, Nat. Nanotechnol, 2010, 5, 660–5. [DOI] [PMC free article] [PubMed] [Google Scholar]
- 49.Haun JB, Devaraj NK, Marinelli BS, Lee H and Weissleder R, ACS Nano, 2011, 5, 3204–13. [DOI] [PMC free article] [PubMed] [Google Scholar]
- 50.Haun JB, Castro CM, Wang R, Peterson VM, Marinelli BS, Lee H and Weissleder R, Sci. Transl. Med, 2011, 3, 71ra16. [DOI] [PMC free article] [PubMed]
- 51.Rahim MK, Kota R and Haun JB, Bioconjug. Chem, 2015, 26, 352–60. [DOI] [PMC free article] [PubMed] [Google Scholar]
- 52.Rahim MK, Kota R, Lee S and Haun JB, Nanotechnology Reviews, 2013, 2, 215–27. [Google Scholar]
- 53.Devaraj NK, Upadhyay R, Haun JB, Hilderbrand SA and Weissleder R, Angew. Chem. Int. Ed. Engl, 2009, 48, 7013–6. [DOI] [PMC free article] [PubMed] [Google Scholar]
- 54.Corti A, Fassina G, Marcucci F, Barbanti E and Cassani G, Biochem. J, 1992, 284, 905–10. [DOI] [PMC free article] [PubMed] [Google Scholar]
- 55.Patil S, Fribourg M, Ge Y, Batish M, Tyagi S, Hayot F and Sealfon SC, Sci. Signal, 2015, 8, ra16. [DOI] [PubMed]
- 56.Xue Q, Lu Y, Eisele MR, Sulistijo ES, Khan N, Fan R and Miller-Jensen K, Sci. Signal, 2015, 8, ra59. [DOI] [PMC free article] [PubMed]
Associated Data
This section collects any data citations, data availability statements, or supplementary materials included in this article.