

Abstract
In situ capillary microsampling with capillary electrophoresis (CE) electrospray ionization (ESI) mass spectrometry (MS) enabled characterization of cationic metabolites in single cells in complex tissues and organisms. For deeper coverage of the metabolome and metabolic networks, analytical approaches are needed that provide complementary detection for anionic metabolites, ideally using the same instrumentation. Described here is one such approach that enables sequential cationic and anionic (dual) analysis of the same identified cell in a live vertebrate embryo. A calibrated volume was microaspirated from the animal-dorsal cell in a live 8-cell embryo of Xenopus laevis, and cationic and anionic metabolites were one-pot microextracted from the aspirate, followed by CE-ESI-MS analysis of the same extract. A laboratory-built CE-ESI interface was reconfigured to enable dual cationic-anionic analysis with ~5–10 nM (50–100 amol) lower limit of detection and capability for quantification. To provide robust separation and efficient ion generation, the CE-ESI interface was enclosed in a nitrogen gas filled chamber, and the operational parameters were optimized for the cone-jet spraying regime in both the positive and negative ion mode. A total of ~250 cationic and ~200 anionic molecular features were detected from the cell between m/z 50–500, including 60 and 24 identified metabolites, respectively. With only 11 metabolites identified mutually, the duplexed approach yielded complementary information on metabolites produced in the cell, which in turn deepened network coverage for several metabolic pathways. With scalability to smaller cells and adaptability to other types of tissues and organisms, dual cationic-anionic detection with in situ CE-ESI-MS opens a door to better understand cell metabolism.
Keywords: single-cell analysis, mass spectrometry, capillary electrophoresis, metabolomics, Xenopus laevis
INTRODUCTION
Single-cell mass spectrometry (MS) provides a molecular snapshot to investigate the phenotypical and physiological state of a cell;1 the technology is qualitative, capable of label-free detection, and can be made quantitative. As a downstream product of transcription and translation, the metabolome, comprising of all metabolites produced by a cell, responds dynamically and rapidly to intrinsic and extrinsic events to the cell. Therefore, the single-cell metabolome raises a new frontier in the study of molecular events underlying cell differentiation and the establishment of cell-to-cell differences (cell heterogeneity) during normal and impaired development.
Detection of the single-cell metabolome presents grand analytical challenges for MS. The metabolome encompasses vast molecular complexity and spans a broad dynamic range of concentration. For example, the Human Metabolome Database (HMDB)2 currently reports ~114,100 metabolite entries with endogenous concentrations ranging from <1 nM to millimolar concentration. Metabolites also occupy a broad spectrum of physiochemical properties1 (e.g., pKa and hydrophobicity) and can change rapidly (e.g., in seconds–milliseconds). In addition, cells contain substantially smaller amounts of material than typically measured by MS. Other challenges arise from varying dimensions as cells develop and different physical and temporal positions that they assume in tissues and developing organism. For example, blastomeres become progressively smaller and undergo long-range movements during morphogenesis in vertebrate embryos.3 To better understand cell metabolism, specialized approaches are required that integrate spatially and temporally scalable sample collection, particularly in complex tissues and organisms, with trace-sensitive MS for broad types of metabolites.
These analytical challenges stimulated the development of specialized technologies and methodologies in single-cell MS. A detailed overview of this field is available in recent reviews (see references 1, 4–10). Ablation/desorption by focused laser light10 or direct aspiration using microfabricated capillaries11–14 extended the capabilities of single-cell MS to single cells in isolated or complex tissues. Chemical separation prior to ionization and MS effectively increased metabolomic coverage by minimizing ionization and spectral interferences as well as facilitating molecular identifications by providing separation time, a compound-dependent information. With high separation performance and a compatibility to volume-limited samples, capillary electrophoresis (CE) found a niche in qualitative and quantitative metabolomics for single cells. The integration of CE with matrix-assisted laser desorption ionization (MALDI) recently enabled high-throughput screening of single-cell metabolism in pancreatic islets.15
We and others custom-built microanalytical CE-ESI platforms capable of low nanomolar sensitivity (tens of attomoles). These instruments enabled the profiling of ~40 identified metabolites in single neurons from Aplysia californica 16–18 and rat 18, 19 as well as ~80 identified metabolites in single embryonic cells in 8-13, 20, 21, 16-13, 22, and 32-cell13 embryos of Xenopus laevis, the South African clawed frog. Furthermore, to enable spatially and temporally resolved single-cell analysis in live developing X. laevis embryos13 (see protocol in reference 23), we recently integrated microprobe sampling with CE-MS. However, limited ESI stability in the negative ion mode so far curtailed single-cell CE-MS studies to cationic metabolites. Deeper coverage of the single-cell metabolome would benefit from combined analysis of cationic and anionic species.
Recent developments in CE-MS technology raise a potential toward anionic metabolomics in single cells (see reviews in references 24–27). Low limits of detections (~10–200 nM) and high measurement reproducibility were accomplished for anions from metabolite standards and extracts of tissues and biological fluids using CE-MS interfaces that employ sheathflow28, 29, low-flow electrokinetically-pumped30, 31, and sheathless32 interface designs. Nucleotides were most recently profiled in single neurons from Aplysia californica using a coaxial sheath-flow CE-ESI interface.28 In principle, the combination of cationic and anionic analysis holds the potential to deepen metabolic coverage in single cells. However, individual cells contain prohibitively limited amounts of materials for independent sample processing that is typical for cationic and anionic analysis. Additionally, complex CE-ESI interface designs and the use of different CE capillaries for cationic and anionic measurements (e.g., coated capillaries) lower analytical throughput, hindering the analysis of multiple single cells to facilitate results interpretation.
Described here is a simplified methodology that enables the dual analysis of cationic and anionic metabolites in single cells of live embryos. We used capillary microsampling to collect cell material from identified single cells in live X. laevis embryos, which was followed by a one-pot micro extraction of anionic and cationic metabolites from the collected material. A custom-built sheath-flow CE-ESI interface was supplemented with a nitrogen gas filled environmental chamber to minimize electrical discharges at the electrospray emitter to ensure stable and efficient ion generation for detection. Cationic and anionic analysis using the same bare fused silica capillary with different electrolytes provided complementary metabolite identifications, yielding a deeper coverage of metabolic networks than was feasible using each approach in isolation using single-cell CE-ESI-MS.
EXPERIMENTAL
Chemicals.
LC-MS grade solvents and chemicals including formic acid, ammonium bicarbonate, methanol, acetonitrile, isopropanol, and water were purchased from Fisher Scientific (Fair Lawn, NJ), unless otherwise noted. Trizma hydrochloride and trizma base were obtained from Sigma Aldrich (Saint Louis, MO). Cysteine was from MP Biomedicals (Solon, OH).
Solutions.
Steinberg’s solution (100% v/v) and cysteine solution (2% v/v) were prepared following standard protocols.3 The “metabolite extraction solvent” consisted of 40% (v/v) methanol and 40% (v/v) acetonitrile (pH 4.7). For cationic analysis, the CE “background electrolyte” (BGE) solution was 1% (v/v) formic acid (pH 2.8) and the electrospray sheath solution was 50% (v/v) methanol containing 0.1% (v/v) formic acid. For anionic analysis, the BGE was 20 mM ammonium bicarbonate (pH 8.2), and the electrospray sheath solution was 0.2 mM ammonium bicarbonate in 50% (v/v) isopropanol.
Animal Care and Embryo Collection.
All protocols regarding the humane care and handling of animals were approved by the University of Maryland Institutional Animal Care and Use Committee (IACUC no. R-DEC-17–57). Male and female adult Xenopus laevis frogs were purchased from Nasco (Fort Atkinson, WI) and maintained in a breeding colony. Embryos were obtained via gonadotropin-induced natural mating following established protocols.3 The jelly coating of freshly laid embryos was removed as described elsewhere.33 Dejellied embryos were transferred to a Petri dish containing 100% Steinberg’s solution (SS). Two-cell stage embryos showing stereotypical pigmentation patterns34 across the dorsal-ventral and left-right axis were cultured in 100% SS to the 8-cell stage for this study.
Single-cell Sampling and Metabolite Extraction.
The left animal-ventral (V1) cell was identified in 8-cell embryos in reference to established cell-fate maps.35 An ~10 nL of cellular content was aspirated from the cell using microcapillary sampling following our recent protocols.13, 23 To extract small polar metabolites from the aspirate, the sample was expelled into 4 μL of metabolite extraction solution at ~4 °C and vortex-mixed for ~1 min at room temperature before centrifugation at 8,000 × g for 5 min at 4 °C to pellet cell debris. Metabolite extracts were stored together with the cell debris at −80 °C until CE-ESI-MS analysis.
Single-cell CE-ESI-MS.
Single-cell metabolite extracts were measured using a laboratory-built microanalytical CE-ESI system coupled to a quadrupole time-of-flight mass spectrometer (Impact HD, Bruker Daltonics, Billerica, MA), following our established protocols.13, 22, 23 In this study, CE separation was performed in a 1-meter long bare fused silica capillary with 40/105 μm inner/outer diameter (Polymicro Technologies, Phoenix, AZ) with the outlet end grounded using a custom-built co-axial sheath-flow CE-ESI interface18. Cationic analysis implemented the following parameters: CE separation at +20–22 kV (applied to capillary inlet) in 1% formic acid (yielding ~7.5–8 μA CE current); CE-ESI interface operated in the cone-jet regime (0.1% formic acid in 50% methanol supplied at 1 μL/min as sheath flow) at –1,700 V spray potential applied to mass spectrometer front plate; CE-ESI environmental chamber, no nitrogen supplied (ambient air as bath gas). Anionic analysis was performed using the following settings: CE separation at +17–19 kV (applied to capillary inlet) in 20 mM ammonium bicarbonate (yielding 4.9–5.6 μA CE current); CE-ESI interface operated in the cone-jet electrospray regime (0.2 mM ammonium bicarbonate in 50% isopropanol supplied at 0.6 μL/min as sheath) at +2,100 V spray potential applied to the mass spectrometer front plate; CE-ESI environmental chamber, nitrogen supplied at 0.6 L/min. In both cationic and anionic measurements, the stability of the CE-ESI interface was characterized by ion current measurements using a mass spectrometer and by direct optical inspection of the electrified liquid meniscus using a stereomicroscope (40× magnification, Simul-Focal Stereomicroscope, United Scope, Irvine, CA). Identification of the electrospray regimes was performed as detailed elsewhere.36
Ions generated by CE-ESI were detected using a quadrupole time-of-flight mass spectrometer (Impact HD, Bruker). Experimental settings were the following: MS survey scan rate, 2 Hz; mass range (MS1 and MS2), m/z 50–550; collision-induced dissociation, 18–20 eV in nitrogen collision gas; dry gas, nitrogen at 2 L/min at 100 °C for positive and 150 °C for negative ionization mode. The mass spectrometer was externally mass-calibrated to <5 ppm accuracy by analyzing 150 mM sodium formate using CE-ESI in the positive ion mode and directly infusing 10 mM sodium formate (in 0.2 mM ammonium bicarbonate prepared with 50% v/v isopropanol) through the CE-ESI interface in the negative ion mode.
Data Analysis.
Raw MS-MS/MS data were processed using a custom-written script in Compass DataAnalysis version 4.3 (Bruker Daltonics) as described elsewhere.22 Briefly, each file was externally calibrated to <1 ppm accuracy (enhanced quadratic calibration mode) for sodium formate cluster ions that were formed in the ion source as salts separated from the samples, molecular features were semi-manually surveyed between m/z 50–550 with 5 mDa increments, and the resulting accurate m/z and migration time information was recorded for each detected molecular feature. Under-the-curve peak areas and signal-to-noise (signal/noise) ratios were calculated using Compass 4.3 (Bruker Daltonics). Metabolic pathway analysis was performed in MetaboAnalyst 4.037 using the Kyoto Encyclopedia of Genes and Genome (KEGG) metabolomic knowledgebase (www.genome.jp/kegg) with the following settings: Pathway library, Danio rerio (zebrafish); pathway analysis algorithms, overrepresentation analysis by hypergeometric test and pathway topology analysis by relative betweenness centrality.
Study Design.
To account for biological variability, a total of N = 4 different V1 cells were analyzed in this study, each from a different embryo from a different clutch over a three-month period. For each cell, dual cationic-anionic analysis was performed in technical duplicate–triplicate.
Safety Considerations.
Standard safety procedures were followed when handling chemicals and biological samples. Capillary micropipettes and electrospray emitters, which pose a potential puncture hazard, were handled with gloves and safety goggles. To prevent against electrical shock hazard posed by high voltage, all electrically connective parts of the CE-ESI setup were earth-grounded and isolated in an enclosure equipped with a safety interlock-enabled door.
RESULTS AND DISCUSSION
Technology Development.
The goal of this study was to enhance the characterization of small polar metabolites in single cells, specifically in identified blastomeres directly in live embryos. We recently adapted in situ sampling by a microprobe to a microanalytical CE-ESI-MS platform to enable the metabolic analysis of single cells in X. laevis embryos.13, 23 This approach allowed the detection of ~80 identified small polar metabolites and revealed quantitative metabolic changes as single cells divide to form cell clones in the 8–32-cell embryo.13 However, microprobe CE-ESI-MS was restricted to cationic analysis due to frequent electrical breakdowns that destabilized the electrospray in the negative ion mode (ESI–). Theoretically, the standard metabolomics approach to perform independent analysis of cations and anions can deepen the detectable portion of the single-cell metabolome. However, two-step metabolite extraction is challenging or incompatible for single cells due to i) the limited amounts of material that are available from a single cell and ii) cell heterogeneity hindering the use of multiple cells, even from the same cell type, for sample processing.
Here, we addressed this technical limitation by enabling dual cationic-anionic characterization of the same single identified cell in live embryos using CE-ESI-MS. Our strategy (Fig. 1) extended microprobe single-cell sampling13, 23 with essentially a one-pot microextraction of cationic and anionic metabolites and also advanced CE-ESI-MS detection to the negative ion mode (Fig. 2). For technology development and validation, the left-ventral (V1) cell was used in 8-cell X. laevis embryos (see Fig 1, left panel), which is considerably large (~500 μm in diameter, or ~65 nL in volume) to facilitate microprobe sampling and is readily identifiable based on pigmentation, location, and in reference to established cell-fate maps33–35, 38. An ~10 nL volume of the identified cell, corresponding to ~5% of the total cell volume, was withdrawn using a microfabricated capillary mounted to a three-axis translation stage following our recent protocol.13, 23 The aspirate was ejected into 4 μL of 40% aqueous acetonitrile containing 40% methanol, which efficiently extracts small polar metabolites with different physicochemical properties, including acidity and polarity.20 The resulting extract, containing cationic and anionic metabolites, thus raised a possibility for enhanced single-cell metabolomics in the embryo.
Figure 1.
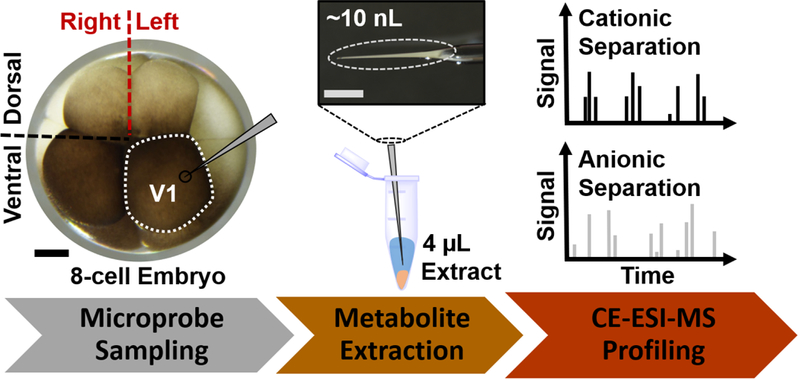
Microprobe CE-ESI-MS strategy to measure cationic and anionic metabolites from the same identified cell in a live X. laevis embryo. Shown here, the left animal-ventral (V1) cell of the 8-cell embryo was identified, and ~10 nL of its content was aspirated for one-pot metabolite extraction, followed by cationic and anionic profiling of the same cell extract. Scale bars = 250 μm.
Figure 2.

CE-ESI-MS for cationic and anionic analysis. (A) The CE-ESI-MS interface with major components labeled. Microscopy comparison of stable Taylor-cone in ESI+ (top panel) and nonaxial (rim) emission (middle panel) and electrical discharge (spark) in ESI– without nitrogen bath gas. (B) Total ion chromatograms revealing stable operation during cationic separation with ESI+ (top panel). Astable ESI– with anionic separation (middle panel) was stabilized upon enclosing the electrospray emitter in a nitrogen-filled environmental chamber (bottom panel). Spray stability is quantified as % relative standard deviation (RSD). Representative mass spectra revealing simplified chemical background during ESI–.
Anionic analysis required extension of cationic CE-ESI-MS to separation and detection of negatively charged metabolites. As an alternative to electron-scavenging reagents39–43 or intricate CE-ESI interface designs28, 30, 32, we opted to refine our laboratory-built CE-ESI platform to ensure stable electrospray operation in the negative ion mode. The setup, shown in Figure 2A, builds on a co-axial sheath-flow interface that we13, 20–23 and others16–19, 44 extensively used for cationic analysis and recently also nucleotide detection28. To minimize/eliminate electrical discharges upon negative ion-mode ESI, we enclosed the CE-ESI emitter tip in a lab-fabricated environmental chamber that was (optionally) purged with dry nitrogen gas at a controllable rate and incident flow angle with respect to the electrospray emitter (see “N2 bath gas”). The chamber was directly mounted on the atmospheric pressure interface of the mass spectrometer and featured a hole to allow fine-positioning of the CE-ESI emitter tip in the chamber in front of the orifice of the mass spectrometer inlet. Bidirectional illumination and a long-working distance stereomicroscope were implemented to monitor the stability of the electrospray.
The stability of the CE-ESI-MS system was evaluated. The electrohydrodynamic behavior of the liquid meniscus was monitored at the tip of the CE-ESI emitter using a stereomicroscope, while the temporal evolution of ion generation was followed using the mass spectrometer. The operational modality of the electrospray was identified according to established nomenclature (reviewed in Refs. 36, 45) as follows (see examples in Fig. 2A, right panel): A stable Taylor-cone with axial spray emission marked the cone-jet regime; a pulsating liquid meniscus with axial spray emission indicated the burst, astable, or pulsing regimes; non-axial spray emission was categorized as “rim emission” in this study. Agreeing with earlier studies (see Ref. 18), the CE-ESI interface yielded stable operation in the cone-jet regime under cationic experimental conditions (see Experimental) in air (no nitrogen bath gas used). Purging of the environmental chamber with a nitrogen bath gas (ambient temperature) at 0.4–1.0 L/min maintained stable operation with a variation of ~6% relative standard deviation (RSD) in total ion current (see Fig. 2B, top panel). Therefore, the CE-ESI setup equipped with the environmental chamber still maintained robust performance for cationic analysis in this study.
The modified CE-ESI setup was tuned for robust anionic analysis. Electrospray polarity switching from cationic measurement conditions destabilized spray generation (data not shown), which worsened upon replacement of the BGE with 20 mM bicarbonate, which was previously used for nucleotide analysis28. Encouraged by this study, we replaced the electrospray sheath solution with 200 μM ammonium bicarbonate in 20%, 50%, and 70% isopropanol to test electrospray stability in the negative ion mode. Although the temporal stability of ion generation improved using a 50% isopropanol solution (Fig. 2B, middle panel), a ~39% RSD in the total ion chromatogram (TIC) in our hand revealed still pronounced fluctuation for quantification. Microscopy inspection of the emitter tip captured frequent transitions between the pulsating (data not shown), rim (see Fig. 2A right panel, middle inset), and cone-jet electrospray regimes with occasional electrical sparks between the emitter tip and the MS orifice plate (see Fig. 2A right panel, bottom inset). These instabilities in electrostatic spraying and consequent ion generation ceased upon continuous purging of the environmental chamber with a steady-stream of nitrogen gas. After optimizing the nitrogen gas flow rate at 0.6 L/min and incidence perpendicularly to the electrospray emitter (see Fig. 2B), the TIC stability was improved to only ~3% RSD variation.
The cationic and anionic separations provided complementary analytical performance for detection. For several metabolite standards (e.g., creatine, lysine), quantification was tested linear between ~100 nM and ~1 μM (regression coefficient, R2 > 0.99) in both modalities, which the digitizer of the mass spectrometer is expected to extend to an ~4-log-order dynamic range following our recent study22. Based on the analysis of a 100 nM creatine standard, the lower limit of detection was extrapolated to 7.5 nM (75 amol) during cationic and 5.5 nM (55 amol) during anionic analysis. Furthermore, mass spectra resulting from anionic measurements contained substantially fewer background ions, which also had lower ion intensities, suggesting minimized spectral interferences compared to cationic analysis. Figure 2B exemplifies detection of the pyridoxal anion at a ~3:1 analyte:background signal ratio (average ESI–) in a sparsely populated spectrum, whereas the cation of this metabolite yielded a ~1:3 ratio in a complex mass spectrum. These analytical figures of merits suggested a potential for sequential cationic and anionic profiling of the same metabolite extract using the same CE-ESI-MS instrument, which we refer to as “dual cationic-anionic” measurement in this report.
Dual Cationic-Anionic Metabolomics of Single Cells.
We applied these methodologies to characterize small metabolites in N = 4 single V1 cells (recall Fig. 1). As described earlier, an ~10 nL portion of the cell was aspirated in situ from a live 8-cell X. laevis embryo using a pulled microcapillary. Small metabolites were extracted from the aspirate in 4 μL of 40% acetonitrile containing 40% methanol. A ~10 nL portion of the resulting extract was analyzed under cationic and then anionic conditions using the same CE-ESI-MS setup and different BGEs. Data-dependent tandem MS was performed to facilitate metabolite identifications. These measurements, thus, consumed a total of ~20 nL, viz. ~0.5% of metabolites that were extracted from the V1 cell. Our recent findings using microsampling13 suggests that microprobe CE-ESI-MS with dual cationic-anionic analysis is scalable to smaller cells and later stages of the developing embryo as well as other tissues and organisms.
These data provided rich metabolic information on the cell. After deisotoping and manual annotation of the MS data, we found ~250 cationic and ~200 anionic nonredundant molecular features between m/z 50–500. These numbers excluded non-covalent clusters as well as signals that originated from the extraction solvents or the culturing media (e.g., polymers from vials and salt peaks). These cationic molecular features agreed with our previous results.13 A comprehensive list of anionic molecular features is provided in Supplementary Information Table 1 (Table S1). Metabolite identifications were made for 60 cationic and 24 anionic molecular features based on accurate mass, isotopic peak distribution analysis, tandem MS, and comparison to MS-MS/MS data recorded on chemical standards, in our previous studies13, 20–23, or published in Metlin,46 MzCloud (www.mzcloud.org), or the Human Metabolome Database (HMDB)2. Metabolite identifications are tabulated for cations in Table S2 and for anions in Table S3.
Cationic and anionic measurements complemented each other. There were noticeable differences between CE separation performance. Figure 3 presents representative extracted ion electropherograms for a subset of identified metabolites from V1 cells. Although most metabolites were separated in a shorter amount of time during cationic analysis, anionic separation provided higher separation efficiency: The average number of theoretical plates (N) was 170,000 for cationic and 200,000 for anionic analyses. These separation performances compare favorably to other CE-ESI designs, including recent low-flow coaxial (N = 15,000 plates/m)30 and sheathless (N = 40,000–60,000 plates/m)32 porous tip sprayer with high-sensitivity detection. Additionally, metabolite identifications were also complementary (Fig. 4). Molecular assignments were made for 60 cations and 24 anions with 11 metabolites identified under both conditions (Fig. 4A). Detection performance was compared based on signal-to-noise (signal/noise) ratios that were calculated for these 11 metabolites (Fig. 4B). The results revealed similar sensitivity for alanine, glutamine, glutamic acid, lysine, and pyridoxal. Cationic analysis yielded higher sensitivity for arginine, creatine, guanine, and hypoxanthine, whereas anionic analysis was more sensitive for asparagine and aspartic acid. Therefore, differences in complementary separation performance and compound-dependent ionization translated into quantitative differences using the cationic and anionic methodologies.
Figure 3.
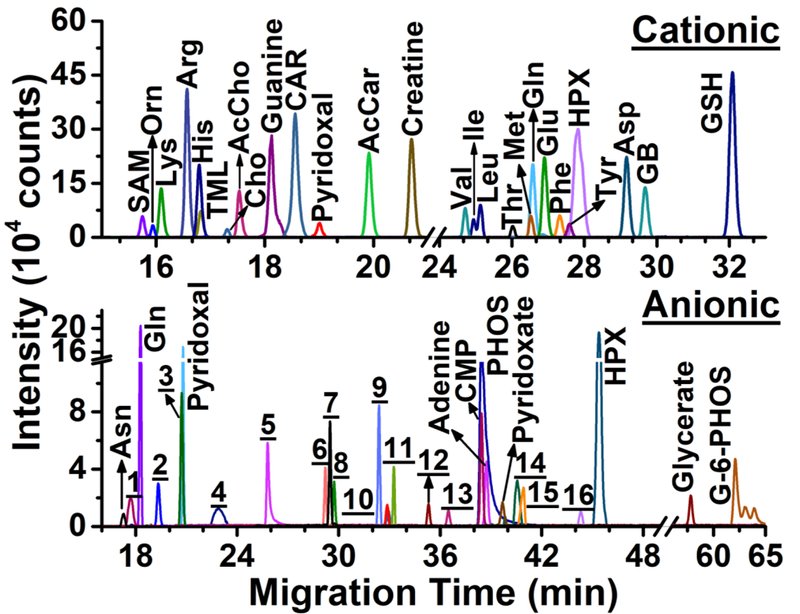
Cationic and anionic profiling of metabolites in the same V1 cell in a live X. laevis embryo. Representative selected ion electropherograms are shown for select signals. Identified metabolites are labeled (see abbreviations in Tables S2–3). Numbers correspond to molecular features in Table S4.
Figure 4.
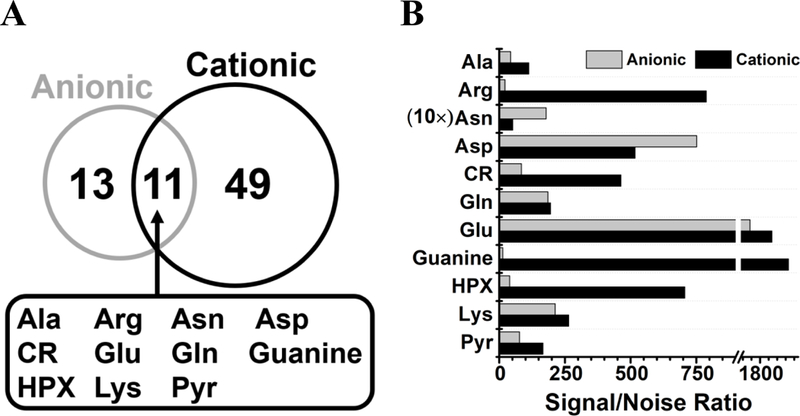
Complementary A) identification and B) quantification of metabolites in single Xenopus laevis V1 cells using dual cationic-anionic microprobe CE-ESI-MS. Key: Cr, creatine; HPX, hypoxanthine; Pyr, pyridoxal.
The identified metabolites enabled pathway enrichment analysis. Metabolites that were identified by anionic, cationic, and dual anionic-cationic analyses were mapped to the KEGG metabolomic knowledgebase using MetaboAnalyst as the search engine (see details in Experimental). Pathway significance was calculated from pathway enrichment analysis, and pathway impact was determined from pathway topology analysis. Figure 5 (top panel) plots pathway significance vs. pathway impact from dual anionic-cationic analysis. Several pathways were enriched to statistical significance (p < 0.05) with pathway impact varying between high (>0.5), modest (0.2–0.5), and low (<0.2). Representative metabolic pathways are labeled in Figure 5 (top panel). For example, arginine-proline and glycine-serine-threonine metabolism were of high impact, whereas enrichment was modest for vitamin B6 metabolism and low for glycero-phospholipid metabolism.
Figure 5.
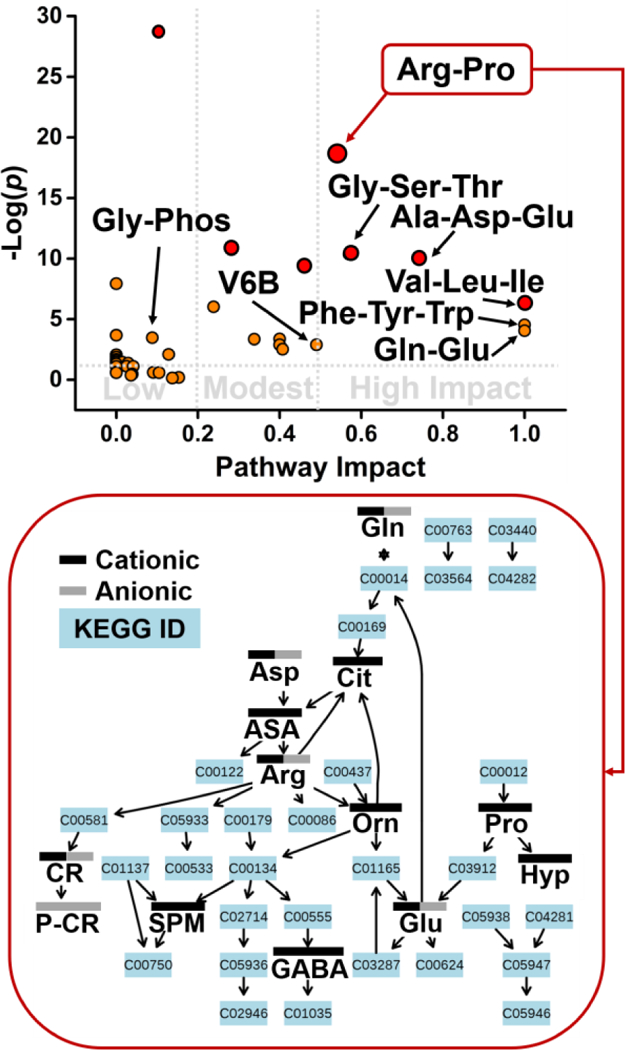
KEGG pathway analysis for metabolites identified in single V1 cells. Values of statistical significance (p) and impact are shown for labeled pathways in Table 1. Pathway view for arginine-proline metabolism marking complementary detection by cationic and anionic analyses. Key: ASA, argininosuccinate; Cit, citrulline; CR, creatine; Gly-Phos, Glycero-phospholipid metabolism; Hyp, hydroxyproline; P-CR, phosphocreatine; SPM, spermidine; V6B, vitamin 6B metabolism.
Furthermore, anionic and cationic analyses provided complementary information for pathway analysis. Table 1 compares pathway enrichment and pathway impact based on metabolites that were identified during the cationic, anionic, and dual cationic-anionic measurements. Cationic and anionic analyses appeared to cover several pathways of high impact, including alanine-aspartate-glutamate, arginine-proline, and glutamine-glutamate. The complementarity of cationic and anionic detection is illustrated for the arginine-proline pathway in Figure 5 (bottom panel). Notably, additional metabolite identifications that resulted from dual cationic-anionic analysis helped improve statistical significance and/or pathway impact for several pathways, including glycerophospholipid and vitamin B6 metabolism (see Table 1). Combined, these results suggest that dual cationic-anionic analysis by microprobe single-cell CE-ESI-MS has the potential to provide deeper coverage of metabolism than feasible by these approaches in isolation.
Table 1.
KEGG pathway analysis (statistical p-value and pathway impact) for metabolites identified in single V1 cells by microprobe CE-ESI-MS. The number of metabolites that participate in canonical networks (“Total”) and identified in this study (“Hits”) are shown.
| Name of Metabolic Pathway | Total | Cationic Analysis | Anionic Analysis | Dual Analysis | ||||||
|---|---|---|---|---|---|---|---|---|---|---|
| Hits | p | Impact | Hits | p | Impact | Hits | p | Impact | ||
| Alanine, aspartate, glutamate | 24 | 7 | 1.06E-05 | 0.74 | 5 | 3.24E-05 | 0.60 | 7 | 4.34E-05 | 0.74 |
| Arginine, proline | 43 | 12 | 7.33E-09 | 0.54 | 7 | 3.57E-06 | 0.23 | 13 | 8.17E-09 | 0.54 |
| Glutamine, glutamate | 5 | 2 | 1.12E-02 | 1.00 | 2 | 2.27E-03 | 1.00 | 2 | 1.75E-02 | 1.00 |
| Glutathione | 26 | 7 | 1.91E-05 | 0.46 | 1 | 0.36 | 0.03 | 7 | 7.69E-05 | 0.46 |
| Glycero-phospholipid | 28 | 2 | 0.265 | 0.03 | 2 | 0.081 | 0.06 | 4 | 0.032 | 0.09 |
| Glycine, serine, threonine | 31 | 7 | 6.66E-05 | 0.57 | 2 | 0.10 | 0.00 | 8 | 3.14E-05 | 0.57 |
| Histidine | 14 | 4 | 1.12E-3 | 0.24 | 2 | 2.26E-02 | 0.00 | 4 | 2.25E-03 | 0.24 |
| Nitrogen | 9 | 4 | 1.61E-4 | 0.00 | 2 | 9.45E-3 | 0.00 | 4 | 3.64e-4 | 0.00 |
| Phenylalanine, tyrosine, tryptophan | 4 | 2 | 7.21E-03 | 1.00 | 0 | 0 | 0.00 | 2 | 7.21E-03 | 1.00 |
| Valine, leucine, isoleucine | 13 | 4 | 8.21E-04 | 1.00 | 0 | 0 | 0.00 | 4 | 8.21E-04 | 1.00 |
| Vitamin B6 | 9 | 1 | 0.281 | 0.49 | 1 | 0.145 | 0.00 | 2 | 0.056 | 0.49 |
CONCLUSIONS
In this study, we advanced CE-ESI-MS technology to enable dual cationic-anionic analysis of metabolites in single embryonic cells. In situ microprobe sampling using a microfabricated capillary allowed us to sample an identified cell directly in a live X. laevis embryo under optical guidance by a stereomicroscope. To analyze metabolites extracted from the collected cell content, we equipped an in-house built CE-ESI-MS22 platform with dual capability to perform cationic and anionic analysis using different BGEs for separation, without modifying the setup between sequential measurements. Optimization of experimental variables and the use of a nitrogen bath gas to minimize/eliminate electrical breakdown upon negative electrospray ensured sufficiently reproducible and robust operation for single-cell investigations in trace sensitivity (~5 nM, viz. ~50 amol demonstrated here).
The approach affords analytical benefits for biological studies on single cells. In situ microprobe sampling is compatible with complex tissues and organisms, as we demonstrated for 8-cell embryos of X. laevis in this work. CE-ESI-MS consumes sufficiently small amounts of extracts to afford multiple analysis of the same extract under cationic and anionic conditions. With complementary performance, the metadata resulting from these approaches improved metabolite identifications and quantification, which in turn led to better coverage of metabolic networks in single cells. This study design complements earlier works in which bare fused or coated capillaries were used to deepen metabolic coverage. Further improvements in detection sensitivity and expansion of metabolomic MS–MS/MS databases are needed to help identification of molecular features that were detectable from the single cells. Combined, results from this study and recent works13, 19, 22, 28 suggest that dual cationic and anionic microprobe CE-ESI-MS is scalable to smaller cells and other types of cells and organisms to understand cell biology at the level of small molecules: the metabolome.
Supplementary Material
ACKNOWLEDGEMENT.
This study was partially supported by the National Science Foundation award IOS-1832968 (to P.N.) and the National Institute of Health award 7R03CA211635 (to P.N.). High-resolution MS data from this study is available at the NIH Common Fund’s Metabolomics Data Repository and Coordinating Center (supported by NIH grant, U01-DK097430) website, the Metabolomics Workbench, with Project ID PR000690 (http://www.metabolomicsworkbench.org). The data can be accessed directly via Project DOI: 10.21228/M8GQ3M.
REFERENCES
- 1.Zenobi R, Science, 2013, 342, 1243259. [DOI] [PubMed] [Google Scholar]
- 2.Wishart DS, Feunang YD, Marcu A, Guo AC, Liang K, Vazquez-Fresno R, Sajed T, Johnson D, Li C, Karu N, Sayeeda Z, Lo E, Assempour N, Berjanskii M, Singhal S, Arndt D, Liang Y, Badran H, Grant J, Serra-Cayuela A, Liu Y, Mandal R, Neveu V, Pon A, Knox C, Wilson M, Manach C and Scalbert A, Nucleic Acids Res, 2018, 46, D608–D617. [DOI] [PMC free article] [PubMed] [Google Scholar]
- 3.Sive HL, Grainger RM and Harland RM, Early development of Xenopus laevis : a laboratory manual, Cold Spring Harbor Laboratory Press, Cold Spring Harbor, N.Y., 2000. [Google Scholar]
- 4.Acunha T, Simo C, Ibanez C, Gallardo A and Cifuentes A, J. Chromatogr. A, 2016, 1428, 326–335. [DOI] [PubMed] [Google Scholar]
- 5.Rubakhin SS, Romanova EV, Nemes P and Sweedler JV, Nat. Methods, 2011, 8, S20–S29. [DOI] [PMC free article] [PubMed] [Google Scholar]
- 6.Rubakhin SS, Lanni EJ and Sweedler JV, Curr. Opin. Biotechnol, 2013, 24, 95–104. [DOI] [PMC free article] [PubMed] [Google Scholar]
- 7.Yang YY, Huang YY, Wu JH, Liu N, Deng JW and Luan TG, Trends Anal. Chem, 2017, 90, 14–26. [Google Scholar]
- 8.Comi TJ, Do TD, Rubakhin SS and Sweedler JV, J. Am. Chem. Soc, 2017, 139, 3920–3929. [DOI] [PMC free article] [PubMed] [Google Scholar]
- 9.Yin L, Zhang Z, Liu Y, Gao Y and Gu J, Analyst, 2018, Accepted Manuscript [Google Scholar]
- 10.Passarelli MK and Ewing AG, Curr. Opin. Chem. Biol, 2013, 17, 854–859. [DOI] [PMC free article] [PubMed] [Google Scholar]
- 11.Liu RM, Pan N, Zhu YL and Yang ZB, Anal. Chem, 2018, 90, 11078–11085. [DOI] [PMC free article] [PubMed] [Google Scholar]
- 12.Saha-Shah A, Green CM, Abraham DH and Baker LA, Analyst, 2016, 141, 1958–1965. [DOI] [PubMed] [Google Scholar]
- 13.Onjiko RM, Portero EP, Moody SA and Nemes P, Anal. Chem, 2017, 89, 7069–7076. [DOI] [PMC free article] [PubMed] [Google Scholar]
- 14.Stopka SA, Khattar R, Agtuca BJ, Anderton CR, Pasa-Tolic L, Stacey G and Vertes A, Front. Plant Sci, 2018, 9, 1646. [DOI] [PMC free article] [PubMed] [Google Scholar]
- 15.Comi TJ, Makurath MA, Philip MC, Rubakhin SS and Sweedler JV, Anal. Chem, 2017, 89, 7765–7772. [DOI] [PMC free article] [PubMed] [Google Scholar]
- 16.Lapainis T, Rubakhin SS and Sweedler JV, Anal. Chem, 2009, 81, 5858–5864. [DOI] [PMC free article] [PubMed] [Google Scholar]
- 17.Nemes P, Knolhoff AM, Rubakhin SS and Sweedler JV, Anal. Chem, 2011, 83, 6810–6817. [DOI] [PMC free article] [PubMed] [Google Scholar]
- 18.Nemes P, Rubakhin SS, Aerts JT and Sweedler JV, Nat. Protoc, 2013, 8, 783–799. [DOI] [PMC free article] [PubMed] [Google Scholar]
- 19.Aerts JT, Louis KR, Crandall SR, Govindaiah G, Cox CL and Sweedler JV, Anal. Chem, 2014, 86, 3203–3208. [DOI] [PMC free article] [PubMed] [Google Scholar]
- 20.Onjiko RM, Morris SE, Moody SA and Nemes P, Analyst, 2016, 141, 3648–3656. [DOI] [PMC free article] [PubMed] [Google Scholar]
- 21.Onjiko RM, Plotnick DO, Moody SA and Nemes P, Anal. Methods, 2017, 9, 4964–4970. [DOI] [PMC free article] [PubMed] [Google Scholar]
- 22.Onjiko RM, Moody SA and Nemes P, Proc. Natl. Acad. Sci. U. S. A, 2015, 112, 6545–6550. [DOI] [PMC free article] [PubMed] [Google Scholar]
- 23.Onjiko RM, Portero EP, Moody SA and Nemes P, J. Vis. Exp, 2017, DOI: 10.3791/56956, e56956. [DOI] [PMC free article] [PubMed] [Google Scholar]
- 24.Ramautar R, Somsen GW and de Jong GJ, Electrophoresis, 2013, 34, 86–98. [DOI] [PubMed] [Google Scholar]
- 25.Ramautar R, Somsen GW and de Jong GJ, Electrophoresis, 2017, 38, 190–202. [DOI] [PMC free article] [PubMed] [Google Scholar]
- 26.Ramautar R, Somsen GW and de Jong GJ, Electrophoresis, 2015, 36, 212–224. [DOI] [PubMed] [Google Scholar]
- 27.Voeten RLC, Ventouri IK, Haselberg R and Somsen GW, Anal. Chem, 2018, 90, 1464–1481. [DOI] [PMC free article] [PubMed] [Google Scholar]
- 28.Liu JX, Aerts JT, Rubakhin SS, Zhang XX and Sweedler JV, Analyst, 2014, 139, 5835–5842. [DOI] [PMC free article] [PubMed] [Google Scholar]
- 29.Soga T, Igarashi K, Ito C, Mizobuchi K, Zimmermann HP and Tomita M, Anal. Chem, 2009, 81, 6165–6174. [DOI] [PubMed] [Google Scholar]
- 30.Sarver SA, Schiavone NM, Arceo J, Peuchen EH, Zhang Z, Sun L and Dovichi NJ, Talanta, 2017, 165, 522–525. [DOI] [PMC free article] [PubMed] [Google Scholar]
- 31.Lin L, Liu X, Zhang F, Chi L, Amster IJ, Leach FE 3rd, Xia Q and Linhardt RJ, Anal. Bioanal. Chem, 2017, 409, 411–420. [DOI] [PMC free article] [PubMed] [Google Scholar]
- 32.Gulersonmez MC, Lock S, Hankemeier T and Ramautar R, Electrophoresis, 2016, 37, 1007–1014. [DOI] [PMC free article] [PubMed] [Google Scholar]
- 33.Moody SA, Methods Mol. Biol, 2000, 135, 331–347. [DOI] [PubMed] [Google Scholar]
- 34.Klein SL, Dev. Biol, 1987, 120, 299–304. [DOI] [PubMed] [Google Scholar]
- 35.Moody SA and Kline MJ, Anat. Embryol, 1990, 182, 347–362. [DOI] [PubMed] [Google Scholar]
- 36.Nemes P, Marginean I and Vertes A, Anal. Chem, 2007, 79, 3105–3116. [DOI] [PubMed] [Google Scholar]
- 37.Chong J, Soufan O, Li C, Caraus I, Li S, Bourque G, Wishart DS and Xia J, Nucleic Acids Res, 2018, 46, W486–W494. [DOI] [PMC free article] [PubMed] [Google Scholar]
- 38.Moody SA, Dev. Biol, 1987, 119, 560–578. [DOI] [PubMed] [Google Scholar]
- 39.Straub RF and Voyksner RD, J. Am. Soc. Mass Spectrom, 1993, 4, 578–587. [DOI] [PubMed] [Google Scholar]
- 40.Ikonomou MG, Blades AT and Kebarle P, J. Am. Soc. Mass Spectrom, 1991, 2, 497–505. [DOI] [PubMed] [Google Scholar]
- 41.Cole RB and Harrata AK, J. Am. Soc. Mass Spectrom, 1993, 4, 546–556. [DOI] [PubMed] [Google Scholar]
- 42.McClory PJ and Håkansson K, Anal. Chem, 2017, 89, 10188–10193. [DOI] [PMC free article] [PubMed] [Google Scholar]
- 43.Wu Z, Gao W, Phelps MA, Wu D, Miller DD and Dalton JT, Anal. Chem, 2004, 76, 839–847. [DOI] [PMC free article] [PubMed] [Google Scholar]
- 44.Knolhoff AM, Nautiyal KM, Nemes P, Kalachikov S, Morozova I, Silver R and Sweedler JV, Anal. Chem, 2013, 85, 3136–3143. [DOI] [PMC free article] [PubMed] [Google Scholar]
- 45.Marginean I, Nemes P and Vertes A, Phys. Rev. E, 2007, 76, 026320. [DOI] [PubMed] [Google Scholar]
- 46.Guijas C, Montenegro-Burke JR, Domingo-Almenara X, Palermo A, Warth B, Hermann G, Koellensperger G, Huan T, Uritboonthai W, Aisporna AE, Wolan DW, Spilker ME, Benton HP and Siuzdak G, Anal. Chem, 2018, 90, 3156–3164. [DOI] [PMC free article] [PubMed] [Google Scholar]
Associated Data
This section collects any data citations, data availability statements, or supplementary materials included in this article.