Abstract
As abundant and user-friendly as computer-aided drug design (CADD) software may seem, there is still a large underserved population of biomedical researchers around the world, particularly those with no computational training and limited research funding. To address this important need and help scientists overcome barriers that impede them from leveraging CADD in their drug discovery work, we have developed ezCADD, a web-based CADD modeling environment that manifests four simple design concepts: easy, quick, user-friendly, and 2D/3D visualization-enabled. In this paper, we describe the features of three fundamental applications that have been implemented in ezCADD: small-molecule docking, protein–protein docking, and binding pocket detection, and their applications in drug design against a pathogenic microbial enzyme as an example. To assess user experience and the effectiveness of our implementation, we introduced ezCADD to first-year pharmacy students as an active learning exercise in the Principles of Drug Action course. The web service robustly handled 95 simultaneous molecular docking jobs. Our survey data showed that among the 95 participating students, 97% completed the molecular docking experiment on their own at least partially without extensive training; 88% considered ezCADD easy and user-friendly; 99–100% agreed that ezCADD enhanced the understanding of drug–receptor structures and recognition; and the student experience in molecular modeling and visualization was significantly improved from zero to a higher level. The student feedback represents the baseline data of user experience from noncomputational researchers. It is demonstrated that in addition to supporting drug discovery research, ezCADD is also an effective tool for promoting science, technology, engineering, and mathematics (STEM) education. More advanced CADD applications are being developed and added to ezCADD, available at http://dxulab.org/software.
1. Introduction
Computer-aided drug design (CADD) is a critical component of the drug discovery and development process. At least some computational background or technical training is required to carry out CADD. However, the majority of experimental biomedical researchers, including but not limited to medicinal chemists, biochemists, cell biologists, pharmacologists, and toxicologists, have little to no computational background. Many researchers, particularly in academia, may not have access to a computational collaborator or team member. Although CADD software is relatively abundant, the more user-friendly packages are likely to be commercial ones, costing from hundreds to thousands of US dollars per year at academic pricing. On the other hand, most free or open-source CADD software is designed for Unix/Linux operating system, requiring users’ technical ability to maintain a Unix/Linux system, compile, and install the software directly from source code. Furthermore, regardless the choice of commercial or free software a biomedical researcher would still need to purchase a powerful computer, maintain the computer system, and perform software updates. Therefore, access to CADD depends on (1) technical expertise and (2) funding availability for the acquisition of a good computer system and/or commercial software.
Due to these technical and fiscal barriers, it is clear that a large population of biomedical researchers around the world, particularly those from developing countries, are underserved. Without access to CADD, their drug discovery work may be hindered or less efficient. To address this research disparity and the need to help biomedical researchers overcome these barriers, we have developed a web-based CADD environment (ezCADD) with the goal to implement and provide a suite of CADD applications essential to drug discovery. The choice of web service as the ezCADD platform has many advantages over other types of application delivery to end users. ezCADD enables access to CADD by removing the traditional requirements of (1) computational background; (2) computer purchase; (3) software purchase; (4) software compilation or installation; (5) software update; and (6) computer system maintenance.
Upon searching recent publications and a directory of open source molecular modeling software,1 there are only a small number of 3D visualization-enabled web services similar to ezCADD. PlayMolecule.org offers multiple web applications for protein preparation,2 neural-network-based virtual screening,3 binding pocket prediction,4 and ligand properties.5 Koes et al. developed ligand-based virtual screening web services, Pharmit6 and ZINCPharmer.7 Although there seems to be some overlap between these web services and ezCADD, the underlying computational approaches and implementation and are completely different. For example, we plan to implement GPU/CPU hybrid methods for ligand-based virtual screening. Unlike PlayMolecule.org which utilizes a stripped down version of NGL for 3D molecular visualization, we took the opposite approach by building new CADD applications and functions on top of the original NGL. This design allows users to take full advantages of all NGL’s molecular visualization features and high-quality image rendering. In this paper, we focus on three fundamental CADD applications implemented during the initial development: small-molecule docking (ezSMDock); binding site detection (ezPocket); and protein–protein docking (ezPPDock). We will also show the impact of ezCADD on students who mostly had no prior computational background through an in-class modeling exercise followed by a survey of user experience.
2. Features
2.1. ezCADD Application Implementation and Graphic User Interface (GUI)
Four simple design concepts, easy, quick, user-friendly, and 2D/3D visualization-enabled, were maintained throughout ezCADD development. To realize these design goals, we embraced NGL,8 a versatile WebGL-based9 application, as our 3D molecular visualizer. We added JavaScript-based 2D molecular visualizer and integrated a set of high-performance free/open-source software with the 2D/3D molecular visualizers through a combination of multiple client–server orientated programming languages (Figure 1). ezCADD is designed to be system agnostic and accessible from anywhere by any computers or tablets with an up-to-date web browser that has the latest JavaScript support. ezCADD has been successfully tested on the lastest verion of FireFox, Chrome, and Safari web browsers.
Figure 1.
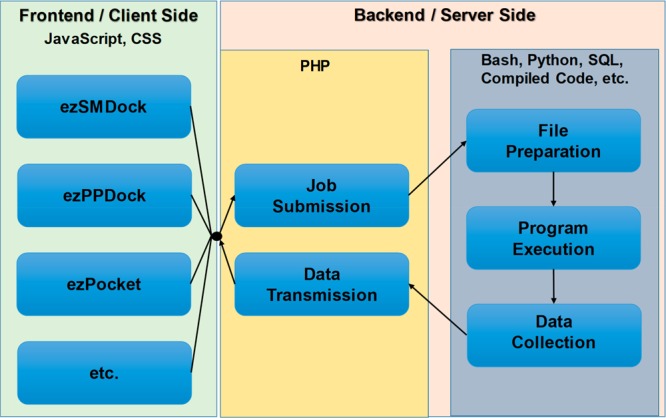
ezCADD web service implementation.
ezCADD adopts the original NGL GUI layout, with the center WebGL-based 3D window dedicated to molecular visualization and the right navigation panel dedicated to visualization controls. CADD applications are added to the top menu bar. A left navigation panel is added to display computational results. It is noteworthy that both left and right navigation panels can be flexibly minimized or resized by double-clicking or dragging the panel edge to make more space available for the 3D visualization window. ezCADD has a floating window GUI design, i.e., invoked windows and menus can be overlaid and freely moved around; closed windows and menus can be reinvoked without interrupting the current task. Imported molecular files or representations are accessible until they are updated during the same session.
2.2. ezSMDock: Small-Molecule Docking
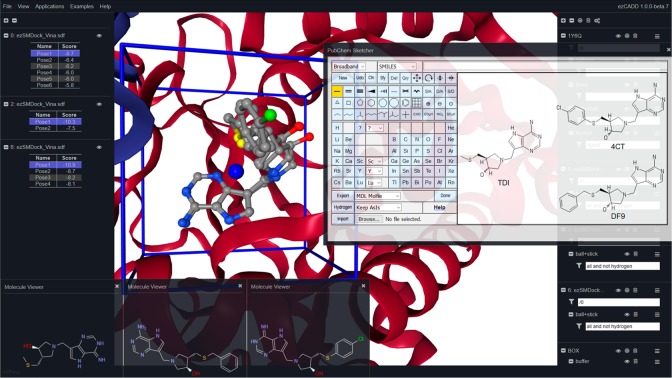
In this web application, the receptor structure can be imported by either uploading a Protein Data Bank (PDB)10 file or entering a PDB ID. ezSMDock provides a variety of options for users to import the ligand stucture: (1) a 3D ligand file in PDB, MOL2, SDF/MOL format; (2) a 2D ligand file in SDF/MOL format; (3) SMILES; and (4) InChI, all of which can be easily obtained and downlaoded from public chemical/drug databases such as PubChem,11 ChEMBL,12 RSCB/PDB,10 DrugBank,13 and Wikepedia or Google searches. The combination of PDB ID, SMILES, and InChI allows users to easily perform a docking experiment without the need of downloading and uploading files. For medicinal chemists who work on de novo drug design, ezSMDock enables them to draw and modify molecular structures of interest using PubChem Sketcher,14 automatically generates SMILES/InChI strings of the new structures as ligand input, and quickly docks them into receptor binding site. This makes ezSMDock an efficient tool for medicinal chemists to rapidly enumerate diverse structural possibilities and predict associated binding affinity changes for exploring structure activity relationships (SARs) and formulating hypotheses.
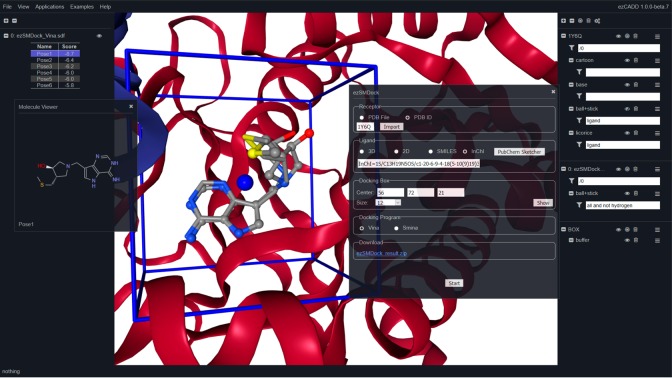
The input ligand file or representation is converted to a MOL2 file using Unicon,15 which calculates the best protonation and tautomer state at the physiological pH. An InChI string is converted to SMILES using OpenBabel16 and fed into Unicon for MOL2 file generation. The MOL2 file is then converted to a PDBQT file using MGLTools.17 The receptor PDB file is cleaned up using BASH and regular expression before it is converted to a PDBQT file using MGLTools. Both the receptor and ligand PDBQT files are used as the input files for AutoDock Vina18 or Smina19 docking on the server side. Both programs are highly efficient and considered one of the best open-source small-molecule docking code. The XYZ coordinates of docking box center can be entered manually or automatically populated by clicking the “User Ligand Center” button when a 3D ligand file is provided. If users choose to manually enter the center coordinates, the data can be obtained from ezPocket (see section 2.3), which provides the center coordinates of all predicted binding pockets. In addition, users can set up the appropriate box size. The docking box is automatically updated with user input. Upon setting up the parameters, a docking job is submitted for execution on the server side by clicking the “Start” button.
An ezSMDock job typically takes a few seconds. Upon completion, the docked poses and predicted scores are displayed in the left navigation panel. Users can click on each pose to inspect its binding modes in the 3D visualization window. A pop-up window is also launched to display the 2D structure of the input ligand. The 2D molecular visualization is implemented using Kekule.js open-source JavaScript library.20 The rapid 2D and 3D molecular visualization in combination provides users with ease and flexibility to compare multiple ligands after docking. A zip file containing (1) user receptor and ligand inputs, (2) all docked poses in a SDF file, and (3) all docking scores in a tab-delimited TSV file, is also available for download and further analysis. It is recommended that users perform redocking of ligands with known experimentally determined bound coordinates to validate the docking parameters piror to docking other molecules. ezSMDock currently allows docking one ligand at a time for the purpose of resource sharing and abuse prevention. A new high-throughput virtual screening web application (ezHTVS) is under development and will be added to ezCADD for users to screen millions of compounds within minutes.
2.3. ezPocket: Binding Site Detection
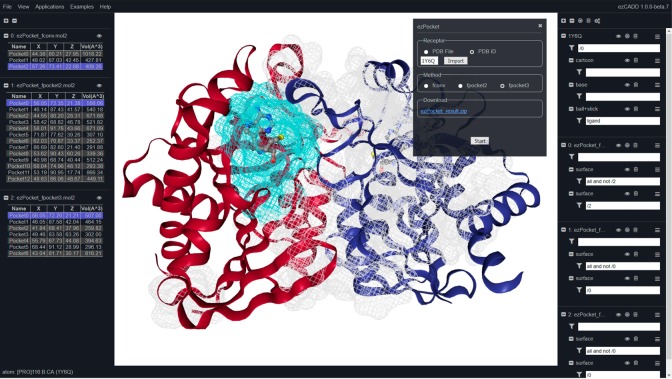
In this web application, the receptor structure can be imported by either uploading a PDB file or entering a PDB ID. ezPocket provides users with a consensus approach to detect plausible receptor binding pockets. Three popular cavity detection programs are currently offered: (1) fconv,21 (2) fpocket2,22 and (3) fpocket3.23 fconv uses Delaunay triangulation with weighted points to detect cavities whereas fpocket2 and fpocket3 rely on fast Voronoi tessellation. Upon setting up the parameters, a job is submitted for execution on the server side by clicking the “Start” button. An ezPocket job typically takes a few seconds. Upon completion, the detected binding cavities, their associated cavity center XYZ coordinates, and cavity volumes are displayed in the left navigation panel. All detected pockets are shown in a gray wireframe representation in the 3D visualization window. When users select a pocket in the left navigation panel, its corresponding wireframe is highlighted in cyan in the 3D visualization window. Users can use the consensus results predicted by multiple programs in conjunction with their biochemical intuition and knowledge of the receptor to determine the most plausible cavity for small-molecule binding. As described earlier, once users determine a binding cavity, the center XYZ coordinates of the cavity can be entered into ezSMDock to set up a molecular docking job. A zip file containing (1) user receptor input, (2) all detected pockets in a 3D multimodel MOL2 file, and (3) the XYZ center coordinates and volumes of all detected pockets in a tab-delimited TSV file, is also available for download and further analysis.
2.4. ezPPDock: Protein–Protein Docking
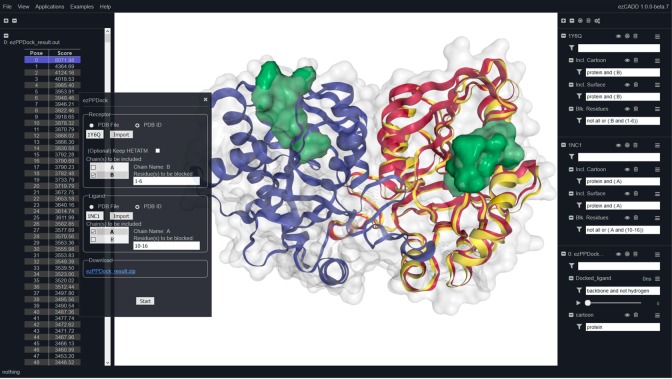
In this web application, both receptor and ligand structures can be imported by either uploading a PDB file or entering a PDB ID. If users feel that the HETATM entries (water, metal ions, glycosylated sugars, etc.) surrounding the receptor should be taken into account during the protein–protein docking, they are provided an option to keep them. Users need to specify the chain IDs of both receptor and ligand that are involved in the protein–protein interactions. If they have biochemical information indicating some residues do not belong to the actual binding interface, they can specify any receptor and/or ligand residues to be blocked from the docking experiment. All blocked residues are highlighted in solid green surface representation in the 3D visualization window. Upon setting up the parameters, a job is submitted for execution on the server side by clicking the “Start” button. MegaDock 4.024 is used as the docking engine because of its ultra high-performance and the support of GPU/CPU hybrid computing. An ezPPDock job typically takes a few seconds. Upon completion, top 2000 docked poses and their associated scores are displayed in the left navigation panel. Users can inspect the docked poses in the 3D visualization window by selecting them in the left navigation panel. ezPPDock also takes advantage of NGL’s molecular dynamics trajectory support by loading all 2000 docked poses in a compressed DCD trajectory file to the right control panel. All docked poses can be animated and viewed in the form of automatic movie playback. A zip file containing (1) user receptor and ligand inputs, (2) 2000 docked poses in a DCD trajectory file, and (3) docking scores associated with all docked poses in a tab-delimited text ouput file is also available for download and further analysis.
2.5. Case Study: Methylthioadenosine Nucleosidase
Methylthioadenosine nucleosidase (MTN) is an important enzyme in many pathogenic microbes, responsible for the catabolism of 5′-methylthioadenosine (MTA) and S-adenosylhomocysteine (SAH), two molecules involved in key microbial functions.25 Here we use the E. coli MTN as an example to demonstrate the applications of ezCADD in drug design.
-
(1)
ezPocket (Figure 2): The E. coli MTN structure was imported from PDB ID 1Y6Q. Automatic cavity detection was performed using fconv, fpocket2, and fpocket3. There was a consensus result that matched the catalytic binding site of chain A, highlighted in cyan in the 3D visualization window (Figure 2). All three cavities predicted by the programs enclosed the bound inhibitor Methylthio-DADMe-Immucillin A (TDI). If we pretended that there was no known inhibitor inside the cavity, we could record one of three sets of reported center XYZ coordinates for the next molecule docking step.
-
(2)
ezSMDock (Figure 3): The E. coli MTN structure was imported from PDB ID 1Y6Q. The SMILES or InChI string of inhibitor TDI were be obtained from PubChem (CID 656970). In this case, the InChI string was used as ligand input. The docking box center XYZ cooridinates were taken from ezPocket, and box size was set to 15. This redocking experiment was performed using AutoDock Vina. Figure 3 shows that the highest scored pose was selected in the left navigation panel and displayed (ball and stick) on top of the crystallographically bound TDI (licorice) in the 3D visualization window. AutoDock Vina correctly reproduced the experimental binding mode of TDI.
-
(3)
SAR and De Novo Drug Design (Figure 4): Here we used retrospective experimental data of two TDI derivatives to demonstrate how easily medicinal chemists can use ezCADD to study SAR and design novel compounds. First, the SMILES or InChI string of inhibitor TDI was copied and pasted to PubChem Sketcher for structural modification to create Benzylthio-DADMe-Immucillin A (DF9) and 4-Cl-phenylthio-DADMe-Immucillin A (4CT). Next, the automatically generated InChI strings of DF9 and 4CT were copied and pasted back to ezSMDock as ligand input for docking the congeneric ligands to MTN. Figure 4 shows that the docking results were displayed in the left navigation panel, the 2D structures of docked molecules were compared in the 2D visualization pop-up windows, and the top scored docked poses of TDI, DF9, and 4CT were overlaid in the 3D visualization window. Table 1 shows that the trend of the predicted docking scores were in good agreement with published experimental data.26
-
(4)
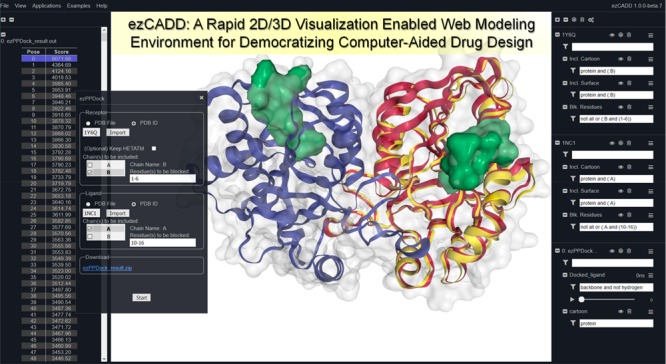
ezPPDock (Figure 5): MTN is a homodimer. Modeling the protein–protein interactions at the dimer interface may offer new molecular insights into MTN enzymatic acticity and potential inhibitor design that disrupts its dimerization and catalysis. Here we used ezPPDock to reconstruct MTN dimer from monomers. PDB ID 1Y6Q was imported, with chain B selected as the receptor. PDB ID 1NC1 was imported, with chain A selected as the ligand. Since we knew that residues 1–6 of the receptor and residues 10–16 of the ligand would not be involved in the protein–protein interactions, these residues were selected (highlighted in solid green surface) to be blocked during the docking experiment. This feature, analogous to docking box used in small-molecule docking, may significantly improve protein–protein docking quality. Figure 5 shows that the top scored pose was selected in the left navigation panel and displayed (yellow ribbon) with respect to the crystallographically bound monomer (red ribbon) in the 3D visualization window. MegaDock correctly reproduced the experimental assembly of MTN homodimer.
Figure 2.
Consensus binding site detection using ezPocket (PDB ID 1Y6Q).
Figure 3.
Redocking inhibitor TDI to E. coli MTN (PDB ID 1Y6Q) using ezSMDock.
Figure 4.
Computational SAR and de novo design using ezSMDock.
Table 1. Experimental Inhibition Constants and Predicted Docking Scores of DADMe-Immucillin A Derivatives on E. Coli MTN.
| inhibitor: DADMe-Immucillin A derivatives | expt Kd (pM)26 | docking score |
|---|---|---|
| methylthio-(TDI) | 2 | –8.7 |
| benzylthio-(DF9) | 0.46 | –10.3 |
| 4-Cl-phenylthio-(4CT) | 0.047 | –10.9 |
Figure 5.
Re-Constructing E. coli MTN homodimer (PDB ID 1Y6Q and 1NC1) using ezPPDock.
3. User Evaluation and Feedback
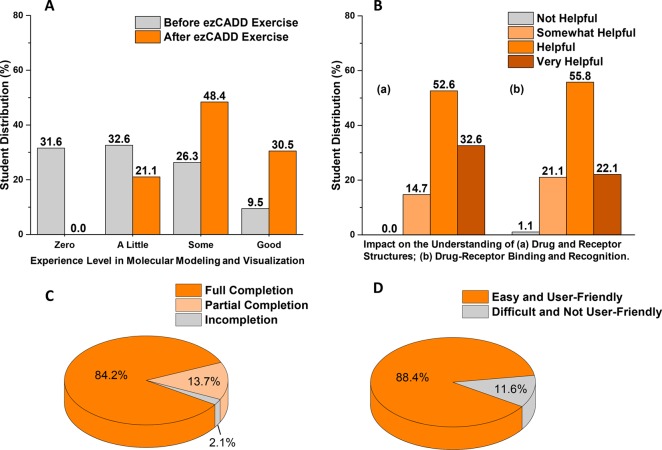
To assess user experience and the effectiveness of our implementation, we introduced ezCADD to 95 first-year pharmacy students as an active learning component in the Principles of Drug Action course. Before we started the ezCADD exercise, we collected the baseline data by asking the students about their level of experience with molecular modeling and visualization. We then loaded human β2 adrenergic receptor (PDB ID 3NYA) and bound drug alprenolol, a nonselective beta-blocker, into ezCADD. We used ezCADD’s 2D and 3D molecular visualization to illustrate the structural and chemical features of the receptor and alprenolol. Next, we guided students to search PubChem for the SMILES or InChI representation of alprenolol and used them as the ligand input to redock the drug back to the receptor binding site using ezSMDock. The web service handled 95 simultaneous docking jobs without an issue. All submitted jobs finished within minutes. We used ezCADD’s 3D visualization again to explain molecular recognition and interactions between the receptor and alprenolol. Lastly, we followed up with five additional questions to gauge student experience. The results of the student survey are shown in Figure 6. The survey questionnaire and quantitative feedback are provided in the Supporting Information. This study received exempt status from Idaho State University Institutional Review Board (study number IRB-FY2019-38).
Figure 6.
Student evaluation of ezCADD. (A) Student experience level in molecular modeling and visualization before and after the ezCADD exercise. (B) Impact of ezCADD on student understanding of drug–receptor structure and recognition. (C) Student completion status of the ezCADD exercise. (D) Student user experience with ezCADD.
Our student survey data showed that, among the majority of students who participated, their experience level with molecular modeling and visualization was improved from zero or a little experience (64% students) to some or good experience (79% students). After the exercise, students with zero molecular modeling experience decreased to 0% compared to a significant 32% before the exercise (Figure 6A). At the end of the exercise, 99–100% students thought ezCADD enhanced their understanding of drug and receptor structures as well as the concepts of drug–receptor binding and recognition (Figure 6B). 84% students fully completed the molecular docking experiment on their own whereas 14% partially completed (Figure 6C). 88% students considered the tool to be easy and user-friendly (Figure 6D). The student feedback provided representative baseline data of ezCADD user experience for biomedical researchers with little or no computational background. It is clearly demonstrated that ezCADD is an easy, user-friendly, and powerful tool for both drug discovery research and STEM education.
4. Conclusions
ezCADD delivers a rapid, rich, smooth, dynamic, and desktop-like molecular modeling and drug design experience to biomedical researchers and students around the world through seamless and synergistic integration of high-performance free CADD software packages with powerful web-enabled 2D/3D molecular visualization. Our ultimate goal is to break down barriers that limit access to CADD by making ezCADD a one-stop shop for the CADD needs of most researchers. The limitations of ezCADD are the same as those of the software packages used on the server side. An advantage of ezCADD, as a web application, is the ease of software maintenance and update on the server side, which is completely carefree to users. ezCADD will be continuously developed and improved by the authors to address user needs and feedback. New features that will be added soon include 2D/3D protein–ligand interaction analysis and visualization, high-throughput virtual screening, fragment-based drug design, polypharmacoly screening, etc. The user evaluations provided by first-year pharmacy students confirmed ezCADD’s robustness and effectiveness in helping noncomputational experts become self-sufficient molecular modelers and CADD practitioners. While ezCADD aims to enable biomedical discovery by democratizing CADD among traditionally underserved researchers, it also makes biomedical research more appealing to the web-orientated digital generation.
Acknowledgments
This work is supported, in part, by the National Institutes of Health NIGMS IDeA Mountain West Clinical and Translational Infrastructure Network (CTR-IN) Mini and Pilot Grants (1U54GM104944-02/15-746Q-ISU-MG5-00, 5U54GM104944-03/16-746Q-ISU-PG44-00) to D.X., a subaward from the Institutional Development Awards (IDeA) from the National Institute of General Medical Sciences of the National Institutes of Health (Grants numbers P20GM103408 and P20GM109095) to D.X., the Idaho State University Faculty Seed Grant to D.X., the Idaho State University College of Pharmacy Graduate Student Assistantships to A.T. and Y.H., and the Idaho State University Career Path Interns (CPI) Funding to A.T. and Y.H.
Supporting Information Available
The Supporting Information is available free of charge on the ACS Publications website at DOI: 10.1021/acs.jcim.8b00633.
ezCADD user questionnaire for first-year pharmacy students (PDF)
The authors declare no competing financial interest.
Supplementary Material
References
- Pirhadi S.; Sunseri J.; Koes D. R. Open Source Molecular Modeling. J. Mol. Graphics Modell. 2016, 69, 127–143. 10.1016/j.jmgm.2016.07.008. [DOI] [PMC free article] [PubMed] [Google Scholar]
- Martinez-Rosell G.; Giorgino T.; De Fabritiis G. Playmolecule Proteinprepare: A Web Application for Protein Preparation for Molecular Dynamics Simulations. J. Chem. Inf. Model. 2017, 57, 1511–1516. 10.1021/acs.jcim.7b00190. [DOI] [PubMed] [Google Scholar]
- Skalic M.; Martínez-Rosell G.; Jiménez J.; De Fabritiis G. Playmolecule Bindscope: Large Scale Cnn-Based Virtual Screening on the Web. Bioinformatics 2018, bty758–bty758. 10.1093/bioinformatics/bty758. [DOI] [PubMed] [Google Scholar]
- Jiménez J.; Doerr S.; Martínez-Rosell G.; Rose A.; De Fabritiis G. Deepsite: Protein-Binding Site Predictor Using 3d-Convolutional Neural Networks. Bioinformatics 2017, 33, 3036–3042. 10.1093/bioinformatics/btx350. [DOI] [PubMed] [Google Scholar]
- Skalic M.; Varela-Rial A.; Jiménez J.; Martínez-Rosell G.; De Fabritiis G. Ligvoxel: Inpainting Binding Pockets Using 3d-Convolutional Neural Networks. Bioinformatics 2018, bty583–bty583. 10.1093/bioinformatics/bty583. [DOI] [PubMed] [Google Scholar]
- Sunseri J.; Koes D. R. Pharmit: Interactive Exploration of Chemical Space. Nucleic Acids Res. 2016, 44, W442–W448. 10.1093/nar/gkw287. [DOI] [PMC free article] [PubMed] [Google Scholar]
- Koes D. R.; Camacho C. J. Zincpharmer: Pharmacophore Search of the Zinc Database. Nucleic Acids Res. 2012, 40, W409–W414. 10.1093/nar/gks378. [DOI] [PMC free article] [PubMed] [Google Scholar]
- Rose A. S.; Hildebrand P. W. Ngl Viewer: A Web Application for Molecular Visualization. Nucleic Acids Res. 2015, 43, W576–W579. 10.1093/nar/gkv402. [DOI] [PMC free article] [PubMed] [Google Scholar]
- Marrin C.Webgl Specification; Khronos WebGL Working Group: Beaverton, OR, USA, 2011. [Google Scholar]
- Berman H. M.; Westbrook J.; Feng Z.; Gilliland G.; Bhat T. N.; Weissig H.; Shindyalov I. N.; Bourne P. E. The Protein Data Bank. Nucleic Acids Res. 2000, 28, 235–242. 10.1093/nar/28.1.235. [DOI] [PMC free article] [PubMed] [Google Scholar]
- Bolton E. E.; Wang Y.; Thiessen P. A.; Bryant S. H.. Pubchem: Integrated Platform of Small Molecules and Biological Activities. In Annual Reports in Computational Chemistry; Elsevier: 2008; Vol. 4, pp 217–241. [Google Scholar]
- Gaulton A.; Bellis L. J.; Bento A. P.; Chambers J.; Davies M.; Hersey A.; Light Y.; McGlinchey S.; Michalovich D.; Al-Lazikani B.; et al. Chembl: A Large-Scale Bioactivity Database for Drug Discovery. Nucleic Acids Res. 2012, 40, D1100–D1107. 10.1093/nar/gkr777. [DOI] [PMC free article] [PubMed] [Google Scholar]
- Wishart D. S.; Knox C.; Guo A. C.; Shrivastava S.; Hassanali M.; Stothard P.; Chang Z.; Woolsey J. Drugbank: A Comprehensive Resource for in Silico Drug Discovery and Exploration. Nucleic Acids Res. 2006, 34, D668–D672. 10.1093/nar/gkj067. [DOI] [PMC free article] [PubMed] [Google Scholar]
- Ihlenfeldt W. D.; Bolton E. E.; Bryant S. H. The Pubchem Chemical Structure Sketcher. J. Cheminf. 2009, 1, 20. 10.1186/1758-2946-1-20. [DOI] [PMC free article] [PubMed] [Google Scholar]
- Sommer K.; Friedrich N.-O.; Bietz S.; Hilbig M.; Inhester T.; Rarey M. Unicon: A Powerful and Easy-to-Use Compound Library Converter. J. Chem. Inf. Model. 2016, 56, 1105–1111. 10.1021/acs.jcim.6b00069. [DOI] [PubMed] [Google Scholar]
- O’Boyle N. M.; Banck M.; James C. A.; Morley C.; Vandermeersch T.; Hutchison G. R. Open Babel An Open Chemical Toolbox. J. Cheminf. 2011, 3, 33. 10.1186/1758-2946-3-33. [DOI] [PMC free article] [PubMed] [Google Scholar]
- Forli S.; Huey R.; Pique M. E.; Sanner M. F.; Goodsell D. S.; Olson A. J. Computational Protein–Ligand Docking and Virtual Drug Screening with the Autodock Suite. Nat. Protoc. 2016, 11, 905. 10.1038/nprot.2016.051. [DOI] [PMC free article] [PubMed] [Google Scholar]
- Trott O.; Olson A. J. Autodock Vina: Improving the Speed and Accuracy of Docking with a New Scoring Function, Efficient Optimization, and Multithreading. J. Comput. Chem. 2009, 31, 455–461. 10.1002/jcc.21334. [DOI] [PMC free article] [PubMed] [Google Scholar]
- Koes D. R.; Baumgartner M. P.; Camacho C. J. Lessons Learned in Empirical Scoring with Smina from the Csar 2011 Benchmarking Exercise. J. Chem. Inf. Model. 2013, 53, 1893–1904. 10.1021/ci300604z. [DOI] [PMC free article] [PubMed] [Google Scholar]
- Jiang C.; Jin X.; Dong Y.; Chen M. Kekule. Js: An Open Source Javascript Chemoinformatics Toolkit. J. Chem. Inf. Model. 2016, 56, 1132–1138. 10.1021/acs.jcim.6b00167. [DOI] [PubMed] [Google Scholar]
- Neudert G.; Klebe G. Fconv: Format Conversion, Manipulation and Feature Computation of Molecular Data. Bioinformatics 2011, 27, 1021–1022. 10.1093/bioinformatics/btr055. [DOI] [PubMed] [Google Scholar]
- Le Guilloux V.; Schmidtke P.; Tuffery P. Fpocket: An Open Source Platform for Ligand Pocket Detection. BMC Bioinf. 2009, 10, 168. 10.1186/1471-2105-10-168. [DOI] [PMC free article] [PubMed] [Google Scholar]
- Schmidtke P.; Le Guilloux V.; Maupetit J.; Tuffery P. Fpocket: Online Tools for Protein Ensemble Pocket Detection and Tracking. Nucleic Acids Res. 2010, 38, W582–W589. 10.1093/nar/gkq383. [DOI] [PMC free article] [PubMed] [Google Scholar]
- Ohue M.; Shimoda T.; Suzuki S.; Matsuzaki Y.; Ishida T.; Akiyama Y. Megadock 4.0: An Ultra–High-Performance Protein–Protein Docking Software for Heterogeneous Supercomputers. Bioinformatics 2014, 30, 3281–3283. 10.1093/bioinformatics/btu532. [DOI] [PMC free article] [PubMed] [Google Scholar]
- Lee J. E.; Singh V.; Evans G. B.; Tyler P. C.; Furneaux R. H.; Cornell K. A.; Riscoe M. K.; Schramm V. L.; Howell P. L. Structural Rationale for the Affinity of Pico- and Femtomolar Transition State Analogues of Escherichia Coli 5′-Methylthioadenosine/S-Adenosylhomocysteine Nucleosidase. J. Biol. Chem. 2005, 280, 18274–18282. 10.1074/jbc.M414471200. [DOI] [PubMed] [Google Scholar]
- Gutierrez J. A.; Luo M.; Singh V.; Li L.; Brown R. L.; Norris G. E.; Evans G. B.; Furneaux R. H.; Tyler P. C.; Painter G. F.; et al. Picomolar Inhibitors as Transition-State Probes of 5′-Methylthioadenosine Nucleosidases. ACS Chem. Biol. 2007, 2, 725–734. 10.1021/cb700166z. [DOI] [PubMed] [Google Scholar]
Associated Data
This section collects any data citations, data availability statements, or supplementary materials included in this article.


