Abstract
Due to the difficulty in fabricating bioceramic scaffolds with smaller pore sizes by the current 3D printing technique, the effect of smaller pore sizes (below 400 μm) of 3D printed bioceramic scaffolds on the bone regeneration and biomechanical behavior is never studied. Herein beta-tricalcium phosphate (β-TCP) scaffolds with interconnected smaller pores of three different sizes (100, 250, and 400 μm) are fabricated by 3D plotting. The resultant scaffolds are then implanted into rat critical-sized calvarial defects without any seeded cells. A custom-designed device is developed to investigate the biomechanical properties of the scaffolds after surgical implantation for 4, 8, and 12 weeks. The scaffolds with the 100 μm pore size are found to present the highest maximum load and stiffness, comparable to those of the autogenous bone, after being implanted for 12 weeks. Micro-computed tomography (micro-CT) and histological analysis further indicate that the scaffolds with the 100 μm pore size achieve the highest percentage of new bone ingrowth, which correlates to their best in vivo biomechanical properties. This study demonstrates that tailoring the pore size of β-TCP scaffolds to a smaller range by 3D-plotting can be a facile and efficient approach to enhanced bone regeneration and biomechanical behaviors in bone repair.
Keywords: 3D plotting, biomechanical properties, bones, pore sizes, β-TCP scaffolds
1. Introduction
Bone regeneration for repairing damaged or diseased bone tissues has been recognized as the ideal therapeutic treatment for orthopedic surgeons. Artificial materials can be good alternatives for both autografts and allografts, which eliminate or minimize the risk of unwanted immune rejection and the pain caused by secondary surgery. A good bone scaffold should not only guide the ingrowth of vascular network and new tissue, but also maintain good biomechanical properties to provide structural support during bone remodeling.[1] Calcium phosphate-based ceramic materials have been the most promising bone substitute as their chemical and crystal structures are remarkably similar to natural bone.[2] However, their limited bone regeneration capacity and poor biomechanical behavior hinder their clinical applications. More importantly, the porous structure of the scaffolds governs their mechanical properties as well as new bone ingrowth.[3] Therefore, design and development of an appropriate porous structure for calcium phosphate scaffolds is of great importance.
Appropriate porous structure improved biomechanical properties with the enhanced mechanical interlocking between the implant and adjacent host tissue, owing to more new tissue growth into the 3D interconnected macropores of the scaffolds.[4] Pore features such as architecture,[5] size,[6] connectivity,[7] and porosity[8] have an effect on cellular activities and bone repair. Multifarious solutions have been attempted to prepare bone-like porous structure for bioceramic materials, such as salt leaching, gas foaming, freeze drying, and phase separation.[9] Nevertheless, the low accuracy and poor control over the pore characteristics by these traditional methods make it difficult to develop bioceramic scaffolds. With high precision and accuracy, 3D printing technique has been considered for use as an advanced alternative to conventional methods to fabricate bioceramic scaffolds.[10] However, the optimum pore sizes for promoting bone formation in bone repair by 3D printed bioceramic have not been consistent in the literature.[11] In particular, the in vivo biomechanical properties of the 3D printed bioceramic scaffolds have seldom been studied, although the mechanical properties of the scaffolds prior to implantation have been reported. Hence, to clarify the optimum pore size of a 3D-printed bioceramic scaffold, we studied the effect of the pore sizes of 3D-printed β-tricalcium phosphate (β-TCP) scaffolds on the in vivo bone formation and biomechanical properties of the scaffolds.
It is usually considered that the pores of bone scaffolds must be above the minimum size of 100 μm to ensure good vascularization, nutrient delivery, and cell adhesion/ingrowth.[12] Hence, here we used a 3D-plotting method to fabricate porous β-TCP scaffolds with three pore sizes (100, 250, 400 μm). Currently due to the difficulty in using 3D printing to form smaller pore sizes,[13] the current studies on the effect of pore sizes of the 3D printed scaffolds are limited to larger ranges (500–1300 μm).[11a,c,14,15] In order to achieve the goal of studying the effect of smaller pore sizes down to 100 μm, we added hydroxypropyl methyl cellulose (HPMC) in a small amount to form viscoelastic ceramic slurry, which enabled us to form scaffolds of smaller pore size ranges (100–400 μm). The HPMC was removed after the sintering of the scaffolds. Micro-computed tomography (Micro-CT) and scanning electron microscope (SEM) confirmed that the porous structures were fully interconnected and precisely controlled. At 4, 8, and 12 weeks after the scaffolds were implanted into calvarial defects of standard deviation (SD) rats, the biomechanical behaviors (maximum load and stiffness) of the implants were assessed by pushing the implants out of the native bone tissue using a custom-made device (Figure S1, Supporting Information). In addition, histological and micro-CT analysis was used to further investigate the bone regeneration at different implantation time points. Our study showed that even without seeding cells the scaffolds of the 100 μm pore size performed best in promoting the bone formation and improving the biomechanical properties in vivo among all the scaffolds.
2. Results
2.1. Characterization of 3D Plotted β-TCP Scaffolds
Developing a homogeneous paste with appropriate viscoelastic properties is crucial in the fabrication of bioceramic scaffolds by 3D plotting. In this study, HPMC was chosen as a binder to form viscoelastic β-TCP ceramic slurry because it had a higher viscosity (0.45 Pa s) than the other binders when they were dissolved to form a 2% aqueous solution. For example, other binders such as methyl cellulose (MC), gum xanthan, phytagel had a viscosity of 0.20 Pa s and locust bean gum had a viscosity of 0.25 Pa s. These viscosity values were determined by the rheological tests using rotational rheometer (R/S-SST, Brook-field, USA). The β-TCP slurry extruded from the syringe needle (with a nozzle of a 210 μm diameter) exhibited excellent viscoelastic behavior (Figure 1a). The suitable viscosity and stiffness of the slurry made it possible to print bioceramic scaffolds at room temperature. β-TCP bone scaffolds with varied geometric shapes (Figure 1b) and pore sizes (Figure 1c) were successfully fabricated via 3D plotting of the high purity β-TCP slurry. Figure 2 showed the β-TCP scaffolds with three different pore sizes (100, 250, and 400 μm). The corresponding scaffolds were termed Φ100, Φ250, and Φ400, respectively. X-ray diffraction (XRD) confirmed that the β-TCP crystal phase composition was kept before and after sintering of the scaffolds (Figure 2c). No obvious shrinkage and distortion were found after the scaffolds were sintered according to micro-CT analysis of the scaffolds (Figure 2a). In addition, SEM images (Figure 2b) and Table 1 showed that the interior of these scaffolds maintained designed pore structures with a precise pore size. The section profile of the reconstructed 3D images (Figure 2a and Table 1) indicated these pores were fully interconnected.
Figure 1.
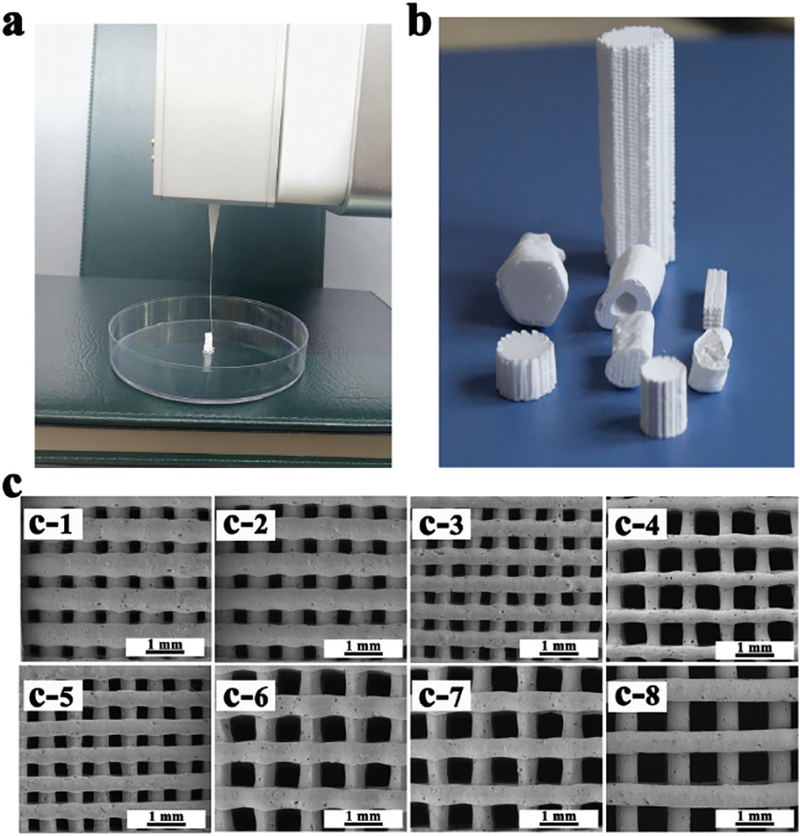
Morphologies of 3D plotted β-TCP scaffolds. a) Photograph showing the ceramic slurry (i.e., the paste) with good viscoelastic properties and it was extruded from the needle (with a nozzle diameter of 210 μm) as one long continuous strand. b) β-TCP scaffolds with different geometric shapes could be fabricated from the viscoelastic ceramic slurry via the 3D plotting method. c) SEM images showing the porous structures of the 3D-plotted β-TCP scaffolds with the following combination of the nozzle diameter and filament spacing: (c-1) 410/600 μm; (c-2) 410/700 μm; (c-3) 250/500 μm; (c-4) 210/600 μm; (c-5) 250/600 μm; (c-6) 610/1200 μm; (c-7) 610/1400 μm; (c-8) 610/1600 μm.
Figure 2.
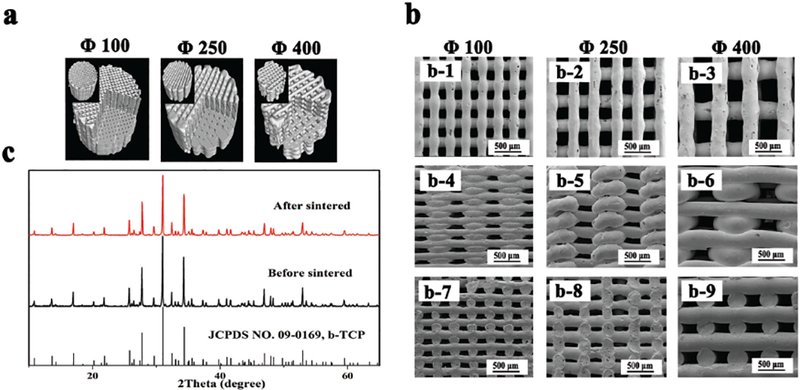
β-TCP scaffold characterization. a) 3D reconstructed images of the scaffolds by micro-CT analysis. b) SEM images of porous scaffolds with a pore size of 100, 250, and 400 μm. (b-1—b-3) Top view of the corresponding scaffolds, respectively; (b-4–b-6) Side view of the corresponding scaffolds; (b-7–b-9) Cross-sectional view of the corresponding scaffolds. c) XRD patterns of the 3D-plotted scaffolds before and after sintering.
Table 1.
Pore parameters of the three sintered scaffolds
| Scaffold type | Ave. pore diameter [μm] | Porosity [%] | Connectivity [%] |
|---|---|---|---|
| Φ100 | 119 ± 2.83 | 38.25 ± 2.52 | 99.95 ± 0.86 |
| Φ250 | 255.44 ± 1.33 | 46.56 ± 3.15 | 99.98 ± 0.32 |
| Φ400 | 392.76 ± 9.63 | 63.78 ± 2.64 | 100 ± 0.12 |
2.2. Cell Adhesion and Proliferation
The mMSCs were incubated on the porous scaffolds. Then a CCK-8 assay was carried out to observe cell proliferation on 1, 3, and 5 d. On day 3 and 5, the cells showed a threefold and fivefold in the proliferation, respectively (Figure 3b). F-actin staining assay indicated that the mMSCs on the three scaffolds covered the surface of the walls of the scaffolds with a high density after being cultured for 2 d (Figure 3a). The designed rectangle pore structure became elliptical after cell seeding, especially for the Φ100 scaffolds, indicating that the cell proliferation made the additional cells occupy some of the pore space of the scaffolds. These results confirmed the good biocompatibility of the scaffolds.
Figure 3.
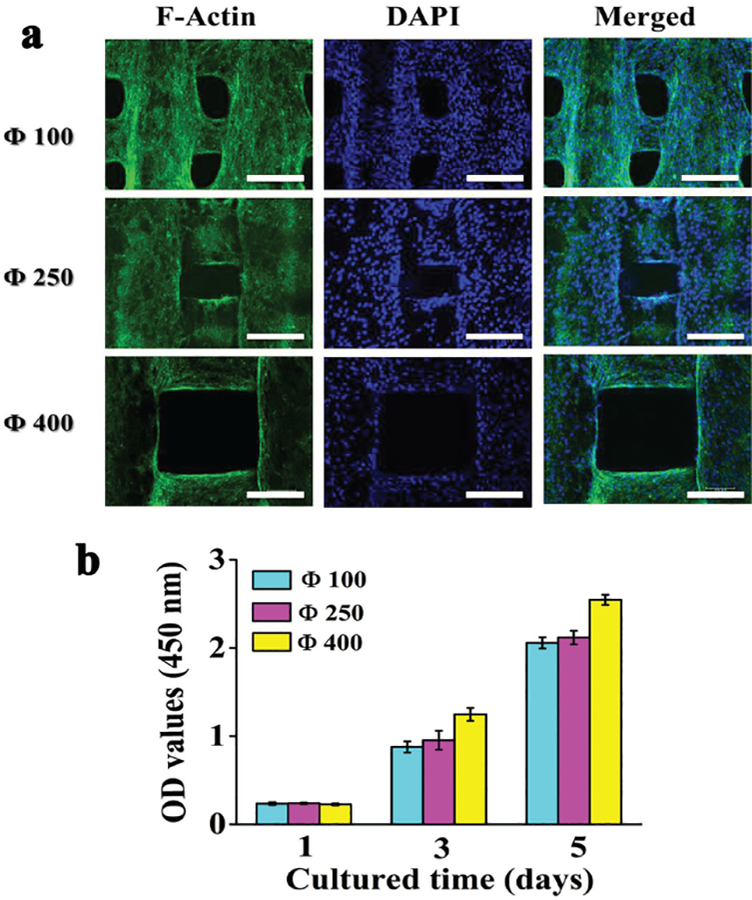
Cytological behavior of 3D Plotted β-TCP scaffolds in vitro. a) Confocal laser scanning microscopy images of mMSCs stained with F-actin (green) and DAPI (blue) after the cells were cultured for 2 d on the scaffolds of different pore sizes (100, 250, 400 μm). b) Proliferation of mMSCs cocultured on the different scaffolds for different times. All data are expressed as the mean ± standard deviation (SD) from at least three representative experiments (n = 3). Statistically significant differences (p <0.05) were measured using one-way ANOVA with a post hoc test. Scale bar: 200 μm
2.3. Evaluation of Bone Regeneration In Vivo
2.3.1. Surgeries and Macroscopic Observation
It is crucial for the implants to precisely match the defects in defect repair. In this study, the defect size (5 mm in diameter and 0.5 mm in thickness) was determined through CT scanning and image processing, followed by simulated surgical implantation (Figure 4a). β-TCP scaffolds with the same size as the defects (5 mm in diameter and 0.5 mm in thickness) were fabricated through 3D plotting, and then implanted into the defects with nice size and morphology matching (Figure 4b). The tissue-implant constructs were retrieved 4, 8, and 12 weeks post implantation. The optical images of these constructs confirmed that the scaffolds remained in the defect cavities without edge warping (Figure 4c). After implantation for 4 weeks, the boundary between the implants and the surrounding bone became indistinguishable as a result of new tissue ingrowth, showing good osteointegration ability of the implant materials. Meanwhile, the implant materials were partly resorbed. After implantation for 12 weeks, the boundary became nearly invisible, especially for the group of Φ100.
Figure 4.
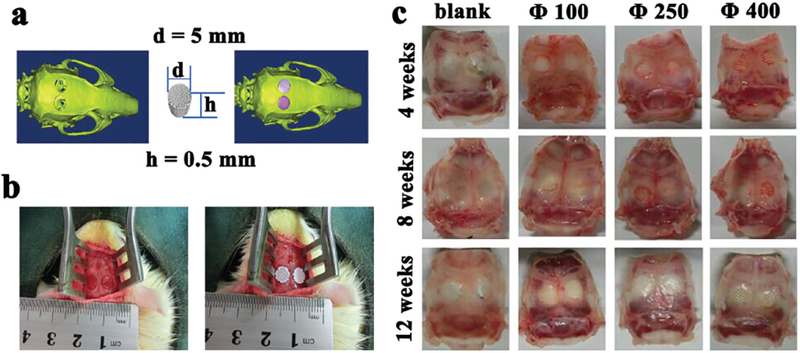
Illustration of calvarial defects, implantation sites, and bone-scaffold constructs implanted with the scaffolds of different pore sizes (100, 250, 400 μm). a) A calvarial defect model generated using Mimics 10.01 software according to the micro-CT image of the animal model (left) was used to print a scaffold customized to this defect (middle), which was implanted into the defect by simulation using the image ware 13.2 software (right). b) Bilateral operation in the SD rat cranium showing the calvarial defect before (left) and after (right) scaffold implantation, confirming that the scaffolds were nicely fitted into the defects. c) Optical images of retrieved specimens (implanted with scaffolds with different pore sizes of 100, 250, 400 μm) and blank (with defects but without implantations), showing that the scaffolds were still matching the defects after implanted in vivo for 4, 8, and 12 weeks.
2.3.2. Micro-CT Analysis
3D reconstructed images of the tissue-implant constructs showed that the implanted materials degraded with time during the process of new bone tissue ingrowth (Figure 5a). At week 4 post implantation, the scaffolds and the surrounding host bone were well integrated, and the newly formed bone started to grow into the inner pores of scaffolds. In contrast, there was hardly any new bone tissue ingrowth in the defects for blank groups. When the implantation time was prolonged, the quantity of newly formed bone in the groups of scaffolds with different pore sizes increased obviously. However, no obvious increase in bone formation was observed over the time for the blank group. Histomorphometric analysis of bone-related parameters (Figure 5b) clearly showed the distinction among these groups. Bone volume (BV) and bone mineral density (BMD) increased with time for the implantation groups, while no obvious changes occurred for the blank group. For the implantation groups, at week 4, the Φ100 group showed significantly higher BMD and BV than the Φ400 group but exhibited no obvious difference from the Φ250 group. At week 8, BMD was at the same level for all groups, but the Φ100 group showed a higher BV than the other groups. At week 12, the Φ100 group not only had remarkably higher BV than the other groups, but also presented higher BMD than the other groups although not significantly different from the Φ250 group. Overall, these data suggest that the Φ100 group performed best in inducing bone formation.
Figure 5.
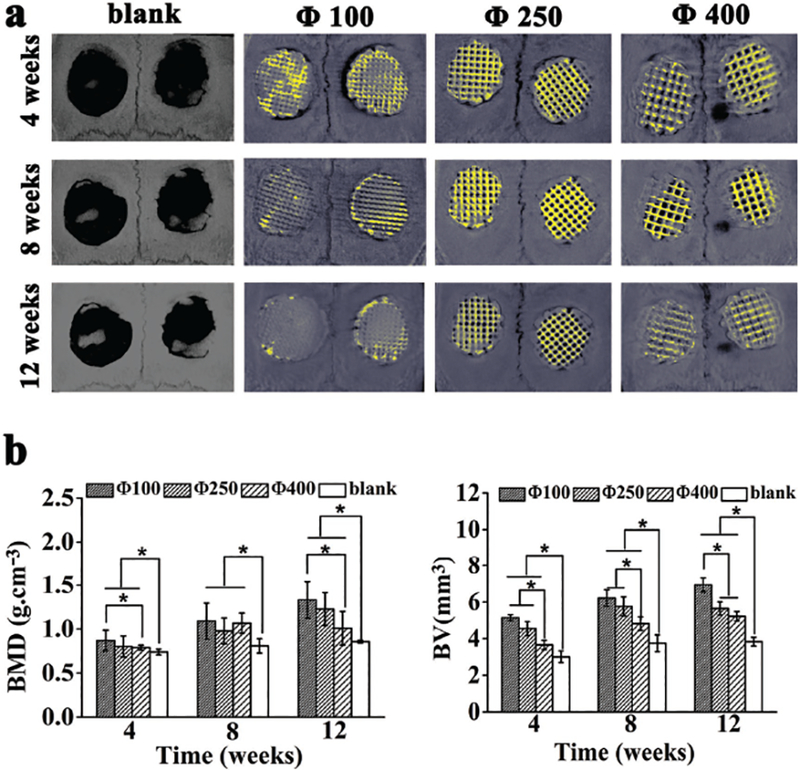
Micro-CT analysis of bone formation due to the implantation with the scaffolds of different pore sizes (100, 250, 400 μm) 4, 8, and 12 weeks post surgery. a) 3D reconstructed micro-CT images of the tissue samples with calvarial bone defects with or without implantation with scaffolds of different pore sizes (bone tissue, grey; residual scaffold materials, yellow). b) Morphometric analysis of bone mineral density (BMD) and bone volume (BV). All data are expressed as the mean ± standard deviation (SD), and * indicates statistically significant difference with p < 0.05 (n = 4).
2.3.3. Biomechanical Analysis
At week 4, 8, and 12 after implantation, the specimens were retrieved and placed flatwise on the test nut for direct mechanical testing (Figure S1, Supporting Information). The loading head was applied to the implants with gradually increasing stress until the implants were pushed out. Figure 6b showed that the maximum load and stiffness of all the implantation groups increased with the implantation time, indicating the degree of bone integration was increased over time. In the early phase (week 4), the Φ100 group showed higher maximum load than the other two pore size groups as well as the autogenous bone group (AB group), suggest that the bone and the Φ100 scaffolds were integrated together best due to the best bone ingrowth into the scaffolds. At week 8, the maximum load increased in all groups, especially AB group. No obvious difference was found in the maximum load among the scaffold groups. At week 12, the maximum load was remarkably increased in the Φ100 group (255.554 ± 13.15 N), comparable to AB group (281.381 ± 9.86 N). The maximum loads of the other two scaffold groups were still at a lower level than AB group. The Φ100 group exhibited the highest stiffness during the entire experimental period except at week 12 it has a comparable stiffness as the autogenous bone group. Taken together, these data show that the Φ100 group had the best osteointegration and biomechanical property during bone formation.
Figure 6.
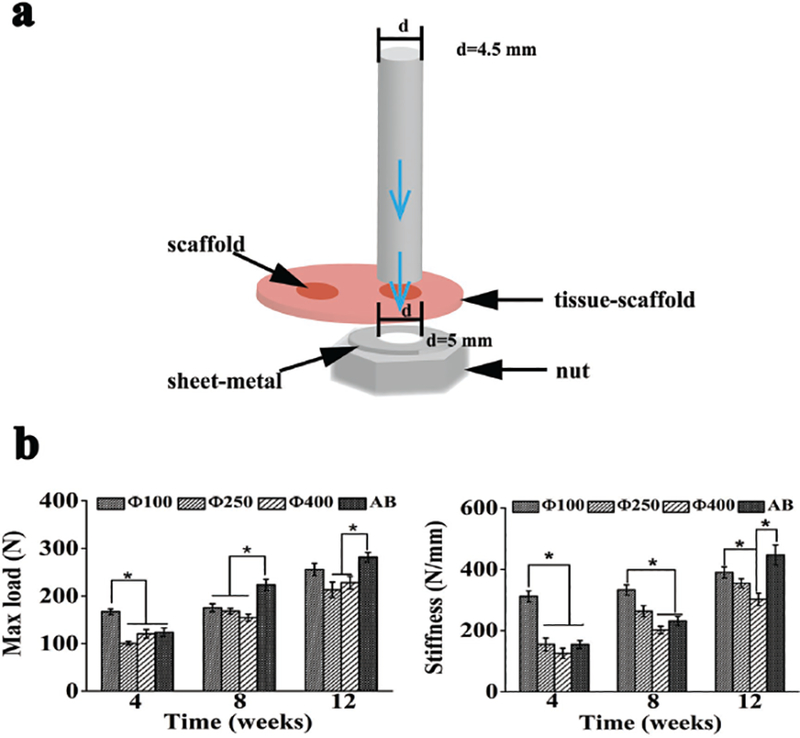
Schematic illustration of the biomechanical testing process and analysis of the implants after the defects were implanted with scaffolds of different pore sizes (100, 250, 400 μm) and autogenous bone (termed AB) for 4, 8, and 12 weeks. a) Schematic illustration of the biomechanical testing process. b) The maximum load force applied to the implants for pushing the implants out of native bone tissue (left) and the stiffness of the implants that was calculated from the linear portion of stress versus strain curves (right). All data are expressed as the mean ± standard deviation (SD), and * indicates statistically significant difference with p < 0.05 (n = 8).
2.3.4. Histological Analysis
The regular structure of implanted scaffolds and tissue infiltration could be observed within all the groups (Figure 7). During the early period after implantation, no implants evoked significant inflammatory reactions, fibrous encapsulation, or necrosis in the nearby bony tissues. Numerous mature osteocytes and typical bone marrow could be seen throughout the whole interior pore structures in the Φ100 group at week 4, while more fibrous tissue had infiltrated the voids in the Φ250 and Φ400 group. In addition to some blood vessels, more osteoblasts and no osteocytes were detected during this period. Reconstruction of bone became more extensive with time. At week 12, the newly formed bone became compact and mature lamellar bone in the Φ100 group, while there were still numerous osteoblasts colonizing throughout the fibrous network in the Φ400 group during this period. Quantitative analysis for new bone formation (Figure 7b) clearly revealed that the Φ100 group had the highest bone formation rate and still had the highest percentage of new bone (33.3 ± 3.20%) at week 12. Hence, the histological analysis of bone formation further confirms that the Φ100 group promoted the bone formation most efficiently among all of the three pore size groups.
Figure 7.
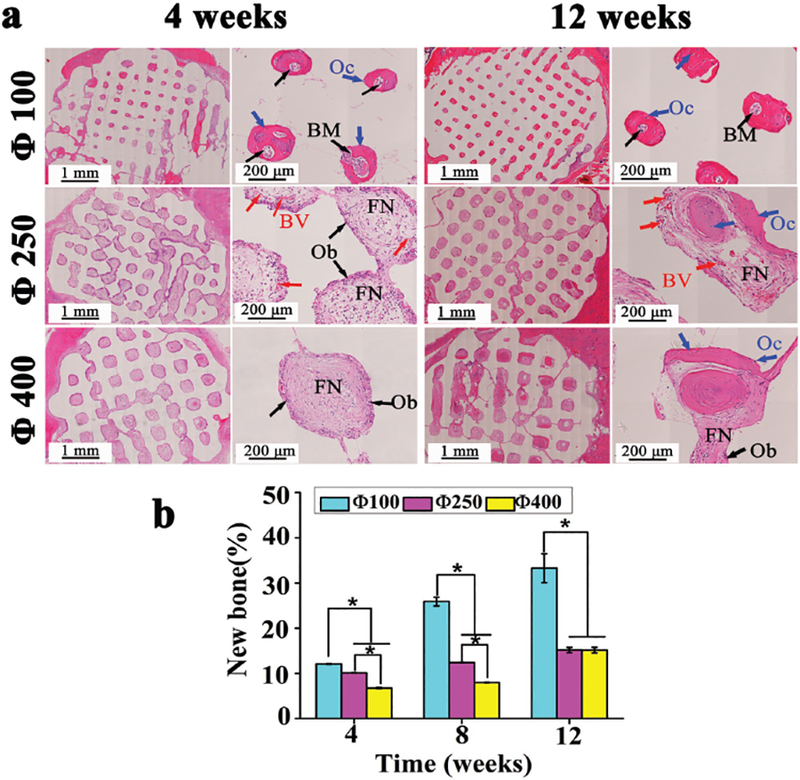
Histological analysis of bone regeneration by scaffolds of different pore sizes (100, 250, 400 μm). a) H&E staining of SD rat cranial defects after implanted with three scaffolds for 4, 8, and 12 weeks (BM: bone marrow, Oc: osteocyte, Ob: osteoblast, BV: blood vessel, FN: fibrous network). b) Quantitative analysis for the new bone formation percentage (%) calculated by the ratio between bone tissue area and implantation area in inset (a). All data are expressed as the mean ± standard deviation (SD), and * indicates statistically significant difference with p < 0.05 (n = 4).
3. Discussion
A bone scaffold could guide bone tissue formation.[16] An interconnected porous structure elicits blood vessel invasion and new bone tissue ingrowth. Precisely controlling pore features of bone scaffolds has been a promising approach to optimize the scaffold-guided bone regeneration. 3D plotting could effectively control the pore structures of scaffolds at mild conditions. Thus, it has become a high-profile technique in developing bone tissue engineering scaffolds. However, the challenging requirements of specific physicochemical properties and imprecise pore size of the macropores render 3D plotting still immature to sufficiently prepare bioceramic scaffolds.[17] Forming a paste with an appropriate viscosity is crucial for direct extrusion during the 3D plotting. Previously, many researchers created composites by adding synthetic or biological polymers [14b,18] to print inorganic materials. In our study, hydroxypropyl methyl cellulose (HPMC) was chosen as a binder at a dosage tailored to 1.2 wt% to make the ceramic slurry. The introduction of the small amount of HPMC in our paste not only endowed the paste with excellent printability, but also improved the precision and accuracy in size and shape control during the 3D plotting (Figures 1 and 2 and Table 1).
The optimum pore size for promoting bone formation has been in debate and also depends on the scaffolding materials.[16a,19] For bioceramic scaffolds, different studies reported different optimum pore sizes. For example, among four hydroxyapatite implants with a pore size of 50, 100, 300, and 500 μm, Chang et al.[20] demonstrated that more bone was formed in the scaffolds of larger pore sizes (300 and 500 μm). Olivier et al.[21] prepared two biphasic calcium phosphate ceramic scaffolds with different macropore diameters (300 and 565 μm) and found more abundant new bone in the scaffolds with large pore size. Vassilis et al. reviewed that the ceramic scaffolds of a pore size larger than 300 μm were more efficient for promoting bone formation and vascularization.[8c] They also pointed out that hypoxic conditions caused by small pores facilitated osteochondral formation, while with the aid of well-vascularization, large pores lead to direct osteogenesis. Surprisingly, our study showed that a pore size of 100 μm showed the best bone repair among β-TCP scaffolds with three pore sizes (100, 250, and 400 μm) in a calvarial defect model (Figures 5 and 7), where the bone structure is relatively more compact than the tibia or femora. Reconstruction of new bone was more active and mature bone marrow formation was observed in the smaller pore size (100 μm) group than the other two groups with lager pore sizes (Figure 7).
In addition to promoting more bone formation, achieving excellent biomechanical properties of the implants is another important goal in bone repair. The biomechanical properties of the scaffolds during in vivo bone formation are even more important because they not only reflect the degree of the scaffold’s degradation and new bone regeneration, but also indicate the degree of osteointegration. It is encouraging to find that the Φ100 group displayed the most outstanding biomechanical behavior among the three pore size groups. Especially at week 12, the maximum load and stiffness of the scaffold implanted groups markedly increased, comparable to autogenous bone implanted group (Figure 6b). The autografting is the “gold standard” in bone repair and thus the autogenous bone implanted group served as the positive control in the biomechanical study (Figure 6).
Scaffolds with smaller pore sized would bear increased surface area, which could offer more cell attachment sites.[6a,22] As shown in Figure 8, the porous scaffolds recruited the osteoprogenitor cells and stem cells from the adjacent periosteum.[23] Upon implantation in defects, the scaffolds stimulate and guide these cells to infiltrate the interior of the porous scaffolds. As soon as these cells are recruited and anchored, they proliferate and differentiate into osteogenic cells. Smaller pore size provides relatively narrower space for cell colonization and increases the opportunities for cell–cell contact, which facilitates osteoblastic differentiation.[11b] At week 4, a mass of mature osteocytes was present in the Φ100 group (Figure 7), while only a few osteoblasts and no trace of osteocytes could be found in the two larger pore size groups. It is likely that the cells need a longer proliferation period on the Φ400 scaffolds to colonize in the complete porous structures.[1b,24] At week 12, osteoblastic differentiation was still underway in the Φ400 scaffolds, where vast osteoblasts were distributed in the fibrous network. Our finding was consistent with the previous reports, in which the researchers also found a faster bone ingrowth in smaller pores and proposed that smaller pores exposed much more surface for deposition of invading tissue elements.[6c,11c,25]
Figure 8.
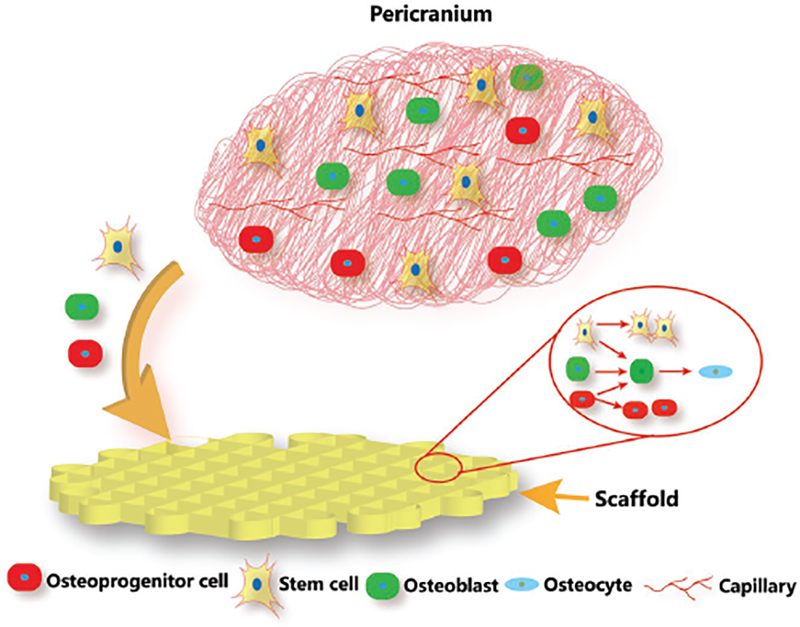
Schematic illustration showing the cell behavior in pericranium during bone regeneration process after the scaffolds were implanted in bone defects. Upon implantation in the defects, the porous scaffolds recruit the osteoprogenitor cells and stem cells from the adjacent periosteum to infiltrate the interior of the porous scaffolds. As soon as these cells are recruited and anchored, they proliferate and differentiate into osteogenic cells. Smaller pore size provides relatively narrower space for cell colonization and increases the opportunities for cell–cell contact, which facilitates osteoblastic differentiation.
4. Conclusion
β-TCP scaffolds with smaller pore sizes were successfully prepared by 3D-plotting method. Among the scaffolds with three pore sizes (100, 250, and 400 μm), the ones with the 100 μm pore size showed the most efficient bone regeneration in the calvarial defects of SD rats during a period of 12 weeks. Micro-CT and histological analysis consistently indicated that the scaffolds with the 100 μm pore size displayed the most abundant new bone ingrowth among all of the scaffolds being studied. The scaffolds with 100 μm pore size also presented the highest maximum load and stiffness, at a level comparable to the autogenous bone implants, after being implanted in the calvarial defects of SD rats for 12 weeks. Our work demonstrates that the pore size of a scaffold directly influenced new bone formation and biomechanical behavior at the scaffold-bone interface. It provides a significant reference to design the 3D architecture of a bone scaffold by 3D plotting technique.
5. Experimental Section
Synthesis of β-TCP Powders:
A typical precipitation method was used to synthesize β-TCP powders. Specifically, Ca(NO3)2·4H2O and polyethylene glycol (PEG) (6000) were dissolved in deionized water to obtain Ca(NO3)2 solution (0.3 M) by stirring at ambient temperature. The solution was mixed with 0.2 M (NH4)2HPO4 solution, and the pH value was controlled at 7 for precipitation. The coprecipitation mixture underwent stirring continuously for 12 h followed by a 2 d period of nonagitation. After filtration and washing, the precipitate was freeze-dried. The product powders were calcined to 800 °C in air with a heating rate of 3 °C min−1, and in the end cooled down to 50 °C after the soaking stage of 3 h at 800 °C.
Fabrication of β-TCP Scaffolds:
A bioceramic paste was prepared as follows. 0.2756 g of HPMC was put in 9 mL distilled water and dissolved by magnetic stirring, during which the pH of the solution was adjusted to 9 by adding 1 M NH3·H2O dropwise. Then the HPMC solution and 22.9745 g of β-TCP powder were mixed and ground by a ball grinder to obtain a paste with an appropriate viscosity for printing. Subsequently, the prepared paste was transferred into a matched injection cartridge and then operated with the 3D Bio-Architectwork station (Hangzhou, China).
According to the loaded cubical or cylindrical model, the correspondent scaffolds were printed layer-by-layer by extruding the paste as a fiber. The interconnected square-shaped macropores were designed to align orthogonally along X-, Y-, and Z-directions. The system worked under room temperature during all processes, including the prototyping platform. The dosing pressure of syringe pump and the speed of the dispensing unit were adjusted based on the expected pore size. We chose the printing nozzle with 210, 250, and 400 μm in diameter to prepare scaffolds with three different pore sizes, namely, 100, 250, and 400 μm, respectively. The obtained scaffolds sintered at a high temperature (1130 °C) for 3 h after air-drying.
Characterization of Scaffolds:
Field emission scanning electron microscope (SEM) was used to observe the morphology and structure of the scaffolds. Micro-CT (XTV160H, Nikon, Japan) was carried out with a voltage at 65 kV, a current at 78 μA, and a rotation angle at 0.5°/once to obtain the reconstructed 3D image and pore parameters of sintered scaffolds. The phase compositions of the printed scaffolds were characterized by X-ray diffraction (XRD) analyses.
Cell Attachment and Proliferation of mMSCs Cells:
To evaluate in vitro cell behavior, mouse mesenchymal stem cells (mMSCs, CRL-12424, ATCC, USA) were used as model cells. To increase the seeding efficiency, 30 μL cell suspension with the cell density of 5 × 10⁴ mMSCs were seeded on each scaffold in a 48-well plate and incubated at 37 °C under an atmosphere of 5% CO2 for 3 h, allowing the cells to adhere to the scaffold. Then, 800 μL high glucose Dulbecco’s modified Eagle’s medium (H-DMEM, Gibco, USA) supplemented with 10% fetal bovine serum (FBS) was added. The medium was refreshed every 2 d. After 2 d of culturing, fluorescent staining of the cytoskeleton protein F-actin by phalloidin-fluorescein Isothiocyanate (FITC) was carried out to evaluate cell adhesion. 4′,6-diamidino-2-phenylindole (DAPI) was used to stain cell nuclei for 10 min. The stained cells were observed by a confocal microscope. Cell Counting Kit-8 assay (CCK-8, Dojindo Laboratories, Japan) was carried out to detect the proliferation of mMSCs cells after being cultured on the scaffolds.
In Vivo Study:
All animal experiments were approved by the Animal Research Committee of Southern Medical University, Guangzhou. All SD rats (with an average body weight of 180–200 g) were first anesthetized by Pelltobarbitalum Natricum at a dose of 1 mL per 1 kg body weight. Bilateral surgeries were performed along the sagittal suture. To generate a cranial defect, a 5 mm diameter hole with a depth of 0.5 mm height was drilled. Then, the scaffolds (5 mm in diameter and 0.5 mm in height) matching the created defects were implanted, followed by suturing of the well-preserved periosteum and skin surrounding the defect and the subsequent closure of incision. The wound site was wrapped up by a gauze to prevent infection. The rats were euthanized 4, 8, and 12 weeks postimplantation and the tissue-scaffold constructs were harvested and subjected to micro-CT imaging, biochemical testing, and histological analysis.
Micro-CT Test:
After implantation for 4, 8, and 12 weeks, the harvested specimens were fixed in 4% paraformaldehyde solution immediately. Micro-CT (SKYSCan1176, Germany) was used to investigate bone formation to repair the SD rats’ cranial defects. It was carried out at a current of 313 μA, a voltage of 80 kV, and an image pixel size of 17.4 μm. The collected data were analyzed to obtain the reconstructed 3D images and bone related parameters.
Biomechanical Test In Vivo:
Biomechanical test was done on a universal testing machine (ElectroForce3510, America). After the scaffolds were implanted for 4, 8, and 12 weeks, the tissue-scaffold constructs were retrieved (n = 8). To ensure specimens were loaded by sheer force, custom-made holders were fabricated to fix the samples. The maximum load and stiffness of the implants were measured as illustrated in Figure 6a. The maximum load referred to the maximum load force applied to the implants when the implants were pushed out of native bone tissue. Stiffness was determined from the linear portion of stress versus strain curves.
Histological Analysis:
After being fixed in 4% paraformaldehyde solution, the harvested samples were dipped in neutral 10% ethylene diamine tetraacetic acid (EDTA) solution for a period of 4 weeks with the solution refreshed every 2 d to become decalcified. Subsequently, the specimens were dehydrated through graded alcohol (70%–100%) and then embedded in paraffin blocks. The specimens were then cut into 5 μm thick histological sections using a microtome. After deparaffinization and hydration, the resultant sections were stained with Harris hematoxylin and eosin solution (HE) and subjected to optical imaging and histomorphometric analysis using Image Pro-plus.
Statistical Analysis:
Each experiment was repeated more than three times. The quantitative data were represented as means ± standard deviation with five replicates. All data were statistically analyzed using one-way ANOVA with a post hoc test. A p-value less than 0.05 was considered as statistically significant.
Supplementary Material
Acknowledgement
This work was supported by the National key R&D Program of China (2017YFC1105000 and 2016YFA0100900), the Science and Technology Program of Guangzhou City (201607010234), the National Natural Science Foundation of China (31700823 and 51673168), the Science and Technology program of Guangdong Province (2017B030314008, 2017B090911008). C.B.M. would like to acknowledge the support from the Institute for Biomedical Engineering, Science and Technology (IBEST) of the University of Oklahoma and National Institutes of Health (CA195607).
Footnotes
The ORCID identification number(s) for the author(s) of this article can be found under https://doi.org/10.1002/adhm.201800441.
Supporting Information
Supporting Information is available from the Wiley Online Library or from the author.
Conflict of Interest
The authors declare no conflict of interest.
Contributor Information
Jingjing Diao, School of Materials Science and Engineering, South China University of Technology, Guangzhou 510641, China; Nation Engineering Research Centre for, Tissue Restoration and Reconstruction, Guangzhou 510006, China; Guangdong Province Key Laboratory of Biomedical Engineering, South China University of Technology, Guangzhou 510006, China.
Jun Ou Yang, Department of Anatomy, Guangdong Provincial Key Laboratory of Medical Biomechanics, Southern Medical University, Guangzhou 510515, China.
Ting Deng, Department of Anatomy, Guangdong Provincial Key Laboratory of Medical Biomechanics, Southern Medical University, Guangzhou 510515, China.
Xiao Liu, School of Materials Science and Engineering, South China University of Technology, Guangzhou 510641, China; Nation Engineering Research Centre for, Tissue Restoration and Reconstruction, Guangzhou 510006, China; Guangdong Province Key Laboratory of Biomedical Engineering, South China University of Technology, Guangzhou 510006, China.
Yanting Feng, Department of Anatomy, Guangdong Provincial Key Laboratory of Medical Biomechanics, Southern Medical University, Guangzhou 510515, China.
Naru Zhao, School of Materials Science and Engineering, South China University of Technology, Guangzhou 510641, China; Nation Engineering Research Centre for, Tissue Restoration and Reconstruction, Guangzhou 510006, China; Guangdong Province Key Laboratory of Biomedical Engineering, South China University of Technology, Guangzhou 510006, China.
Chuanbin Mao, Department of Chemistry & Biochemistry, Stephenson Life Sciences Research Center, Institute for Biomedical Engineering, Science and Technology, University of Oklahoma, 101 Stephenson Parkway, Room 3310, Norman, OK 73019–5300, USA; School of Materials Science and Engineering, Zhejiang University, Hangzhou, Zhejiang 310027, China.
Yingjun Wang, School of Materials Science and Engineering, South China University of Technology, Guangzhou 510641, China; Nation Engineering Research Centre for, Tissue Restoration and Reconstruction, Guangzhou 510006, China; Guangdong Province Key Laboratory of Biomedical Engineering, South China University of Technology, Guangzhou 510006, China.
References
- [1].a) Holmes B, Bulusu K, Plesniak M, Zhang LG, Nanotechnology 2016, 27, 064001; [DOI] [PMC free article] [PubMed] [Google Scholar]; b) Perez RA, Seo S-J, Won J-E, Lee E-J, Jang J-H, Knowles JC, Kim H-W, Mater. Today 2015, 18, 573. [Google Scholar]
- [2].a) Galvan-Chacon VP, Habibovic P, Adv. Healthcare Mater 2017, 6, 1601478; [DOI] [PubMed] [Google Scholar]; b) Ghosh S, Reis RL, Mano JF, Adv. Eng. Mater 2008, 10, B18. [Google Scholar]
- [3].Chang CH, Lin CY, Liu FH, Chen MH, Lin CP, Ho HN, Liao YS, PloS one 2015, 10, e0143713. [DOI] [PMC free article] [PubMed] [Google Scholar]
- [4].Tarafder S, Bose S, ACS Appl. Mater. Interfaces 2014, 6, 9955. [DOI] [PMC free article] [PubMed] [Google Scholar]
- [5].a) Wang H, Zhi W, Lu X, Li X, Duan K, Duan R, Mu Y, Weng J, Acta Biomater. 2013, 9, 8413; [DOI] [PubMed] [Google Scholar]; b) Zhang Y, Fan W, Ma Z, Wu C, Fang W, Liu G, Xiao Y, Acta Biomater. 2010, 6, 3021; [DOI] [PubMed] [Google Scholar]; c) Mastrogiacomo M, Scaglione S, Martinetti R, Dolcini L, Beltrame F, Cancedda R, Quarto R, Biomaterials 2006, 27, 3230; [DOI] [PubMed] [Google Scholar]; d) Chu TMG, Orton DG, Hollister SJ, Feinberg SE, Halloran JW, Biomaterials 2002, 23, 1283. [DOI] [PubMed] [Google Scholar]
- [6].a) Murphy CM, Haugh MG, O’Brien FJ, Biomaterials 2010, 31, 461; [DOI] [PubMed] [Google Scholar]; b) Tsuruga E, Takita H, Itoh H, Wakisaka Y, Kuboki Y, J. Biochem 1997, 121, 317; [DOI] [PubMed] [Google Scholar]; c) Eggli PS, Muller W, Schenk RK, Clin. Orthop. Relat. Res 1988, 232, 127. [PubMed] [Google Scholar]
- [7].Lu JX, Flautre B, Anselme K, Hardouin P, Gallur A, Descamps M, Thierry B, J. Mater. Sci.: Mater. Med 1999, 10, 111. [DOI] [PubMed] [Google Scholar]
- [8].a) Woodard JR, Hilldore AJ, Lan SK, Park CJ, Morgan AW, Eurell JA, Clark SG, Wheeler MB, Jamison RD, Wagoner Johnson AJ, Biomaterials 2007, 28, 45; [DOI] [PubMed] [Google Scholar]; b) Kasten P, Beyen I, Niemeyer P, Luginbuhl R, Bohner M, Richter W, Acta Biomater. 2008, 4, 1904; [DOI] [PubMed] [Google Scholar]; c) Vassilis V, Kaplan D, Biomaterials 2005, 26, 5474. [DOI] [PubMed] [Google Scholar]
- [9].Park S-H, Jung CS, Min B-H, Tissue Eng. Regener. Med 2016, 13, 622. [DOI] [PMC free article] [PubMed] [Google Scholar]
- [10].a) Do AV, Khorsand B, Geary SM, Salem AK, Adv. Healthcare Mater 2015, 4, 1742; [DOI] [PMC free article] [PubMed] [Google Scholar]; b) Travitzky N, Bonet A, Dermeik B, Fey T, Filbert-Demut I, Schlier L, Schlordt T, Greil P, Adv. Eng. Mater 2014, 16, 729. [Google Scholar]
- [11].a) Xu M, Zhai D, Chang J, Wu C, Acta Biomater. 2014, 10, 463; [DOI] [PubMed] [Google Scholar]; b) Wu C, Fan W, Zhou Y, Luo Y, Gelinsky M, Chang J, Xiao Y, J. Mater. Chem 2012, 22, 12288; [Google Scholar]; c) Shao H, Ke X, Liu A, Sun M, He Y, Yang X, Fu J, Liu Y, Zhang L, Yang G, Xu S, Gou Z, Biofabrication 2017, 9, 025003. [DOI] [PubMed] [Google Scholar]
- [12].a) Park SA, Lee SH, Kim WD, Bioprocess Biosyst. Eng 2011, 34, 505; [DOI] [PubMed] [Google Scholar]; b) Bose S, Roy M, Bandyopadhyay A, Trends Biotechnol. 2012, 30, 546; [DOI] [PMC free article] [PubMed] [Google Scholar]; c) Cyster LA, Grant DM, Howdle SM, Rose FR, Irvine DJ, Freeman D, Scotchford CA, Shakesheff KM, Biomaterials 2005, 26, 697; [DOI] [PubMed] [Google Scholar]; d) Vallet-Regi M, Ruiz-Hernandez E, Adv. Mater 2011, 23, 5177. [DOI] [PubMed] [Google Scholar]
- [13].Bose S, Vahabzadeh S, Bandyopadhyay A, Mater. Today 2013, 16, 496. [Google Scholar]
- [14].a) Tarafder S, Dernell WS, Bandyopadhyay A, Bose S, J. Biomed. Mater. Res., Part B 2015, 103, 679; [DOI] [PubMed] [Google Scholar]; b) Wu C, Luo Y, Cuniberti G, Xiao Y, Gelinsky M, Acta Biomater. 2011, 7, 2644. [DOI] [PubMed] [Google Scholar]
- [15].Wang J, Yang M, Zhu Y, Wang L, Tomsia AP, Mao CB, Adv. Mater 2014, 26, 4961. [DOI] [PMC free article] [PubMed] [Google Scholar]
- [16].Zhang XY, Fang G, Zhou J, Materials 2017, 10, 50. [DOI] [PMC free article] [PubMed] [Google Scholar]
- [17].a) Charbonnier B, Laurent C, Blanc G, Valfort O, Marchat D, Adv. Eng. Mater 2016, 18, 1728; [Google Scholar]; b) Xu M, Li H, Zhai D, Chang J, Chen S, Wu C, J. Mater. Chem. B 2015, 3, 3799; [DOI] [PubMed] [Google Scholar]; c) Lai Y, Cao H, Wang X, Chen S, Zhang M, Wang N, Yao Z, Dai Y, Xie X, Zhang P, Yao X, Qin L, Biomaterials 2018, 153, 1. [DOI] [PubMed] [Google Scholar]
- [18].a) Pati F, Song TH, Rijal G, Jang J, Kim SW, Cho DW, Biomaterials 2015, 37, 230; [DOI] [PubMed] [Google Scholar]; b) Declercq HA, Desmet T, Berneel EE, Dubruel P, Cornelissen MJ, Acta Biomater. 2013, 9, 7699; [DOI] [PubMed] [Google Scholar]; c) Inzana JA, Olvera D, Fuller SM, Kelly JP, Graeve OA, Schwarz EM, Kates SL, Awad HA, Biomaterials 2014, 35, 4026; [DOI] [PMC free article] [PubMed] [Google Scholar]; d) Zhao S, Zhang J, Zhu M, Zhang Y, Liu Z, Tao C, Zhu Y, Zhang C, Acta Biomater. 2015, 12, 270; [DOI] [PubMed] [Google Scholar]; e) Martinez-Vazquez FJ, Cabanas MV, Paris JL, Lozano D, Vallet-Regi M, Acta Biomater. 2015, 15, 200. [DOI] [PubMed] [Google Scholar]
- [19].a) Hulbert SF, Young FA, Mathews RS, Klawitter JJ, Talbert CD, Stelling FH, J. Biomed. Mater. Res 1970, 4, 433; [DOI] [PubMed] [Google Scholar]; b) Navarro M, del Valle S, Martinez S, Zeppetelli S, Ambrosio L, Planell JA, Ginebra MP, Biomaterials 2004, 25, 4233. [DOI] [PubMed] [Google Scholar]
- [20].Chang B-S, Lee i. C. K. f. C.-K., Hong K-S, Youn H-J, Ryu H-S, Chung S-S, Park K-W, Biomaterials 2000, 21, 1291. [DOI] [PubMed] [Google Scholar]
- [21].Gauthier O, Bouler J-M, Aguado E, Pilet P, Daculsi G, Biomaterials 1998, 19, 133. [DOI] [PubMed] [Google Scholar]
- [22].Bobbert FSL, Zadpoor AA, J. Mater. Chem. B 2017, 5, 6175. [DOI] [PubMed] [Google Scholar]
- [23].Cancedda R, Giannoni P, Mastrogiacomo M, Biomaterials 2007, 28, 4240. [DOI] [PubMed] [Google Scholar]
- [24].Phadke A, Hwang Y, Kim SH, Kim SH, Yamaguchi T, Masuda K, Varghese S, Eur. Cells Mater. 2013, 25, 114. [DOI] [PMC free article] [PubMed] [Google Scholar]
- [25].Grynpas MD, Pilliar RM, Kandel RA, Renlund R, Filiaggi M, Dumitriu M, Biomaterials 2002, 23, 2063. [DOI] [PubMed] [Google Scholar]
Associated Data
This section collects any data citations, data availability statements, or supplementary materials included in this article.


