

Abstract
BACKGROUND:
Poor glycemic control is associated with increased risk of cardiovascular disease (CVD) in type 1 diabetes (T1D); however, little is known about mechanisms specific to T1D. In T1D, myocardial injury can induce persistent cardiac autoimmunity. Chronic hyperglycemia causes myocardial injury, raising the possibility that hyperglycemia-induced cardiac autoimmunity could contribute to long-term CVD complications in T1D.
METHODS:
We measured the prevalence and profiles of cardiac autoantibodies (AAb) in longitudinal samples from the T1D Diabetes Control and Complications Trial (DCCT), in participants with mean HbA1c≥9.0% (n=83) and ≤7.0% (n=83) during the DCCT. We assessed subsequent coronary artery calcification [(CAC), measured once during years 7–9 in the post-DCCT Epidemiology of Diabetes Interventions and Complications [EDIC] observational study), high-sensitivity C-reactive protein ([hsCRP], measured during EDIC years 4–6), and CVD events (defined as: nonfatal myocardial infarction, stroke, death from CVD, heart failure, or coronary-artery bypass graft) over 26-year median follow up. Cardiac AAb were also measured in matched type 2 diabetes (T2D) patients with HbA1c≥9.0% (n=70) and ≤7.0% (n=140) and, as a control for cardiac autoimmunity, patients with Chagas cardiomyopathy (n=51).
RESULTS:
Apart from HbA1c levels, the DCCT groups shared similar CVD risk factors at the beginning and end of DCCT. The DCCT HbA1c≥9.0% group showed markedly higher cardiac AAb levels than the HbA1c≤7.0% group during DCCT, with a progressive increase and decrease in AAb levels over time in the two groups, respectively (P<0.001). In the HbA1c≥9.0% group, 46%, 22%, and 11% tested positive for ≥1, ≥2, and ≥3 different cardiac AAb types, respectively, similar to Chagas cardiomyopathy patients, compared with 2%, 1%, and 0% in the HbA1c≤7.0% group. Glycemic control was not associated with AAb prevalence in T2D. Positivity for ≥2 AAb during DCCT was associated with increased risk of CVD events (4/6, HR 16.1 [95% CI 3.0–88.2]) and, in multivariable analyses, with detectable CAC (13/31, OR 60.1 [95% CI 8.4–410.0]). Patients with ≥2 AAb subsequently also showed elevated hsCRP levels (6.0 mg/L versus 1.4 mg/L in patients with ≤1 AAb [P=0.003]).
CONCLUSIONS:
Poor glycemic control is associated with cardiac autoimmunity in T1D. Furthermore, cardiac AAb positivity is associated with increased risk of CVD decades later, suggesting a role for autoimmune mechanisms in the development of CVD in T1D, possibly through inflammatory pathways.
Keywords: diabetes mellitus, hyperglycemia, autoantibodies, biomarkers, cardiovascular disease
INTRODUCTION
Despite improvements in cardiovascular disease (CVD) outcomes in type 1 diabetes (T1D)1, patients with poor glycemic control experience >10-fold increased risk of morbidity and mortality from CVD compared to the general population.2, 3 Patients with T1D generally do not share the same CVD risk factors as those with type 2 diabetes (T2D),2–5 and conventional CVD risk factors explain less than half of the increased CVD risk in T1D.4, 6 Despite evidence that lowering HbA1c to near-normal levels reduces the development of diabetes complications in T1D,7, 8 25–30% of patients currently have poor glycemic control.3, 9 Without knowledge of T1D-specific mechanisms for CVD, it is difficult to identify which patients might benefit from more aggressive cardioprotective measures10 or design T1D-targeted CVD therapies.
A large body of evidence implicates inflammation, including dysfunctional adaptive immunity, in the pathogenesis of atherosclerosis.11–13 Type 1 diabetes is an autoimmune disorder that is thought to be triggered by dysregulated (‘overreactive’) adaptive immune responses to pancreatic islet injury.14 Although this disease process is T-cell mediated,15, 16 the presence of islet autoantibodies (AAb), particularly ≥2 different islet AAb types, is strongly predictive of progression to clinical T1D.17–19 Recently, our group has shown that myocardial infarction (MI) in T1D mouse models and T1D patients – but not post-MI control mice and T2D patients – induces sustained proinflammatory CD4+ T cell and AAb responses against α-myosin heavy chain (MYH6), a major autoantigen in myocarditis.20
Chronic hyperglycemia may also cause cardiomyocyte injury.21–24 We hypothesized that chronic hyperglycemia would induce cardiac autoimmunity in T1D, and that these dysfunctional immune responses would be associated with an inflammatory state, thereby increasing CVD risk. The landmark Diabetes Control and Complications Trial (DCCT) provided a unique opportunity to test these hypotheses since participants were devoid of CVD complications at baseline and the two diabetes treatment groups (“intensive” and “conventional”) achieved markedly different mean HbA1c levels during the trial. Furthermore, CVD outcomes were available from the post-DCCT Epidemiology of Diabetes Interventions and Complications (EDIC) observational study, with a 30-year follow-up.8, 25
METHODS
The data, analytic methods, and study materials will be/have been made available to other researchers through the NIDDK Central Repository26 for purposes of reproducing the results or replicating the procedures, with biosamples subject to approval by NIDDK.
Patients and experimental design
We analyzed samples from T1D participants in the DCCT study and from three additional well-characterized groups: 1) a T2D cohort without clinical CVD,27 2) a chronic Chagas cardiomyopathy cohort, and 3) a healthy control group.28 The T2D cohort was included to examine the effect of hyperglycemia in the absence of an autoimmune-prone T1D background, while the Chagas cardiomyopathy cohort represented a positive control, since this disease is believed to represent a form of chronic myocarditis driven by autoimmunity against cardiac myosin.29
Type 1 Diabetes
The DCCT study cohort has been described in detail.7 In brief, between 1983–1993, 1,441 patients (age 13–39 years) with T1D were randomly assigned to conventional versus intensive diabetes therapy, achieving mean HbA1c levels of 9.1% and 7.2%, respectively. At baseline visit (1983–1989), all participants were free of a history of clinical CVD, hypertension, and hypercholesterolemia. The Primary Prevention cohort had a short duration of diabetes (1–5 years) and was devoid of retinopathy or microalbuminuria at baseline. Following DCCT, the cohort was followed up annually in the observational EDIC study (1994 to present).30 The mean HbA1c during EDIC has been 8.0% in both groups.31 The current studies include follow-up through 12/31/2013 (EDIC year 20).25
Based on a preliminary cross-sectional study suggesting a relationship between expression of cardiac AAb and glycemic control in young adults with T1D with HbA1c≤7.0% and ≥9.0% (Supplemental Figure 1) we estimated that ≥3 longitudinal samples from at least 144 patients in the DCCT Primary Prevention cohort (72 in each HbA1c group) would be required to have 80% power at a type I error rate of 0.05 to detect a 20% relative between-group difference in the proportion of patients testing positive for cardiac AAb over time. We requested longitudinal samples from conventionally treated participants with mean HbA1c levels (defined as the average of all available longitudinal HbA1c data up to the last visit of DCCT) ≥9.0% and contemporaneously obtained longitudinal samples from intensively treated patients with mean HbA1c ≤7.0%, matched for age, sex, and T1D duration, from the NIDDK Repository (Supplemental Figure 2). We excluded patients who developed CVD events (defined as: nonfatal MI, stroke, cardiovascular death, confirmed angina, congestive heart failure, and coronary-artery revascularization)25 and renal disease (defined as: albumin excretion rate ≥300 mg /24 h; eGFR<60 mL/min/1.73m2)25 during DCCT.
On the basis of this information and after 1:1 case:control matching and determining sample availability, we obtained 500 serum samples, 234 from 83 patients with mean HbA1c≥9.0%, and 266 from 83 patients with mean HbA1c≤7.0% during DCCT (Supplemental Figures 2 and 3). 5 µg of genomic DNA for HLA typing was also provided.
Type 2 Diabetes
We obtained serum samples from a T2D cohort without clinical CVD,27 one group with HbA1c≥9.0% (n=70) and the other with HbA1c≤7.0% (n=140) (Supplemental Table 1).
Chronic Chagas Cardiomyopathy
Serum samples were obtained from the Brazilian Consortium of Genetics in Chagas cardiomyopathy cohort (mean ejection fraction, 32%; NYHA functional class ≥II, 88%; Supplemental Table 2).
Healthy Control Subjects
Serum samples from 115 healthy control subjects28 were analyzed as a reference to determine the cutoffs for AAb positivity.
HLA Genotyping
HLA genotyping was performed as described.32
Detection of Cardiac Autoimmunity
Based on previous studies showing that the use of a panel of cardiac AAb provided more sensitivity and specificity for the detection of myocarditis than a single AAb,28 we measured AAb to the following antigens: 1. full-length (FL)-MYH6; 2. FL-MYH7; 3. cardiac troponin I (cTnI); 4. S1 “head” fragment of MYH6 (S1-MYH6); and 5. S2-fragment of MYH6 (S2-MYH6).28
Cardiac AAb were quantitated with fluid-phase radioimmunoprecipitation assays using in vitro transcribed and translated cDNAs encoding MYH6, MYH7, S1-MYH6, S2-MYH6, and cTnI, as described28 with minor modifications (Supplemental Method). The AAb index was defined by: [CPM in the unknown sample – CPM in the negative control standard]/[CPM in the positive standard – CPM in the negative standard] x 100. These AAb assays were reproducible with the following intra- and inter-assay coefficients of variation (%): FL-MYH6: 3.0, 6.3; S1-MYH6: 5.6, 12.0; S2-MYH6: 8.3, 11.9; FL-MYH7: 6.8, 13.4 and cTnI: 4.4, 10.0, respectively; within the range of other AAb assays used in multicenter clinical trials.33
Cardiovascular Disease Outcomes
The cardiovascular outcomes were defined as a composite of: nonfatal MI, stroke, CVD death, congestive heart failure [CHF], or coronary artery bypass grafting (CABG) that occurred between the end of DCCT and EDIC year 20.25 Furthermore, we examined coronary artery calcification (CAC), measured once during EDIC years 7–9.34
Statistical Analyses
Clinical characteristics were compared using Student’s t-test or Wilcoxon test for continuous variables and the chi-squared test for categorical variables. Where multiple between-group comparisons were made, ANOVA or the Kruskal-Wallis test were used, and when appropriate, pairwise differences of interest were assessed with Student’s t-test. The cardiac AAb levels and their changes across time between the two DCCT HbA1c groups were compared with linear mixed models. These repeated-measure models included the group assignment, year of DCCT treatment and their interaction over time. Logistic regression was used to investigate the relationship between AAb status and odds of having subsequent CAC or a CVD event (odds ratio [OR] and 95% confidence interval [CI]). Cox proportional hazards regression was used to assess the risk of incident CVD events relative to the number of cardiac AAb (hazard ratio [HR] and 95% CI) and the Kaplan-Meier method and long-rank test were used to evaluate time-to-CVD events. Multivariable models examined the independent association of cardiac AAb, adjusted for age at visit prior to the CAC measurement, sex, smoking status, and hypertension at the end of DCCT study, to CAC risk. To examine the relationship between the type or number of AAb during DCCT and high-sensitivity C-reactive protein (hsCRP) levels, the latter were log-transformed and analyzed by means of linear regression models not including (unadjusted analyses) or including sex (adjusted analyses) as an additional covariate. To facilitate interpretation, hsCRP data are presented as medians (1st, 3rd quartiles) in the original scale. For all inferential analyses, estimates of effects are reported with 95% CI and two-sided p-values. A two-sided P<0.05 was nominally significant. In Figure 1, we corrected for multiple testing using the Benjamini-Hochberg procedure to control the false discovery rate at 5%.35 All statistical analyses were conducted with SAS version 9.4.
Figure 1. Levels of cardiac autoantibodies in subjects from the different groups.
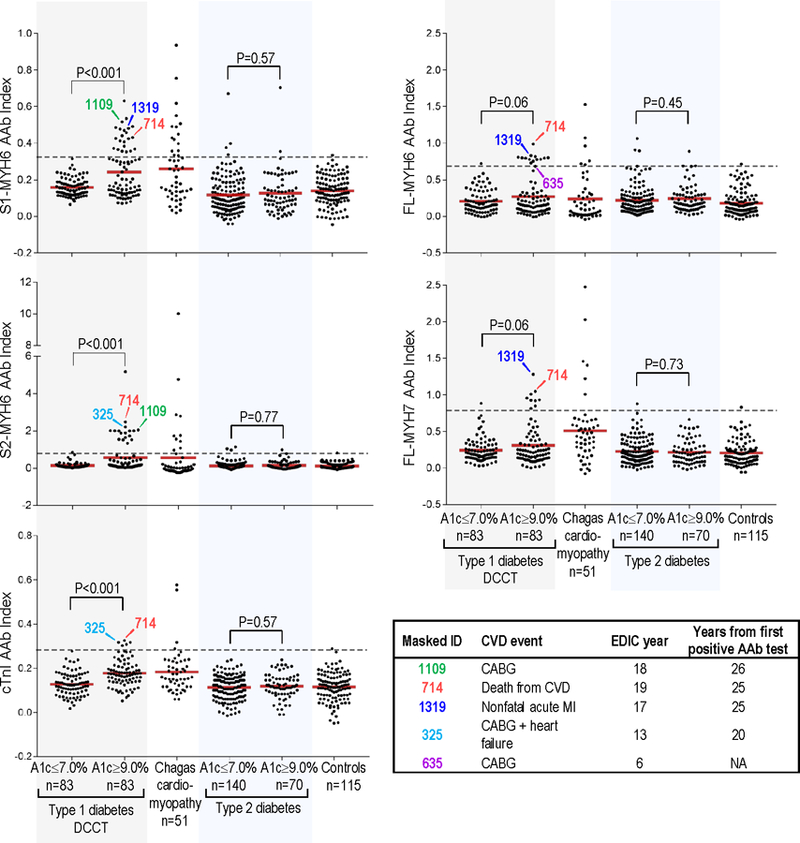
AAb, autoantibody; A1c, glycosylated hemoglobin level; dotted lines, 99th percentile cutoffs for AAb positivity. AAb levels for the T1D patients are the mean AAb index during DCCT. S1-MYH6, S1 fragment of cardiac α-myosin heavy chain (MYH6); S2-MYH6, S2 fragment of MYH6; cTnI, cardiac troponin I; FL-MYH6, full-length-MYH6; and FL-MYH7, full-length β myosin heavy chain. Controls, healthy control subjects. Inset: Subjects who subsequently had CVD events during EDIC. Number below “Masked_ID” is the DCCT/EDIC masked identifier (ID) number; CVD, cardiovascular disease; MI, nonfatal myocardial infarction; CABG, coronary artery bypass graft; NA, not applicable.
Ethical Considerations
The DCCT/EDIC biosamples and datasets obtained from the NIDDK Repository were deemed not to constitute human subject research. The other studies were approved by Joslin Committee on Human Studies (#99–20; #04–34) and University of Sao Paulo Medical School (#0398/04); all participants gave written informed consent.
RESULTS
Characteristics of the DCCT patients
The characteristics of the T1D patients at baseline and at the end of DCCT are summarized in Table 1. The HbA1c≥9.0% group was slightly younger than the HbA1c≤7.0% group (26±7 years versus 28±6 years, respectively, P=0.03), but the two groups had similar duration of diabetes (2.5±1.4 vs. 2.5±1.2 years) and sex (55% males). The mean HbA1c level in the HbA1c≥9.0% group was 10.0±0.7% (range, 9.0 to 11.8%) and in the HbA1c≤7.0% group was 6.5±0.3% (range, 5.4 to 7.0%). Of note, the baseline HbA1c in the HbA1c≤7.0% group was lower than that of the HbA1c≥9.0% group (8.0±1.2% vs. 9.1±1.4%, P<0.001). Compared to the HbA1c≤7.0% group, BMI was slightly greater in the HbA1c≥9.0% group at baseline but not at the end of DCCT. The groups were otherwise similar in CVD risk factors at the beginning and end of DCCT. As pre-specified in our study design, none of the patients had CVD or renal disease at the end of DCCT. Consistent with the DCCT study design, none of the participants had microalbuminuria, dyslipidemia, or hypertension at baseline, and none were on statins or agents that target the renin-angiotensin axis during DCCT.8
Table 1.
Clinical characteristics of the patients in this study at DCCT baseline and at the end of DCCT
| Characteristic | DCCT baseline (1983–1989) | P value | DCCT closeout (1993) | P value | ||
|---|---|---|---|---|---|---|
| HbA1c ≤7.0% (n=83) |
HbA1c ≥9.0% (n=83) |
HbA1c ≤7.0% (n=83) |
HbA1c ≥9.0% (n=83) |
|||
| Age, yr | 28±6 | 26±7 | 0.03 | 34±6 | 32±7 | 0.04 |
| Male sex (%) | 46 (55) | 46 (55) | 1.00 | 46 (55) | 46 (55) | 1.00 |
| Diabetes duration, yr | 2.5±1.2 | 2.5±1.4 | 0.86 | 7.8±1.9 | 7.9±2.3 | 0.63 |
| HbA1c, % | 8.0±1.2 | 9.1±1.4 | <0.001 | 6.5±0.3 | 10.0±0.7 | <0.001 |
| Current smoker, (%) | 13 (16) | 14 (17) | 0.83 | 10 (12) | 15 (18) | 0.26 |
| Body-mass index, kg/m2 | 23.1±2.5 | 24.0±2.8 | 0.03 | 25.3±3.0 | 25.4±3.2 | 0.84 |
| Blood pressure, mm Hg | ||||||
| Systolic | 114±12 | 114±11 | 0.89 | 114±11 | 116±11 | 0.16 |
| Diastolic | 72±8 | 73±9 | 0.43 | 73±9 | 75±8 | 0.09 |
| Hypertension, (%)* | 0 | 0 | 4 (5) | 1 (1) | 0.17 | |
| Lipids | ||||||
| HDL cholesterol, mg/dl | 52±13 | 52±13 | 0.91 | 52±13 | 53±13 | 0.61 |
| LDL cholesterol, mg/dl | 111±33 | 108±28 | 0.47 | 110±25 | 114±28 | 0.36 |
| Total cholesterol, mg/dl | 176±36 | 173±33 | 0.58 | 177±28 | 184±33 | 0.16 |
| Triglycerides, mg/dl | 68±25 | 69±25 | 0.74 | 75±38 | 83±50 | 0.22 |
| Hyperlipidemia, (%)† | 0 | 0 | 16 (19) | 21 (26) | 0.33 | |
| Microalbuminuria, AER (%)‡ | ||||||
| 30 to <300 mg/24 hours | 0 | 0 | 1 (1) | 4 (5) | 0.17 | |
Plus-minus values are means ±SD. HbA1c, glycosylated hemoglobin; HDL, high-density lipoprotein; LDL, low-density lipoprotein; AER, albumin excretion rate.
Hypertension, as defined by systolic blood pressure ≥140 mm Hg and a diastolic blood pressure ≥90 mm Hg, documented hypertension, or the use of antihypertensive agents8.
Hyperlipidemia, as defined by LDL cholesterol levels ≥130 mg/dL (3.4 mmol/L) or the use of lipid-lowering agents8.
Microalbuminuria, as defined by AER 30 to <300 mg/24 hours on two consecutive occasions25
Class II HLA genotype and islet autoantibody status
In view of the strong association between particular class II HLA alleles and autoimmune disease susceptibility, high resolution HLA typing of DRB1, DQA1, and DQB1 alleles was performed. These studies (Supplemental Table 3) showed that the two HbA1c groups carried similar frequencies of HLA class II genotypes. Consistent with these findings, the prevalence of AAb to glutamic acid decarboxylase 65 (GAD65) and protein tyrosine phosphatase IA-2A, measured within 4 years of T1D diagnosis,36 was similar in the two groups. Taken together, these results indicate that the two groups were genetically and immunologically similar.
Prevalence and profiles of cardiac autoantibodies
As shown in Figure 1, T1D patients with HbA1c≥9.0% showed substantially higher mean levels of AAb to S1-MYH6, S2-MYH6, and cTnI compared with the HbA1C≤7.0% group during DCCT (P<0.001). There was also a suggestive but non-significant difference in AAb levels to FL-MYH6 and FL-MYH7 between the two DCCT HbA1c groups (P=0.06 for both AAb). In contrast, there was no relationship between glycemic control and cardiac AAb expression in T2D patients.
The most frequently detected AAb type in the T1D DCCT HbA1c>9.0% group was S1-MYH6, with positivity in 27% (22 of 83) patients, which was similar in prevalence to Chagas cardiomyopathy with 31% patients positive (16 of 51, P=0.54), but distinct from the HbA1C<7.0% group in which none of the patients were positive. The second most prevalent AAb type was S2-MYH6, which was positive in 22% (18 of 83) HbA1c≥9.0% patients, identical to Chagas cardiomyopathy with 22% (11 of 51 patients) positive; but distinct from the HbA1c≤7.0% group in which only a single patient (1%) was positive (P<0.001).
As shown in Figure 2 and Supplemental Table 4, in the DCCT HbA1c≥9.0% group, 46% (38 of 83) patients tested positive for ≥1 cardiac AAb, 22% (18 of 83) tested positive for ≥2 AAb and 11% (9 of 83) testing positive for ≥3 AAb, with prevalence similar to Chagas cardiomyopathy patients. In contrast, in the DCCT HbA1c≤7.0% group, only 2% (2 of 83) had ≥1 AAb and 1% (1 of 83) had ≥2 AAb, with no patients testing positive for ≥3 AAb. There was no relationship between glycemic control and the number of AAb in T2D patients with 11 of 140 (8%) versus 5 of 70 (7%) positive in the HbA1c≤7.0% and ≥9.0% groups, respectively (P=0.85). In addition, none of the T2D patients or healthy control subjects tested positive for ≥2 AAb.
Figure 2. Prevalence of subjects having ≥1, ≥2, ≥3, and ≥4 different types of cardiac autoantibodies (AAb) in the different study groups.
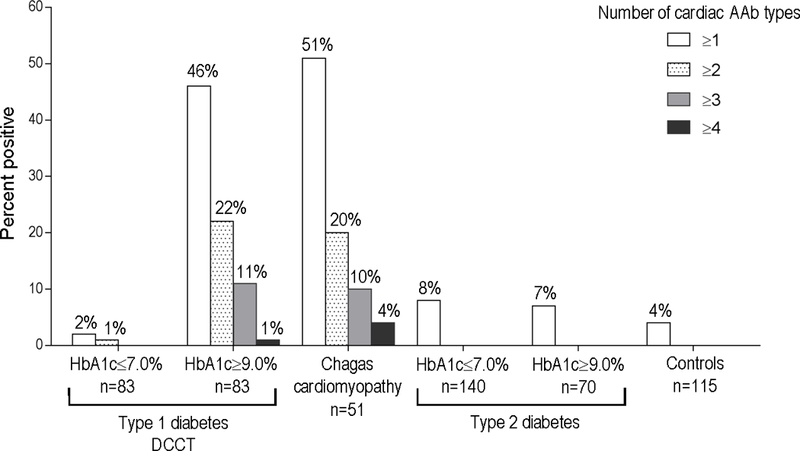
The groups include: a) type 1 diabetes DCCT participants with time-updated mean HbA1c levels of ≤7.0% or ≥9.0% during DCCT, b) patients with chronic Chagas cardiomyopathy (Chagas cardiomyopathy); c) type 2 diabetes patients with HbA1c ≤7.0% and HbA1c ≥9.0%; and d) healthy control subjects (‘Controls’). Number of AAb includes positivity to S1-MYH6, S2-MYH6, cTnI, FL-MYH6 and/or FL-MYH7.
Temporal dynamics of cardiac autoantibody expression
As shown in Figure 3A, and Supplemental Figure 4, the trajectory of cardiac myosin AAb levels over time (from DCCT year 1 to 8) was markedly different in the two HbA1c groups (P<0.001) with the most striking findings for S1-MYH6 with modest differences between both groups in AAb titers at year 1 of DCCT (0.222±0.037 vs. 0.206±0.064; P=0.04) and then, by DCCT year 2, the groups diverging with a progressive increase in mean S1-MYH6 titers in the HbA1c≥9.0% group over time, and a progressive decrease in AAb titers the HbA1c≤7.0% group over time, up to DCCT year 8 (0.329±0.038 vs. 0.131±0.035 in the HbA1c≥9.0% and HbA1c≤7.0% groups, respectively, P<0.001). These patterns correlated with evidence of AAb seroconversion in individuals in the HbA1c≥9.0% group and, conversely, disappearance of AAb positivity in the HbA1c≤7.0% group (Supplemental Figure 4, A). In contrast, no significant HbA1c group and DCCT year-interactions were observed with cTnI AAb levels over time (P=0.26) (Supplemental Figure 4, B).
Figure 3. Relationship between autoantibody level (AAb), HbA1c group, year of DCCT treatment, and time-updated mean HbA1c levels (mean HbA1c levels).
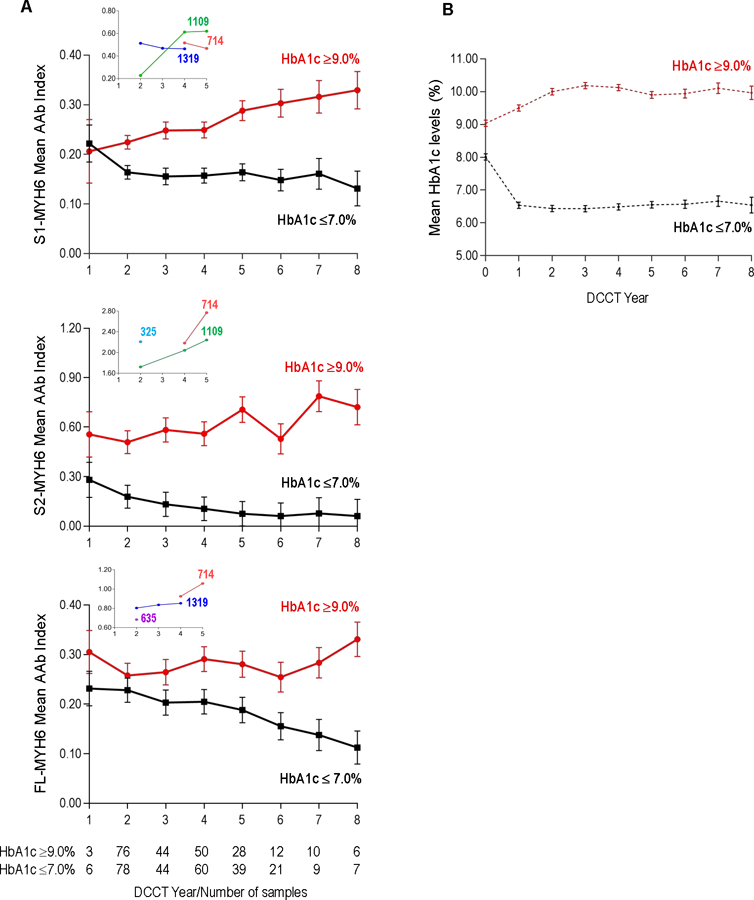
Panel A. Interaction between the mean AAb level to S1-MYH6 (top panel), S2-MYH6 (middle panel) or FL-MYH6 (lower panel), HbA1c group (≥9.0% or ≤7.0%), and year of DCCT intervention treatment. All relationships were significant (P<0.001). Because only 2 subjects had samples available from DCCT Year 0 (i.e., DCCT baseline), Year 0 is not included. The numbers of samples analyzed in each HbA1c group per DCCT year are as indicated. Insets show the patients who developed CVD events (as shown in Figure 1). Panel B. Time-updated mean HbA1c levels in each of the HbA1c groups per year of DCCT treatment. Cutoffs for AAb positivity are: S1-MYH6, 0.330; S2-MYH6, 0.763; and FL-MYH6, 0.701.
Cardiac autoantibodies and future CVD events
Patients with the highest titers of cardiac AAb during DCCT were subsequently found to develop CVD events during EDIC, up to 26 years after the first positive AAb test (Figures 1 and 3A). Furthermore, amongst the AAb-positive patients who developed CVD events (4 of 6 subjects), all tested positive for ≥2 AAb (Figure 1 and Supplemental Table 4). The potential association between AAb level, number of AAb, and subsequent CVD events was most striking in subject Masked_ID 714, who was the only patient in this study to test positive for all 5 AAb (Figure 1) and also the only patient to experience a fatal CVD event. The insets of Figure 3A also underscore the relatively high cardiac AAb titers during DCCT in patients who subsequently developed CVD events, including Masked_ID 635, who was not AAb positive, but in the single sample available for testing from DCCT year 2, was already borderline FL-MYH6 AAb-positive.
Since the primary prevention cohort was relatively healthy and young at baseline, and patients who developed renal disease or CVD were excluded from this study (Supplemental Figure 2), the total number of CVD events was relatively low (Supplemental Table 5). However, amongst the 6 patients who subsequently developed CVD events during EDIC (including one patient in the HbA1c≤7.0% group who developed stroke), 4 patients tested positive for ≥2 cardiac AAb with positivity for FL-MYH6 or S2-MYH6 conferring 11.3-fold increased odds of a CVD event up to 26 years later, at EDIC year 20 (95% CI, 2.0–65.4; P=0.006) (Table 2).
Table 2.
Odds and hazard ratios for cardiac autoantibody (AAb) specificity and number of AAb during DCCT and CVD events during EDIC
| Risk factor | CVD event (%) (n=6) |
No CVD event (%) (n=160) |
95% CI | P value | |
|---|---|---|---|---|---|
| Univariable analysis: Specific AAb type |
Unadjusted odds ratio |
||||
| S2-MYH6 | 3 (50) | 16 (10) | 9.0 | 1.7–48.4 | 0.01 |
| FL-MYH6 | 2 (33) | 12 (7) | 6.2 | 1.0–37.2 | 0.04 |
| S2-MYH6 or FL-MYH6 | 4 (67) | 24 (15) | 11.3 | 2.0–65.4 | 0.006 |
| Univariable analysis: Number of AAb |
Unadjusted hazard ratio |
||||
| Only one AAb | 0 | 21 (13) | 0 | ||
| ≥2 AAb | 4 (67) | 15 (9) | 16.1 | 3.0–88.2 | 0.001 |
CI, confidence interval. Univariable analyses were conducted using logistic regression or Cox proportional hazard regression. Odds of having a CVD event in patients with only one AAb is relative to having a CVD event in the absence of AAb. Odds of having a CVD event in patients with ≥2 AAb is relative to having a CVD event with only one AAb or no AAb.
In addition, CVD risk varied in relation to the number of cardiac AAb with positivity for ≥2 AAb conferring 16.1-fold increased odds of a CVD event (4 of 6 CVD events, 95% CI, 3.0–88.2; P=0.001) (Table 2) and a significantly lower cumulative CVD event-free survival rate, compared to subjects with ≤1 AAb (P<0.001; Supplemental Figure 5).
Cardiac autoantibodies as predictors of subclinical CVD
We next analyzed whether the specificity or number of cardiac AAb during DCCT was also associated with a greater risk of subsequent CAC, a marker of subclinical coronary atherosclerosis, measured in EDIC years 7–9.34 As shown in Supplemental Table 4, the profiles of cardiac AAb in the DCCT HbA1c≥9.0% subjects who subsequently showed detectable CAC were distinctive, with FL-MYH6 or S2-MYH6 AAb present in 15 of 20 (75%) patients, compared to 6 of 51 (12%) patients who were CAC negative. As shown in Table 3, in our entire study cohort, the presence of S2-MYH6 AAb alone was associated with a 10.4-fold greater odds of having detectable CAC (10 of 31 CAC positives, 95% CI, 3.2–34.5; P<0.001). Positivity for FL-MYH6 AAb alone conferred a 26.7-fold increase in risk of having detectable CAC (10 of 31 CAC positives, 95% CI 5.5–130.5; P<0.001). The number of AAb was also predictive of CAC, with positivity for only one AAb non-significant, but positivity for ≥2 AAb conferring a 26.7-fold greater odds of having detectable CAC (13 of 31 CAC positives, 95% CI, 6.9–103.1; P<0.001).
Table 3.
Cardiac autoantibodies (AAb) during DCCT and the risk for coronary artery calcification (CAC)
| Risk factor | CAC positive (%) (n=31) |
CAC negative (%) (n=114) |
95% CI | P value | |
|---|---|---|---|---|---|
| Univariable analysis: Specific AAb type |
Unadjusted odds ratio |
||||
| S2-MYH6 | 10 (32) | 5 (4) | 10.4 | 3.2–34.5 | <0.001 |
| FL-MYH6 | 10 (32) | 2 (2) | 26.7 | 5.5–130.5 | <0.001 |
| S2-MYH6 or FL-MYH6 | 16 (52) | 7 (6) | 16.3 | 5.8–46.1 | <0.001 |
| Univariable analysis: Number of AAb | |||||
| Only one AAb | 4 (13) | 14 (12) | 1.1 | 0.3–3.5 | 0.93 |
| ≥2 AAb | 13 (42) | 3 (3) | 26.7 | 6.9–103.1 | <0.001 |
| Multivariable analysis: Specific AAb type |
Adjusted odds ratio |
||||
| S2-MYH6 | 10 (32) | 5 (4) | 9.8 | 1.6–59.5 | 0.01 |
| FL-MYH6 | 10 (32) | 2 (2) | 86.1 | 5.7–1290.0 | 0.001 |
| Multivariable analysis: Number of AAb | |||||
| Only one AAb | 4 (13) | 14 (12) | 2.8 | 0.5–14.6 | 0.22 |
| ≥2 AAb | 13 (42) | 3 (3) | 60.1 | 8.8–410.0 | <0.001 |
Univariable analyses were conducted using logistic regression. Multivariable analyses were adjusted for age at visit prior to the CAC measurement, sex, smoking status, and hypertension at the end of DCCT. No significant effect of hyperlipidemia at the end of DCCT, or smoking and hypertension at visit prior to the CAC measurement during EDIC follow-up study was observed.
Using a multivariable model adjusted for age at visit prior to CAC measurement, sex, smoking status, and hypertension at the end of DCCT,34 positivity for S2-MYH6 AAb conferred a 9.8-fold increased odds of having detectable CAC (10 of 31 CAC positives, 95% CI 1.6–59.5; P=0.01) while positivity for FL-MYH6 AAb conferred 86.1-fold greater odds of having detectable CAC (95% CI 5.7–1290.0; P=0.001) (Table 3). Furthermore, using this multivariable model, positivity ≥2 AAb was associated with 60.1-fold greater odds of detectable CAC (13 of 31 CAC positives, 95% CI 8.8–410.0; P<0.001). We further constructed models including baseline HbA1c, mean HbA1c level during DCCT, or HbA1c at visit prior to CAC measurement as covariates34 but these did not significantly change the risk of cardiac AAb on having detectable CAC.
Cardiac autoantibodies and subsequent levels of high-sensitivity C-reactive protein (hsCRP)
We further investigated whether specificity or number of cardiac AAb during DCCT was also associated with levels of the inflammatory marker, hsCRP, measured during EDIC years 4–6.37, 38 As shown in Figure 4 (left panel), there was no significant difference in subsequent hsCRP levels between the two HbA1c groups, with median hsCRP levels of 1.3 (1st, 3rd quartiles, 0.7, 4.5) mg/L in the HbA1c≤7.0% group (n=67) and 1.8 (0.9, 5.1) mg/L in the HbA1c≥9.0% group (n=62) (P=0.34). In contrast, patients positive for ≥2 cardiac AAb during DCCT (n=15) showed significantly higher hsCRP levels with a median value of 6.0 (1.8, 7.6) mg/L, compared to patients with ≤1 AAb (n=114) who had a median value of 1.4 (0.7, 4.1) mg/L (P=0.003; Figure 4, right panel).
Figure 4. Relationship between the HbA1c groups (left panel) or number of cardiac autoantibodies (right panel) during DCCT and hsCRP levels during EDIC years 4–6.
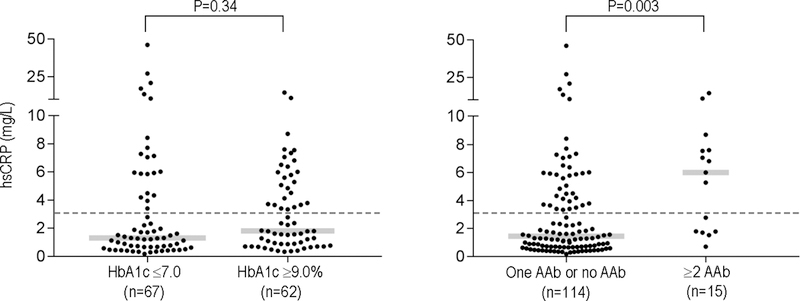
hsCRP, high-sensitivity C-reactive protein. Gray bars indicate the medians in the different groups and dotted lines indicate the upper reference limit for hsCRP (3.0 mg/L). P values refer to the comparison of log-transformed values.
As shown in Supplemental Table 6, positivity for S2-MYH6 AAb during DCCT was associated with a 2.0-fold increased level of hsCRP as compared to patients who were negative for this AAb type (95% CI 1.1–3.8, P=0.03). Positivity for FL-MYH6 AAb during DCCT was associated with 2.1-fold greater hsCRP levels compared to patients who were FL-MYH6 AAb-negative (95% CI 1.9–2.4, P=0.03). In analysis of hsCRP adjusted for sex, patients who were positive for S2-MYH6 AAb had 2.1-fold higher hsCRP level compared to patients who were negative for this AAb type (95% CI 1.1–3.9, P=0.02) while patients who were positive for FL-MYH6 AAb had 2.3-fold greater levels of hsCRP than those who were FL-MYH6 AAb-negative (95% CI 1.2–4.3, P=0.02). In this adjusted model, positivity for ≥2 AAb was associated with a 2.7-fold increased level of hsCRP as compared to patients who were positive for only one AAb or who were AAb-negative (95% CI 1.5–4.7, P=0.001). Further adjustment of these analyses by age, mean HbA1c levels during DCCT, smoking, hypertension, and hyperlipidemia at the end of DCCT did not significantly affect the relationship between the type or number of AAb and hsCRP levels.
DISCUSSION
In this first evaluation of the relationship between glycemic control, cardiac autoimmunity, and CVD complications in patients with T1D, we demonstrate the following findings. First, in patients with T1D, poor glycemic control alone – in the absence of clinical CVD, renal disease or other diabetes-related comorbidities – is associated with the development of cardiac autoimmunity. Second, our data suggest that the risk of both accelerated atherosclerosis (as measured by CAC) and CVD events is higher in T1D patients with cardiac autoimmunity, as evidenced by positivity for ≥2 cardiac AAb, which developed decades in advance of these CVD complications. Third, positivity for ≥2 cardiac AAb also identified patients who subsequently showed elevated hsCRP levels, suggesting that cardiac autoimmunity could be associated with an inflammatory state, which may link AAb to CVD outcomes. Relatively little is known about the mechanisms of CVD specific to T1D except for the substantial risk conferred by diabetic kidney disease.6, 39 Although many studies have established hyperglycemia as a key mediator of CVD events and CVD-related mortality in T1D2, 3, 8, 40 and numerous metabolic factors related to diabetes have been implicated,4 none have been unique to T1D. Our findings suggest a novel CVD pathway that is specific to T1D.
The impact of glycemic control on cardiac AAb expression was demonstrated in our study by several findings including: 1) the mean AAb levels during DCCT; 2) the significant relationship between the level of cardiac myosin AAb, group (HbA1c≥9.0% versus HbA1c≤7.0%) and time (DCCT year) with the AAb levels increasing over time in the HbA1c≥9.0% group, while decreasing over time in the HbA1c≤7.0% group; 3) the number of cardiac AAb produced; and 4) the antigenic specificities of the AAb. An unexpected finding was the similar cardiac AAb expression profiles in the DCCT HbA1c≥9.0% group – who were young, generally healthy and devoid of clinical CVD when the AAb first appeared – and the patients with heart failure due to Chagas cardiomyopathy, which is a form of chronic myocarditis, pointing to possible autoimmune commonalities in the pathogenesis of these seemingly unrelated conditions. Of note, the presence of cardiac autoimmunity in T1D could not be simply explained by the metabolic effects of hyperglycemia given the lack of a relationship between glycemic control and AAb expression in patients with T2D.
Our longitudinal studies in the low HbA1c (≤7.0%) group are noteworthy in indicating that cardiac autoimmunity in its earliest stages can be transient when the trigger (here, hyperglycemia) is removed. This contrasts with situation of chronic myocarditis associated with Chagas cardiomyopathy, in which the pathogen (Trypanosoma cruzi) persists29 and possibly also the development of CVD in T1D patients with decades of poor glycemic control.2, 3 Further studies will be required to determine whether there is a “point of no return” beyond which cardiac autoimmunity is no longer reversible with improved glycemic control.
How could chronic hyperglycemia trigger the breakdown of immune tolerance to the heart in T1D? We propose three major steps (Figure 5). First, previous studies have shown that the immune system is normally enriched in autoreactive CD4+ T cells specific for cardiac myosin20 due to lack of a fundamental process called central tolerance, in which the thymus plays a key role in preventing organ-specific autoimmunity by removing (‘deleting’) strongly self-reactive CD4+ T cells from the circulation41 (Figure 5A). The lack of thymic tolerance to α-myosin (MYH6) leads to the enrichment of peripheral blood with CD4+ T cells reactive to α-myosin and places the heart at increased risk for autoimmune attack in the setting of myocardial injury, for example following MI.28, 42 Second, chronic hyperglycemia also causes myocardial damage21, 22,43 and is associated with leakage of myocardial proteins into the circulation44 (Figure 5B), potentially leading to the exposure of previously sequestered cardiac antigens, including α-myosin, to the immune system. Third, the dysregulated adaptive immune system in individuals with T1D “overreacts” to hyperglycemia-induced myocardial injury (Figure 5C). Although the number and specificity of cardiac AAb was associated with subsequent CVD in this study, we postulate that this disease process would be primarily driven by CD4+ T cells (which are required for production of these IgG AAb20). The idea that AAb, while not being primary disease mediators, can be used to predict disease is perhaps best exemplified by extensive studies on T1D itself. 45 33
Figure 5. Proposed scheme of how chronic hyperglycemia is associated with cardiac autoimmunity and increased risk of CVD in patients with type 1 diabetes.
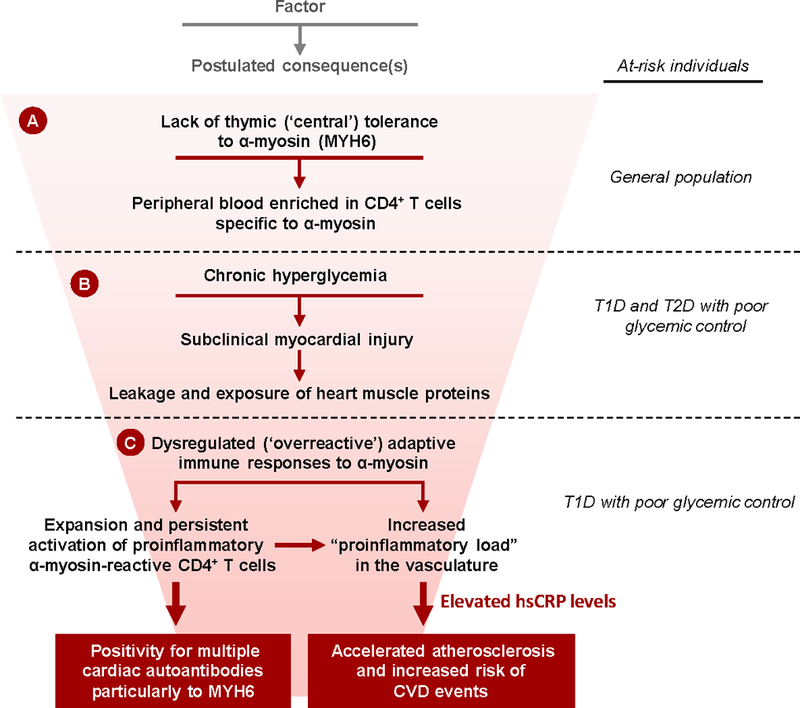
A) Absent thymic expression of the α-isoform of myosin heavy chain (α-myosin, encoded by MYH6) is associated with high frequencies of CD4+ T cells specific to α-myosin in the peripheral blood of individuals in the general population20; B) In both type 1 and type 2 diabetes (T2D) patients, chronic hyperglycemia causes subclinical myocardial injury, leading to leakage and exposure of heart muscle proteins, including α-myosin, to the immune system; C) In T1D patients with poor glycemic control, the dysregulated adaptive immune system overreacts to myocardial injury, leading to the expansion of proinflammatory CD4+ T cells specific to α-myosin and the development of AAb to MYH6 and other cardiac antigens. This proinflammatory state is associated with elevated levels of the inflammatory marker, high-sensitivity C-reactive protein (hsCRP), and increased risk for accelerated atherosclerosis and CVD events.
How could the presence of myocardial autoimmunity in these DCCT patients be mechanistically linked to increased risk for atherosclerotic CVD events, two seemingly unrelated clinical entities, occurring decades apart? As discussed, it is widely accepted that chronic inflammation plays a pivotal role in the pathogenesis of atherosclerosis.46 Although innate immune mechanisms clearly contribute to this process, emerging data also supports an important role of adaptive immune dysregulation – specifically involving dysregulated CD4+ T cells in the pathogenesis of atherosclerosis13 and acute coronary syndromes.11 Indeed, autoimmune disorders such as rheumatoid arthritis and systemic lupus erythematosus are recognized major risk factors for accelerated atherosclerosis.11 Atherosclerosis has been recently proposed as a T cell-driven process, particularly involving proinflammatory CD4+ T cells that produce IFN-γ, which is pro-atherogenic in animal models.12, 13 Our previous studies showed that the presence of multiple cardiac AAb correlated with increased frequencies of proinflammatory IFN-γ-producing α-myosin specific CD4+ T cells in peripheral blood,20, 28 and in the current study we showed that T1D patients in DCCT HbA1c≥9.0% group share similar AAb expression signatures with chronic Chagas cardiomyopathy, which is believed to be mediated by proinflammatory CD4+ T cells reactive to cardiac myosin.29, 47 It therefore seems plausible that AAb-positive DCCT patients would have also harbored increased frequencies of cardiac myosin-specific proinflammatory T cells in peripheral blood, contributing to an inflammatory state and possibly increasing risk for CVD (Figure 5C). In support of this notion, T1D patients in our study who tested positive for ≥2 AAb and were at increased risk for both CAC and CVD events, subsequently showed high hsCRP levels. Interestingly, a recent prospective study showed a significant association between elevated levels of T cell activation markers and progression of CAC in T1D.48
Our study has several unique strengths. First, the two DCCT treatment groups achieved markedly different mean HbA1c levels over a mean period of 6.5 years,7 enabling the opportunity to test an association between hyperglycemia and cardiac autoimmunity. Second, the DCCT primary prevention cohort was ideal for testing the role of hyperglycemia in autoimmunity since at baseline the participants had a short duration of T1D, were relatively healthy with no hypertension, no hyperlipidemia or microalbuminuria; in addition, as part of our study design, patients who developed CVD or renal disease during DCCT were excluded. Thus, the role of hyperglycemia in the development of cardiac autoimmunity could be evaluated without potential CVD confounders. Third, our two HbA1c groups had similar age, and were matched for T1D duration, sex and also HLA class II genotype, so the major difference between the two groups was the HbA1c level. Fourth, the availability of annual serum samples collected over the DCCT, combined with rich DCCT/EDIC clinical datasets, enabled us to establish a time course for AAb appearance and disappearance relative to HbA1c levels and risk factors for CVD8 with a follow-up for three decades.25 Fifth, we were able to compare our findings to a well-characterized T2D cohort27 with HbA1c≥9.0% and ≤7.0%, enabling us to demonstrate that hyperglycemia-associated cardiac autoimmunity is unique to patients with T1D. Finally, we performed side-by-side cardiac AAb profiling of a deeply-phenotyped cohort with chronic Chagas cardiomyopathy, for whom until now conventional methods for cardiac AAb measurement have not been informative,49 revealing unanticipated parallels between T1D patients with very poor glycemic control and patients with a form of chronic myocarditis.29
However, our results should also be considered in the context of several limitations. First is the small number of CVD events. As discussed, to rigorously test the association between poor glycemic control and cardiac autoimmunity, we restricted analysis to the primary prevention cohort who, at DCCT baseline, were relatively young and had a short duration of T1D, and in whom the subsequent CVD event rate was generally low.8, 25 Larger scale studies involving the entire DCCT cohort and more CVD events will be required to further establish a relationship between cardiac autoimmunity and long-term CVD outcomes in T1D. Second, because of the limited sample availability at DCCT baseline, especially for the HbA1c≥9.0% group, for many of the AAb, tests were positive from the first observations and the exact timing of seroconversion could not be established. Third, by design, the DCCT patients analyzed in this report had a marked HbA1c separation between the two groups so it was not possible to assess the impact relative to milder HbA1c elevations. Fourth, it was not feasible to measure CD4+ T cell responses to cardiac myosin in this study because peripheral blood mononuclear cells were not collected during DCCT, but such samples could be obtained at future EDIC follow-up visits. Fifth, the primary CVD outcome of the DCCT/EDIC study was a composite of outcomes associated primarily with atherosclerotic CVD and not those associated with cardiomyopathy; dedicated evaluation of such outcomes (e.g. heart failure) was not possible due to small number of events. Finally, it could be argued that the DCCT cohort is not representative of the general population with T1D; however, our preliminary data suggested similar associations between poor glycemic control and expression of cardiac AAb in a contemporary cohort of young adults with T1D, which formed the rationale for the current studies.
Cardiovascular disease in T2D and T1D is often considered the “same disease” with the diagnosis and treatment of CVD in T1D extrapolated from the experience with T2D.4 Without knowledge of T1D-specific CVD mechanisms, it has been challenging to identify biomarkers that are predictive of CVD in T1D50 or to develop T1D-specific therapies for CVD. Our studies, using sensitive and specific AAb detection methods that are the current gold-standard format for AAb detection33 suggest that cardiac AAb could represent an early biomarker of CVD risk specific for T1D. Further validation of cardiac AAb as predictive biomarkers of CVD events in T1D could aid the identification of patients at highest risk for future CVD outcomes, and may also ultimately lead to new ways to prevent CVD.
Supplementary Material
Clinical Perspective.
What is new?
First demonstration that in patients with type 1 diabetes (T1D), poor glycemic control is associated with cardiac autoimmunity, as evidenced by the presence of multiple (≥2) cardiac autoantibody types.
Positivity for ≥2 cardiac autoantibodies was associated with increased risk of both CVD events and coronary artery calcification decades later.
Positivity for ≥2 autoantibodies also identified T1D patients with elevated high-sensitivity C-reactive protein, suggesting that cardiac autoimmunity is associated with an inflammatory state, which may link autoantibodies to CVD outcomes.
Poor glycemic control was not associated with cardiac autoimmunity in type 2 diabetes, suggesting a novel CVD pathway specific to T1D.
What are the clinical implications?
Further validation of cardiac autoantibodies as predictive biomarkers of CVD events in type 1 diabetes could aid the identification of patients at highest risk for future CVD outcomes. It may also ultimately lead to new ways to prevent CVD.
Acknowledgments
The DCCT and its follow-up EDIC study were conducted by the DCCT/EDIC Research Group and supported by NIH grants and contracts and by the General Clinical Research Center Program, National Center for Research Resources (NCRR), NIH. The data and samples from the DCCT/EDIC study were supplied by the National Institute of Diabetes and Digestive and Kidney Diseases (NIDDK) Central Repositories. This manuscript was not prepared under the auspices of the DCCT/EDIC study and does not represent analyses or conclusions of the DCCT/EDIC study group, the NIDDK Central Repositories, or the NIH.
Sources of Funding
This work was supported by NIH grants R01 DK1036909 and R01 HL775554 to Dr. Lipes, R01 HL073168 to Dr. Doria, 5P30 DK36836 (Advanced Molecular Phenotyping and Genotyping Core of the Diabetes Research Center at Joslin Diabetes Center), and the European Foundation for the Study of Diabetes Albert Renold Travel Fellowship Award for Young Scientists to Dr. Galderisi.
Footnotes
Disclosures
The authors have no relevant disclosures.
REFERENCES
- 1.Rawshani A, Rawshani A, Franzen S, Eliasson B, Svensson AM, Miftaraj M, McGuire DK, Sattar N, Rosengren A and Gudbjornsdottir S. Mortality and Cardiovascular Disease in Type 1 and Type 2 Diabetes. N Engl J Med 2017;376:1407–1418. doi: 10.1056/NEJMoa1608664. [DOI] [PubMed] [Google Scholar]
- 2.Lind M, Bounias I, Olsson M, Gudbjornsdottir S, Svensson AM and Rosengren A. Glycaemic control and incidence of heart failure in 20,985 patients with type 1 diabetes: an observational study. Lancet 2011;378:140–146. doi: 10.1016/S0140-6736(11)60471-6. [DOI] [PubMed] [Google Scholar]
- 3.Lind M, Svensson AM, Kosiborod M, Gudbjornsdottir S, Pivodic A, Wedel H, Dahlqvist S, Clements M and Rosengren A. Glycemic Control and Excess Mortality in Type 1 Diabetes. N Engl J Med 2014;371:1972–1982. doi: 10.1056/NEJMoa1408214. [DOI] [PubMed] [Google Scholar]
- 4.de Ferranti SD, de Boer IH, Fonseca V, Fox CS, Golden SH, Lavie CJ, Magge SN, Marx N, McGuire DK, Orchard TJ, Zinman B and Eckel RH. Type 1 diabetes mellitus and cardiovascular disease: a scientific statement from the American Heart Association and American Diabetes Association. Circulation 2014;130:1110–1130. doi: 10.1161/CIR.0000000000000034. [DOI] [PubMed] [Google Scholar]
- 5.Abdul-Ghani M, DeFronzo RA, Del Prato S, Chilton R, Singh R and Ryder REJ. Cardiovascular Disease and Type 2 Diabetes: Has the Dawn of a New Era Arrived? Diabetes Care 2017;40:813–820. doi: 10.2337/dc16-2736. [DOI] [PMC free article] [PubMed] [Google Scholar]
- 6.Libby P, Nathan DM, Abraham K, Brunzell JD, Fradkin JE, Haffner SM, Hsueh W, Rewers M, Roberts BT, Savage PJ, Skarlatos S, Wassef M and Rabadan-Diehl C. Report of the National Heart, Lung, and Blood Institute-National Institute of Diabetes and Digestive and Kidney Diseases Working Group on Cardiovascular Complications of Type 1 Diabetes Mellitus. Circulation 2005;111:3489–3493. doi: 10.1161/CIRCULATIONAHA.104.529651. [DOI] [PubMed] [Google Scholar]
- 7.The Diabetes Control and Complications Trial Research Group. The effect of intensive treatment of diabetes on the development and progression of long-term complications in insulin-dependent diabetes mellitus. N Engl J Med 1993;329:977–986. doi: 10.1056/NEJM199309303291401. [DOI] [PubMed] [Google Scholar]
- 8.Nathan DM, Cleary PA, Backlund JY, Genuth SM, Lachin JM, Orchard TJ, Raskin P and Zinman B. Intensive diabetes treatment and cardiovascular disease in patients with type 1 diabetes. N Engl J Med 2005;353:2643–2653. doi: 10.1056/NEJMoa052187. [DOI] [PMC free article] [PubMed] [Google Scholar]
- 9.Miller KM, Foster NC, Beck RW, Bergenstal RM, DuBose SN, DiMeglio LA, Maahs DM, Tamborlane WV and Network TDEC. Current state of type 1 diabetes treatment in the U.S.: updated data from the T1D Exchange clinic registry. Diabetes Care 2015;38:971–978. doi: 10.2337/dc15-0078. [DOI] [PubMed] [Google Scholar]
- 10.Snell-Bergeon JK and Maahs DM. Diabetes: Elevated risk of mortality in type 1 diabetes mellitus. Nature Reviews Endocrinology 2015;11:136–138. doi: 10.1038/nrendo.2014.245. [DOI] [PubMed] [Google Scholar]
- 11.Flego D, Liuzzo G, Weyand CM and Crea F. Adaptive Immunity Dysregulation in Acute Coronary Syndromes: From Cellular and Molecular Basis to Clinical Implications. J Am Coll Cardiol 2016;68:2107–2117. doi: 10.1016/j.jacc.2016.08.036. [DOI] [PMC free article] [PubMed] [Google Scholar]
- 12.Hansson GK Inflammation, atherosclerosis, and coronary artery disease. N Engl J Med 2005;352:1685–1695. doi: 10.1056/NEJMra043430. [DOI] [PubMed] [Google Scholar]
- 13.Libby P, Lichtman AH and Hansson GK. Immune effector mechanisms implicated in atherosclerosis: from mice to humans. Immunity 2013;38:1092–1104. doi: 10.1016/j.immuni.2013.06.009. [DOI] [PMC free article] [PubMed] [Google Scholar]
- 14.Turley S, Poirot L, Hattori M, Benoist C and Mathis D. Physiological Beta Cell Death Triggers Priming of Self-reactive T Cells by Dendritic Cells in a Type-1 Diabetes Model. J Exp Med 2003;198:1527–1537. doi: 10.1084/jem.20030966. [DOI] [PMC free article] [PubMed] [Google Scholar]
- 15.Atkinson MA, Eisenbarth GS and Michels AW. Type 1 diabetes. Lancet 2014;383:69–82. doi: 10.1016/S0140-6736(13)60591-7. [DOI] [PMC free article] [PubMed] [Google Scholar]
- 16.Stadinski B, Kappler J and Eisenbarth GS. Molecular targeting of islet autoantigens. Immunity 2010;32:446–456. doi: 10.1016/j.immuni.2010.04.008. [DOI] [PubMed] [Google Scholar]
- 17.Pietropaolo M, Towns R and Eisenbarth GS. Humoral autoimmunity in type 1 diabetes: prediction, significance, and detection of distinct disease subtypes. Cold Spring Harb Perspect Med 2012;2:a012831. doi: 10.1101/cshperspect.a012831. [DOI] [PMC free article] [PubMed] [Google Scholar]
- 18.Verge CF, Gianani R, Kawasaki E, Yu L, Pietropaolo M, Jackson RA, Chase HP and Eisenbarth GS. Prediction of type I diabetes in first-degree relatives using a combination of insulin, GAD, and ICA512 BDC/IA-2 autoantibodies. Diabetes 1996;45:926–933. doi: 10.2337/diab.45.7.926. [DOI] [PubMed] [Google Scholar]
- 19.Ziegler AG and Nepom GT. Prediction and pathogenesis in type 1 diabetes. Immunity 2010;32:468–478. doi: 10.1016/j.immuni.2010.03.018. [DOI] [PMC free article] [PubMed] [Google Scholar]
- 20.Lv H, Havari E, Pinto S, Gottumukkala RV, Cornivelli L, Raddassi K, Matsui T, Rosenzweig A, Bronson RT, Smith R, Fletcher AL, Turley SJ, Wucherpfennig K, Kyewski B and Lipes MA. Impaired thymic tolerance to alpha-myosin directs autoimmunity to the heart in mice and humans. J Clin Invest 2011;121:1561–1573. doi: 10.1172/JCI44583. [DOI] [PMC free article] [PubMed] [Google Scholar]
- 21.Brownlee M Biochemistry and molecular cell biology of diabetic complications. Nature 2001;414:813–820. doi: 10.1038/414813a. [DOI] [PubMed] [Google Scholar]
- 22.Erickson JR, Pereira L, Wang L, Han G, Ferguson A, Dao K, Copeland RJ, Despa F, Hart GW, Ripplinger CM and Bers DM. Diabetic hyperglycaemia activates CaMKII and arrhythmias by O-linked glycosylation. Nature 2013;502:372–376. doi: 10.1038/nature12537. [DOI] [PMC free article] [PubMed] [Google Scholar]
- 23.Shen E, Li Y, Li Y, Shan L, Zhu H, Feng Q, Arnold JM and Peng T. Rac1 is required for cardiomyocyte apoptosis during hyperglycemia. Diabetes 2009;58:2386–2395. doi: 10.2337/db08-0617. [DOI] [PMC free article] [PubMed] [Google Scholar]
- 24.Rubin J, Matsushita K, Ballantyne CM, Hoogeveen R, Coresh J and Selvin E. Chronic hyperglycemia and subclinical myocardial injury. J Am Coll Cardiol 2012;59:484–489. doi: 10.1016/j.jacc.2011.10.875. [DOI] [PMC free article] [PubMed] [Google Scholar]
- 25.Diabetes Control and Complications Trial (DCCT)/Epidemiology of Diabetes Interventions and Complications (EDIC) Study Research Group. Intensive Diabetes Treatment and Cardiovascular Outcomes in Type 1 Diabetes: The DCCT/EDIC Study 30-Year Follow-up. Diabetes Care 2016;39:686–693. doi: 10.2337/dc15-1990. [DOI] [PMC free article] [PubMed] [Google Scholar]
- 26.Sousa GR, Pober D, Galderisi A, Lv H, Yu L, Pereira AC, Doria A, Kosiborod M, and Lipes MA. Glycemic Control, Cardiac Autoimmunity, and Long-Term Risk of Cardiovascular Disease in Type 1 Diabetes: A DCCT/EDIC Cohort-Based Study. NIDDK Central Repository 2018. Available at: https://repository.niddk.nih.gov/studies/edic/. [DOI] [PMC free article] [PubMed]
- 27.Doria A, Wojcik J, Xu R, Gervino EV, Hauser TH, Johnstone MT, Nolan D, Hu FB and Warram JH. Interaction between poor glycemic control and 9p21 locus on risk of coronary artery disease in type 2 diabetes. JAMA 2008;300:2389–2397. doi: 10.1001/jama.2008.649. [DOI] [PMC free article] [PubMed] [Google Scholar]
- 28.Gottumukkala RV, Lv H, Cornivelli L, Wagers AJ, Kwong RY, Bronson R, Stewart GC, Schulze PC, Chutkow W, Wolpert HA, Lee RT and Lipes MA. Myocardial infarction triggers chronic cardiac autoimmunity in type 1 diabetes. Sci Transl Med 2012;4:138ra80. doi: 10.1126/scitranslmed.3003551. [DOI] [PMC free article] [PubMed] [Google Scholar]
- 29.Marin-Neto JA, Cunha-Neto E, Maciel BC and Simoes MV. Pathogenesis of chronic Chagas heart disease. Circulation 2007;115:1109–1123. doi: 10.1161/CIRCULATIONAHA.106.624296. [DOI] [PubMed] [Google Scholar]
- 30.Epidemiology of Diabetes Interventions and Complications (EDIC). Design, implementation, and preliminary results of a long-term follow-up of the Diabetes Control and Complications Trial cohort. Diabetes Care 1999;22:99–111. doi: 10.2337/diacare.22.1.99. [DOI] [PMC free article] [PubMed] [Google Scholar]
- 31.Nathan DM, Bayless M, Cleary P, Genuth S, Gubitosi-Klug R, Lachin JM, Lorenzi G, Zinman B, for the DCCT/EDIC Research Group. Diabetes control and complications trial/epidemiology of diabetes interventions and complications study at 30 years: advances and contributions. Diabetes 2013;62:3976–3986. doi: 10.2337/db13-1093. [DOI] [PMC free article] [PubMed] [Google Scholar]
- 32.Dang M, Rockell J, Wagner R, Wenzlau JM, Yu L, Hutton JC, Gottlieb PA and Davidson HW. Human type 1 diabetes is associated with T cell autoimmunity to zinc transporter 8. J Immunol 2011;186:6056–6063. doi: 10.4049/jimmunol.1003815. [DOI] [PMC free article] [PubMed] [Google Scholar]
- 33.Bonifacio E, Yu L, Williams AK, Eisenbarth GS, Bingley PJ, Marcovina SM, Adler K, Ziegler AG, Mueller PW, Schatz DA, Krischer JP, Steffes MW and Akolkar B. Harmonization of glutamic acid decarboxylase and islet antigen-2 autoantibody assays for national institute of diabetes and digestive and kidney diseases consortia. J Clin Endocrinol Metab 2010;95:3360–3367. doi: 10.1210/jc.2010-0293. [DOI] [PMC free article] [PubMed] [Google Scholar]
- 34.Cleary PA, Orchard TJ, Genuth S, Wong ND, Detrano R, Backlund JY, Zinman B, Jacobson A, Sun W, Lachin JM, Nathan DM; DCCT/EDIC Research Group. The effect of intensive glycemic treatment on coronary artery calcification in type 1 diabetic participants of the Diabetes Control and Complications Trial/Epidemiology of Diabetes Interventions and Complications (DCCT/EDIC) Study. Diabetes 2006;55:3556–3565. doi: 10.2337/db06-0653. [DOI] [PMC free article] [PubMed] [Google Scholar]
- 35.Hochberg Y and Benjamini Y. More powerful procedures for multiple significance testing. Stat Med 1990;9:811–818. doi: 10.1002/sim.4780090710. [DOI] [PubMed] [Google Scholar]
- 36.Hoeldtke RD, Hampe CS, Bekris LM, Hobbs G, Bryner KD, Lernmark A; The DCCT Research Group. Antibodies to GAD65 and peripheral nerve function in the DCCT. J Neuroimmunol 2007;185:182–189. doi: 10.1016/j.jneuroim.2007.01.009. [DOI] [PubMed] [Google Scholar]
- 37.Jenkins AJ, Rothen M, Klein RL, Moller K, Eldridge L, Zheng D, Durazo-Arvizu R, McGee D, Lackland D, Thorpe SR, Garvey WT, Lyons TJ, the DCCT/EDIC Research Group. Cross-sectional associations of C-reactive protein with vascular risk factors and vascular complications in the DCCT/EDIC cohort. J Diabetes Complications 2008;22:153–163. doi: 10.1016/j.jdiacomp.2007.02.003. [DOI] [PubMed] [Google Scholar]
- 38.Lopes-Virella MF, Carter RE, Gilbert GE, Klein RL, Jaffa M, Jenkins AJ, Lyons TJ, Garvey WT, Virella G, and the DCCT/EDIC Cohort Study Group. Risk factors related to inflammation and endothelial dysfunction in the DCCT/EDIC cohort and their relationship with nephropathy and macrovascular complications. Diabetes Care 2008;31:2006–2012. doi: 10.2337/dc08-0659. [DOI] [PMC free article] [PubMed] [Google Scholar]
- 39.de Boer IH and Bakris GL. Diabetic Kidney Disease: A Determinant of Cardiovascular Risk in Type 1 Diabetes. Diabetes Care 2018;41:662–663. doi: 10.2337/dci17-0053. [DOI] [PMC free article] [PubMed] [Google Scholar]
- 40.Nystrom T, Holzmann MJ, Eliasson B, Kuhl J and Sartipy U. Glycemic Control in Type 1 Diabetes and Long-Term Risk of Cardiovascular Events or Death After Coronary Artery Bypass Grafting. J Am Coll Cardiol 2015;66:535–543. doi: 10.1016/j.jacc.2015.05.054. [DOI] [PubMed] [Google Scholar]
- 41.Klein L, Kyewski B, Allen PM and Hogquist KA. Positive and negative selection of the T cell repertoire: what thymocytes see (and don’t see). Nat Rev Immunol 2014;14:377–391. doi: 10.1038/nri3667. [DOI] [PMC free article] [PubMed] [Google Scholar]
- 42.Lv H and Lipes MA. Role of impaired central tolerance to alpha-myosin in inflammatory heart disease. Trends Cardiovasc Med 2012;22:113–117. doi: 10.1016/j.tcm.2012.07.005. [DOI] [PMC free article] [PubMed] [Google Scholar]
- 43.Koya D and King GL. Protein kinase C activation and the development of diabetic complications. Diabetes 1998;47:859–866. doi: 10.2337/diabetes.47.6.859. [DOI] [PubMed] [Google Scholar]
- 44.Selvin E, Lazo M, Chen Y, Shen L, Rubin J, McEvoy JW, Hoogeveen RC, Sharrett AR, Ballantyne CM and Coresh J. Diabetes mellitus, prediabetes, and incidence of subclinical myocardial damage. Circulation 2014;130:1374–1382. doi: 10.1161/CIRCULATIONAHA.114.010815. [DOI] [PMC free article] [PubMed] [Google Scholar]
- 45.Leslie D, Lipsky P and Notkins AL. Autoantibodies as predictors of disease. J Clin Invest 2001;108:1417–1422. doi: 10.1172/JCI14452. [DOI] [PMC free article] [PubMed] [Google Scholar]
- 46.Libby P Inflammation in atherosclerosis. Nature 2002;420:868–874. doi: 10.1038/nature01323. [DOI] [PubMed] [Google Scholar]
- 47.Cunha-Neto E, Coelho V, Guilherme L, Fiorelli A, Stolf N and Kalil J. Autoimmunity in Chagas’ disease. Identification of cardiac myosin-B13 Trypanosoma cruzi protein crossreactive T cell clones in heart lesions of a chronic Chagas’ cardiomyopathy patient. J Clin Invest 1996;98:1709–1712. doi: 10.1172/JCI118969. [DOI] [PMC free article] [PubMed] [Google Scholar]
- 48.Alman AC, Kinney GL, Tracy RP, Maahs DM, Hokanson JE, Rewers MJ and Snell-Bergeon JK. Prospective association between inflammatory markers and progression of coronary artery calcification in adults with and without type 1 diabetes. Diabetes Care 2013;36:1967–1973. doi: 10.2337/dc12-1874. [DOI] [PMC free article] [PubMed] [Google Scholar]
- 49.Cunha-Neto E, Duranti M, Gruber A, Zingales B, De Messias I, Stolf N, Bellotti G, Patarroyo ME, Pilleggi F and Kalil J. Autoimmunity in Chagas disease cardiopathy: biological relevance of a cardiac myosin-specific epitope crossreactive to an immunodominant Trypanosoma cruzi antigen. Proc Natl Acad Sci U S A 1995;92:3541–3545. doi: 10.1073/pnas.92.8.3541. [DOI] [PMC free article] [PubMed] [Google Scholar]
- 50.Fradkin JE, Cowie CC, Hanlon MC and Rodgers GP. Celebrating 30 years of research accomplishments of the Diabetes Control and Complications Trial/Epidemiology of Diabetes Interventions and Complications study. Diabetes 2013;62:3963–3967. doi: 10.2337/db13-1108. [DOI] [PMC free article] [PubMed] [Google Scholar]
Associated Data
This section collects any data citations, data availability statements, or supplementary materials included in this article.