

Summary
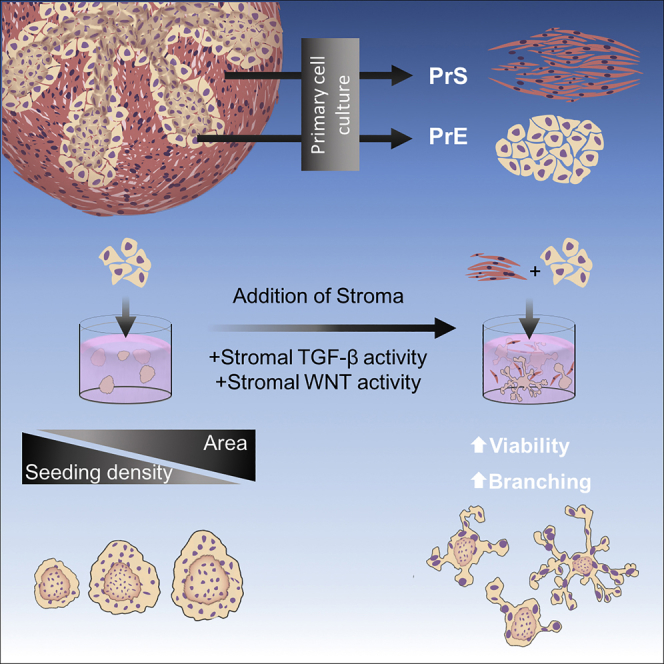
The fibromuscular stroma of the prostate regulates normal epithelial differentiation and contributes to carcinogenesis in vivo. We developed and characterized a human 3D prostate organoid co-culture model that incorporates prostate stroma. Primary prostate stromal cells increased organoid formation and directed organoid morphology into a branched acini structure similar to what is observed in vivo. Organoid branching occurred distal to physical contact with stromal cells, demonstrating non-random branching. Stroma-induced phenotypes were similar in all patients examined, yet they maintained inter-patient heterogeneity in the degree of response. Stromal cells expressed growth factors involved in epithelial differentiation, which was not observed in non-prostatic fibroblasts. Organoids derived from areas of prostate cancer maintained differential expression of alpha-methylacyl-CoA racemase and showed increased viability and passaging when co-cultured with stroma. The addition of stroma to epithelial cells in vitro improves the ability of organoids to recapitulate features of the tissue and enhances the viability of organoids.
Subject Areas: Bioengineering, Biological Sciences, Cell Biology, Tissue Engineering
Graphical Abstract
Highlights
-
•
Co-culture with human primary prostate stroma improves epithelial organoid viability
-
•
Stromal cell contact in co-culture directs epithelial organoid branching
-
•
Prostate stromal cells express morphogenic factors unique from non-prostate fibroblasts
-
•
Co-culture with stroma maintains AMACR and increases survival of cancer derived-organoids
Bioengineering; Biological Sciences; Cell Biology; Tissue Engineering
Introduction
Prostate development and disease is primarily studied in vitro using a small set of immortalized or transformed benign and cancer cell lines. To more accurately study patient phenotypes and heterogeneity, primary cells are an alternative strategy but are limited in the number of passages and bias toward cells capable of growing on plastic. To address these concerns, three-dimensional (3D) organoid culture systems have been developed for in vitro use as an alternative to immortalized cell lines and animal models. Organoids reflect tissue structure and function while maintaining genetic diversity and lineage specificity (Wang et al., 2017). Single epithelial cells or cell aggregates from colon, breast, prostate, lung, pancreas, and salivary ducts cultured in 3D matrices can form fully differentiated organoids comprising cell types that closely mimic the structure and function of the in vivo tissue (Kretzschmar and Clevers, 2016).
Bipotent adult human and murine prostate progenitor cells of basal or luminal epithelial origin can differentiate into organoids with pseudostratified epithelium consisting of an outer layer of Ck5+ and p63+ basal cells, a single inner layer of Ck8/18+ and androgen receptor (AR)-expressing luminal cells, and central lumen closely resembling the in vivo acinar structure (Chua et al., 2014, Garraway et al., 2010, Karthaus et al., 2014). Although these current organoid models have improved modeling of differentiated tissues, they are limited because they lack incorporation of other cell types of the prostate gland, including neuroendocrine, immune, endothelial, and stromal cells.
The dominant cell type surrounding prostate epithelial (PrE) acini is a fibromuscular mesenchyme, also known as stroma, which exerts regulatory control over normal glandular differentiation and contributes to carcinogenesis (Niu and Xia, 2009). The stroma comprises the bulk of the prostate and contains fibroblasts, myofibroblasts, and smooth muscle cells (Farnsworth, 1999). The prostate mesenchyme influences gland formation during neonatal development, and stromal AR signaling is essential for normal gland morphogenesis (Cunha and Chung, 1981). Paracrine signaling between stroma and epithelium, which includes secreted WNTs, fibroblast growth factors (FGFs), sonic hedgehog, bone morphogenetic proteins (BMPs), and transforming growth factor (TGF) β, has positive and negative regulatory roles in adult PrE maintenance, regeneration, and transformation (Prins and Putz, 2008). Stroma-epithelial cross talk is altered during prostate carcinogenesis wherein cancer-associated fibroblasts of the surrounding stroma trigger remodeling of the tumor microenvironment, which promotes prostate carcinogenesis and increases metastases (Barron and Rowley, 2012, Franco et al., 2010). Tissue recombination models of cancer-associated fibroblasts with PrE cells indicate that stromal alterations can induce epithelial transformation (Franco et al., 2011) and promote gland-forming capabilities of cancer stem cells (Liao et al., 2010). Furthermore, in vitro studies using stromal cells grown on a Transwell insert reveal that stromal secretions are essential for proper prostate organoid development and morphology (Lang et al., 2001) and response to hormones (Giangreco et al., 2015).
Culture conditions influence the phenotype of prostate organoids, and stromal regulation over epithelial cells is essential, yet a 3D model that includes prostate stroma has not been reported. To address this need, we systematically optimized and characterized a 3D co-culture model that facilitates direct stroma-epithelial organoid interaction. Under optimal co-culture conditions, the addition of prostate stroma to 3D organoid culture increases organoid formation efficiency, influences branching morphogenesis, demonstrates stromal-epithelial cross talk, and provides a model to recapitulate some of the in vivo phenotypes.
Results
Addition of Human Primary Prostate Stromal Cells to 3D Culture of Human Benign Prostate Epithelial Cells Increases Organoid Branching
The method for co-culture using primary PrE and stromal cells was optimized by systematic modifications of cell density, matrix composition, culture medium, and plating format (Matrigel base layer or low-attachment plates). All experiments used human primary PrE and primary prostate stromal (PrS) cells as previously described (Giangreco et al., 2013, Nonn et al., 2006) at seeding densities from 1 × 10³ to 2 × 10⁴ cells/well in a 96-well microplate format. The PrS cells are composed of fibroblasts and smooth muscle cells, expressing TIMP3, smooth muscle actin (SMA), and vimentin (Figure 1A). Patient characteristics from which cells were derived are listed in Table 1. Matrigel compositions of 5% and 10% were tested in ultra-low-attachment microplates, and Matrigel compositions of 10%, 33%, and 50% were tested in flat-bottom microplates (data not shown). Co-cultures seeded in ultra-low-attachment microplates were undesirable; cells formed spherical aggregates rather than organoids derived from single progenitor cells (data not shown). The final optimal co-culture conditions consisted of a total cell density of 5 × 10³ cells/well in 33% Matrigel, in a keratinocyte-serum-free medium base media with charcoal-stripped fetal bovine serum and dihydrotestosterone without ROCK inhibitor as determined by organoid number, growth, survival, and experimental endpoints.
Figure 1.

3D Co-culture with Prostate Stroma Supports Organoid Growth and Increases Organoid Branching
(A) Gene expression of PrS mix 1 from microarray of stroma-specific genes TIMP3, von Willebrand factor (VWF), α-SMA (ACT2 shown as SMA), and EpCAM. Quadruplicate measures reported; error bars represent one standard deviation of the mean. Stromal cells are a heterogeneous mixture of fibroblasts and myofibroblasts by immunofluorescent staining of α-SMA and vimentin in PrS mix 3. Scale bar, 100 μm.
(B) Schematic of mono-culture and co-culture workflow and conditions. PrE and PrS cells seeded into 33% Matrigel on top of 50% Matrigel base layer.
(C) Fluorescent images of PrS mix 1 incorporation of an EdU analog cultured in 3D conditions. Scale bar, 200 μm.
(D) Bright-field images of organoids in mono- and co-culture derived from dissociated epithelial cells isolated from benign prostate tissue specimens of two patients (PrE-1, top; PrE-2, bottom). Hematoxylin and eosin staining showing histopathology of patient tissue. Scale bar, 200 μm.
(E) Percentage of branched organoids in mono- and co-cultures on days 7 and 14 according to a branching classification scheme used to categorize each organoid by extent of branching (right). Quantification of organoid branching in mono- and co-cultures according to the branching classification scheme in organoids derived from two patients (PrE-1, top; PrE-2, bottom). Triplicate wells per condition, n reported as sum of branched organoids from triplicate wells per condition.
(F) Bright-field images of time course showing PrE-1 organoid branching from days 6–10 in co-culture with PrS mix 4. Scale bar, 200 μm.
Table 1.
Human Primary Cell Patient Characteristics
| Primary Prostate Epithelial Cells | |||||
|---|---|---|---|---|---|
| Cell ID | Pathology of Tissue Region | Age (Years) | Race | Shown in Figure | Organoid Growth |
| PrE-1 | Benign | 71 | AA | Figures 1, 2, 3, 4, and S1–S5 | ++++ |
| PrE-2 | Benign | 68 | AA | Figures 1, 3, S1, S4, and S5 | ++++ |
| PrE-3 | Benign | 58 | AA | Figures 5, S4, and S5 | ++ |
| PrECa-3 | Cancer 3 + 4 | Figures 5 and S4–S6 | +++ | ||
| PrE-4 | Benign | U | AA | Figures 5, S4, and S5 | ++ |
| PrECa-4 | Cancer 4 + 4 | Figures 5 and S4–S6 | ++ | ||
| PrE-5 | Benign | 60 | AA | Figures 5 and S4 | +++ |
| PrECa-5 | Cancer 3 + 3 | Figures 5, S4, and S6 | ++++ | ||
| PrE-6 | Benign | 57 | EA | Figures S4 and S5 | – |
| PrECa-6 | Cancer 4 + 4 | Figures S4–S6 | + | ||
| PrE-7 | Benign | 62 | EA | Figures S4 and S5 | – |
| PrECa-7 | Cancer 3 + 4 | Figures S4–S6 | ++ | ||
| Primary Prostate Stromal Cells | ||||
|---|---|---|---|---|
| Cell ID | Pathology of Tissue Region | Age | Race | Used in PrS Mix # |
| PrS-1 | Benign | 71 | AA | 3 |
| PrS-3 | Benign | 58 | AA | |
| PrS-8 | Benign | 64 | AA | 1, 2, 3 |
| PrS-9 | Benign | 60 | C | 1, 2, 3 |
| PrS-10 | Benign | 50 | AA | 1, 2 |
| PrS-11 | Benign | 55 | AA | 1 |
| PrS-12 | Benign | 71 | AA | 1 |
| PrS-13 | Benign | 61 | H | 2, 5, 6 |
| PrS-14 | Benign | 54 | U | 2 |
| PrS-15 | Benign | 63 | AA | 4 |
| PrS-16 | Benign | 61 | AA | 4 |
| PrS-17 | Benign | 73 | C | 4 |
| PrS-18 | Benign | 59 | AA | 4 |
| PrS-19 | Benign | 66 | AA | 6 |
| PrS-20 | Benign | 62 | U | 5, 6 |
PrS, primary stromal; PrE, primary epithelial; AA, African American; EA, European American; H, Hispanic; U, unavailable data.
The effect of stroma was first examined using PrE organoids and PrS cells derived from benign regions of radical prostatectomy tissue. The benign PrE cells from two patients were cultured using a 1:2 ratio of PrE:PrS (Figure 1B). Organoids, defined as multicellular acini-like structures derived from a single progenitor cell, were visible at day 7 in all cultures, and co-culture organoids exhibited a pronounced qualitative branching phenotype that mimicked normal acinar structure in vivo, whereas branching was rarely observed in mono-culture (Figure 1D). PrS cells were largely cytostatic in co-culture with ∼4 × 10³ cells/well remaining after 7 days with few dividing cells observed through incorporation of a 5-Ethylnyl-2'-deoxyuridine (EdU)-Alexafluor647 analog (Figure 1C). To test if organoids form from single cells, PrE cells were independently labeled with GFP or red fluorescence protein (RFP), mixed, and seeded into 3D culture. None of the organoids co-expressed both RFP and GFP markers (Figure S1A). As well, daily imaging of PrE cells co-cultured with GFP-labeled PrS cells showed steady outgrowth rather than clumping, indicating that the organoids were of single progenitor cell origin (Figure S1B). Quantification and categorization of organoid branching according to a branching classification scheme confirmed that co-culture with stroma produced more branched organoids of more complex structures compared with mono-culture (Figure 1E). The branching phenotype was not unique to co-culture as branching was observed in mono-culture organoids in one of the patient tissues (PrE-2), but to a lesser extent than in co-culture (Figure 1E). In addition, time-lapse imaging for a period of ∼24 h of day 7 organoids showed that branching morphogenesis is more complex and dynamic in co-culture (Video S1) compared with mono-culture (Video S2). Branching of a single organoid in co-culture shows morphogenesis over a 5-day period from days 6–10 (Figure 1F).
Cells used, PrE-1 and PrS mix 1.All movies are composed of time-lapse images taken every 5 min. Time format, hour:min.
Cells used, PrE-1.
Organoids cultured in these co-culture conditions exhibited differentiation with mixed p63-positive and p63-negative cells (Figure 2A). Both mono and co-culture organoids formed lumens and contained AR+ and AR− cells demonstrating differentiation toward a luminal phenotype (Figures 2A, 2B, and S2A–S2C). However, the media was negative for prostate specific antigen (PSA) secretion by ELISA (data not shown) suggesting incomplete luminal differentiation. Organoids in co-culture had complex branches that expressed the basal marker Ck5 on the periphery and Ck8 throughout the organoid as visualized by whole-mount immunofluorescent imaging (Figure 2C and D) indicating that the organoid body was composed of epithelial cells. Unbranched organoids predominantly formed lumens (Figure S2A), and branched organoids had mixed morphology with solid and hollow branching structures (Figures S2B and S2C). For organoid co-culture, PrE cells from 12 patient tissues and one immortalized cell line (benign RWPE-1) were attempted with varying viability (Table 1). Tissues that generated viable organoids exhibited patient-specific heterogeneity in the extent of stroma-induced branching, and only one exhibited branching in the absence of stroma (Figure S3). Notably, cells that grew poorly as organoids in monoculture had increased viability when grown in co-culture with stromal cells (Figure S3, PrE-6 and PrE-7).
Figure 2.

Organoids in Mono-culture and Co-culture Form Mixed Epithelial Differentiation and Contain Lumens
(A) H&E and immunofluorescent images of differentiation markers p63 and Ck8 of PrE-1 organoids in mono-culture and co-culture with PrS mix 1. Inset shows Ck8+ cells co-expressing p63 (green arrow) or p63− (white arrow). Scale bars, 50 μm.
(B) Immunohistochemical stain for AR in PrE-1 organoids in mono-culture and co-culture with PrS mix 1. Insets show high magnification of adjacent AR+ (green arrow) and AR− (black arrow) cells. Scale bars, 50 μm.
(C) Whole-mount immunofluorescent staining of Ck5 (green), Ck8 (blue), and phalloidin (red) in day 14 PrE-2 organoids co-cultured with PrS mix 1. Scale bars, 500 μm (merge) and 100 μm (zoom).
(D) Whole-mount immunofluorescent staining of organoid with PrS-GFP cells (green), Ck8 (blue), and phalloidin (red) in day 12 PrE-1 organoids cultured with GFP-labeled PrS mix 3. Scale bars, 500 μm (merge) and 100 μm (zoom).
Decreasing the Epithelial-to-Stromal Cell Ratio Increases Organoid Formation Efficiency and Decreasing Epithelial Seeding Density Alone Increases Organoid Size
Initial co-culture conditions demonstrated increased organoid branching by the addition of stroma. PrS cells from two patients (PrS-2, PrS-6) were used for initial studies shown in Figure 1. However, to provide continuity in the stromal source for subsequent experiments, PrS cells from 13 patients were mixed to form a total of 6 pools, cryopreserved at low passage, and thawed for each experiment (Table 1). Notably, co-culture with PrS-2, PrS-6, or PrS pools stimulated organoid branching, indicating that stromal induction of branching was not unique to one stromal line. This phenotype was further assessed through alteration of the ratio of stromal to epithelial cells in the co-culture by examining various PrE:PrS seeding ratios. The total number of cells per well was kept constant at 5 × 10³, and ratios of 1:1, 1:2, and 1:4 (PrE:PrS) were used. To ensure accurate unbiased quantification of organoids, an imaging and analysis pipeline was created to quantify organoid number and size in 3D culture. Whole-well images were captured at 25 z-planes encompassing the entire 3D matrix and compressed to generate a single enhanced depth-of-field, in-focus image of each well for analysis (Figure 3A). This imaging method enabled quantification of each organoid in situ at multiple time points without disturbance of the culture. Resultant image analysis revealed that organoid formation efficiency, quantified on day 7, was significantly higher in co-cultures at PrE:PrS ratios of 1:2 (p < 0.05) and 1:4 (p < 0.0001) compared with mono-culture controls that contained an equal number of PrE cells but lacked stroma (Figure 3B). In addition, there was a significant positive linear trend for organoid formation efficiency in the co-cultures as the PrE:PrS ratio decreased (p < 0.0001); this trend was absent in mono-culture (Figure 3B).
Figure 3.

Differential Effects of the Epithelial-to-Stromal Cell Ratio and Epithelial Seeding Density on Organoid Formation Efficiency, Size, and Branching Morphologies
(A) Pipeline for whole-well imaging and analysis. Image acquisition at 25 z-planes per well, generation of a single enhanced depth-of-field image, conversion to grayscale, and identification of each organoid. The area, circularity, and maximum/minimum radius ratio were calculated for each organoid in every well. Calculation details can be found in Methods.
(B) Organoid formation efficiency percentage (number of organoids per number of PrE seeded) for mono and co-cultures. Triplicate wells per condition; errors bars represent one standard deviation of the mean.
(C) Area quantification of organoids in mono and co-cultures. Triplicate wells per conditions; error bars show mean with 95% confidence interval.
(D) Representative bright-field images depicting branching morphologies of organoids in co-culture derived from two patients, PrE-1 and PrE-2, at various PrE seeding densities. Scale bars, 500 μm.
(E) Organoid formation efficiency (number organoids per number of PrE cells seeded) in mono-culture (white bar) and co-culture (black bars) seeded at 100 PrE cells/well with increasing numbers of PrS cells. Triplicate wells per condition; error bars represent one standard deviation of the mean.
(F) Area quantification of organoids in mono-culture (gray circles) and co-culture (white squares) with increasing numbers of PrS cells. Each dot represents a single organoid; data from triplicate wells combined. Error bars show mean with 95% confidence interval.
(G) Quantification of organoid area (left), circularity (middle), and maximum/minimum radius ratio (right) at days 7 and 14. Enhanced depth-of-field images (bottom) of a single organoid in mono-culture and co-culture and their corresponding area and circularity metrics on the graphs above (Mono, blue circle; co, red square). Each data point represents a single organoid from triplicate wells. Error bars show mean with 95% confidence interval for area and circularity and standard error of the mean for maximum/minimum radius ratio. Scale bar, 100 μm.
All data from PrE-1 and PrS mix 2 except where noted. p value <0.1 was considered statistically significant. *p < 0.1, **p < 0.05, ***p < 0.01, ****p < 0.001; ns, not significant.
Organoid size was assessed on day 14 by quantifying the area of each organoid using the whole-well images generated from the imaging pipeline. Organoids in co-culture had significantly smaller areas in the 1:1 PrE:PrS conditions, but no difference in organoid size between mono- and co-cultures was observed at the lower PrE:PrS ratios of 1:2 or 1:4 (Figure 3C). There was also a significant positive linear trend by ANOVA for organoid area in the mono-cultures as PrE seeding density decreased (p < 0.0001) (Figure 3C). Although co-culture with stroma significantly increased organoid formation efficiency, organoid size appeared to be a consequence of PrE seeding density alone, and variation of PrE to PrS ratio had no effect on area.
Addition of Stromal Cells to Co-culture Alters Organoid Morphologies
The combined effect of adding stroma to the co-culture and altering the PrE seeding density was further dissected to determine which was responsible for the observed phenotypes. Reduction in PrE seeding density to 250, 100, or 50 cells/well in co-culture with 5 × 10³ PrS cells preserved the branching phenotype and enhanced organoid size; indeed, organoids seeded at these very low densities grew to >1 mm in diameter and were visible with the naked eye (Figure 3D). To validate the observed increase in formation efficiency as a consequence of co-culture with stroma, increasing quantities of stroma (1 × 10³, 5 × 10³, or 1 × 10⁴ PrS/well) were co-cultured with PrE cells seeded at 100 cells/well for final PrE:PrS ratios of 1:10, 1:50, and 1:100. Addition of stroma significantly increased organoid formation efficiency, consistent with results at higher PrE densities, but no “dose effect” was observed, as organoid formation efficiency plateaued at ∼50% regardless of stromal quantity (Figure 3E). Organoid area was also unaffected by the addition of stroma in these low-PrE-density culture conditions and consistent with results at higher PrE densities (Figure 3F).
To objectively quantify organoid branching morphology in an automated manner, measurements of area, circularity, and maximum/minimum radius ratio were used as indicators of structure complexity (Figure 3A). Circularity was calculated as the ratio of the area of an organoid against a circle whose diameter is equal to the organoid's maximum Feret diameter and provides a value of 0–1, where 1 corresponds to a perfect circle and values < 1 indicate a more complex structure. Calculation of the maximum/minimum radius ratio enabled quantification of organoid structure, where a value of 1 indicated no branching and a value >1 corresponded to the magnitude of the largest branch from the center of the object. Organoids grown in co-culture had significantly greater area on day 7 compared with mono-culture organoids, but this effect was absent by day 14 (Figure 3G). Organoids in co-culture were significantly less circular and had significantly greater maximum/minimum radius ratios compared with those in mono-culture on days 7 and 14, consistent with a more branched phenotype (Figure 3G). Furthermore, quantification of area and circularity revealed that although mono- and co-culture organoids were similarly sized, their circularities could differ considerably (Figure 3G, mono: blue circle, co: red square). Analysis and quantification of organoid structure using our imaging pipeline provided a complete and robust assessment of branching morphologies and revealed several structural differences due to the addition of stroma.
Prostate Stromal Cells Influence Organoid Branching Morphogenesis via Cell-Cell Contact and Express Factors that Regulate Branching
The branching process of organoids was observed by time-lapse video of single organoids and demonstrated stromal cell taxis and pseudopodia extension toward an organoid (Video S3). Direct stromal-organoid cell contact also appeared to influence organoid budding, branching, and stalk elongation: bud formation and branch extension occurred upon, or immediately before, stroma-organoid interaction (Figure 4A, black arrowheads) (Video S4). In each observed occurrence, organoid budding and stalk elongation occurred distally to stromal cell contact (Figure 4A) (Videos S5 and S6). Branching appeared to arise as a stochastic process influenced by the presence of stroma, and rare instances of branch detachment were also observed (Video S7). Organoid branching required direct co-culture and contact with PrS as co-culture using a Transwell insert failed to significantly alter organoid circularity or maximum/minimum radius ratios (Figure 4B).
Figure 4.

Stromal Cells Influence Organoid Branching Morphogenesis via Cell-Cell Contact and Express Unique Factors Compared with Non-prostate Fibroblasts
(A) Bright-field image on sequential days of stromal cell (boxed and zoom) taxis toward an organoid followed by distal bud formation (black arrow). Large scale bar, 200 μm; small scale bar, 50 μm. PrE-1 in co-culture with PrS-2.
(B) PrE-1 organoids grown in mono-culture (mono), Transwell co-culture (Trans), or direct co-culture (Co) with PrS mix 4 stromal cells. Circularity and maximum/minimum radius ratio measurements quantified from triplicate wells per condition; error bars show mean with 95% confidence interval for circularity and standard error of the mean for maximum/minimum radius ratio.
(C) Bright-field and fluorescent images of GFP-labeled PrS mix 3 cells in co-culture with PrE-1 organoids at days 3 and 10. Fluorescent images of GFP-labeled PrS mix 3 cells in co-culture with PrE-1 organoids at day 12 with phalloidin (red) in bottom panel. Scale bars, 200 μm.
(D) Fluorescent image of GFP-labeled PrS mix 3 cells in co-culture with PrE-1 epithelial organoid incorporation of an EdU analog (pink). Scale bar, 200 μm.
(E) Bright-field and fluorescent images of GFP-labeled NIH3T3 cells co-cultured with PrE-1 organoids. Circularity and maximum/minimum radius ratio measurements of organoids in mono-culture and co-culture with NIH3T3 cells. Triplicate wells per condition; error bars show mean with 95% confidence interval for circularity and standard error of the mean for maximum/minimum radius ratio. Scale bar, 200 μm.
(F) Comparative gene expression profiling of the human growth factors and TGF-β pathway by qPCR arrays in PrS mix 1 and NIH3T3 cells grown in 3D conditions. Array normalization details in Methods section.
(G) Circularity and maximum/minimum radius ratio measurements of organoids in mono-culture and co-culture treated with Noggin (NOG) or FGFR inhibitor (BGJ398). PrS mix 4 and PrE-1 organoids used in triplicate wells per condition; error bars show mean with 95% confidence interval for circularity and standard error of the mean for maximum/minimum radius ratio.
p value < 0.1 was considered statistically significant. *p < 0.1, **p < 0.05, ***p < 0.01, ****p < 0.001; ns, not significant.
Cells used, PrE-1 and PrS mix 1.
Cells used, PrE-1 and PrS mix 1.
Subsequent Bud Formation and Elongation Occurred Distal to Stroma-Organoid Contact. Cells used, PrE-1 and PrS mix 1.
Complex Stalk Elongation Occurred Distal to Stroma-Organoid Contact. Cells used, PrE-1 and PrS mix 1.
Bud Detachment Occurred after 29 h (Top of Organoid), and Stalk Detachment at 31 h (Top of Frame). Cells used, PrE-1 and PrS mix 1.
In addition to influencing branching through direct contact with organoids, GFP-labeled PrS cells associated around larger and more complex organoid structures (Figures 4C, S2A, and S2C) (Video S8), and with actively proliferating epithelial organoids indicated by incorporation of EdU (Figure 4D). PrS cells moved throughout the culture via contraction and expansion of pseudopodia as well as remodeling of the surrounding matrix (Video S9).
Cells used, PrE-1 and PrS mix 3.
Cells used, PrE-1 and PrS mix 1.
To test the specificity of prostate-derived stroma to mediate branching, co-culture with NIH3T3 cells was examined. Co-culture with GFP-labeled NIH3T3 embryonic mouse fibroblasts also resulted in extensive contact with organoids (Figure 4E) (Video S10), but did not increase organoid branching, as assessed by circularity and maximum/minimum radius ratios (Figure 4E). Similar to co-culture with PrS, addition of NIH3T3 cells significantly increased the organoid formation efficiency; however, in contrast, it also increased the organoid area on day 14, an effect not observed with PrS culture (Figures S4A and S4B). Overall, the branch induction of organoids was specific to PrS as the source of stroma, suggesting prostate-specific factors in morphogenic regulation.
Extensive Cell-Cell Contact and Encapsulation of Organoids Inhibited Branching. Cells used, PrE-1.
The expression of morphogenesis-related genes in 3D PrS cells, with NIH3T3 fibroblasts for comparison, was quantified using qRT-PCR profiling arrays for TGF-β pathway and human growth factors. NIH3T3 cells expressed only 7 of the 20 genes most highly expressed by PrS cells in the TGF-β pathway and just 6 of the top 20 genes expressed by PrS cells in the Human Growth Factors array (Figure 4E). Notably, genes involved in the induction of prostate branching and gland development—FGF7, FGF2, LEFTY1, and DKK1—were highly expressed in PrS cells grown in 3D (Figure 4E). The mesenchymal secreted proteins BMP1, BMP4, BMP5, and FGF7 were highly expressed by the PrS cells and are known morphogenic factors in branching morphogenesis of the developing prostate (Prins and Putz, 2008). Addition of the BMP inhibitor Noggin, or the FGF receptor (FGFR) inhibitor BGJ398, significantly decreased organoid branching in the co-culture compared with mono-culture as assessed by circularity and maximum/minimum radius ratio measurements (Figure 4G). TGF-ß1, TGF-ß2, TGF-ßI, and TGF-ßR2 were also highly expressed in the PrS cells; however, treatment with a TGF-β-neutralizing antibody had no effect on organoid branching in the co-culture (data not shown).
Co-culture Organoids Grown from Benign and Cancer Regions of the Same Patient Maintain Histologic Phenotype and Improve Passaging
Given the current challenges in the culture of organoids from localized prostate cancer, we tested if the addition of stroma would increase viability and maintain phenotypes observed in the tissue from which the cells were derived. Cells from five patient tissues were isolated from punches taken at a 100% cancer region (PrECa-3, PrECa-4, PrECa-5, PrECa-6, and PrECa-7) and a 100% benign region (PrE-3, PrE-4, PrE-5, PrE-6, and PrE-7), as confirmed by a board-certified pathologist (Figures 5A, 5B, and S3), and co-cultured with a cryopreserved PrS cell mixture to provide a consistent stromal source. AMACR (alpha-methylacyl-CoA racemase) is a well-established marker for prostate cancer (PCa) (Ananthanarayanan et al., 2005, Jiang et al., 2004, Rubin et al., 2002) and immunohistochemistry confirmed that the benign tissue from which the organoids were derived had low AMACR expression, whereas the matched cancer tissues had high AMACR expression (Figures 5A and 5B). Immunohistochemical staining and qRT-PCR of the organoids showed a similar pattern of AMACR expression, with the highest observed in the co-cultured organoids derived from the cancer areas (Figures 5C and S5, four patients shown). The organoids derived from these patients, both from benign and cancer, were notably smaller and less differentiated than other patients, which may be a result of patient heterogeneity.
Figure 5.

Co-culture Organoids Grown from Benign and Cancer Regions of the Same Patient Maintain Histologic Phenotype and Improve Passaging
(A) Isolation and co-culture of matched primary prostate organoids derived from benign and cancer regions of the same patient, with PrS cells.
(B) Matched benign (PrE-5) and cancer (PrECa-5) tissue from the patient from which cells were isolated for organoid growth. Histology shown by hematoxylin and eosin staining (top panel), and presence of AMACR shown by immunohistochemistry (bottom panel). 10X image shown with 40X inset for AMACR.
(C) Matched organoids derived from benign regions (PrE-5) and cancer regions (PrECa-5) from patient tissue shown in (B) grown in mono-culture and co-culture in 3D with PrS mix 5. Histology shown by hematoxylin and eosin staining (top panel), and presence of AMACR shown by immunohistochemistry (bottom panel). 40X images shown with 100-μM scale bar.
(D) Whole-well images of passage 0 and passage 2 mono- and co-culture PrECa-7 organoids derived from cancer regions. High magnification of selected organoid shown in inset. Inset shown with 100-μm scale bar.
(E) Expression of AMACR by qRT-PCR in total RNA isolated from matched organoids derived from benign and cancer tissue shown in (C) and passage 2 organoids shown in (D). Note that the benign organoids did not survive passage.
p value < 0.1 was considered statistically significant. *p < 0.1, **p < 0.05, ***p < 0.01, ****p < 0.001; ns, not significant.
To assess the ability of stroma to improve long-term viability of cancer-derived organoids, organoids derived from cancer regions of the four patients were passaged twice. Two of the mono-culture organoids did not survive passaging, whereas their co-culture counterparts thrived and maintained AMACR expression (Figures 5C and S5). Quantification of AMACR at the first and last passages showed that differential expression was maintained only in the presence of the stromal cells. Of note, organoids from Gleason 3 + 3 tumors grew better in general than those from higher grade (Table 1, Figures S3 and S6).
Discussion
The current in vitro 3D models of human PrE organoid lack the surrounding stroma. The influence of stroma on adjacent epithelium has been studied in vivo using xenografts (Sasaki et al., 2017) and in vitro using Transwell inserts (Lang et al., 2001, Giangreco et al., 2015), but this is the first study, to our knowledge, to enable direct prostate stroma-epithelium interaction in a 3D matrix and determine the paracrine role of stroma in human epithelial organoid growth and phenotype. We systematically optimized 3D co-culture conditions to combine both stroma and epithelial cells into the organoid model. Addition of human primary prostate stroma resulted in significant phenotypic effects on human PrE organoids.
Inclusion of stroma facilitated the striking phenotype of increased branching and morphologic complexity in co-cultured organoids. Budding and branching in the developing prostate gland is mediated by the surrounding urogenital mesenchyme and precedes glandular function (Hayward et al., 1997). Organoid branching in vitro mimics the normal in vivo prostate acinar structure, thus providing an improved model of benign prostate. Branching rarely occurred in mono-culture, whereas the addition of stroma resulted in increased organoid branching that was visible subjectively and confirmed through objective quantification. In addition, the extent of branching varied by patient and highlights the in vitro preservation of inter-patient heterogeneity of primary prostate cells. This phenotype was not observed when non-prostate fibroblasts were used for co-culture, demonstrating that prostate stroma has unique regulatory control of the prostate epithelium. Organoids in both mono- and co-culture stained for markers indicating differentiation toward a luminal phenotype and expressed AR. However, PSA was not detected in the media and KLK3 expression was minimal, indicating that stroma was not able to overcome this limitation in in vitro prostate organoid models.
Our imaging and analysis pipeline expedited quantitative morphological analysis of branching observations and overcame limits in current imaging modalities to quantify 3D objects in 3D space. In doing so, we deployed a simple solution to achieve whole-well imaging and enhanced depth-of-field image compression. Our imaging and analysis pipeline provided complete and robust organoid morphology metrics, even with the limitation of quantifying 3D objects from 2D images. We observed cell-cell interactions that were apparent through extensive still and time-lapse imaging. Others have shown that cell-matrix interactions also influence fibroblasts in 3D culture; for example, the presence of pure collagen promotes fibroblast dynamics (Åkerfelt et al., 2015). Our study explored variations in Matrigel densities; however, the use of additional or combined matrices such as collagen or synthetic gels may further enhance both organoid and stromal phenotypes and allow fine-tuning of optimal co-culture conditions (Gjorevski et al., 2016).
One advantage of direct co-culture over a Transwell insert is direct stroma-organoid contact. Comparison of Transwell versus direct co-culture methods demonstrated that stromal induction of organoid branching was unique to direct co-culture. An intriguing observation is that direct stromal contact appeared to promote organoid branching exclusively on the distal side, whereas branching appeared random in mono-culture. These findings in mono-culture support the work of Hannezo et al. who recently theorized that epithelial organoid branching is a stochastic and self-organizing process (Hannezo et al., 2017). In co-culture, branching is likely driven by several paracrine factors including FGFs, BMPs, and WNTs that have been reported to influence prostate epithelium development (Prins and Putz, 2008). BMPs and FGFs influenced organoid morphology in our co-culture condition as inhibition of BMPs (by Noggin) or FGFR significantly decreased organoid branching. Noggin was highly expressed in the PrS cells (Ct value = 29) compared with non-prostate fibroblasts, but addition of Noggin alone did not recapitulate the branching phenotype. Noggin is often included in organoid culture medium (Karthaus et al., 2014), yet branching is not observed in those models. This may be explained by the non-specific perturbation of Noggin spatial gradients, differing from the normally tightly regulated balance of inhibitory and stimulatory proteins observed during branching morphogenesis (Prins and Putz, 2008). The aforementioned paracrine factors, as well as other juxtacrine factors, also likely contribute to the branching phenotype and warrant further study.
TGF-β1 is highly expressed in mouse mesenchyme during epithelial duct formation (Prins and Putz, 2008) and has been previously reported to inhibit branching morphogenesis in mammary tissue and prostate tissue (Hannezo et al., 2017, Silberstein and Daniel, 1987, Prins and Putz, 2008). Analysis of the TGF-β pathway in stromal cells cultured in our prostate model revealed high expression of TGF-ß1 and TGF-ß2. However, addition of a TGF-β-neutralizing antibody to co-culture did not significantly alter branching as the temporality of TGF-β regulation of branching morphogenesis is likely complex and should be explored further. The most highly expressed gene from qRT-PCR TGF-β profiling arrays was TGFBI, an extracellular-matrix-secreted factor recently reported to promote PCa growth and metastasis after androgen deprivation therapy (Chen et al., 2017). This mechanism could be investigated using our co-culture model.
In addition to supporting organized branching morphogenesis, prostate stroma had notable effects on organoid growth and viability. Current culture methods of prostate organoids derived from adult progenitor cells typically yield formation efficiencies <1% (Karthaus et al., 2014) and present a barrier to utilizing human-derived organoids in personalized medicine applications. Under our culture conditions of sparsely seeded epithelial cells, organoids in mono-culture had a formation efficiency ∼10%, which increased to >20% with the addition of stroma. Notably, organoid culture using our media and conditions had relatively high formation efficiencies despite containing few added supplements and lacking the ROCK inhibitor, in stark contrast to other specialized conditions with lower efficiencies (Drost et al., 2016). Moreover, employing patient stroma to further enhance the organoid take-rate may mitigate the current limitations of using patient tissue in ex vivo studies and provide an avenue for personalized medicine. Although stromal cells were viable, dividing cells were rare compared with epithelial cell divisions and relieves concerns of stromal overgrowth of the culture.
In our conditions, organoid formation efficiency was further enhanced by reducing the epithelial seeding density to 100 cells/well, which also promoted organoid growth, with organoids >1 mm in diameter and visible with the naked eye. A range of viable prostate organoid culture methods have been reported in the literature (Fang et al., 2013, Härmä et al., 2010, Iacopino et al., 2012), but the phenotypic consequences of cell seeding density have not been described. Differences in organoid size due to seeding density demonstrate that subtle alterations to culture conditions can alter organoid growth phenotypes and should be carefully controlled in experiments.
The generation of cancer organoids or “tumoroids” from localized cancer is a current limitation in the field, as primary human epithelial prostate cells isolated from cancer regions of tissue (PrECa) do not display cancer phenotypes (Peehl, 2004). Recently it was shown that tumoroids derived from PCa metastases and circulating tumor cells retain in vivo genomic alterations and morphology when grown in vitro and as patient-derived xenografts (Gao et al., 2014). To emphasize how this model may improve the generation of tumoroids in the future, we applied our co-culture model to PrE cells derived from localized cancer regions. Although genomic characterization of our organoids derived from cancer regions was not completed, there was a distinct preservation of AMACR expression that matched the patient cancer tissue and was only seen when organoids were co-cultured with stroma. Additionally, organoids derived from cancer regions were able to retain AMACR expression through two passages and further studies should assess AMACR retention in long-term co-culture. Together these findings highlight a promising future direction for tumoroid co-culture that could be pursued both for improved tumoroid viability and as an experimental tool.
Overall, we show that direct contact with prostate stroma induces organoid branching reminiscent of nascent epithelial morphogenesis and better recapitulates tissue structure. Incorporation of prostate stroma is essential to accurately model both the prostate and PCa disease in vitro and provides the field with a valuable culture model for studying stromal-epithelial cross talk in development and disease.
Limitations of the Study
There are a few limitations to consider pertaining to this study, particularly in regard to the low number of passages used to explore the maintenance of AMACR expression (Figures 5C and S5). As mentioned in the discussion, future studies may focus on the number of passages for which the organoids derived from cancer regions can be maintained. Full genomic, transcriptomic, and phenotypic validation of the cancer organoids is also warranted.
Methods
All methods can be found in the accompanying Transparent Methods supplemental file.
Acknowledgments
We thank the UIC Biorespository members, Dr. Klara Valyi-Nagy and Alex Susma, and the urologists, Drs. Michael Abern, Daniel Moreira, and Simone Crivallero, for facilitation of the tissue acquisition for the primary cell cultures. We thank the UIC Urology patients for donating their tissue to research. We thank Ke Ma at the UIC Fluorescence Imaging Core for assisting with confocal. We thank Manny Alonso and Maria Sverdlov at the UIC Histology and Tissue Imaging Core for assisting with AMACR staining. We thank Julian Pachecho for his help with Celleste™ analysis. This work was funded, in part, by the Department of Defense Prostate Cancer Research Program Health Disparities Idea Award PC121923 (Nonn) and the UIC Center for Clinical and Translation Science Pre-doctoral Education for Clinical and Translational Scientists (PECTS) Program (Richards, McCray) and by the National Institutes of Health’s National Cancer Institute, grant numbers U54CA202995, U54CA202997, and U54CA203000, known as the Chicago Health Equity Collaborative (L.N., A.B.M., M.M., C.V., and S.A.A.). The content is solely the responsibility of the authors and does not necessarily represent the official views of the National Institutes of Health or the Department of Defense.
Author Contributions
Conceptualization, Z.R., G.S.P., S.A.A., and L.N.; Methodology, Z.R., J.M., and T.M.; Investigation, Z.R., J.M., T.M., J.T.M., J.G., and M.L.Z.; Resources, L.N.; Writing – original draft, Z.R. and L.N.; Writing – Review and editing, T.M., Z.R., L.N., C.V., S.A.A., G.S.P., A.B.M.; Visualization, Z.R., and J.M.; Supervision, L.N., G.S.P., C.V., A.B.M., S.A.A.; Funding acquisition, L.N., C.V., S.A.A., A.B.M, M.M.
Declaration of Interests
The authors declare no competing interests.
Published: February 22, 2019
Footnotes
Supplemental Information includes Transparent Methods, 6 figures, and 10 videos and can be found with this article online at https://doi.org/10.1016/j.isci.2019.01.028.
Supporting Citations
The following reference appears in the Supplemental Information: Livak and Schmittgen, 2001.
Supplemental Information
References
- Åkerfelt M., Bayramoglu N., Robinson S., Toriseva M., Schukov H.-P., Härmä V., Virtanen J., Sormunen R., Kaakinen M., Kannala J. Automated tracking of tumor-stroma morphology in microtissues identifies functional targets within the tumor microenvironment for therapeutic intervention. Oncotarget. 2015;6:30035–30056. doi: 10.18632/oncotarget.5046. [DOI] [PMC free article] [PubMed] [Google Scholar]
- Ananthanarayanan V., Deaton R.J., Yang X.J., Pins M.R., Gann P.H. Alpha-methylacyl-CoA racemase (AMACR) expression in normal prostatic glands and high-grade prostatic intraepithelial neoplasia (HGPIN): association with diagnosis of prostate cancer. Prostate. 2005;63:341–346. doi: 10.1002/pros.20196. [DOI] [PubMed] [Google Scholar]
- Barron D.A., Rowley D.R. The reactive stroma microenvironment and prostate cancer progression. Endocr. Relat. Cancer. 2012;19:R187–R204. doi: 10.1530/ERC-12-0085. [DOI] [PMC free article] [PubMed] [Google Scholar]
- Chen W.-Y., Tsai Y.-C., Yeh H.-L., Suau F., Jiang K.-C., Shao A.-N., Huang J., Liu Y.-N. Loss of SPDEF and gain of TGFBI activity after androgen deprivation therapy promote EMT and bone metastasis of prostate cancer. Sci. Signal. 2017;10:1–10. doi: 10.1126/scisignal.aam6826. [DOI] [PubMed] [Google Scholar]
- Chua C.W., Shibata M., Lei M., Toivanen R., Barlow L.J., Bergren S.K., Badani K.K., McKiernan J.M., Benson M.C., Hibshoosh H. Single luminal epithelial progenitors can generate prostate organoids in culture. Nat. Cell Biol. 2014;16:951–961. doi: 10.1038/ncb3047. [DOI] [PMC free article] [PubMed] [Google Scholar]
- Cunha G.R., Chung L.W.K. Stromal-epithelial interactions—I. Induction of prostatic phenotype in urothelium of testicular feminized (Tfm/y) mice. J. Steroid Biochem. 1981;14:1317–1324. doi: 10.1016/0022-4731(81)90338-1. [DOI] [PubMed] [Google Scholar]
- Drost J., Karthaus W.R., Gao D., Driehuis E., Sawyers C.L., Chen Y., Clevers H. Organoid culture systems for prostate epithelial and cancer tissue. Nat. Protoc. 2016;11:347–358. doi: 10.1038/nprot.2016.006. [DOI] [PMC free article] [PubMed] [Google Scholar]
- Fang X., Sittadjody S., Gyabaah K., Opara E.C., Balaji K.C. Novel 3D co-culture model for epithelial-stromal cells interaction in prostate cancer. PLoS One. 2013;8:e75187. doi: 10.1371/journal.pone.0075187. [DOI] [PMC free article] [PubMed] [Google Scholar]
- Farnsworth W.E. Prostate stroma: physiology. Prostate. 1999;38:60–72. doi: 10.1002/(sici)1097-0045(19990101)38:1<60::aid-pros8>3.0.co;2-3. [DOI] [PubMed] [Google Scholar]
- Franco O.E., Shaw A.K., Strand D.W., Hayward S.W. Cancer associated fibroblasts in cancer pathogenesis. Semin. Cell Dev. Biol. 2010;21:33–39. doi: 10.1016/j.semcdb.2009.10.010. [DOI] [PMC free article] [PubMed] [Google Scholar]
- Franco O.E., Jiang M., Strand D.W., Peacock J., Fernandez S., Jackson R.S., Revelo M.P., Bhowmick N.A., Hayward S.W. Altered TGF-β signaling in a subpopulation of human stromal cells promotes prostatic carcinogenesis. Cancer Res. 2011;71:1272–1281. doi: 10.1158/0008-5472.CAN-10-3142. [DOI] [PMC free article] [PubMed] [Google Scholar]
- Gao D., Vela I., Sboner A., Iaquinta P.J.J., Karthaus W.R.R., Gopalan A., Dowling C., Wanjala J.N.N., Undvall E.A.A., Arora V.K.K. Organoid cultures derived from patients with advanced prostate cancer. Cell. 2014;159:176–187. doi: 10.1016/j.cell.2014.08.016. [DOI] [PMC free article] [PubMed] [Google Scholar]
- Garraway I.P., Sun W., Tran C.P., Perner S., Zhang B., Goldstein A.S., Hahm S.A., Haider M., Head C.S., Reiter R.E. Human prostate sphere-forming cells represent a subset of basal epithelial cells capable of glandular regeneration in vivo. Prostate. 2010;70:491–501. doi: 10.1002/pros.21083. [DOI] [PMC free article] [PubMed] [Google Scholar]
- Giangreco A.A., Vaishnav A., Wagner D., Finelli A., Fleshner N., Van der Kwast T., Vieth R., Nonn L. Tumor suppressor microRNAs, miR-100 and -125b, are regulated by 1,25-dihydroxyvitamin D in primary prostate cells and in patient tissue. Cancer Prev. Res. (Phila.) 2013;6:483–494. doi: 10.1158/1940-6207.CAPR-12-0253. [DOI] [PMC free article] [PubMed] [Google Scholar]
- Giangreco A.A., Dambal S., Wagner D., Van der Kwast T., Vieth R., Prins G.S., Nonn L. Differential expression and regulation of vitamin D hydroxylases and inflammatory genes in prostate stroma and epithelium by 1,25-dihydroxyvitamin D in men with prostate cancer and an in vitro model. J. Steroid Biochem. Mol. Biol. 2015;148:156–165. doi: 10.1016/j.jsbmb.2014.10.004. [DOI] [PMC free article] [PubMed] [Google Scholar]
- Gjorevski N., Sachs N., Manfrin A., Giger S., Bragina M.E., Ordóñez-Morán P., Clevers H., Lutolf M.P. Designer matrices for intestinal stem cell and organoid culture. Nature. 2016;539:560–564. doi: 10.1038/nature20168. [DOI] [PubMed] [Google Scholar]
- Hannezo E., Scheele C.L.G.J., Moad M., Drogo N., Heer R., Sampogna R.V., van Rheenen J., Simons B.D. A unifying theory of branching morphogenesis. Cell. 2017;171:242–255.e27. doi: 10.1016/j.cell.2017.08.026. [DOI] [PMC free article] [PubMed] [Google Scholar]
- Härmä V., Virtanen J., Mäkelä R., Happonen A., Mpindi J.P., Knuuttila M., Kohonen P., Lötjönen J., Kallioniemi O., Nees M. A comprehensive panel of three-dimensional models for studies of prostate cancer growth, invasion and drug responses. PLoS One. 2010;5:e10431. doi: 10.1371/journal.pone.0010431. [DOI] [PMC free article] [PubMed] [Google Scholar]
- Hayward S.W., Rosen M.A., Cunha G.R. Stromal-epithelial interactions in the normal and neoplastic prostate. Br. J. Urol. 1997;79(Suppl 2):18–26. doi: 10.1111/j.1464-410x.1997.tb16917.x. [DOI] [PubMed] [Google Scholar]
- Iacopino F., Angelucci C., Sica G. Interactions between normal human fibroblasts and human prostate cancer cells in a co-culture system. Anticancer Res. 2012;32:1579–1588. [PubMed] [Google Scholar]
- Jiang Z., Woda B.A., Wu C.-L., Yang X.J. Discovery and clinical application of a novel prostate cancer marker: alpha-methylacyl CoA racemase (P504S) Am. J. Clin. Pathol. 2004;122:275–289. doi: 10.1309/EJUY-UQPE-X1MG-68MK. [DOI] [PubMed] [Google Scholar]
- Karthaus W.R., Iaquinta P.J., Drost J., Gracanin A., van Boxtel R., Wongvipat J., Dowling C.M., Gao D., Begthel H., Sachs N. Identification of multipotent luminal progenitor cells in human prostate organoid cultures. Cell. 2014;159:163–175. doi: 10.1016/j.cell.2014.08.017. [DOI] [PMC free article] [PubMed] [Google Scholar]
- Kretzschmar K., Clevers H. Organoids: modeling development and the stem cell Niche in a dish. Dev. Cell. 2016;38:590–600. doi: 10.1016/j.devcel.2016.08.014. [DOI] [PubMed] [Google Scholar]
- Lang S.H., Stark M., Collins A., Paul A.B., Stower M.J., Maitland N.J. Experimental prostate epithelial morphogenesis in response to stroma and three-dimensional matrigel culture. Cell Growth Differ. 2001;12:631–640. [PubMed] [Google Scholar]
- Liao C.-P.C.-P., Adisetiyo H., Liang M., Roy-Burman P. Cancer-associated fibroblasts enhance the gland-forming capability of prostate cancer stem cells. Cancer Res. 2010;70:7294–7303. doi: 10.1158/0008-5472.CAN-09-3982. [DOI] [PMC free article] [PubMed] [Google Scholar]
- Livak K.J., Schmittgen T.D. Analysis of relative gene expression data using real-time quantitative PCR and the 2−ΔΔCT method. Methods. 2001;25:402–408. doi: 10.1006/meth.2001.1262. [DOI] [PubMed] [Google Scholar]
- Niu Y.-N., Xia S.-J. Stroma-epithelium crosstalk in prostate cancer. Asian J. Androl. 2009;11:28–35. doi: 10.1038/aja.2008.39. [DOI] [PMC free article] [PubMed] [Google Scholar]
- Nonn L., Peng L., Feldman D., Peehl D.M. Inhibition of p38 by vitamin D reduces interleukin-6 production in normal prostate cells via mitogen-activated protein kinase phosphatase 5: implications for prostate cancer prevention by vitamin D. Cancer Res. 2006;66:4516–4524. doi: 10.1158/0008-5472.CAN-05-3796. [DOI] [PubMed] [Google Scholar]
- Peehl D.M. Are primary cultures realistic models of prostate cancer? J. Cell. Biochem. 2004;91:185–195. doi: 10.1002/jcb.10691. [DOI] [PubMed] [Google Scholar]
- Prins G.S., Putz O. Molecular signaling pathways that regulate prostate gland development. Differentiation. 2008;76:641–659. doi: 10.1111/j.1432-0436.2008.00277.x. [DOI] [PMC free article] [PubMed] [Google Scholar]
- Rubin M.A., Zhou M., Dhanasekaran S.M., Varambally S., Barrette T.R., Sanda M.G., Pienta K.J., Ghosh D., Chinnaiyan A.M. alpha-Methylacyl coenzyme A racemase as a tissue biomarker for prostate cancer. JAMA. 2002;287:1662–1670. doi: 10.1001/jama.287.13.1662. [DOI] [PubMed] [Google Scholar]
- Sasaki T., Franco O.E., Hayward S.W. Interaction of prostate carcinoma-associated fibroblasts with human epithelial cell lines in vivo. Differentiation. 2017;96:40–48. doi: 10.1016/j.diff.2017.07.002. [DOI] [PMC free article] [PubMed] [Google Scholar]
- Silberstein G.B., Daniel C.W. Reversible inhibition of mammary gland growth by transforming growth factor-beta. Science. 1987;237:291–293. doi: 10.1126/science.3474783. [DOI] [PubMed] [Google Scholar]
- Wang S., Gao D., Chen Y. The potential of organoids in urological cancer research. Nat. Rev. Urol. 2017;14:401–414. doi: 10.1038/nrurol.2017.65. [DOI] [PMC free article] [PubMed] [Google Scholar]
Associated Data
This section collects any data citations, data availability statements, or supplementary materials included in this article.
Supplementary Materials
Cells used, PrE-1 and PrS mix 1.All movies are composed of time-lapse images taken every 5 min. Time format, hour:min.
Cells used, PrE-1.
Cells used, PrE-1 and PrS mix 1.
Cells used, PrE-1 and PrS mix 1.
Subsequent Bud Formation and Elongation Occurred Distal to Stroma-Organoid Contact. Cells used, PrE-1 and PrS mix 1.
Complex Stalk Elongation Occurred Distal to Stroma-Organoid Contact. Cells used, PrE-1 and PrS mix 1.
Bud Detachment Occurred after 29 h (Top of Organoid), and Stalk Detachment at 31 h (Top of Frame). Cells used, PrE-1 and PrS mix 1.
Cells used, PrE-1 and PrS mix 3.
Cells used, PrE-1 and PrS mix 1.
Extensive Cell-Cell Contact and Encapsulation of Organoids Inhibited Branching. Cells used, PrE-1.