Abstract
Hydrogen sulfide (H2S) is an endogenously synthesized signaling molecule that is enzymatically metabolized in mitochondria. The metabolism of H2S maintains optimal concentrations of the gasotransmitter and produces sulfane sulfur (S0)-containing metabolites that may be functionally important in signaling. Sulfide:quinone oxidoreductase (SQOR) catalyzes the initial 2-electron oxidation of H2S to S0 using coenzyme Q as electron acceptor in a reaction that requires a third substrate to act as the acceptor of S0. We discovered that sulfite is a highly efficient acceptor and proposed that sulfite is the physiological acceptor in a reaction that produces thiosulfate, a known metabolic intermediate. This model has been challenged by others who assume that the intracellular concentration of sulfite is very low, a scenario postulated to favor reaction of SQOR with a considerably poorer acceptor, glutathione. In this study, we measured the intracellular concentration of sulfite and other metabolites in mammalian tissues. The values observed for sulfite in rat liver (9.2 μM) and heart (38 μM) are orders of magnitude higher than previously assumed. We discovered that the apparent kinetics of H2S oxidation by SQOR with glutathione as S0 acceptor reflect contributions from other SQOR-catalyzed reactions, including a novel glutathione:CoQ reductase reaction. We used observed metabolite levels and steady-state kinetic parameters to simulate rates of H2S oxidation by SQOR at physiological concentrations of different S0 acceptors. The results show that the reaction with sulfite as S0 acceptor is a major pathway in liver and heart and provide insight into the potential dynamics of H2S metabolism.
Graphical Abstract
Over the past 15 years the endogenous gaseous transmitter hydrogen sulfide (H2S) has become recognized as a crucial signaling molecule, especially in the cardiovascular system. Recent studies report that H2S is a key regulator of blood pressure, protects against the development of atherosclerosis, and plays an important role in cardiac protection during infarction, ischemia, and heart failure3–11. H2S also acts as a neuromodulator/neuroprotectant and an oxygen sensor, can induce hibernation-like states in mice, and has been implicated in longevity extension12–16. The mechanism of H2S signaling is not fully understood but is known to involve protein sulfhydration, a covalent modification in which cysteine is converted to a persulfide derivative (CysSS−)17–21. Cysteine persulfide may be produced by reaction of H2S with oxidized protein thiols, such as CysSOH, CysSSR, or CysSNO. Sulfhydration of unmodified cysteine residues is incompatible with the sulfur oxidation state in H2S (−2) but may be achieved by reaction with metabolites containing sulfur at the −1 oxidation state, such as the sulfane sulfur (underlined) in thiosulfate (SSO3−2) or glutathione persulfide (GSS−).
H2S is a member of a small family of gasotransmitters that includes nitric oxide and carbon monoxide, all of which are synthesized endogenously in mammals. H2S is the only gasotransmitter that is enzymatically metabolized and the only inorganic compound that can be used by mammalian mitochondria to generate ATP22. The mitochondrial metabolism of H2S plays a critical role in maintaining optimal concentrations of the gasotransmitter and also produces sulfane sulfur-containing metabolites, which may be functionally important in signaling. Sulfate is the major product of H2S oxidation by liver and isolated liver mitochondria that have been supplemented with glutathione23. Studies with perfused liver and primary hepatocytes provide compelling evidence that thiosulfate is an intermediate in the formation of sulfate23, 24. Sulfate formation requires glutathione and is not observed with heptatocytes that have been depleted of glutathione or with untreated mitochondria. Instead, glutathione-deficient liver cells and isolated mitochondria oxidize H2S to thiosulfate23–25. Unlike liver, thiosulfate is the major product of H2S oxidation by colonic mucosa, a tissue that detoxifies large quantities of H2S that are produced by sulfate-reducing bacteria in the colon26.
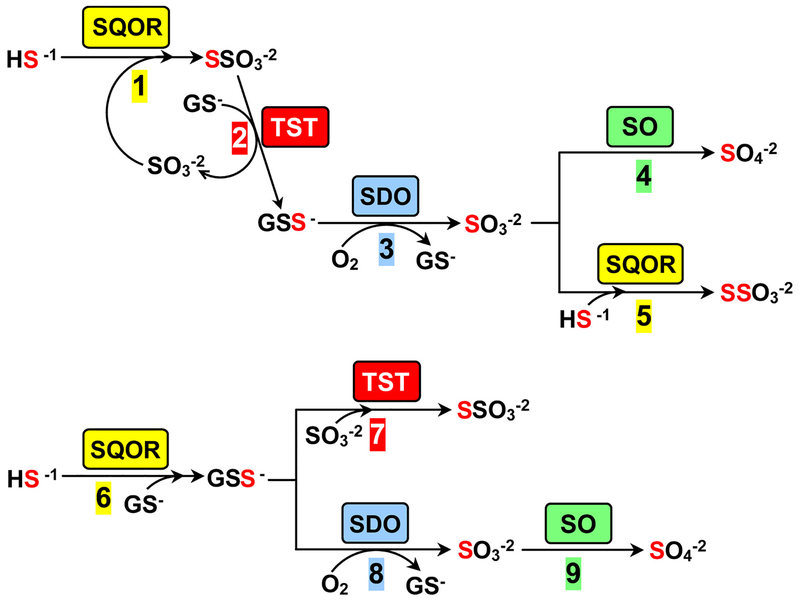
Although alternate models have been proposed, it is generally agreed that the first step in H2S metabolism is performed by sulfide:quinone oxidoreductase (SQOR), an inner mitochondrial membrane-bound flavoenzyme. SQOR catalyzes a 2-electron oxidation of H2S to sulfane sulfur using coenzyme Q (CoQ) as electron acceptor in a reaction that proceeds via a cysteine persulfide intermediate (E-CysSS−)25, 27. A third substrate is required to act as the acceptor of the sulfane sulfur from E-CysSS−. We discovered that sulfite is a highly efficient acceptor (kcat/Km sulfite = 2.1 × 10⁶ M−1 s−1) and proposed that the nucleophile is the physiological sulfane sulfur acceptor in a reaction that produces thiosulfate (Scheme 1, step 1)27. A glutathione-dependent thiosulfate sulfurtransferase (TST) is likely to mediate the subsequent transfer of the sulfane sulfur from thiosulfate to glutathione in a reaction (step 2) that produces glutathione persulfide (GSS−) and regenerates the sulfite consumed in step 128. TST activity is readily detected in Caenorhabditis elegans, HepG2 cells, and rat liver slices where mitochondrial production of sulfite from thiosulfate and glutathione is observed in a reaction that can be blocked by inactivation of TST29, 30. Two human genes (TSTD1 and TST) are known to encode enzymes (TSTD1 and rhodanese, respectivly) that exhibit TST activity, as judged by properties observed with the recombinant proteins1, 28. Proteomic studies indicate that rhodanese is the predominant TST expressed in human liver31, a finding recently confirmed by the absence of detectable TST activity in liver extracts from TST−/− knockout mice32. In the next step, the sulfane sulfur in GSS− undergoes a 4-electron oxidation, catalyzed by sulfur dioxygenase (SDO), to produce sulfite (step 3). SDO is defective in ethylmalonic encephalopathy, an autosomal recessive disease that results in extremely elevated levels of H2S and death within the first decade of life33, 34. In liver, the pathway terminates in the 2-electron oxidation of sulfite to sulfate, a reaction catalyzed by sulfite oxidase (SO)35 (step 4). The pathway in colon terminates with the SQOR-catalyzed conversion of sulfite to thiosulfate (step 5) and achieves an overall 8-electron oxidation of 2 mol of H2S to 1 mol of thiosulfate. The proposed pathway is consistent with the stoichiometry of oxygen consumption observed for H2S oxidation to thiosulfate by isolated mitochondria25. SQOR and SO exhibit similar efficiencies for sulfite utilization (kcat/Km,sulfite = 2.1 × 10⁶ and 4.68 × 10⁶ M−1 s−1, respectively)27, 35. Elevated urinary excretion of thiosulfate is observed under pathological conditions that result in abnormally high levels of H2S levels (e.g., genetic deficiency of SDO or cysteine dioxygenase, Down’s syndrome, environmental H2S gas exposure)34, 36–38. The results suggest that H2S levels may play a key role in the partitioning of sulfite between the competing reactions catalyzed by SQOR and SO.
Scheme 1.
Two models for mammalian metabolism of H2S. In the model proposed by Jorns and coworkers (steps 1–5) sulfite acts as the sulfane sulfur acceptor in the SQOR reaction27,28. In an alternate model proposed by Libiad et al. (steps 6–9) glutathione is the acceptor in the SQOR reaction1. Steps 2 and 7 correspond to the forward and reverse directions, respectively, of the reversible TST reaction. SQOR, sulfide:quinone oxidoreductase; TST, thiosulfate sulfurtransferase; SDO, sulfur dioxygenase; SO, sulfite oxidase.
Libiad et al. proposed an alternate pathway for H2S metabolism based on the assumption that the intracellular concentration of sulfite is very low, a scenario postulated to favor reaction of SQOR with glutathione, a considerably poorer acceptor, to produce GSS− (Scheme 1, step 6)1. The sulfane sulfur in GSS− is subsequently converted to sulfate via successive reactions catalyzed by SDO and SO (steps 8 and 9, respectively). This alternate model for H2S metabolism appears to be inconsistent with studies which show that thiosulfate is formed as an intermediate in the oxidation of H2S to sulfate23, 24. Instead, Libiad et al. propose that thiosulfate is formed in a dead-end reaction catalyzed by TST (rhodanese) that consumes both the substrate (GSS−) and product (sulfite) of the SDO reaction (step 7)39 and is apparently unconstrained by the assumed low intracellular sulfite concentration.
To our knowledge, the concentration of sulfite in mammalian tissues has not previously been reported. In this study, we measured the intracellular concentration of sulfite and other sulfur metabolites in rat liver and heart, metabolically active organs that exhibit high rates of H2S oxidation40. The values observed for sulfite are orders of magnitude higher than previously assumed by Libiad et al.1. We also investigated the kinetics of H2S oxidation by SQOR in the presence of glutathione and a water-soluble coenzyme Q derivative (CoQ1). We found that the observed rate of CoQ1 reduction reflects contributions from three reactions, only one of which is attributable to the reaction with glutathione acting as the sulfane sulfur acceptor. The observed metabolite levels and steady-state kinetic parameters have been used to simulate rates of H2S oxidation by SQOR at physiological concentrations of different sulfane sulfur acceptors. The results show that the SQOR reaction with sulfite as acceptor is a major pathway in liver and heart and also provide insight into the potential dynamics of H2S metabolism.
EXPERIMENTAL PROCEDURES
Materials.
Diethylenetriamine pentaacetic acid (DTPA) was purchased from Acros. Acetonitrile (HPLC grade), trifluoroacetic acid (TFA), sodium dodecyl sulfate (SDS), methanesulfonic acid (MSA), monobromobimane (MBB), L-cysteine, L-glutathione (reduced), and CoQ1 were obtained from Sigma Aldrich. Sodium sulfite was purchased from Fluka Chemika. Sodium sulfide was obtained from Alfa Aesar. Stock solutions of monobromobimane were prepared in argon-purged acetonitrile and protected from light.
Measurement of Sulfite, Glutathione and Cysteine Levels in Rat Liver and Heart.
Liver and heart tissue from non-fasted, male Wistar Hanover rats (240–260 g) were supplied by Charles River. Animals anesthetized with isoflurane were euthanized by exsanguination (cardiac puncture) to remove as much blood as possible. Organs were immediately collected, snap-frozen in liquid nitrogen, and stored at −80 °C. Frozen tissue was ground to a fine powder by using a liquid nitrogen-cooled porcelain pestle and a steel mortar (Bel-Art™: 372600001), which was suspended above a steel bowl that contained liquid nitrogen and was nested in a insulated polyethylene housing (Bel-Art™: H372600100). Ground tissue was stored in cryogenic vials at −80 °C. An aliquot of tissue powder (~0.5 g) was weighed in a tared, cooled eppendorf tube and then quantitatively transferred to a 2 mL volumetric flask, which was filled to volume with argon-purged 1.0 mM borate buffer, pH 8.0, containing 0.1 mM DTPA and 0.5% SDS. The tube contents were mixed by inversion and then spin-clarified by centrifuging for 15 min at 5000 g in a Vivaspin Turbo 15 centrifuge tube (Sartorius: VS15T22, 30,000 MWCO polyethersulfone membrane). Metabolite analyses were performed using the clarified tissue extract in the flow filtrate.
Bimane derivatives of sulfur metabolites were prepared by reaction of tissue extracts with monobromobimane and analyzed by reversed phase HPLC coupled with fluorescence detection, similar to that previously described41, 42. Analyses were conducted using extracts from matched-sets of liver and heart tissue (L1/H1, L2/H2, L3/H3, L4/H4) from four individual animals. Values for each tissue were determined by combining results from an average of 5 replicate determinations. Briefly, an aliquot of the clarified tissue extract was reacted in the dark at room temperature for 30 min with 16.7 mM monobromobimane in 2:1 mixture of buffer (1.0 mM borate, pH 8.0, containing 0.1 mM DTPA and 0.5% SDS) and acetonitrile. The reactions were then quenched with 50 mM MSA. Sulfite, glutathione and cysteine bimane derivatives are stable during storage of the quenched samples at 0 °C or −80 °C for up to 12 h or 24 h, respectively. HPLC analyses were conducted using an AcuFlow Series IV pump HPLC system and mixer connected to a Gilson model 121 fluorometer (1V AUX output) with single line sample feed. The HPLC system was equipped with three columns, used in tandem: ZORBAX Eclipse Plus C18 reversed-phase guard column (5 μm, 4.6 × 50 mm; Agilent Technologies 959946–902), ZORBAX Eclipse Plus C18 reversed-phase column (3.5 μm, 4.6 × 150 mm; Agilent Technologies 959963–902), and ZORBAX Eclipse Plus C8 guard column reversed-phase (3.5 μm, 4.6 × 50 mm; Agilent Technologies 959943–906). The columns were pre-equilibrated with solvent A (85% H2O: 15% acetonitrile + 0.1% TFA), prior to injection of 25 μL aliquots of derivatized tissue samples, and then subjected to the following elution profile (flow rate= 0.7 mL/min): 30 min linear gradient to 100% solvent B (60% H2O: 40% acetonitrile + 0.1% TFA); 2 min isocratic elution with solvent B; 2 min linear gradient to 100% solvent A. The column eluate was monitored by its fluorescence using band-pass filters (λexcite, 305 – 395 nm; λemit, 430 – 470 nm). The fluorescence was digitally recorded by a PeakSimple Chromatography Data System SRI model 302 in conjunction with PeakSimple software. To prepare calibration standards, stock solutions of sodium sulfite, cysteine and glutathione were diluted to desired concentrations and derivatized to make standard solutions containing 0.1 – 12.0 μM sulfite bimane, 0.75 −12 μM cysteine bimane, or 0.75 −12 μM glutathione bimane. Linear regression analysis of calibration graphs, obtained for 25 μL injections of standard solutions, were used to determine the following limits of detection for bimane derivatives of sulfite, glutathione and cysteine: 0.50, 0.64 and 1.46 μM, respectively.
Steady-state Kinetic Analysis.
Recombinant human SQOR was prepared similar to that previously described27. Assays were conducted in 100 mM potassium phosphate buffer, pH 7.5, containing 0.0036% Tween20 and 90 μM EDTA at 25 °C. Cuvettes containing buffer and CoQ1 were incubated at 25 °C for 2 min. An aliquot of SQOR was added, followed immediately by the sequential addition of sulfide and glutathione, as indicated. Reaction rates were determined by monitoring the reduction of CoQ1 at 278 nm (Δεox-red = 12000 M−1 cm−1)27. As will be described, SQOR catalyzes a glutathione-dependent reduction of CoQ1 in the absence of sulfide. The observed rate of this glutathione:CoQ1 reductase reaction was corrected for the blank reaction observed in the absence of enzyme. The rate observed for SQOR reactions in the presence of glutathione and sulfide are corrected for the: (i) glutathione:CoQ1 reductase reaction; (ii) nonenzymic reaction observed with CoQ1, and glutathione; (iii) nonenzymic reaction observed with CoQ1 and sulfide. The combined rate of reactions (i) and (ii) is provided by the uncorrected rate of glutathione:CoQ1 reductase reaction.
Spectroscopy.
All spectra were recorded using an Agilent Technologies 8453 diode array spectrophotometer. The spectral course of the reaction of human SQOR with glutathione was monitored under anaerobic conditions at 7 °C using screw-cap cuvettes. The samples were made anaerobic using a sarcosine/monomeric sarcosine oxidase system, as previously described27.
Simulated Rates of SQOR Reactions with Different Sulfane Sulfur Acceptors.
Simulated rates for reactions with sulfite, glutathione or cysteine as the sulfane sulfur acceptor were calculated using an equation for an ordered sequential mechanism (eq. 1a, A = H2S, B =acceptor), assuming that KdA ≈ KmA. Simulated traces were generated using observed
| (1a) |
concentrations of sulfite, glutathione and cysteine in rat liver and heart and observed steady-state kinetic parameters, except that the same Km value for H2S (13 μM) was used with sulfite or glutathione because the observed values with these sulfane sulfur acceptors are essentially identical, given the error in the measurements (see Table 2). To simulate the reaction with an acceptor B in the presence of an alternate acceptor C, a competitive term was added to the steady-state equation where KiC is assumed to be equal to KmC (eq. 1b).
Table 2.
Steady-state kinetic parameters for H2S oxidation with various sulfane sulfur acceptors
| (1b) |
RESULTS AND DISCUSSION
Analysis of Sulfite, Glutathione and Cysteine Levels in Rat Liver and Heart.
Various measures were taken to prevent post-harvest changes in rat tissue metabolites. Firstly, organs were collected immediately after sacrificing the animal by exsanguination and snap-frozen in liquid nitrogen. Frozen tissues were ground to a fine powder using a liquid nitrogen-cooled mortar and pestle. Metabolites were extracted from a measured (wet) weight of tissue powder using argon-purged buffer containing DTPA to chelate trace metals and thus minimize loss due to oxidation, and SDS to denature proteins and prevent enzymatic degradation. Fluorescent bimane derivatives of sulfur metabolites in tissue extracts or in solutions of known calibration standards were prepared by reaction with monobromobimane, similar to that previously described41, 42. Tissue analyses were conducted using extracts from matched-sets of liver and heart tissue from four individual animals (L1/H1, L2/H2, L3/H3, L4/H4).
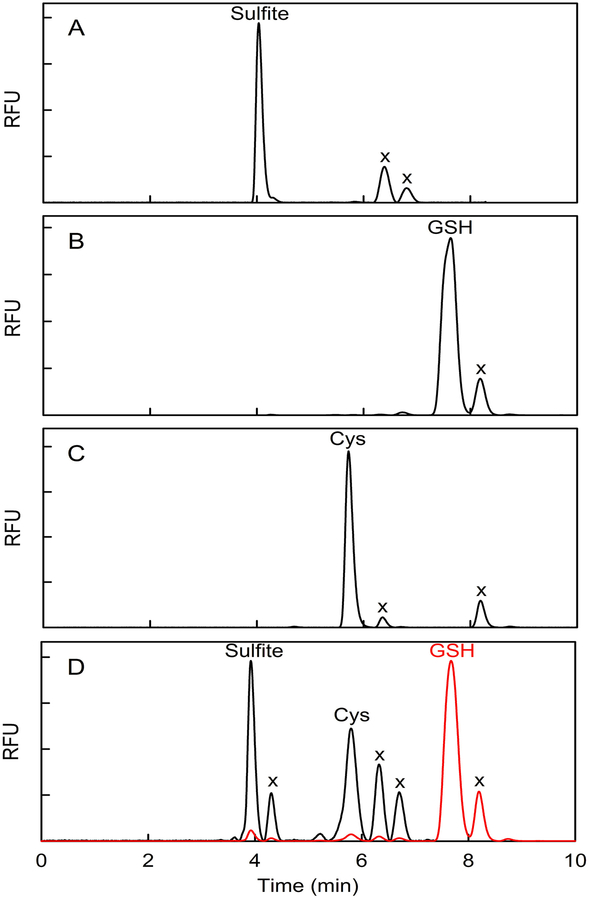
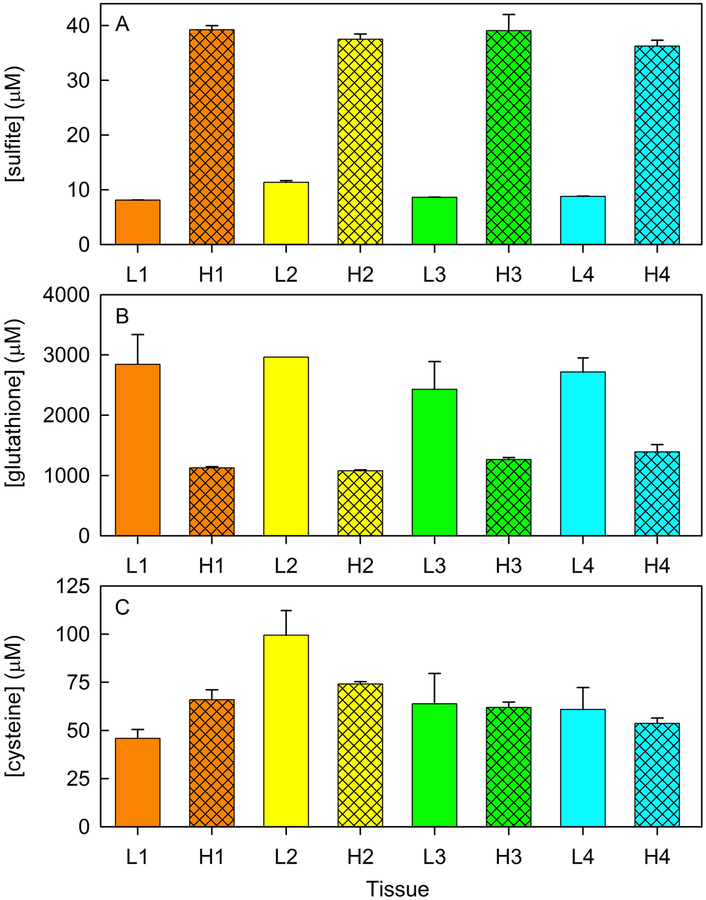
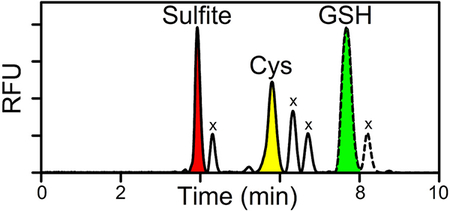
Reversed phase HPLC analysis produced a baseline separation of sulfite bimane, glutathione bimane, and cysteine bimane standards (Figure 1A, B, C). All three sulfur metabolites are readily detected in tissue extracts, as illustrated by a chromatogram obtained with H1 (Figure 1D). Values for the levels of sulfite, glutathione and cysteine (μmol/kg of wet tissue) in each rat heart or liver sample were determined by combining results from ~5 replicate determinations (Figure 2). Control studies were conducted to evaluate the efficacy of measures taken to prevent possible loss of sulfite, a metabolite that has not previously been measured in mammalian tissues. Nearly quantitative recovery of exogenous sulfite (90 %) was observed when known amounts were added at levels comparable to the endogenous levels of the metabolite in rat heart or liver.
Figure 1.
HPLC elution profiles obtained with known bimane derivatives or observed for a tissue extract derivatized with monobromobimane. A) sulfite bimane; B) glutathione bimane; C) cysteine bimane; D) heart extract. Similar results for bimane standards are obtained when the derivatives are prepared by reaction of monobromobimane with a mixture of sulfite, cysteine, and glutathione (Figure S1). RFU, relative fluorescence units; x, reagent-derived peaks. The red trace in panel D is plotted according to a 17-fold less sensitive RFU scale compared with the black trace which shows the elution profile from 0 to 7.35 min, a region that includes a reagent-derived peak at 4.30 min due to the presence of SDS in the tissue extraction buffer. SDS does not otherwise affect the elution profile, as judged by control studies with bimane standards (data not shown).
Figure 2.
Tissues levels of sulfite (panel A), glutathione (panel B) and cysteine (panel C) in matched-sets of rat liver and heart (L1/H1, L2/H2, L3/H3, L4/H4) from four individual animals. Values for each tissue (μmol/kg of wet tissue) were determined by combining results from an average of 5 replicate determinations.
The average concentration of sulfite observed for four rat hearts (38 ± 1 μM) is 4-fold higher than observed for livers from the same group of animals (9.2 ± 0.1 μM) (Table 1). The results provide the first estimates of the intracellular concentration of this key sulfur metabolite in mammalian tissues. The observed levels are about two orders of magnitude higher than a concentration previously assumed by Libiad et al.1. Values obtained for the concentration of glutathione (2700 ± 300 μM) and cysteine (68 ± 11 μM) in rat liver (Table 1) are in good agreement with previously reported results (4510 ± 270 μM and 20 – 100 μM, respectively)43, 44.
Table 1.
Concentration of sulfite, glutathione, and cysteine in rat tissue
| metabolite | concentrationa | |
|---|---|---|
| liver | heart | |
| sulfite | 9.2 ± 0.1 | 38 ± 1 |
| glutathione | 2700 ± 300 | 1330± 50 |
| cysteine | 68 ± 11 | 64 ± 3 |
Values correspond to the mean ± standard error of the mean in μmol/kg of wet tissue, obtained for matched sets of liver and heart from four individual animals.
SQOR Exhibits Glutathione:CoQ Reductase Activity.
As will be shown, the kinetics of H2S oxidation by SQOR, as measured by the rate of CoQ1 reduction in the presence of glutathione, reflect contributions from three reactions, only one of which is due to the reaction with glutathione acting as the sulfane sulfur acceptor (see eq. 4). Firstly, we have previously shown that SQOR catalyzes the oxidation of H2S to hydrogen disulfide (H2S2)27, a reaction in which H2S acts as both electron donor and sulfane sulfur acceptor (eq. 2)a. Secondly, we have discovered that SQOR catalyzes an analogous reaction with glutathione (eq. 3), consistent with the ability of glutathione to act as a reductant or a nucleophile. The glutathione:CoQ reductase
| (2) |
| (3) |
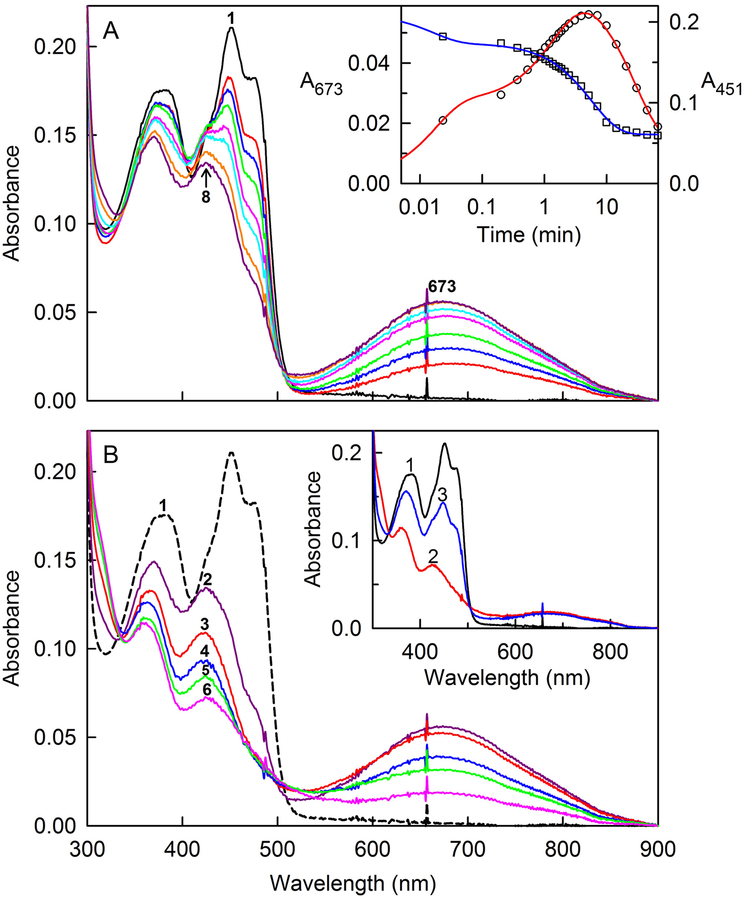
reaction proceeds via the transient formation of a long-wavelength absorbing intermediate, as judged by the spectral course of the reaction observed after mixing SQOR with excess glutathione under anaerobic conditions (Figure 3A). Oxidized SQOR exhibits peaks at 451 and 378 nm and a pronounced shoulder around 475 nm (Figure 3A, curve 1). Spectra recorded during the initial 60 s of the reaction with 8.3 mM glutathione at 7 °C exhibit apparent isosbestic points at 426 and 505 nm, but only the latter is maintained during the time (310 s) required for maximal formation of the long-wavelength absorbing intermediate (λmax = 673, 425, and 370 nm) (Figure 3A, curve 8). The spectral properties of this intermediate are similar to an intermediate observed immediately after mixing SQOR with 1 or 2 equivalents of H2S (Figure S2), as previously described27.
Figure 3.
Anaerobic reaction of SQOR with glutathione. The reaction of 18.1 μM SQOR with 8.26 mM glutathione was conducted at 7 °C in anaerobic 40 mM Tris-HCl buffer, pH 8.0, containing 40 mM NaCl and 0.009% DHPC. The black curve in each panel is the absorption spectrum of the starting oxidized enzyme. Panel A shows spectra recorded during formation of a long-wavelength absorbing intermediate. The red, blue, green, magenta, cyan, orange and purple curves were recorded 1.4, 12, 32, 82, 127, 234, and 310 s, respectively, after addition of glutathione. The inset shows plots of absorbance changes observed after glutathione addition at 673 and 451 nm, which are plotted according to the left- and right-hand axes, respectively. The red line was obtained by fitting a triple-exponential equation (y = Ae−k1t + Be−k2t + Ce−k3t + D) to the data (black open circles) recorded at 673 nm (R2 = 0.9963). The blue line was obtained by fitting a double-exponential equation (y = Ae−k1t + Be−k2t + C) to the data (black open squares) recorded at 451 nm (R2 = 0.9981). Panel B shows spectra recorded during the subsequent decay of the long-wavelength absorbing intermediate. Maximum formation of the intermediate is observed 310 s (5.17 min) after glutathione addition (curve 2). Curves 3, 4, 5, and 6 were recorded 9.9, 20.6, 30.2 and 66.2 min, respectively, after glutathione addition. The inset shows the reaction of glutathione-reduced SQOR with CoQ1. Oxidized SQOR (18.1 μM) (curve 1) was reduced (curve 2) by reaction with 8.26 mM glutathione at 7 °C for 66.2 min. Curve 3 was recorded 1.4 s after addition of 21.6 μM CoQ1. Because glutathione is present in excess, the oxidized enzyme underwent a second cycle of reduction, as judged by spectral changes observed upon further incubation (data not shown).
The decay of the intermediate formed with glutathione occurs in a slower reaction that exhibits isosbestic points at 335 nm and 500 nm (Figure 3B) and produces a reduced species that exhibits maxima at 360 and 430 nm (Figure 3B, curve 6). Reaction of glutathione-reduced SQOR with an approximately stoichiometric amount of CoQ1 results in the immediate formation of oxidized enzyme, as judged by appearance of a peak at 451 nm with a shoulder at 475 nm (Figure 3B, inset). The much faster rate of the oxidative half-reaction strongly suggests that enzyme reduction is rate-limiting in the glutathione:CoQ reductase reaction.
Kinetics of the Anaerobic Reduction of SQOR by Glutathione.
The kinetics of the SQOR reaction with 8.3 mM glutathione were analyzed at wavelengths where the long-wavelength absorbing intermediate and oxidized enzyme exhibit maxima (673 and 451 nm, respectively). The observed absorbance change at 673 nm exhibits triphasic kinetics (y = Ae−k1t+ Be−k2t + Ce−k3t + D) (Figure 3A inset, red curve). The increase in absorbance at 673 nm occurs in two phases of approximately equal ΔA673 and is followed by a monophasic absorbance decrease. The observed absorbance change at 451 nm exhibits apparent biphasic kinetics (y = Ae−k1t + Be−k2t + C) (Figure 3A inset, blue curve). The initial fast phase accounts for ~75% of the observed ΔA451 and occurs at a rate (k1 = 63 ± 11 min−1) similar to that observed for the initial fast phase of the absorbance increase at 673 nm (k1 = 57 ± 8 min−1). The rate obtained for the slow phase of the absorbance change at 451 nm (k2 = 0.175 ± 0.006 min−1) is intermediate between values obtained for the second and third phases of the triphasic fit at 673 nm (k2 = 0.63 ± 0.05 min−1; k3 = 0.034 ± 0.004 min−1).
To determine the effect of glutathione concentration, we monitored the kinetics of the SQOR reaction with a 5.8-fold higher concentration of glutathione. Formation of the long-wavelength absorbing intermediate with 47.5 mM glutathione is considerably faster and complete within 10 s. The subsequent decay of the intermediate, as monitored at 673 nm, occurs in a single phase at a rate (k = 0.20 ± 0.01 min−1) that is 5.9-fold faster than observed with 8.3 mM glutathione. The results show that both the observed rate of intermediate formation and decay are dependent on the glutathione concentration.
Mechanism of the Glutathione:CoQ Reductase Reaction.
The glutathione:CoQ reductase reaction is likely to proceed via a mechanism similar to that previously proposed for the analogous SQOR reaction with H2S as electron donor and acceptor (Scheme S1). Briefly, in this mechanism a long-wavelength absorbing charge-transfer complex is formed upon reaction of oxidized enzyme with glutathione and converted to reduced enzyme upon subsequent reaction with a second molecule of glutathione. The catalytic cycle is completed upon transfer of electrons from reduced SQOR to CoQ. The proposed mechanism is consistent with the observed spectral course of the reductive and oxidative half-reactions and the glutathione-dependence of the observed rates of formation and decay of the long-wavelength absorbing intermediate.
Steady-state Kinetics of SQOR-catalyzed Oxidation of H2S with Glutathione as Sulfane Sulfur Acceptor.
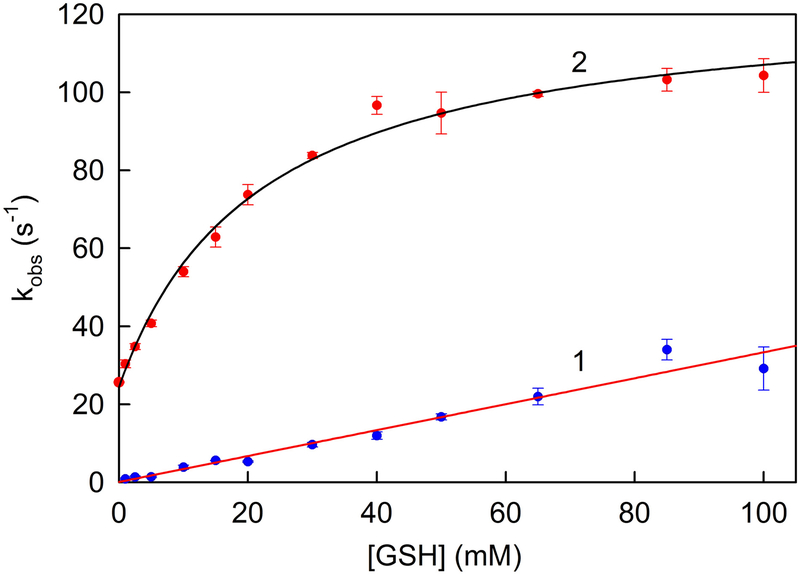
The kinetics of H2S oxidation with glutathione as sulfane sulfur acceptor were measured by monitoring CoQ1 reduction at various concentrations of glutathione in the presence of saturating CoQ1 (80 μM) and saturating H2S (200 μM). To assess the contribution due to the glutathione:CoQ1 reductase reaction (eq. 3), we measured the rate of CoQ1 reduction in assays containing glutathione but no H2S. The observed rate of CoQ1 reduction in the absence of H2S is directly proportional to the concentration of glutathione in the range from 1.0 to 100 mM glutathione (Figure 4, line 1). The slope of this line corresponds to the apparent second order rate constant for reaction shown in eq. 3 (k = 3.3 ± 0.1 × 10² M−1 s−1). The rate of CoQ1 reduction observed in the presence of H2S and glutathione was corrected for the contribution due to the glutathione:CoQ1 reductase reaction. The corrected data exhibit a hyperbolic dependence on the concentration of glutathione with a finite y-intercept, as judged by results obtaining by fitting a 3-parameter hyperbola [v = v0 + kcat[GSH]/(Km + [GSH])] to the data (Figure 4, curve 2). The value obtained for v0 (24 ± 1 s−1) is nearly identical to the rate of CoQ1 reduction observed in the absence of glutathione (25.7 ± 0.09 s−1) and is attributable to the reaction with H2S acting as both electron donor and sulfane sulfur acceptor (eq. 2). The limiting rate of H2S oxidation with glutathione as sulfane sulfur acceptor (eq. 4) (kcat = 100 ± 2 s−1) is ~4-
| (4) |
fold slower and the Km of the acceptor (Km GSH = 22 ± 2 mM) is ~125-fold larger than observed for the reaction with sulfite as acceptorb. The results indicate that the efficiency of H2S oxidation with glutathione as acceptor (kcat/Km GSH = 4.5 × 10³ M−1 s−1) is ~500-fold lower than observed for the reaction with sulfite (Table 2).
Figure 4.
Effect of glutathione concentration on the rate of SQOR-catalyzed reduction of CoQ1 in the absence or presence of H2S. Glutathione:CoQ reductase activity is measured in the absence of H2S in 100 mM potassium phosphate buffer, pH 7.5, containing 2.84 nM SQOR, 80 μM CoQ1, 0.0036% Tween20, and 90 μM EDTA at 25 °C. The observed rate of CoQ1 reduction was corrected for the contribution due to nonenzymic reactions. Line 1 was generated by a linear regression analysis (r2 = 0.9416) of the corrected data (blue circles). H2S oxidation with glutathione as sulfane sulfur acceptor is measured in the presence of saturating H2S (200 μM) under otherwise identical conditions. The observed rate of CoQ1 reduction was corrected for the contribution due to the glutathione:CoQ reductase reaction and nonenzymic reactions. Curve 2 was obtained by fitting a 3-parameter hyperbola [v = v0 + kcat [GSH]/(Km + [GSH]) (r2=0.9873)] to the corrected data (red circles).
Simulated Rates of SQOR Reactions at Physiological Concentrations of Different Sulfane Sulfur Acceptors.
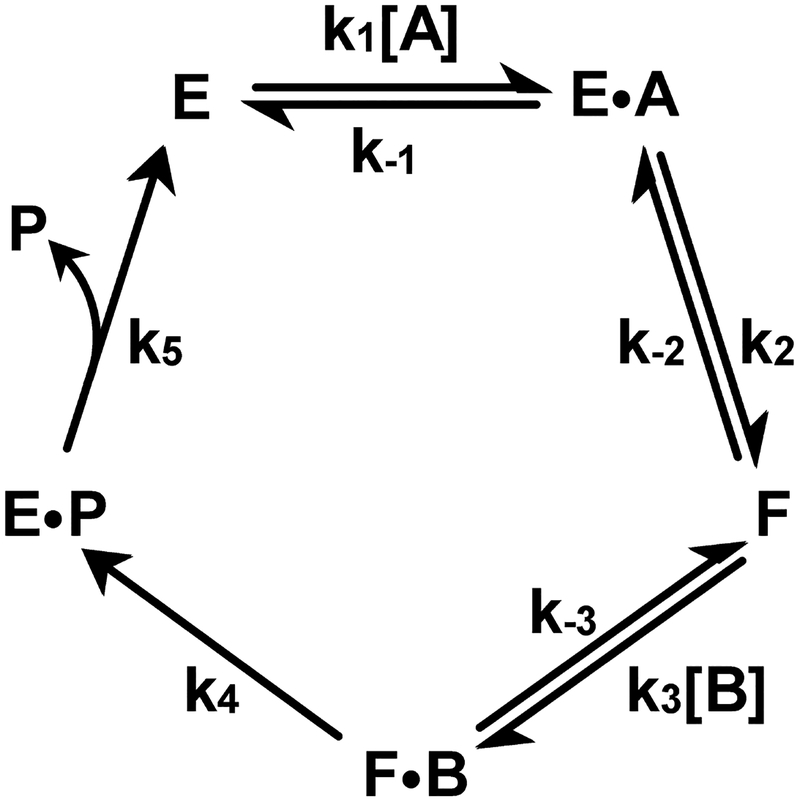
The concentration of CoQ in rat liver (100 μM) and heart (300 μM)45 is much greater than the Km observed for CoQ1 (19 μM) as electron acceptor in the SQOR reaction27. The presence of saturating CoQ simplifies the steady-state kinetic mechanism of the SQOR reaction from terreactant to one involving only two substrates, H2S and the sulfane sulfur acceptor. In the SQOR reaction, the sulfane sulfur produced upon oxidation of H2S is transferred to the second substrate, the acceptor (X), to form XS. Consequently, the product from the first substrate (H2S) cannot be released into solution before the second substrate (X) binds, a key defining feature of a sequential mechanism. The SQOR reaction in the presence of saturating CoQ is thus kinetically equivalent to an ordered sequential bi uni mechanism (Scheme 2).
Scheme 2.
Ordered sequential bi uni kinetic mechanism involving formation of a stable enzyme form (F) that contains covalently bound sulfane sulfur.
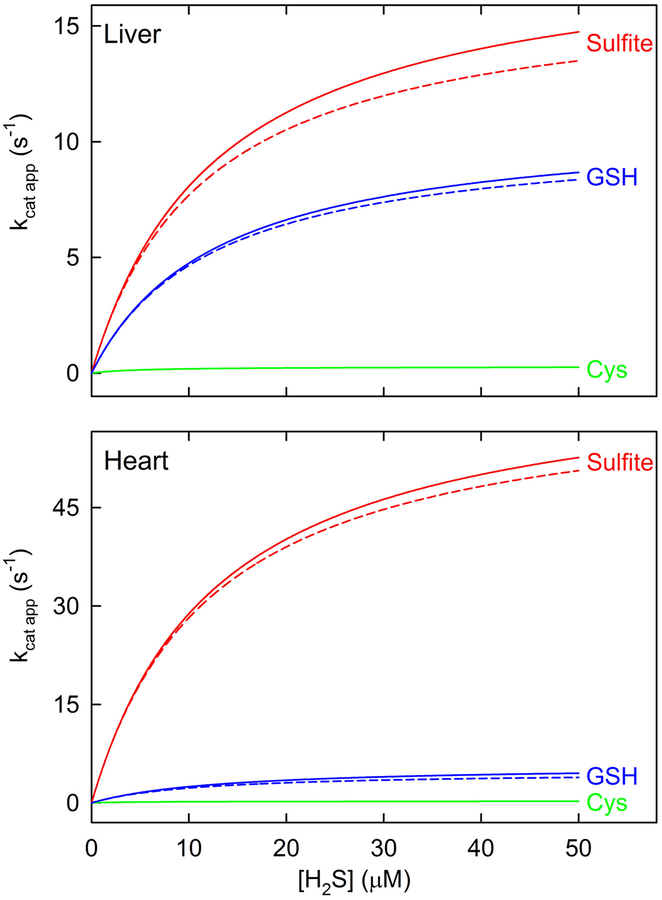
Simulated traces for SQOR reactions with H2S as the variable substrate at a fixed concentration of different acceptors and saturating CoQ1 were generated by using an equation for an ordered sequential mechanism (eq. 1a, A = H2S, B = acceptor), the measured concentrations of sulfite, glutathione and cysteine in rat liver and heart (Table 1), and the observed steady-state kinetic parameters (Table 2), assuming that KmA ≈ KdA. As shown by the solid line traces in Figure 5, the simulations strongly suggest that the reaction with sulfite as sulfane sulfur acceptor is the major pathway in liver and heart, accounting for 62.3 and 91.7%, respectively of SQOR-mediated H2S oxidation in these tissues. The remainder of H2S oxidation by SQOR in liver and heart is attributable to a secondary pathway with glutathione as acceptor (36.6 and 7.9%, respectively). The reaction with cysteine as acceptor is virtually negligible in both liver (1.1%) and heart (0.4%).
Figure 5.
Simulated rates of SQOR reactions with different sulfane sulfur acceptors at the acceptor concentrations observed in rat tissues. The simulated traces shown by the solid lines were generated using an equation for an ordered sequential mechanism (eq. 1a, A = H2S; B = acceptor), the steady-state kinetic parameters listed in Table 2, and the observed concentrations of sulfite, glutathione and cysteine in rat liver and heart (Table 1), as described in Experimental Procedures. The traces shown by the dashed lines simulate the SQOR reaction with sulfite as acceptor in the presence of glutathione (or with glutathione as acceptor in the presence of sulfite) and were generated by using an equation containing a competitive term (eq. 1b). The simulations for rat liver and heart are shown in the top and bottom panels, respectively.
When a single enzyme acts on two different substrates, and both are present simultaneously, each will act as a competitive inhibitor with respect to the other. To simulate the kinetics of the SQOR reaction with sulfite as acceptor in the presence of glutathione (or with glutathione as acceptor in the presence of sulfite), a competitive term was added to the steady-state kinetic equation (eq. 1b). The presence of an alternate acceptor results in a small decrease in the simulated rates, as indicated by the dashed line traces in Figure 5. The reaction with sulfite as acceptor in the presence of glutathione constitutes the major pathway for H2S oxidation in liver and heart (61.7 and 92.9%, respectively), similar to results obtained for simulations in the absence of glutathione.
Assessment of an Alternate Approach for Simulating SQOR Reaction Rates.
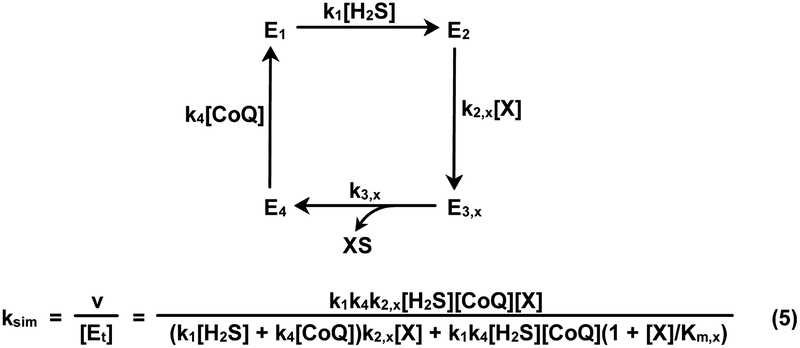
Libiad et al. proposed a SQOR mechanism comprising four irreversible steps (Scheme 3) and derived a rate equation for this mechanism in the presence of a mixture of sulfane sulfur acceptors. The rate equation was used in an attempt to simulate the kinetics of the SQOR reaction with multiple acceptors1. Three of the four steps in the postulated mechanism involve substrate binding. The only unimolecular step involves release of the XS product in step 3 (k3,x). This feature mandates that turnover be limited by the rate of product release (kcat,x = k3,x). The postulated mechanism also assumes that the first and last steps of H2S oxidation are independent of the nature of the acceptor. Based on this assumption, values for the corresponding rate constants of these steps (k1 and k4, respectively) can be calculated by using steady-state kinetic parameters observed for the reaction with sulfite as sulfane sulfur acceptor (k1 = kcat sulfite/Km H2S; k4 = kcat sulfite/Km CoQ1)1. Consequently, Libiad et al. used a single set of Km values for H2S and CoQ1 (13 and 19 μM, respectively) to simulate the kinetics of the SQOR reaction with a mixture of acceptors.
Scheme 3.
Mechanism postulated for SQOR by Libiad et al.1 and the corresponding rate equation (eq. 5) for the reaction in the presence of a single sulfane sulfur acceptor, X. CoQ = CoQ1. For this mechanism, k3,x = kcat,x and k2,x = kcat,x/Km,x
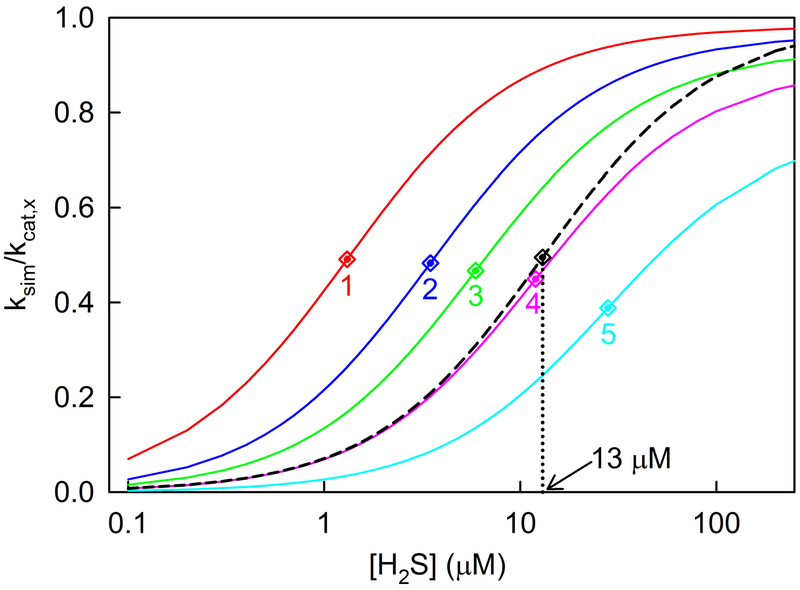
To evaluate this approach, we used a rate equation derived for the Libiad et al. mechanism to simulate the kinetics of the SQOR reaction in the presence of a single acceptor (see Scheme 3, eq. 5). Calculations were performed for reactions with hypothetical acceptors (X) exhibiting a range of kcat,x and Km,x values with H2S as the variable substrate in the presence of nearly saturating CoQ1 and acceptor. As expected, all simulated traces exhibit a hyperbolic dependence on the concentration of H2S [ksim = (kcat app[H2S])/(Km app + [H2S])]. Values for Km app and kcat app were determined by fitting a hyperbola to each of the simulated traces. Under the specified simulation conditions, values obtained for Km app and kcat app should be equal to the values used in the calculations for Km H2S (13 μM) and kcat,x, respectively.
Major deviations from the latter scenario are observed, depending on the value of kcat,x used in the simulation but independent of the value used for Km,x. This is illustrated by a set of simulated traces generated for acceptors with Km,x = 22 mM and kcat,x = 37, 100, 176, 370 or 1000 s−1. Thus, increasing kcat,x from 37 to 1000 s−1 results in a concomitant increase (~20-fold) in the value obtained for Km app (1.31 to 28.0 μM) and a decrease (20%) in the value obtained for the ratio, kcat app/kcat,x (0.98 to 0.78) (Figure 6, curves 1–5). In contrast, traces simulated using an equation for an ordered sequential mechanism (eq. 1a) exhibit expected values for Km app (13 μM) and kcat app/kcat,x (0.99) over a broad range of kcat,x values (37 to 3700 s−1) (Figure 6, dashed black curve). It is worth noting that two of the kcat,x values used in the simulations coincide with those observed with glutathione or sulfite as acceptor (see Table 2). The results indicate that simulations generated based on the mechanism proposed Libiad et al.1 exhibit major discrepancies as compared with kinetics observed for the SQOR reaction in the presence of a single acceptor27 and are thus unlikely to model to the kinetics in the presence of multiple acceptors.
Figure 6.
Rates of SQOR-catalyzed oxidation of H2S in the presence of a single acceptor (X) were simulated by using a rate equation derived for a mechanism proposed by Libiad et al. (Scheme 3, eq. 5). The simulations shown in the solid line curves were generated with H2S as the variable substrate in the presence of nearly saturating concentrations of CoQ1 (10 × Km CoQ1) and acceptor (100 × Km, x), using Km values for H2S (13 μM) and CoQ1 (19 μM) observed for the reaction with sulfite as acceptor, as described in the text. The red, blue, green, magenta and cyan lines (curves 1–5) were generated for hypothetical acceptors with Km,x = 22 mM and kcat,x = 37, 100, 176, 370 and 1000 s−1, respectively. The dashed black line shows a simulated trace generated using an equation for a sequential mechanism (eq. 1a, A = H2S; B = X), Km H2S = 13 μM, Km,x = 22 mM and kcat,x = 37 or 3700 s−1, [X] = 100 × Km, x). To compare simulations generated using different kcat,x values, predicted rates (ksim) are divided by the kcat,x value used in the simulation. Apparent Km values for H2S were obtained by fitting an hyperbola (y = (kcat app[H2S])/(Km app + [H2S]) to each of the simulated traces and are indicated by correspondingly colored diamond symbols.
Concluding Remarks.
Tissue metabolite analysis shows that the physiological concentration of sulfite in mammalian liver or heart is considerably higher (~100-fold) than previously proposed, based on the assumption that plasma sulfite levels can be used to estimate the intracellular sulfite concentration1. The validity of this assumption is also contradicted by results obtained with other metabolites, such as glutathione, where the intracellular concentration is found to be about three orders of magnitude higher than the concentration in plasma46, 47. Libiad et al. have argued that the intracellular concentration of free sulfite must be very low owing to its high reactivity with protein disulfides. This argument is undermined by the low concentration of protein disulfides in the reducing milieu of the cell and the high intracellular concentration of reduced glutathione, which readily reacts with S-sulfonates to release sulfite48. Nearly all of the protein-bound sulfite in plasma is attributable to the reaction of sulfite with a single highly reactive cysteine in albumin, which exists mainly as a mixed sulfide with low molecular weight thiols49. It is noteworthy that sulfite does not react with any of the 17 cystine disulfides in albumin, a protein present at very high concentration in plasma (40 mg/mL).
We used observed metabolite levels and steady-state kinetic parameters to simulate the rate of H2S oxidation by SQOR at physiological concentrations of sulfite, glutathione or cysteine. The results show that the SQOR reaction with sulfite as acceptor is the major pathway in liver and heart, consistent with the model for H2S metabolism proposed by Jorns and coworkers27,28 (Scheme 1). However, the simulations also show that the high intracellular concentration of glutathione is able to partially compensate for the considerably poorer ability of glutathione to function as an acceptor in the SQOR reaction. Consequently, the reaction with glutathione constitutes a significant secondary pathway, especially in liver. Moreover, pathophysiological conditions that affect sulfite availability may significantly perturb H2S metabolism, as discussed below.
Increased sulfite levels are observed in SO deficiency, a serious and often fatal disease that primarily affects the brain50, 51. The enhanced availability of sulfite will strongly favor the use of sulfite as the sulfane sulfur acceptor in the SQOR reaction and the metabolic conversion of H2S to thiosulfate (Scheme 1, steps 1–3 and 5). The dynamic shift in H2S metabolism towards thiosulfate production in tissues like liver is consistent with the markedly elevated urinary excretion of thiosulfate observed in SO deficiency50–52. The metabolic shift can partially compensate for the loss of SO activity in liver and most other tissues with the notable exception of brain, an organ where SQOR activity appears to be extremely low40, 53. We propose that the deficiency of SQOR in brain may help explain why severe neurological abnormalities are the major clinical manifestation of SO deficiency50, 51.
Ethylmalonic encephalopathy (EE) is a fatal autosomal recessive disease that is caused by a defect in the gene (Ethe1) that codes for SDO33, 34. The genetic defect eliminates the major source of mitochondrially produced sulfite and severely impacts H2S metabolism, as judged by the massive toxic accumulation of H2S in the bloodstream and tissues and elevated urinary excretion of thiosulfate34. A minor source of sulfite in EE is probably derived from the transamination of cysteine sulfinic acid in the mitochondrial matrix to produce β-sulfinylpyruvatec, a compound that spontaneously hydrolyzes into sulfite and pyruvate54, 55. The sulfite deficiency in EE will favor the use of glutathione as the sulfane sulfur acceptor in the SQOR reaction. The GSS− produced in this reaction may be used to synthesize thiosulfate in a TST-catalyzed reaction that will, however, be limited by the availability of sulfite. The consequent accumulation of GSS−, a highly reactive species, will favor a nonenzymic reaction with glutathione56, 57 in an apparent futile cycle that regenerates H2S and causes oxidative stress by depleting the mitochondrial pool of reduced glutathione. This scenario is consistent with the observed ability of N-acetylcysteine, an antioxidant and glutathione precursor, to reduce the severity of the pathology exhibited by EE patients58.
The dynamic ability of H2S metabolism to accommodate a genetic deficiency is evidenced by the phenotype exhibited by knockout mice defective in the gene (TST) that encodes rhodanese, the predominant TST expressed in human liver31. Although liver extracts from TST−/−knockout mice exhibit no detectable TST activity, the animals exhibit only a modest increase in plasma H2S levels (4-fold), normal growth, and an apparently unaffected life span32. In contrast, knockout mice defective in the gene (Ethe1) that encodes SDO show growth arrest at 15 days post natal and die between the 5th and 6th week after birth. The major abnormalities in Ethe1−/−knockout mice can be attributed to the extremely elevated tissue levels of H2S (25- to 60-fold)34. The minimally perturbed phenotype exhibited by TST−/− knockout mice may be explained by the operation of alternative pathways for H2S oxidation that do not require TST. Specifically, we propose that H2S is converted to sulfite in successive reactions catalyzed by SQOR (with GSH as acceptor) and SDO. Sulfite may then be oxidized to sulfate by SO or used as the acceptor in the SQOR reaction to oxidize a second molecule of H2S and produce thiosulfate.
Accumulating evidence suggests that thiosulfate, a key intermediate in H2S metabolism, may be of therapeutic value in the treatment of various disorders, including chronic heart failure59, hypertensive heart disease60, cerebral ischemia/reperfusion injury61, neuroinflammation62, calciphylaxis63, and acute lung injury64. We previously suggested that thiosulfate may provide a source of sulfane sulfur required for sulfhydration of cysteine residues27. Indeed, recent studies indicate that the protective effects of thiosulfate against neuronal ischemia are associated with inhibition of caspase-3 activity by sulfhydration at an active site cysteine residue61. The apparent mobilization of the sulfane sulfur in thiosulfate is likely to require activation by a sulfurtransferase. Further studies are required to elucidate the relationship between H2S metabolism and cellular signaling elicited by H2S and to evaluate the possible participation of known human TSTs (rhodanese, TSTD1) in thiosulfate-dependent protein sulfhydration.
Supplementary Material
ACKNOWLEDGMENTS
We thank Dr. Guillermo Alexander for generously allowing us the use of his reversed phase HPLC system coupled with fluorescence detection.
Funding: This research work was supported by National Institutes of Health Grant R01GM107389 (M.S.J.)
Abbreviations:
- FAD
flavin adenine dinucleotide
- SQOR
sulfide:quinone oxidoreductase
- DTPA
diethylenetriamine pentaacetic acid
- SDS
sodium dodecyl sulfate
- MSA
methanesulfonic acid
- MBB
monobromobimane
- EDTA
ethylenediaminetetraacetate
- TFA
trifluoroacetic acid
- CoQ
coenzyme Q
Footnotes
SUPPORTING INFORMATION
HPLC elution profiles of various bimane derivatives (Figure S1), spectral properties of long-wavelength absorbing intermediates formed by anaerobic reaction of SQOR with glutathione or H2S (Figure S2), proposed mechanism for the SQOR-catalyzed glutathione:CoQ reductase reaction (Scheme S1). This material is available free of charge via the Internet at http://pubs.acs.org.
This reaction is less efficient as compared with H2S oxidation by SQOR with sulfite as sulfane sulfur acceptor (see Table 2).
A 50% higher value for kcat was obtained by fitting a 3-parameter hyperbola to data that had not been corrected for the contribution due to the glutathione:CoQ1 reductase reaction (r2 = 0.9908). For comparison with a prior study1, we attempted to fit the uncorrected data to a 2-parameter hyperbola but the observed poorer fit (r2 = 0.9098) indicates that the use of this equation is inappropriate.
This pathway does not eliminate the sulfite deficit in EE because most of the cysteine sulfinic acid, produced from cysteine by cysteine dioxygenase, is converted to hypotaurine2.
REFERENCES
- 1.Libiad M, Yadav PK, Vitvitsky V, Martinov M, and Banerjee R (2014) Organization of the human mitochondrial H2S oxidation pathway, J. Biol. Chem 45, 30901–30910. [DOI] [PMC free article] [PubMed] [Google Scholar]
- 2.Stipanuk MH (2004) Sulfur amino acid metabolism: pathways for production and removal of homocysteine and cysteine, Ann. Rev Nutr 24, 539–577. [DOI] [PubMed] [Google Scholar]
- 3.Yang G, Wu L, Jiang B, Yang W, Qi J, Cao K, Meng Q, Mustafa AK, Mu W, Zhang S, Snyder SH, and Wang R (2008) H2S as a physiologic vasorelaxant: Hypertension in mice with deletion of cystathionine γ-lyase, Science 322, 587–590. [DOI] [PMC free article] [PubMed] [Google Scholar]
- 4.Yan H, Du J, and Tang C (2004) The possible role of hydrogen sulfide on the pathogenesis of spontaneous hypertension in rats, Biochem. Biophys. Res. Commun 313, 22–27. [DOI] [PubMed] [Google Scholar]
- 5.Wang Y, Zhao X, Jin H, Wei H, Li W, Bu D, Tang X, Ren Y, Tang C, and Du J (2009) Role of hydrogen sulfide in the development of atherosclerotic lesions in apolipoprotein E knockout mice, Arterioscler. Thromb. Vasc. Biol 29, 173–179. [DOI] [PubMed] [Google Scholar]
- 6.Mani S, Li HZ, Untereiner A, Wu LY, Yang GD, Austin RC, Dickhout JG, Lhotak S, Meng QH, and Wang R (2013) Decreased endogenous production of hydrogen sulfide accelerates atherosclerosis, Circulation 127, 2523–2534. [DOI] [PubMed] [Google Scholar]
- 7.Cheung SH, Kwok WK, To KF, and Lau JYW (2014) Anti-atherogenic effect of hydrogen sulfide by over-expression of cystathionine gamma-lyase (CSE) gene, PLOS One 9, Article number: e113038. [DOI] [PMC free article] [PubMed] [Google Scholar]
- 8.Kondo K, Bhushan S, King AL, Prabhu SD, Hamid T, Koenig S, Murohara T, Predmore BL, Gojon G, Wang R, Karusula N, Nicholson CK, Calvert JW, and Lefer DJ (2013) H2S protects against pressure overload-induced heart failure via upregulation of endothelial nitric oxide synthase, Circulation 127, 1116–1127. [DOI] [PMC free article] [PubMed] [Google Scholar]
- 9.Polhemus DJ, Kondo K, Bhushan S, Bir SC, Kevil CG, Murohara T, Lefer DJ, and Calvert JW (2013) Hydrogen sulfide attenuates cardiac dysfunction after heart failure via induction of angiogenesis, Circ. Heart Fail 6, 1077–1086. [DOI] [PMC free article] [PubMed] [Google Scholar]
- 10.Givvimani S, Munjal C, Gargoum R, Sen U, Tyagi N, Vacek JC, and Tyagi SC (2011) Hydrogen sulfide mitigates transition from compensatory hypertrophy to heart failure, J. Appl. Physiol 110, 1093–1100. [DOI] [PMC free article] [PubMed] [Google Scholar]
- 11.Calvert JW, Elston M, Nicholson CK, Gundewar S, Jha S, Elrod JW, Ramachandran A, and Lefer DJ (2010) Genetic and pharmacologic hydrogen sulfide therapy attenuates ischemia-induced heart failure in mice, Circulation 122, 11–19. [DOI] [PMC free article] [PubMed] [Google Scholar]
- 12.Kimura H (2002) Hydrogen sulfide as a neuromodulator, Mol. Neurobiol 26, 13–19. [DOI] [PubMed] [Google Scholar]
- 13.Kimura Y and Kimura H (2004) Hydrogen sulfide protects neurons from oxidative stress, FASEB J 18, 1165–1167. [DOI] [PubMed] [Google Scholar]
- 14.Lee M, Sparatore A, Del Soldato P, Mcgeer E, and McGeer PL (2010) Hydrogen sulfide-releasing NSAIDs attenuate neuroinflammation induced by microglial and astrocytic activation, Glia 58, 103–113. [DOI] [PubMed] [Google Scholar]
- 15.Penga Y-J, Nanduria J, Raghuramana G, Souvannakittia D, Gadallab MM, Kumara GK, Snyder SH, and Prabhakara NR (2010) H2S mediates O2 sensing in the carotid body, Proc. Natl. Acad. Sci. U S A 107, 10719–10724. [DOI] [PMC free article] [PubMed] [Google Scholar]
- 16.Blackstone E, Morrison M, and Roth MB (2005) H2S induces a suspended animation–like state in mice, Science 308, 518. [DOI] [PubMed] [Google Scholar]
- 17.Gao X, Krokowski D, Guan B, Bederman I, Majumder M, Parisien M, Diatchenko L, Kabil O, Willard B, and Banerjee R (2015) Quantitative H2S-mediated protein sulfhydration reveals metabolic reprogramming during the integrated stress response, eLife e10067. [DOI] [PMC free article] [PubMed] [Google Scholar]
- 18.Paul BD and Snyder SH (2015) H2S: A novel gasotransmitter that signals by sulfhydration, TIBS, 40, 687–700. [DOI] [PMC free article] [PubMed] [Google Scholar]
- 19.Zhao KX, Ju YJ, Li SS, Altaany Z, Wang R, and Yang GD (2014) S-sulfhydration of MEK1 leads to PARP-1 activation and DNA damage repair, EMBO Rep 15, 792–800. [DOI] [PMC free article] [PubMed] [Google Scholar]
- 20.Vandiver MS, Paul BD, Xu RS, Karuppagounder S, Rao F, Snowman AM, Ko HS, Il Lee Y, Dawson VL, Dawson TM, Sen N, and Snyder SH (2013) Sulfhydration mediates neuroprotective actions of parkin, Nature Commun 4, Article number 1626. [DOI] [PMC free article] [PubMed] [Google Scholar]
- 21.Yang G, Zhao K, Ju Y, Mani S, Cao Q, Puukila S, Khaper N, Wu L, and Wang R (2013) Hydrogen sulfide protects against cellular senescence via S-sulfhydration of Keap1 and activation of Nrf2, Antioxid. Redox Signal 18, 1–14. [DOI] [PubMed] [Google Scholar]
- 22.Yong R and Searcy DG (2001) Sulfide oxidation coupled to ATP synthesis in chicken liver mitochondria, Comp. Biochem. Physiol. part B 129, 129–137. [DOI] [PubMed] [Google Scholar]
- 23.Bartholomew TC, Powell GM, Dodgson KS, and Curtis CG (1980) Oxidation of sodium sulphide by rat liver, lungs and kidney, Biochem. Pharm 29, 2431–2437. [DOI] [PubMed] [Google Scholar]
- 24.Huang J, Khan S, and O’Brien PJ (1998) The glutathione dependence of inorganic sulfate formation from L- or D-cysteine in isolated rat hepatocytes, Chem-Biol Interact 110, 189–202. [DOI] [PubMed] [Google Scholar]
- 25.Hildebrandt TM and Grieshaber MK (2008) Three enzymatic activities catalyze the oxidation of sulfide to thiosulfate in mammalian and invertebrate mitochondria, FEBS J 275, 3352–3361. [DOI] [PubMed] [Google Scholar]
- 26.Levitt MD, Furne J, Springfield J, Suarez F, and DeMaster E (1999) Detoxification of hydrogen sulfide and methanethiol in the cecal mucosa, J. Clin. Invest 104, 1107–1114. [DOI] [PMC free article] [PubMed] [Google Scholar]
- 27.Jackson MR, Melideo SL, and Jorns MS (2012) Human sulfide:quinone oxidoreductase catalyzes the first step in hydrogen sulfide metabolism and produces a sulfane sulfur metabolite, Biochemistry 51, 6804–6815. [DOI] [PubMed] [Google Scholar]
- 28.Melideo SL, Jackson MR, and Jorns MS (2014) Biosynthesis of a central intermediate in hydrogen sulfide metabolism by a novel human sulfurtransferase and its yeast ortholog, Biochemistry 53, 4739–4753. [DOI] [PMC free article] [PubMed] [Google Scholar]
- 29.Li GY, Chen Y, Wang JQ, Wu JH, Gasser G, Ji LN, and Chao H (2015) Direct imaging of biological sulfur dioxide derivatives in vivo using a two-photon phosphorescent probe, Biomaterials 63, 128–136. [DOI] [PubMed] [Google Scholar]
- 30.Yang XG, Zhou YB, Zhang XF, Yang S, Chen Y, Guo JR, Li XX, Qing ZH, and Yang RH (2016) A TP-FRET-based two-photon fluorescent probe for ratiometric visualization of endogenous sulfur dioxide derivatives in mitochondria of living cells and tissues, Chem. Commun 52, 10289–10292. [DOI] [PubMed] [Google Scholar]
- 31.Wilhelm M, Schlegl J, Hahne H, Gholami AM, Lieberenz M, Savitski MM, Ziegler E, Butzmann L, Gessulat S, Marx H, Mathieson T, Lemeer S, Schnatbaum K, Reimer U, Wenschuh H, Mollenhauer M, Slotta-Huspenina J, Boese JH, Bantscheff M, Gerstmair A, Faerber F, and Kuster B (2014) Mass-spectrometry-based draft of the human proteome, Nature 509, 582–587. [DOI] [PubMed] [Google Scholar]
- 32.Morton NM, Beltram J, Carter RN, Michailidou Z, Gorjanc G, McFadden C, Barrios-Llerena ME, Rodriguez-Cuenca S, Gibbins MTG, Aird RE, Moreno-Navarrete JM, Munger SC, Svenson KL, Gastaldello A, Ramage L, Naredo G, Zeyda M, Wang ZV, Howie AF, Saari A, Sipila P, Stulnig TM, Gudnason V, Kenyon CJ, Seckl JR, Walker BR, Webster SP, Dunbar DR, Churchill GA, Vidal-Puig A, Fernandez-Real JM, Emilsson V, and Horvat S (2016) Genetic identification of thiosulfate sulfurtransferase as an adipocyte-expressed antidiabetic target in mice selected for leanness, Nat. Med 22, 771–779. [DOI] [PMC free article] [PubMed] [Google Scholar]
- 33.Tiranti V, D’Adamo P, Briem E, Ferrari G, Mineri R, Lamantea E, Mandel H, Balestri P, Garcia-Silva M-T, Vollmer B, Rinaldo P, Hahn SH, Leonard J, Rahman S, Dionisi-Vici C, Garavaglia B, Gasparini P, and Zeviani M (2004) Ethylmalonic encephalopathy is caused by mutations in ETHE1, a gene encoding a mitochondrial matrix protein, Am. J. Hum. Genet 74, 239–252. [DOI] [PMC free article] [PubMed] [Google Scholar]
- 34.Tiranti V, Viscomi C, Hildebrandt T, Di Meo I, Mineri R, Tiveron C, Levitt MD, Prelle A, Fagiolari G, Rimoldi M, and Zeviani M (2009) Loss of ETHE1, a mitochondrial dioxygenase, causes fatal sulfide toxicity in ethylmalonic encephalopathy, Nat. Med 15, 200–205. [DOI] [PubMed] [Google Scholar]
- 35.Wilson HL and Rajagopalan KV (2004) The role of tyrosine 343 in substrate binding and catalysis by human sulfite oxidase, J. Biol. Chem 279, 15105–15113. [DOI] [PubMed] [Google Scholar]
- 36.Kamoun P, Belardinelli MC, Chabli A, Lallouchi K, and Chadefaux-Vekemans B (2003) Endogenous hydrogen sulfide overproduction in Down syndrome, Am. J. Med. Genet 116A, 310–311. [DOI] [PubMed] [Google Scholar]
- 37.Kangas J and Savolainen H (1987) Urinary thiosulphate as an indicator of exposure to hydrogen sulphide vapour, Clin. Chim. Acta 164, 7–10. [DOI] [PubMed] [Google Scholar]
- 38.Roman HB, Hirschberger LL, Krijt J, Valli A, Kožich V, and Stipanuk MH (2013) The cysteine dioxgenase knockout mouse: Altered cysteine metabolism in nonhepatic tissues leads to excess H2S/HS− production and evidence of pancreatic and lung toxicity, Antioxid. Redox Signal 19, 1321–1336. [DOI] [PMC free article] [PubMed] [Google Scholar]
- 39.Libiad M, Sriraman A, and Banerjee R (2015) Polymorphic variants of human rhodanese exhibit differences in thermal stability and sulfurtransfer kinetics, J. Biol. Chem 290, 23579–23578. [DOI] [PMC free article] [PubMed] [Google Scholar]
- 40.Lagoutte E, Mimoun S, Andriamihaja M, Chaumontet C, Blachier F, and Bouillaud F (2010) Oxidation of hydrogen sulfide remains a priority in mammalian cells and causes reverse electron transfer in colonocytes, Biochim. Biophys. Acta 1797, 1500–1511. [DOI] [PubMed] [Google Scholar]
- 41.Fahey RC and Newton GL (1987) Determination of low-molecular-weight thiols using monobromobimane fluorescent labeling and high-performance liquid chromatography, Methods Enzymol 143, 85–96. [DOI] [PubMed] [Google Scholar]
- 42.Shen X, Pattillo CB, Pardue S, Bir SC, Wang R, and Kevil CG (2011) Measurement of plasma hydrogen sulfide in vivo and in vitro, Free Radic. Biol. Med 50, 1021–1031. [DOI] [PMC free article] [PubMed] [Google Scholar]
- 43.Griffith OW and Meister A (1979) Glutathione: interorgan translocation, turnover, and metabolism, Proc. Natl. Acad. Sci. USA 76, 5606–5610. [DOI] [PMC free article] [PubMed] [Google Scholar]
- 44.Stipanuk MH, Dominy JE, Lee J, and Coloso RM (2006) Mammalian cysteine metabolism: new insights into regulation of cysteine metabolism, J. Nutr 136, 1652S–1659S. [DOI] [PubMed] [Google Scholar]
- 45.Beyer RE, Burnett B, Cartwright KJ, Edington DW, Falzon MJ, Kreitman KR, Kuhn TW, Ramp BJ, Rhee SYS, and Rosenwasser MJ (1985) Tissue coenzyme Q (ubiquinone) and protein concentrations over the life span of the laboratory rat, Mech. Ageing Dev 32, 267–281. [DOI] [PubMed] [Google Scholar]
- 46.Griffith OW (1999) Biologic and pharmacologic regulation of mammalian glutathione synthesis, Free Radic. Biol. Med 27, 922–935. [DOI] [PubMed] [Google Scholar]
- 47.Pastore A, Federici G, Bertini E, and Piemonte F (2003) Analysis of glutathione: implication in redox and detoxification, Clin Chim Acta 333, 19–39. [DOI] [PubMed] [Google Scholar]
- 48.Winell M and Mannervik B (1969) The nature of the enzymatic reduction of S-sulfoglutathione in liver and peas, 184, 374–380. [DOI] [PubMed] [Google Scholar]
- 49.Gregory RE and Gunnison AF (1984) Identification of plasma proteins containing sulfite-reactive disulfide bonds, Chem. Biol. Interactions 49, 55–69. [DOI] [PubMed] [Google Scholar]
- 50.Johnson JL and Duran M (2001) Molybdenum cofactor deficiency and isolated sulfite oxidase deficiency, in The Metabolic and Molecular Bases of Inherited Disease (Scriver CR, Beaudet AL, Valle D, and W. S. Sly, Eds.) pp 3163–3177, McGraw-Hill, New York. [Google Scholar]
- 51.Rupar CA, Gillett J, Gordon BA, Ramsay DA, Johnson JL, Garrett RM, Rajagopalan KV, Jung JH, Bacheyie GS, and Sellers AR (1996) Isolated sulfite oxidase deficiency, Neuropediatrics 27, 299–304. [DOI] [PubMed] [Google Scholar]
- 52.Grings M, Moura AP, Parmeggiani B, Marcowich GF, Amaral AU, Wyse ATD, Wajner M, and Leipnitz G (2013) Disturbance of brain energy and redox homeostasis provoked by sulfite and thiosulfate: Potential pathomechanisms involved in the neuropathology of sulfite oxidase deficiency, Gene 531, 191–198. [DOI] [PubMed] [Google Scholar]
- 53.Linden DR, Furne J, Stoltz GJ, Abdel-Rehim MS, Levitt MD, and Szurszewski JH (2012) Sulphide quinone reductase contributes to hydrogen sulphide metabolism in murine peripheral tissues but not in the CNS, Br. J. Pharmacol 165, 2178–2190. [DOI] [PMC free article] [PubMed] [Google Scholar]
- 54.Palmieri F, Stipani I, and Iacobazzi V (1979) The transport of L-cysteinesulfinate in rat liver mitochondria, Biochim. Biophys. Acta 555, 531–546. [DOI] [PubMed] [Google Scholar]
- 55.LaNoue KF and Schoolwerth AC (1984) Metabolite transport in mammalian mitochondria, in New Compr. Biochem (Ernster L, Ed.) pp 221–268, Elsevier, New York. [Google Scholar]
- 56.Ida T, Sawa T, Ihara H, Tsuchiya Y, Watanabe Y, Kumagai Y, Suematsu M, Motohashi H, Fujii S, Matsunaga T, Yamamoto M, Ono K, Devarie-Baez NO, Xian M, Fukuto JM, and Akaike T (2014) Reactive cysteine persulfides and S-polythiolation regulate oxidative stress and redox signaling, Proc. Natl. Acad. Sci. USA 111, 7606–7611. [DOI] [PMC free article] [PubMed] [Google Scholar]
- 57.Kawamura S, Otsuji Y, Nakabayashi T, Kitao T, and Tsurugi J (1965) Aralkyl hydrodisulfides. IV. The reaction of benzyl hydrodisulfide with several nucleophiles, J. Org. Chem 30, 2711–2714. [Google Scholar]
- 58.Viscomi C, Burlina AB, Dweikat I, Savoiardo M, Lamperti C, Hildebrandt T, Tiranti V, and Zeviani M (2010) Combined treatment with oral metronidazole and N-acetylcysteine is effective in ethylmalonic encephalopathy, Nat. Med 16, 869–871. [DOI] [PubMed] [Google Scholar]
- 59.Sen U, Vacek TP, Hughes WM, Kumar M, Moshal KS, Tyagi N, Metreveli N, Hayden MR, and Tyagi SC (2008) Cardioprotective role of sodium thiosulfate on chronic heart failure by modulating endogenous H2S generation, Pharmacology 82, 201–213. [DOI] [PubMed] [Google Scholar]
- 60.Snijder PM, Frenay AR, Boer RA, Pasch A, Hillebrands JL, Leuvenink HGD, and Goor H (2015) Exogenous administration of thiosulfate, a donor of hydrogen sulfide, attenuates angiotensin II-induced hypertensive heart disease in rats, Br. J. Pharmacol 172, 1494–1504. [DOI] [PMC free article] [PubMed] [Google Scholar]
- 61.Marutani E, Yamada M, Ida T, Tokuda K, Ikeda K, Kai S, Shirozu K, Hayashida K, Kosugi S, and Hanaoka K (2015) Thiosulfate mediates cytoprotective effects of hydrogen sulfide against neuronal ischemia, JAHA 4, e002125. [DOI] [PMC free article] [PubMed] [Google Scholar]
- 62.Lee M, McGeer EG, and McGeer PL (2016) Sodium thiosulfate attenuates glial-mediated neuroinflammation in degenerative neurological diseases, J. Neuroinflammation 13, Article Number 32. [DOI] [PMC free article] [PubMed] [Google Scholar]
- 63.Hayden MR and Goldsmith DJA (2010) Sodium thiosulfate: new hope for the treatment of calciphylaxis, Semin. Dial 23, 258–262. [DOI] [PubMed] [Google Scholar]
- 64.Sakaguchi M, Marutani E, Shin H, Chen W, Hanaoka K, Xian M, and Ichinose F (2014) Sodium thiosulfate attenuates acute lung injury in mice, Anesthesiology 121, 1248–1257. [DOI] [PMC free article] [PubMed] [Google Scholar]
Associated Data
This section collects any data citations, data availability statements, or supplementary materials included in this article.


