Abstract
Resonance Raman spectroscopy (RRS) and reflection spectroscopy (RS) are optical methods applicable to the non-invasive detection of carotenoids in human skin. RRS is the older, more thoroughly validated method, whereas RS is newer and has several advantages. Since collective skin carotenoid levels serve as a biomarker for vegetable and fruit intake, both methods hold promise as convenient screening tools for assessment of dietary interventions and correlations between skin carotenoids and health and disease outcomes. In this manuscript, we describe the most recent optimized device configurations and compare their use in various clinical and field settings. Both RRS and RS devices yield a wide range of skin carotenoid levels between subjects, which is a critical feature for a biomarker. Repeatability of the methods is 3–15% depending on the subject’s skin carotenoid level and the uniformity of its local distribution. For 54 subjects recruited from an ophthalmology clinic, we first checked the validity of the relatively novel RS methodology via biochemical serum carotenoid measurements, the latter carried out with high performance liquid chromatography (HPLC). A high correlation between RS skin and serum HPLC carotenoid levels was established (R = 0.81; p < 0.001). Also, a high correlation was found between RS and RRS skin levels (R = 0.94 p < 0.001). Subsequent comparisons of skin carotenoid measurements in diverse age groups and ethnicities included 569 Japanese adults, 947 children with ages 2–5 screened in 24 day care centers in San Francisco, and 49 predominantly Hispanic adults screened at an outdoor health fair event. Depending on the particular subject group, correlation coefficients between the RRS and RS methods ranged between R ~ 0.80 and R ~ 0.96. Analysis of the Japanese screening showed that, on average, skin carotenoid levels are higher in women compared to men, skin levels do not depend on age, and tobacco smokers have reduced levels versus non-smokers. For the two most ethnically diverse groups with widely varying melanin levels, we investigated the effect of dermal melanin on RS and RRS skin carotenoid levels. The analysis revealed that large variations in skin carotenoid levels remain detectable independent of the particular melanin index. This behavior is consistent with the absence of melanin effects on the skin carotenoid levels generated with the instrument configurations. The RS method has an advantage over RRS in its relative simplicity. Due to its detection of skin reflection over a wide spectral range from the near UV to the near IR, it has the unique ability to quantify each of the major tissue chromophores and take them into account in the derivation of skin carotenoid levels.
Introduction
Resonance Raman spectroscopy (RRS) and reflection spectroscopy (RS) provide noninvasive optical methodologies for rapid quantitative assessment of carotenoids in human skin [1]. Since collective skin carotenoids are a biomarker of vegetable and fruit (V/F) intake [2], both methods hold promise for applications in nutrition science and epidemiology, where large populations can be easily screened for tissue carotenoid status. This will benefit large scale V/F intervention studies as well as investigations into potential correlations between V/F intake and health and disease outcomes [3].
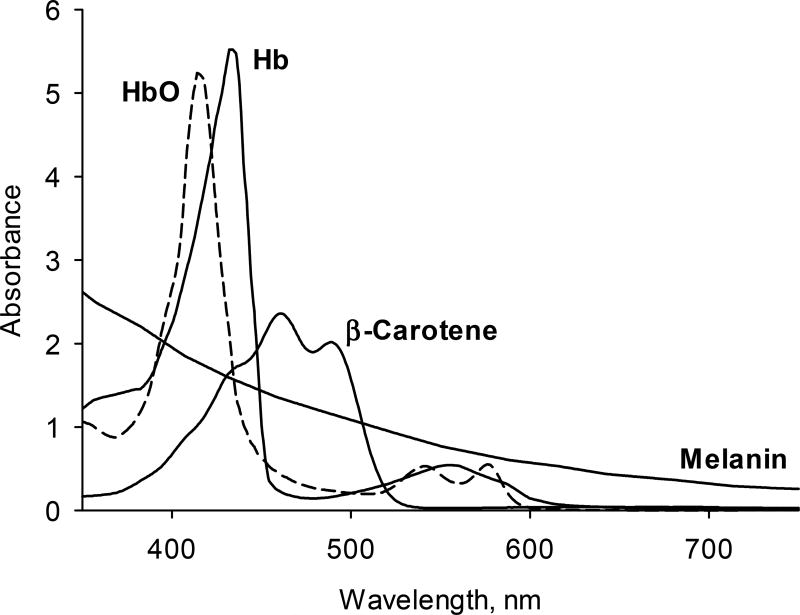
Both methods face the challenge of quantifying the absorption strength of dermal carotenoids in the presence of other strongly absorbing and scattering tissue chromophores. Shown with their characteristic spectral profiles in Fig. 1, chromophores besides carotenoids include oxy-and deoxy-hemoglobin, both absorbing in closely overlapping bands in the 500–600 nm wavelength range and also in their higher energy transitions around 410 nm. Furthermore, they include melanin, which steadily increases about 5-fold in absorption strength from the near infrared region at 750 nm to the blue region at 420 nm, and on top of these absorbers there is also strong background scattering from tissue cells. An optical window with relatively small overlap by other chromophores exists for the detection of the skin carotenoids in the 460 to 520 nm wavelength range.
Fig. 1.
Schematic absorption spectra of chromophores in human skin, including transitions from oxy- hemoglobin, HbO, de-oxyhemoglobin, Hb, β-carotene, and melanin. A spectral window for the detection of carotenoids with relatively weak absorptions from Hb/HbO exists in the 460–520 nm wavelength range.
The RRS method [4, 5, 6] uses a laser or spectrally narrowed LED light source that excites the tissue carotenoids in their absorption band in the blue wavelength region. This resonant excitation leads to strongly enhanced Raman scattering by the vibrating carbon backbone that is common to all carotenoids and generates frequency-shifted light intensity peaks in the green wavelength range. Superimposed on a spectrally broad and strong skin fluorescence background that is simultaneously generated by the excitation light, the sharp Raman lines can be retrieved and quantified with a suitable high-sensitivity, high dynamic range, detection scheme. The Raman line intensities scale linearly with the carotenoid concentrations at their physiological skin levels (0.5–1.5 microgram per gram of skin tissue) [7].
Following proof of concept, the RRS method quickly found exclusive use in the nutritional supplement industry, where to date more than 10,000 portable instruments are in use to monitor the efficacy of carotenoid-containing nutritional supplement formulations (Biophotonic Scanner, NuSkin/Pharmanex, Inc.). After completion of comprehensive validation studies [2,7,8,9, 10] via skin biopsy [2,7] (with correlation coefficients R = 0.66 [2] and R = 0.95 [7], respectively), fasting serum [2,8,9] (R = 0.62, R = 0.78, and R = 0.82, respectively), two-month food frequency V/F questionnaire [2] (R = 0.52), and a controlled feeding study [10], the RRS method is more recently also finding use in nutrition science [10–15] and medical research studies investigating the role of carotenoids in human health [16–23].
A relatively simple optical alternative for the detection of skin chromophores is based on reflection spectroscopy, RS. Essentially, RS needs only a low-power, white light source for excitation, and it can take advantage of the relatively strong reflection signals in the design of the detection optics. The RS method was first explored for the purpose of skin carotenoid detection by Stahl and co-workers [24–26]. They modeled the skin chromophore distribution with a multicompartment model and derived carotenoid levels from the reflection spectra with a first-principles approach of diffusive light transport in turbid media. Also, they demonstrated a statistically significant correlation between baseline skin and serum carotenoid levels in a 12-week β-carotene supplementation study and documented an apparent rise in response to supplementation in a small group of volunteer subjects [25].
Another variant of the RS method is based on skin color saturation measurements [27]. In this approach, one of the color tri-stimulus values, the b*-value, is derived from reflection values measured for selected red, green, and blue spectral regions, or, in advanced devices, from the whole visible spectrum. The sensitivity and specificity to the carotenoid absorptions is significantly confounded, however, by the combined absorption and scattering effects of blood and melanin, which leads to carotenoid results with relatively large errors.
Recently, we introduced a pressure mediated variant of RS that measures the reflected light in a condition where the skin is intentionally put in physical contact with the light excitation and collection optics [28]. Blood is temporarily pushed away from the measured tissue volume with the help of a spring-loaded cover, and through this resulting skin blanching effect the confounding hemoglobin absorptions are reduced to a controlled, stable minimum [28]. Residual de-oxy hemoglobin levels along with static skin melanin absorption levels and intrinsic tissue scattering are quantified with a spectral de-convolution algorithm and taken into account in the calculation of the skin carotenoid absorption strength [28]. The latter is obtainable in optical density units, which correlate directly with the carotenoid concentration in the measured tissue volume [28].
Just like with the RRS method, preferred skin tissue sites for the RS methodology are sites with minimal melanin content across all ethnicities, such as the heel of the palm, the tip of a finger, or the heel of the foot. In its current implementation, the RS method quantifies all chromophores in the skin and takes them into account in the calculation of a composite score for all carotenoid species absorbing in the 480 nm range. The carotenoids contributing to the skin absorption in this range include α- and β carotenes, β-cryptoxanthin, lycopene, lutein and zeaxanthin.
In initial validation tests, RS derived skin carotenoid levels were compared with direct transmission measurements of excised thin, bloodless, heel skin slivers. Excellent quantitative agreement could be demonstrated for total carotenoid absorption strengths and also for the characteristic vibronic absorption band substructure that is maintained in the skin tissue environment [28]. Furthermore, in comparisons with the RRS method, high correlations were already seen in a small cross-sectional study (10 volunteer subjects; R = 0.92), and a very similar skin carotenoid uptake kinetic was observed in a study testing supplementation of a regular diet of 43 volunteer subjects with high levels of β-carotene and lycopene [28].
In this manuscript, we describe recently developed optimized portable instrument configurations, report on comprehensive validation studies in larger and more ethnically diverse cohorts, and demonstrate screening applications. Importantly, the correlation between RS based skin carotenoid scores and carotenoid levels in serum is investigated for a statistically significant number of subjects; RS skin carotenoid scores are compared with RRS scores for several subject groups measured in clinical and field settings, and the influence of skin melanin levels on RS derived carotenoid levels is explored in two ethnically diverse cohorts with widely varying melanin levels.
Optical Devices and HPLC Serum Analysis
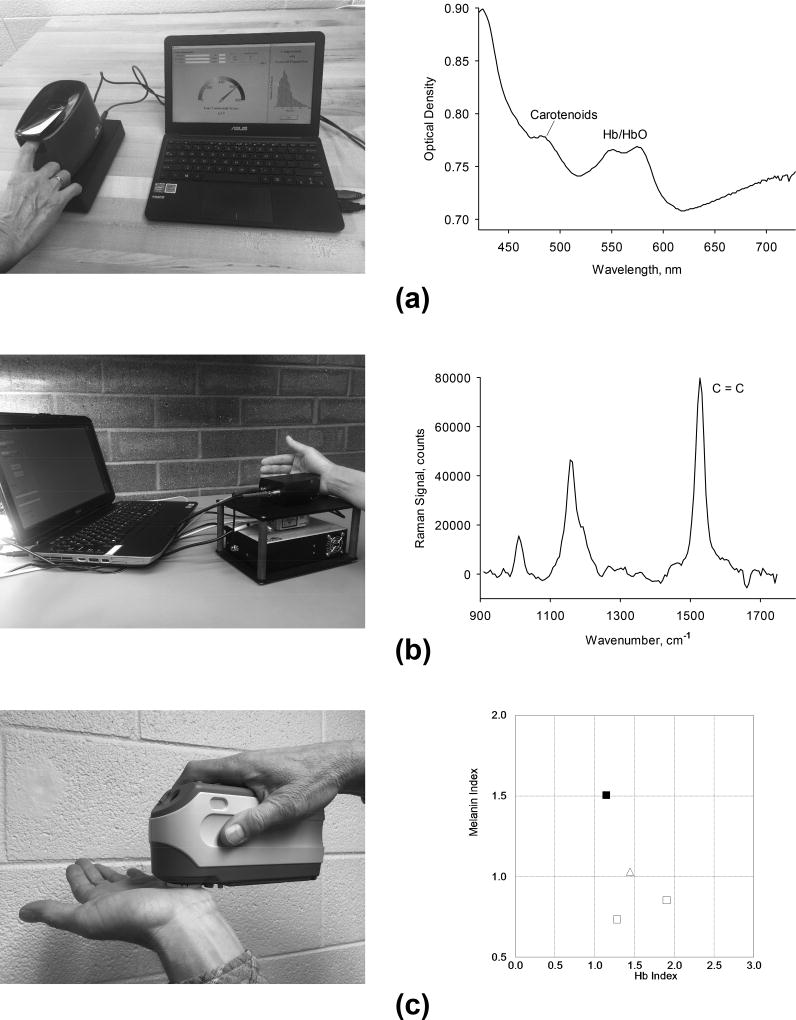
All skin measuring devices used in these studies are shown in Fig. 2. The pressure mediated RS device, shown in Fig. 2(a) along with a representative skin spectrum, uses a single white light LED source which is projected as a small light disk onto the skin area of interest, typically the tip of the index finger or the inner palm of the hand. The measured tissue area is in direct contact with a convex lens surface, which temporarily pushes the blood away from the measured tissue volume. When measuring the skin of a fingertip, the finger is gently pressed against the convex lens surface with the help of a spring-loaded cover. When measuring the inner palm, the hand is simply rested on the lens surface during the measurement, ensuring reduced blood perfusion by the weight of the hand. Light that is diffusively reflected from the skin surface is detected by a spectrograph/CCD detector array configuration. A laptop computer is used for light exposure control, acquisition, processing and display of the reflection spectra. Furthermore, a skin carotenoid score (“reflection score”) is displayed on a scale from 0–800, an index for the residual tissue blood is displayed on a scale from 0–3, and an index for skin melanin is displayed on a scale from 0.5–2.0. All scores are directly proportional to the absorption strength/optical density of the respective skin chromophore. A single reflection measurement takes 10 seconds.
Fig. 2.
Portable optical devices used for skin chromophore measurements. (a) reflection spectroscopy device and typical reflection spectrum in 400–750 nm wavelength range (Veggie Meter®, Longevity Link Corp.); (b) resonance Raman spectroscopy device and typical Raman spectrum in 900–1750 cm−1 range; (c) device based on diffuse reflection with integrating sphere (Model CM2500d, Konica Minolta, Inc.) with display of melanin and Hb indices.
Depending on the scope of the study, the RS device can be operated in single-scan mode or in an averaging mode that calculates the average score for three sequential measurements. In averaging mode, the finger is removed after each measurement, and 30 sec intervals are used to re-establish normal blood flow through the measured tissue location. The averaging mode generates an up to a two-fold higher accuracy and repeatability of the skin carotenoid scores since it averages the scores over the three slightly differing tissue sites, each having a slightly different inherent skin carotenoid concentration due to the spatial inhomogeneities of the tissue carotenoids [7].
The RRS device, shown in Fig. 2(b) along with a representative skin spectrum, consists of a 488 nm solid-state laser, a spectrograph/CMOS array configuration for detection of the backscattered light, and a laptop computer for light exposure control, data acquisition, processing, and display of the Raman spectra and corresponding carotenoid score. Excitation and backscattered light is routed to and from the skin tissue with two optical fibers. A light delivery and collection module is placed again in direct contact with the skin tissue and gently pressed against the tissue. The backscattered light is filtered to reject the laser excitation light, spectrally dispersed by a compact, small focal length spectrograph, and recorded with the interfaced CCD array. Using a custom developed software algorithm, the recorded spectra are displayed on the computer monitor and analyzed for the intensity of the strongest RRS line at the carbon double bond (C=C) frequency at 1525 cm−1, which under 488 nm excitation occurs at 527 nm. RRS spectra with high signal to noise ratios (approximately 50:1 in best cases) can be obtained with ~9 mW exposure for 30 seconds at a laser excitation disk at the skin surface of ~ 2.5 mm diameter [7]. RRS carotenoid intensities are shown on a scale from 0 to 1000 in relative intensity units (“Raman scores”). Absolute calibration of the Raman scores is possible by comparing the scores with HPLC derived carotenoids concentrations in biopsied tissue samples [7]. For the used instrument configuration, this results in the relation C [µg/g] = 4.3 ·10−5 · I, where I is the Raman score and C is the carotenoid concentration counted in micrograms of carotenoids per gram of tissue [7,29].
For independent skin melanin measurements, we used a Konica Minolta device, shown in Fig. 2(c) along with its display screen. The device is based on diffuse reflection spectroscopy with an integrating sphere. A xenon flash lamp is used for excitation, a spectrograph/photodiode array (PDA) configuration for detection. The tissue area of interest is placed against an 8 mm diameter opening in the sphere for non-contact measurements. Melanin indices are derived from the relative contribution of melanin to the total spectral reflection response using a proprietary algorithm. The results are displayed on an external computer monitor.
For HPLC analysis of blood draws, chemical standards of lutein, zeaxanthin, α-carotene, β-carotene, lycopene 3’oxo-lutein, and β-cryptoxanthin were used, obtained as gifts from Kemin Health (Des Moines, Iowa), DSM (Kaiseraugst, Switzerland) and Dr. Fred Khachik (University of Maryland, Baltimore, MD). Organic solvents were HPLC grade from Fisher Scientific (Hampton, NH). Serum (0.2 mL) was extracted using ethanol containing 0.1% butylated hydroxytoluene (BHT): ethyl acetate (4:10, v/v), followed by hexane extraction. The organic extracts were evaporated to dryness by flushing with inert gas, and the residue was reconstituted in methanol: methyl tert-butyl ether (MTBE) (80:20, v/v) and centrifuged at 2000 g before analysis.
The separation of carotenoids was carried out on a Surveyor Plus HPLC system (Thermo Scientific) equipped with an autosampler and PDA detector, on a C30 column (YMC Europe GmbH, Germany, 250 × 4.6 mm i.d) at a flow rate of 1.0 ml/min. A linear gradient of methanol and MTBE (%methanol @ min: 95 @ 0; 70 @ 20; 40 @ 30; 5 @ 40; 95 @ 45; 95 @ 50) was used as mobile phase, and the column was maintained at room temperature with PDA monitoring at 450 nm. Peaks were identified and confirmed using PDA spectra and by co-elution with authentic standards as necessary. Standard solutions of each individual carotenoid were prepared and their concentrations determined spectrophotometrically using published extinction coefficients. They were then injected in different volumes so as to achieve final injected amounts ranging from 0.1 to 100 ng. The serum carotenoid concentrations were quantified using standard curves derived from the available carotenoid standards.
Validation Studies
For validation studies we recruited 54 subjects from a diverse cohort of patients and staff at a tertiary care eye clinic in Utah. All participants read and signed an IRB-approved consent form prior to skin measurements and blood draws. They also filled out a brief demographic and dietary supplement survey. A summary of the demographics along with health and supplement information is included in Table 1. Ocular health status was assessed by participating physicians at the eye clinic.
Table 1.
Demographics, Health, and supplementation information
| Utah | Hamamatsu | ||
|---|---|---|---|
|
| |||
| Demographics | Males (total) | 24 | 332 |
| Females (total) | 30 | 237 | |
| Age (y), Mean ± SD | 54 ± 19 | 69 ± 15 | |
| Age Range (y) | 13 to 81 | 6 to 98 | |
|
| |||
| Race | Caucasian | 53 of 54 | 0 of 569 |
| Asian | 0 of 54 | 569 of 569 | |
| African American | 1 of 54 | 0 of 569 | |
|
| |||
| Smoking Status | Former Smoker | 9 of 54 | 188 of 569 |
| Current Smoker | 2 of 54 | 68 of 569 | |
| Non-Smoker | 43 of 54 | 312 of 569 | |
| Unknown | 0 of 54 | 1 of 569 | |
|
| |||
| Diabetic Status | Non-Diabetic | 39 of 54 | 471 of 569 |
| Diabetic | 4 of 54 | 98 of 569 | |
| Unknown | 11 of 54 | 0 of 569 | |
|
| |||
| Lens Status | Pseudophakic | 5 of 54 | unknown |
| Clear/ Not Visually Significant | 36 of 54 | unknown | |
| Visually Significant Cataract | 2 of 54 | unknown | |
| Unknown | 11 of 54 | unknown | |
|
| |||
| Diagnosis | Normal | 11 of 54 | 129 of 569 |
| Eye pathologies | 32 of 54 | 440 of 569 | |
| unknown | 11 of 54 | 0 of 569 | |
|
| |||
| On Oral Supplements | 32 of 54 | 120 of 569 | |
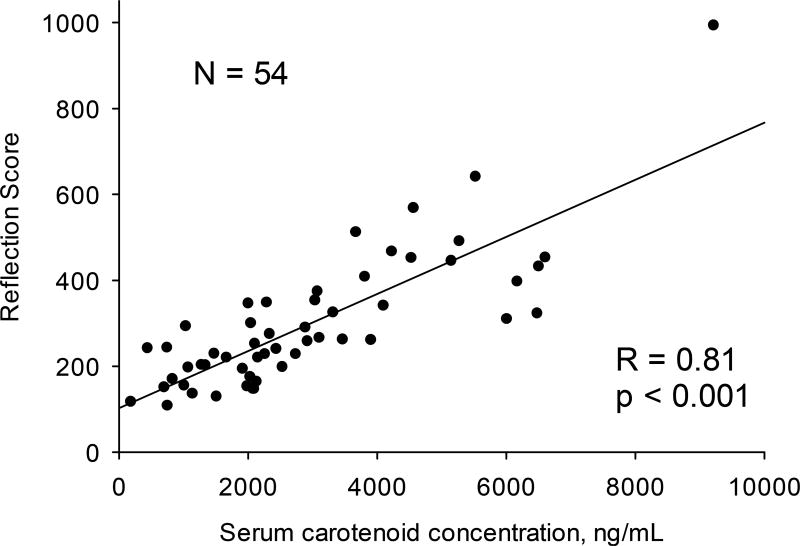
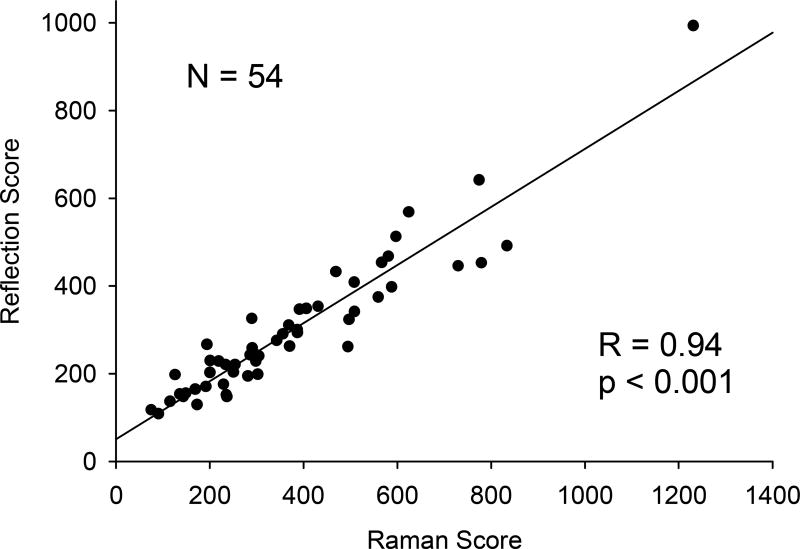
A plot of RS skin carotenoid scores versus total serum carotenoid concentration in Fig. 3 demonstrates a high linear correlation (R = 0.81; p < 0.001). In Fig. 4, RS skin carotenoid scores are compared with RRS scores. In both cases, the inner palm at the top of its heel was measured. The regression line for the 54 subjects remains linear over the large range of scores and results in very high correlation coefficient (R = 0.94; p < 0.001).
Fig. 3.
Skin carotenoid scores by RS (“reflection scores”) versus serum carotenoid concentrations by HPLC for 54 volunteer subjects. Tissue site: palm.
Fig. 4.
Skin carotenoid scores by RS versus skin carotenoid scores by Resonance Raman spectroscopy (RRS) for 54 volunteer subjects. Tissue site: palm.
Repeatability of optical skin carotenoid measurements
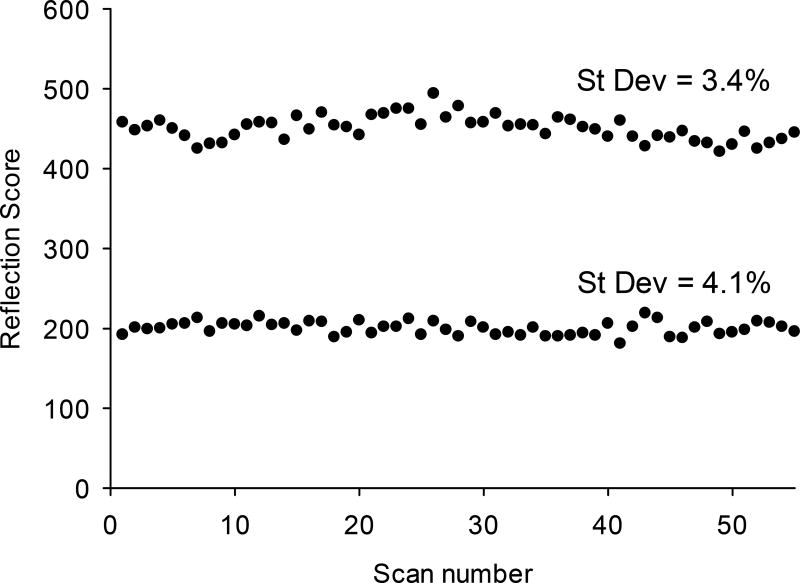
To explore the repeatability of the skin carotenoid measurements by RS, we recruited two volunteer subjects with relatively high and low skin carotenoids, respectively, and collected sequential single-scan measurements over the course of two consecutive days. The results are plotted in Fig. 5, showing relative standard deviations of 3.4% and 4.1%, respectively, for a total of 55 scans per subject. These results compare favorably with repeatability results for our previously described research grade RRS device [7], which produced relative standard Raman score deviations of ~1 to 4% [6].
Fig. 5.
Repeatability of RS skin carotenoid scores, comparing two subjects with relatively high score (a) and low score (b). Average scores were 460 and 200, respectively, with corresponding standard deviations of 3.4 and 4.1%. The standard deviation increases with lower score, consistent with the reduced signal to noise level.
Between subject variations; age, gender, and smoking effects
To demonstrate the clinical utility of the RS device, we used it in a large-scale clinical epidemiology study with 569 enrolled subjects carried out at the eye clinic of the Hamamatsu Seirei Hospital, Japan. The study was approved by the Institutional Review Board of the Hospital. Demographics along with ocular health status data for this group are included in Table 1.
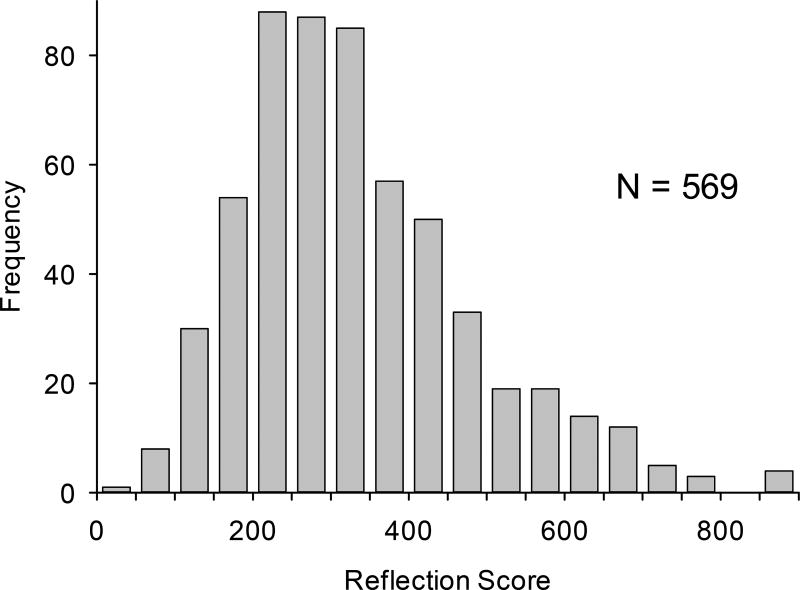
The histogram of RS scores for the 569 subjects, shown in Fig. 6, reveals a slightly skewed, near-normal, distribution with scores ranging from 32 to 892, half width of ~300, and average score of 335. The large half width shows that there is adequate variation in skin carotenoid status as assessed by RS. Compared to the average score for the Utah group, which was 297, the average for the Japanese group is slightly higher.
Fig. 6.
Histogram of skin carotenoid scores by RS for 569 Japanese subjects recruited from an eye clinic. In agreement with a biomarker, the skin carotenoid scores via RS vary widely between subjects, from near zero to near 900. The average score for this population is 300; the distribution is near-normal, with a slight skew to higher levels.
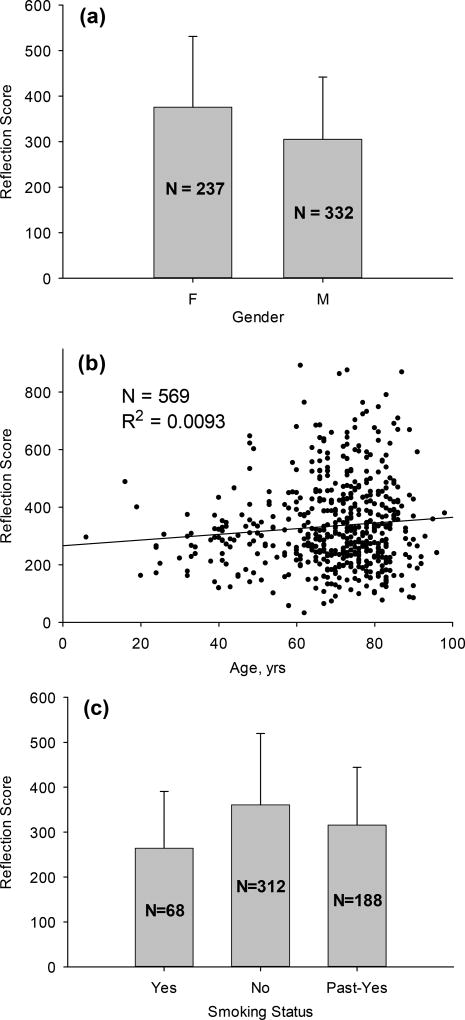
Taking advantage of the large number of subjects, we analyzed the reflection scores versus dependence on gender, age and smoking status. The results are shown in Fig. 7, revealing that skin carotenoid scores are about 23% higher in females compared to males (p < 0.001), that they do not depend on age (very low correlation coefficient R2 = 0.009), and that they are significantly lower (~37%) in current tobacco smokers relative to past smokers (p < 0.001). These findings are in agreement with previous results obtained in several epidemiological studies with the RRS method of skin carotenoid assessment [29].
Fig. 7.
Dependence of skin carotenoid scores (a) on gender, (b) age, and (c) tobacco smoking status. Skin carotenoid scores are higher in females compared to males, have no dependence on age, and are lower in active tobacco smokers relative to non-smokers and past smokers. Vertical bars above rectangles indicate the width of the respective subject distribution.
The self-reported intake of oral lutein supplements permits a comparison of RS scores between the screened supplementing and non-supplementing Hamamatsu subjects. The results are shown in Table 2. For the 120 subjects on supplementation, the mean RS score was 413, and for the 446 non-supplementing subjects the score was 313. This finding shows that selective lutein supplementation leads to about 32% higher skin carotenoid levels on average and this effect can be picked up via RS detection.
Table 2.
Statistically significant differences in average RS skin carotenoid scores between lutein supplementing and non-supplementing Hamamatsu subgroups (T-test: p < 0.001).
| Lutein Supplementation | ||
|---|---|---|
| No | Yes | |
| N | 446 | 120 |
| Mean | 313 | 413 |
| Median | 290 | 391 |
| Distribution Width | 139 | 160 |
Skin carotenoid screening of children in day-care centers
Most children in the U.S. are not meeting the Dietary Guidelines recommendations for V/F [30]. Valid, objective, and noninvasive assessment of V/F intake that is feasible for use in community-based settings with children would be very valuable for assessing the efficacy of programs that aim to change dietary behaviors in this population [31].
Previous investigations in this context have established the feasibility of using RRS in screening of preschool children. A near-normal distribution of inter-individual variability in dermal carotenoid status for a sample of 381 children was obtained, and parent-reported V/F intake was identified as a major factor associated with the biomarker in this population [12]. Another study, involving children with ages 10 to 17 (n = 45), established a correlation between skin and serum carotenoids (R2 ~ 0.5) [13], and also reported a correlation between skin carotenoids and reported food intake (R2 = 0.32) [13]. These correlations were largely confirmed in a third study, which enrolled 128 children aged 8–17, and found respective correlations with R = 0.62 and R = 0.4 [14].
Based on RRS screening as a non-invasive, feasible, and validated method for assessing V/F intake in preschool children, optical monitoring of skin carotenoids was added to routine public health screenings for children ages 2 to 5 years in San Francisco, beginning in 2016 [32, 33]. Families consented to the health screening, including use of data for public health program planning and evaluation, at the time of enrollment into child care. Families and children could opt out or decline screening at any time. The Utah IRB reviewed and approved the analysis of de-identified program data from SF health screenings.
Initially, both RRS and RS skin carotenoid screening was performed at three participating day care centers. Subsequently, screening with only the RS device was expanded to 24 day-care centers, serving approximately 1,000 children annually (n=947 in Fall of 2016). Skin carotenoid scores were collected by two trained health workers, who followed a formal screening protocol that included a) cleaning of the contact lens of the device with an eye glasses cleaner, b) checking of each child’s finger for absence of ink, c) cleaning of the fingers with a Purell wipe, d) opening the finger cover to show the absence of any needles, e) instructing each child to place one index finger in the device with the cover closed over the finger, e) ensuring the finger completely covered the contact lens before closing the lid, f) asking the child to count to ten, e) taking the finger off the contact lens once the device’s “scanning in progress” message was complete, f) recording the score that was displayed as an integer between 0 and 800, g) using an alternate finger if the index finger had a cut or scar.
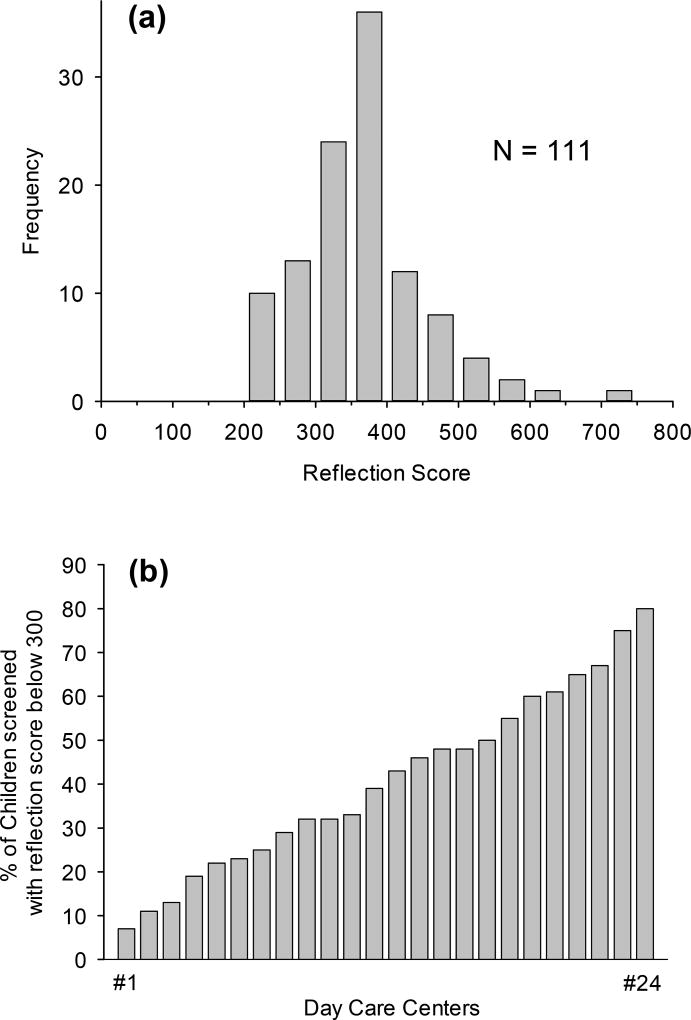
In Fig. 8(a), an example histogram of skin carotenoid scores via RS is shown for 111 children scanned at one of the participating child care centers in which the children scored relatively high. The average score is 380, with the distribution showing a strong skew to higher scores. Screening of a total of 947 children in 24 participating child care centers revealed large differences in average scores between centers. Using as a metric the percentage of children scoring below 300, the ranking order shown in Fig. 8b was obtained. In Fall 2016, in the first 6 centers, less than 25% of the children had scores below 300; in the last 7 centers, over 50% of the children had scores below 300. Between Fall 2016 and Spring 2017, significant variation in change in score was observed by race-ethnicity and income level [34]. The results are used to promote higher V/F consumption in the child care centers.
Fig. 8.
(a) Histogram of skin carotenoid scores via RS for 111 children scanned at one of the participating child care centers in which children scored relatively high. Average score is 380, with strong skew of distribution to higher levels. (b) Screening results for a total of 947 children, measured in 24 participating child care centers, and ranked in order of percentages of children with scores below 300. In the first 6 centers, less than 25% of the children had scores below 300; in the last 7 centers, over 50% of the children had scores below 300. The results are used to promote higher V/F consumption in the child care centers.
Skin carotenoid Screening at Outdoor Health Fair Event
To demonstrate the utility of the optical devices for screening applications in outdoor settings, we deployed all three devices at a summer health fair organized by the Texas A&M University Colonias Program at a community park in a small community on the outskirts of El Paso, Texas in the summer of 2016. The project was approved by the Texas A&M University Institutional Review Board.
Along the US-Mexico border, colonias are unincorporated areas where residents live without one or more of the major types of infrastructure such as potable water, paved roads, sewage system, storm drainage, and/or electricity. Texas A&M regularly holds health fairs for colonias residents to increase access to a wide array of social programs including health promotion programs. The Paso del Norte Institute for Healthy Living at UTEP helps evaluate Texas A&M Colonias health promotion programming that targets eating more fruits and vegetables by measuring skin carotenoids using RS.
A total of 49 colonias residents participated in measurements with all three optical devices; devices were kept in the shade to reduce potential systematic error. Skin carotenoid scores were collected for two tissue sites, finger and palm; melanin levels were measured with the Konica/Minolta device with the palm chosen as a convenient tissue site. Participant self-report indicated the sample was 77% female (n=40) and 90% Hispanic (n=47).
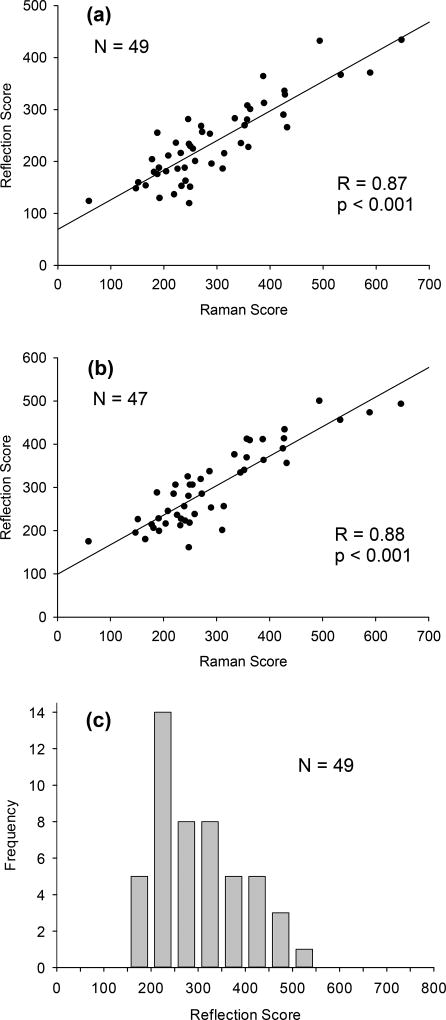
Plots of RRS vs RS scores for palm and index finger are shown in Fig. 9, revealing linear relationships with high correlation coefficients for both tissue sites (R = 0.87, p < 0.001 for palm; R = 0.88, p < 0.001 for finger. A histogram of the RS scores reveals a distribution with an average score of 299, which is roughly comparable to the average score of 335 for the Japanese group (Fig. 6).
Fig. 9.
Comparison of carotenoid levels measured with RS and RRS devices at an outdoor screening event. a) 49 subjects; tissue site: palm; b) 47 subjects; tissue site: index finger. High skin score correlations are obtained between the two methods for either tissue site; (c) histogram of RS skin scores, revealing an average score of 305 and strongly skewed distribution towards higher scores. The average score of this population is similar to the Japanese population (Fig. 6), but slightly lower compared to the example in Fig. 8 for children in a day care center.
Investigation of melanin effects
An important question in the optical measurement of skin carotenoid is the potentially confounding influence of melanin. In the RRS method, melanin can be expected to attenuate both the blue excitation light as well as the backscattered Raman-shifted light, which would lead to an underestimation of RRS derived skin carotenoid scores in subjects with higher skin melanin levels. In the RS method, melanin could cause an artifactually increased carotenoid absorption, which would lead to an overestimation of RS derived carotenoid levels in subjects with high melanin levels.
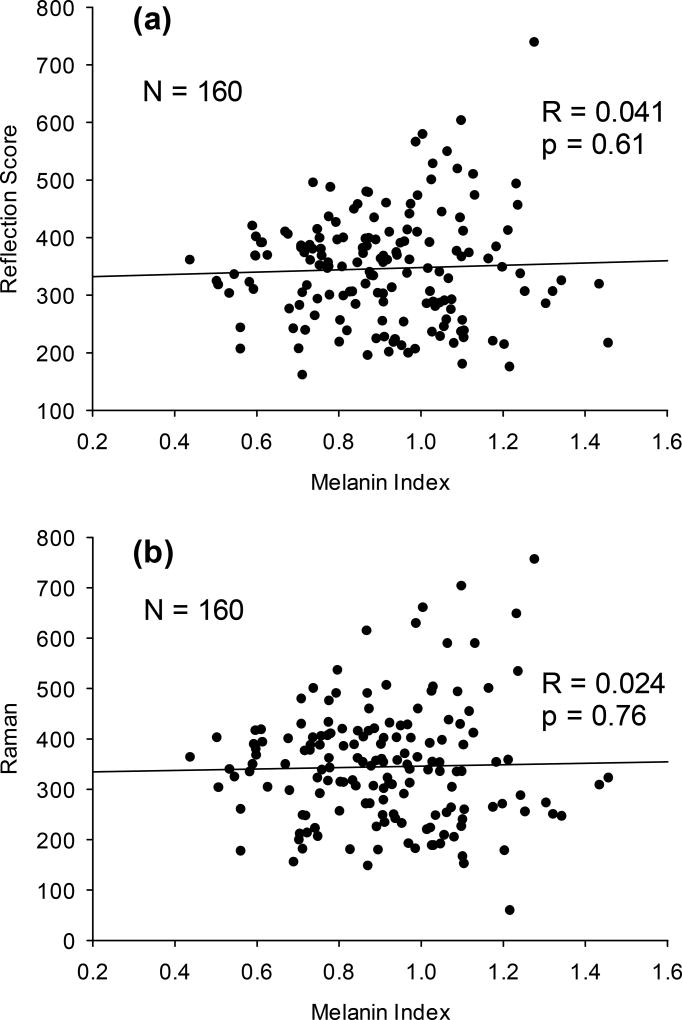
To test the spectral deconvolution algorithms used in our RS and RRS device configurations, we measured melanin levels independently with the Konica Minolta device and investigated RS and RRS scores as a function of melanin level in 160 subjects with a highly diverse range of ethnicities, as evidenced by Konica Minolta skin melanin indices ranging from 0.4 to1.5. As a most convenient tissue site, the palm was chosen. The results are plotted in Fig. 10 and reveal that for any subject/melanin index, the RS or RRS score can vary over a wide range. At high melanin indices in the 1.2 – 1.3 range, for example, the RS scores can range from about 150 to 700. Attempting statistical correlations, respectively, between RS or RRS scores and melanin indices, the analysis yields only very low correlation coefficients and very high p-values, with R = 0.04; p = 0.61 for RS and R = 0.024; p = 0.76. Statistically significant correlations with melanin levels are therefore absent, or, in other words, there is no indication that subjects with high melanin levels have overestimated RS carotenoid scores (Fig. 10a) or underestimated RRS carotenoid scores (Fig. 10b).
Fig. 10.
Absence of melanin effects. Skin carotenoid scores by RS (a) and RRS (b) versus skin melanin indices measured, respectively, for 160 subjects with widely varying skin melanin levels. Skin melanin indices were measured with a Konica Minolta reflection instrument. The low correlation coefficients and high p-values in both plots prove that RS and RRS skin carotenoid scores for the used devices are not affected by melanin absorptions.
Skin carotenoid screening in Dietary Intervention Studies
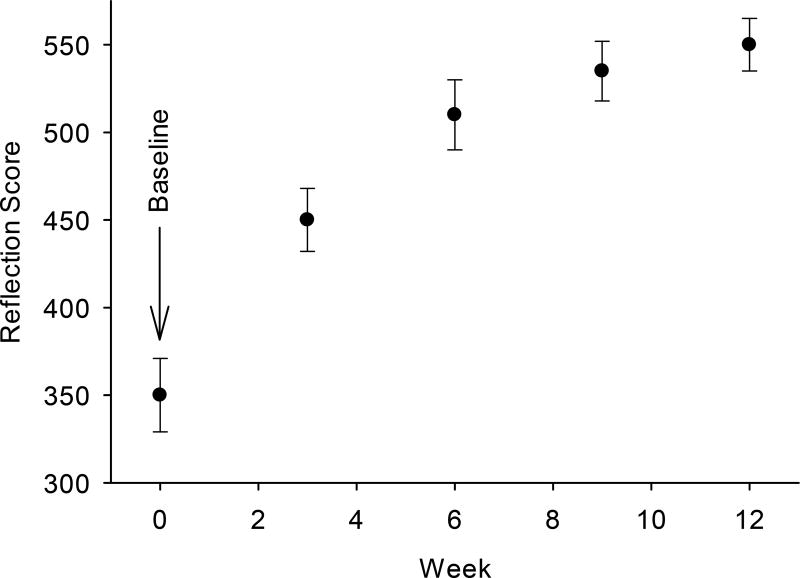
Figure 11 shows the anecdotal effects of drinking four 5.5 oz cans of vegetable juice (Campbell’s V8) per week on RS scores, measured in triplicate once each week for 3 months in one individual. A can of juice is equivalent to approximately one cup of mixed vegetables, mostly tomatoes. Tomatoes are rich sources of lycopene, and a 5.5 oz serving contains additional 14.5 mg/mixed carotenoids per day, most of which is in the form of lycopene, a potent antioxidant. As Americans consume 9 mg/mixed carotenoids/day, with half of that from lycopene, drinking the juice represents about a doubling of daily carotenoid intake. Skin carotenoid levels almost doubled during the 3 months, although there was an apparent leveling off between 10 and 12 weeks. However, 50% of the increase occurred between baseline and the first measurement at 3 weeks. Again, this indicates that RS can be used to quickly assess the effectiveness of interventions to increase V/F intake.
Fig. 11.
RS skin carotenoid scores measured over the course of 12 weeks for a subject consuming four 5.5 oz cans of tomato juice per week (Campbell’s V8). Skin scores increase from a baseline level of 350 to 530 over 3 weeks, finally reaching saturation. The plot demonstrates the sensitivity of the RS device for the tracking of increasing skin carotenoid levels upon dietary supplementation with common vegetable juice.
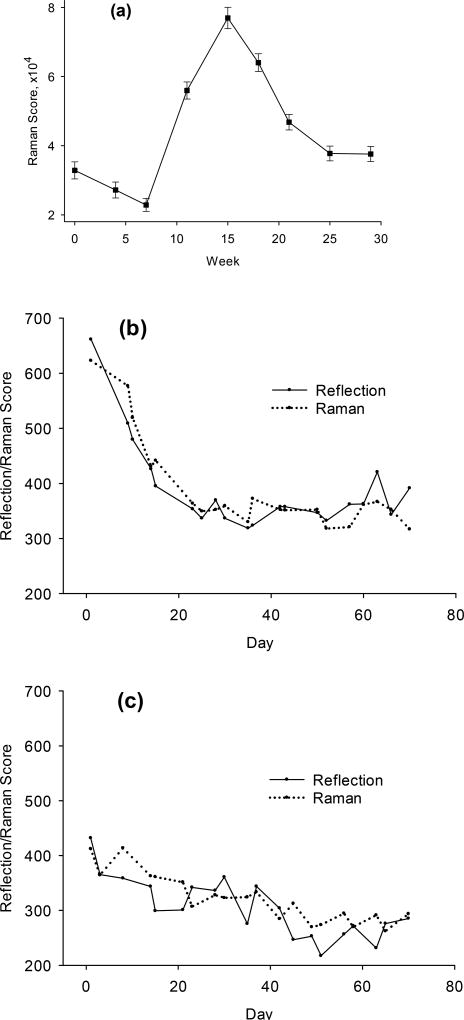
Part of the validation of the RRS methodology for skin carotenoid measurements was a recent study that showed high RRS/HPLC plasma correlations for subjects participating in controlled dietary intervention phases [10]. The study was approved by the Institutional Review Board of the University of North Dakota. The phases included two prescribed diet phases low in carotenoid-rich V/F, a phase with a provided diet rich in carotenoid-containing V/F, and a subsequent normal diet phase. We added RS skin carotenoid measurements during the last two phases in which the subjects’ high carotenoid levels returned over time to their pre-intervention levels. In Figs. 12, examples of RS and RRS skin carotenoid scores are shown for the depletion phase of the study for two subjects, one having a relatively high skin carotenoid level, and the other subject having the lowest level among the subjects. The RRS method and the RS method are seen to quantitatively monitor the declining skin carotenoid levels over time in a very similar fashion.
Fig. 12.
(a) Average RRS skin carotenoid scores and serum plasma concentrations measured over time in a controlled feeding intervention study (adapted from [10]). (b) and (c) Examples of RS and RRS skin carotenoid scores in depletion phase of study (day 0 corresponds to week 5 of study). RS scores are shown on solid line, RRS scores on dotted line. Tissue site for RS: thumb; tissue site for RRS: palm; b) example for subject with relatively high skin carotenoid score at the start of the depletion phase; c) subject with lowest skin carotenoid score.
Conclusion
In multiple screening settings, both RRS and RS have demonstrated several key biomarkers of V/F intake. RRS is highly correlated with carotenoid concentrations in skin biopsies and blood, which is widely held to be the best biomarker of V/F intake. RS, a newer and more portable and robust method, has been shown to have a wide variation in multiple populations, including young children. It is also highly correlated to plasma carotenoid levels and to the currently still more widely-validated RRS. Although biologic and metabolic factors affect status biomarkers such as skin or blood carotenoid status, controlled feeding interventions have demonstrated that both RRS and RS respond strongly to changes in V/F intake. The preponderance of the evidence suggests that the developed optical device configurations are valid for assessing the change in intake of V/F during behavioral interventions targeting increased V/F intake. This represents a substantial improvement in cost, objectivity, and subject burden for both investigative and epidemiological studies.
Acknowledgments
We acknowledge NIH grants EY11600 and EY14800 and an unrestricted departmental grant to the Moran Eye Center by Research to Prevent Blindness. This research was also partially sponsored by the Seirei Hamamatsu General Hospital, Hamamatsu City, Japan, the United States Department of Agriculture, Agricultural Research Service 3062-51000-051-00D, and by Longevity Link Corporation. W. Gellermann, I. V. Ermakov, P. S. Bernstein, the University of Utah, and Longevity Link Corporation hold multiple patents on the use of resonance Raman and reflection spectroscopy for the measurement of carotenoids in the skin, eye, and other tissues. The views expressed herein do not necessarily reflect the official policies of the City and County of San Francisco; nor does mention of the San Francisco Department of Public Health imply its endorsement.
Footnotes
Publisher's Disclaimer: This is a PDF file of an unedited manuscript that has been accepted for publication. As a service to our customers we are providing this early version of the manuscript. The manuscript will undergo copyediting, typesetting, and review of the resulting proof before it is published in its final citable form. Please note that during the production process errors may be discovered which could affect the content, and all legal disclaimers that apply to the journal pertain.
References
- 1.Ermakov IV, Gellermann W. Arch. Biochem. Biophys. 2015;572:101–111. doi: 10.1016/j.abb.2015.01.020. [DOI] [PubMed] [Google Scholar]
- 2.Mayne ST, Cartmel B, Scarmo S, Lin H, Leffell DJ, Welch E, Ermakov I, Bhosale P, Bernstein PS, Gellermann W. Am. J. Clin. Nutr. 2010;92:794–800. doi: 10.3945/ajcn.2010.29707. [DOI] [PMC free article] [PubMed] [Google Scholar]
- 3.Mayne ST, Cartmel B, Scarmo S, Jahns L, Ermakov IV, Gellermann W. Archives of Biochemistry and Biophysics. 2013;539:163–170. doi: 10.1016/j.abb.2013.06.007. [DOI] [PMC free article] [PubMed] [Google Scholar]
- 4.Ermakov IV, Ermakova MR, McClane RW, Gellermann W. Opt. Letters. 2001;26:1179–1181. doi: 10.1364/ol.26.001179. [DOI] [PubMed] [Google Scholar]
- 5.Hata TR, Scholz TA, Ermakov IV, McClane RW, Khachik F, Gellermann W, Pershing LK. Non-invasive raman spectroscopic detection of carotenoids in human skin. J. Invest. Dermatol. 2000;115:441–448. doi: 10.1046/j.1523-1747.2000.00060.x. [DOI] [PubMed] [Google Scholar]
- 6.Ermakov IV, Sharifzadeh M, Ermakova M, Gellermann W. Journal of Biomedical Optics. 2005;10(6):064028. doi: 10.1117/1.2139974. [DOI] [PMC free article] [PubMed] [Google Scholar]
- 7.Ermakov IV, Gellermann W. Arch. Biochem. Biophys. 2010;504:40–49. doi: 10.1016/j.abb.2010.07.023. [DOI] [PubMed] [Google Scholar]
- 8.Gellermann W, Zidichouski JA, Smidt CR, Bernstein PS. In: Carotenoids and Retinoids: Molecular Aspects and Health Issues. Packer L, Kraemer K, Obermueller-Jervic U, Sies H, editors. Chapter 6 AOCS Press; Champain, Illinois: 2005. pp. 86–114. [Google Scholar]
- 9.Zidichouski JA, Mastaloudis A, Poole SJ, et al. J Am Coll Nutr. 2009;28:687–93. doi: 10.1080/07315724.2009.10719802. [DOI] [PubMed] [Google Scholar]
- 10.Jahns L, Johnson LK, Mayne ST, Cartmel B, Picklo MJ, Ermakov IV, Gellermann W, Whigham LD. Skin and plasma carotenoid response to a provided intervention diet high in vegetables and fruit: Uptake and depletion kinetics. Am. J. Clin. Nutr. 2014;100:930–937. doi: 10.3945/ajcn.114.086900. [DOI] [PubMed] [Google Scholar]
- 11.Meinke MC, Darvin ME, Vollert H, Lademann J. Bioavailability of natural carotenoids in human skin compared to blood. Eur. J. Pharm. Biopharm. 2010;76:269–274. doi: 10.1016/j.ejpb.2010.06.004. [DOI] [PubMed] [Google Scholar]
- 12.Scarmo S, Henebery K, Peracchio H, Cartmel B, Lin H, Ermakov IV, Gellermann W, Bernstein PS, Duffy VB, Mayne ST. Skin carotenoid status measured by resonance Raman spectroscopy as a biomarker of fruit and vegetable intake in preschool children. Eur. J. Clin. Nutr. 2012;66:555–560. doi: 10.1038/ejcn.2012.31. [DOI] [PMC free article] [PubMed] [Google Scholar]
- 13.Aguilar SS, Wengreen HJ, Lefevre M, Madden GJ, Gast J. Skin carotenoids: a biomarker of fruit and vegetable intake in children. J. of the Acad. of Nutr. and Diet. 2014;114:1174–1180. doi: 10.1016/j.jand.2014.04.026. [DOI] [PubMed] [Google Scholar]
- 14.Nguyen LM, Scherr RE, Ermakov IV, Gellermann W, Jahns L, Keen CL, Miyamoto S, Steinberg FM, Young HM, Zidenberg-Cherr S. Evaluating the relationship between plasma and skin carotenoids and reported dietary intake in elementary school children to assess fruit and vegetable intake. ABB, special issue Carotenoids. 2015 doi: 10.1016/j.abb.2015.02.015. [DOI] [PubMed] [Google Scholar]
- 15.Jahns L, Roemmich J. Study design for a randomized controlled trial to increase the relative reinforcing value of vegetable consumption using incentive sensitization among obese and overweight people. Contemporary Clinical Trials. 2016;50:186–192. doi: 10.1016/j.cct.2016.08.011. [DOI] [PubMed] [Google Scholar]
- 16.Betz BB, Diaz J, Ring TA, Wade M, Kennington K, Burnett DM, McClane R, Fitzpatrick FA. Fiberoptic resonance Raman spectroscopy to measure carotenoid oxidative breakdown in live tissues. Cancer Prev. Res. 2010;3:529–538. doi: 10.1158/1940-6207.CAPR-09-0157. [DOI] [PubMed] [Google Scholar]
- 17.Rerksuppaphol S, Rerksuppaphol L. Carotenoid intake and asthma prevalence in Thai children. Pediatric Reports. 2012;4:e12. 44–47. doi: 10.4081/pr.2012.e12. [DOI] [PMC free article] [PubMed] [Google Scholar]
- 18.Ermakov IV, Ermakova MR, Bernstein PS, Chan GM, Gellermann W. Resonance Raman based skin carotenoid measurements in newborns and infants. J. Biophotonics. 2013;6:793–802. doi: 10.1002/jbio.201200195. [DOI] [PMC free article] [PubMed] [Google Scholar]
- 19.Chan GM, Chan MM, Gellermann W, Ermakov I, Ermakova M, Bhosale P, Bernstein P, Rau C. Resonance Raman spectroscopy and the preterm infant carotenoid status. J. Pediatr. Gastroenterol. Nutr. 2013;56:556–559. doi: 10.1097/MPG.0b013e318282a8fe. [DOI] [PMC free article] [PubMed] [Google Scholar]
- 20.Henriksen BS, Chan G, Hoffman RO, Sharifzadeh M, Ermakov IV, Gellermann W, Bernstein PS. Interrelationships between maternal carotenoid status and newborn infant macular pigment optical density and carotenoid status. Invest. Ophthalm. Vis. Science (IOVS) 2013;54:5568–5577. doi: 10.1167/iovs.13-12331. [DOI] [PMC free article] [PubMed] [Google Scholar]
- 21.Ermakov IV, Ermakova MR, Rosenberg TD, Gellermann W. Optical detection of carotenoid antioxidants in human bone and surrounding tissue. J. Biomed. Opt. 2013;18:117006-1–117006-8. doi: 10.1117/1.JBO.18.11.117006. [DOI] [PubMed] [Google Scholar]
- 22.Holt EW, Wei EK, Bennett N, Zhang LM. Low skin carotenoid concentration measured by resonance Raman spectroscopy is associated with metabolic syndrome in adults. Nutr. Res. 2014;34:821–826. doi: 10.1016/j.nutres.2014.08.017. [DOI] [PubMed] [Google Scholar]
- 23.Conrady CD, Bell JP, Besch BM, et al. Invest Ophthalmol Vis Sci. 2017;58:3616–3627. doi: 10.1167/iovs.17-21818. [DOI] [PMC free article] [PubMed] [Google Scholar]
- 24.Stahl W, Heinrich U, Jungmann H, von Laar J, Schietzel M, Sies H, Tronnier H. Increased dermal carotenoid levels assessed by noninvasive reflection spectrophotometry correlate with serum levels in women ingesting betatene. J. Nutr. 1998;128:903–907. doi: 10.1093/jn/128.5.903. [DOI] [PubMed] [Google Scholar]
- 25.Stahl W, Heinrich U, Jungmann H, Tronnier H, Sies H. Carotenoids in human skin: noninvasive measurement and identification of dermal carotenoids and carotenol esters. Methods in Enzymology. 2000;319:494–502. doi: 10.1016/s0076-6879(00)19046-9. [DOI] [PubMed] [Google Scholar]
- 26.Niedorf F, Jungmann H, Kietzmann M. Noninvasive reflection spectra provide quantitative information about the spatial distribution of skin chromophores. Med. Phys. 2005;32:1297–1307. doi: 10.1118/1.1851917. [DOI] [PubMed] [Google Scholar]
- 27.Alaluf S, Heinrich U, Stahl W, Tronnier H, Wiseman S. Dietary carotenoids contribute to normal human skin color and UV photosensitivity. J. Nutr. 2002;132:399–403. doi: 10.1093/jn/132.3.399. [DOI] [PubMed] [Google Scholar]
- 28.Ermakov IV, Gellermann W. Dermal carotenoid measurements via pressure mediated reflection spectroscopy. J. Biophotonics. 2012;5:559–570. doi: 10.1002/jbio.201100122. [DOI] [PubMed] [Google Scholar]
- 29.Ermakov IV, Sharifzadeh M, Ermakova M, Gellermann W. Resonance Raman detection of carotenoid antioxidants in living human tissue. J. Biomed. Opt. 2005;10:064028. doi: 10.1117/1.2139974. [DOI] [PMC free article] [PubMed] [Google Scholar]
- 30.US Department of Agriculture and US Department of Health and Human Services. Dietary Guidelines for Americans, 2010. seventh. US Government Printing Office; Washington, DC: Dec, 2010. [Google Scholar]
- 31.Livingstone MB, Robson PJ. Proc. Nutr. Soc. 2000;59:279–293. doi: 10.1017/s0029665100000318. [DOI] [PubMed] [Google Scholar]
- 32.https://www.sfdph.org/dph/files/MCHdocs/Epi/Presentation-IntroducingtheVeggieMeter.pdf.
- 33.https://www.sfdph.org/dph/files/MCHdocs/Epi/Data-Table-Early-Childhood-Change-in-Fruit-and-Vegetable-Intake-2016-2017.pdf.
- 34.https://www.sfdph.org/dph/files/MCHdocs/Epi/Data-Table-Early-Childhood-Change-in-Fruit-and-Vegetable-Intake-2016-2017.pdf.


