Summary
Type-A γ-aminobutyric receptors (GABAARs) are ligand-gated chloride channels with a very rich pharmacology. Some of their modulators, including benzodiazepines and general anaesthetics, are among the most successful drugs in clinical use and common substances of abuse. Without reliable structural data, the mechanistic basis for pharmacological modulation of GABAARs remains largely unknown. Here we report high-resolution cryoEM structures of the full-length human α1β3γ2L GABAAR in lipid nanodiscs, bound to the channel blocker picrotoxin, the competitive antagonist bicuculline, the agonist GABA and the classical benzodiazepines alprazolam (Xanax) and diazepam (Valium), respectively. We describe the binding modes and mechanistic impacts of these ligands, the closed and desensitised states of the GABAAR gating cycle, and the basis for allosteric coupling between the extracellular, agonist-binding, and the transmembrane, pore-forming, regions. This work provides a structural framework to integrate decades of physiology and pharmacology research and a rational basis for development of novel GABAAR modulators.
In vertebrates, GABAARs mediate both phasic and tonic neuronal inhibition in the adult central nervous system1–3. Their dysfunction leads to channelopathies associated with epilepsy, insomnia, anxiety and chronic pain4. GABAARs are among the most important human drug targets due to their many allosteric sites that bind compounds with anticonvulsant, anti-anxiety, analgesic, sedative and anaesthetic properties5,6. Some of these, such as benzodiazepines (BZDs), typically positive allosteric modulators, entered clinical use decades before the identity of their receptors was known7,8 and were crucial for the isolation9, and subsequent cloning10, of GABAARs. Other GABAAR ligands are important research tools, including the antagonists picrotoxin (PTX) and bicuculine (BCC)5,6.
The binding modes and conformational impact of most GABAAR allosteric modulators are unknown. Docking attempts had to rely on models based on homologous proteins, including the C. elegans glutamate-gated chloride channel α (GluCl)11, Torpedo nicotinic acetylcholine receptor12 or the human homopentameric β3 GABAAR13 structures, all distant from the physiological, heteromeric GABAARs. Crystallographic and single-particle cryo-EM studies have illustrated interactions of GABAAR-derived constructs with neurosteroids14–16, the agonist GABA17–19 and the BZD site ligands bretazenil (BRZ)20, and flumazenil (FLZ)18,20. However, the use of engineered receptors, in detergents micelles, limits the interpretability of such structures.
Functional studies on small molecule GABAAR modulators have also raised numerous conundrums. We will list here just a few examples. It is not known why the two agonist (GABA) binding sites, which should be structurally identical, are not functionally equivalent21. The mechanism of BZDs action is also unclear, despite their widespread use as sedatives and anxiolytics. Moreover, unlike newer compounds such as bretazenil and flumazenil mentioned above, classical BZDs including diazepam (DZP, Valium) and alprazolam (ALP, Xanax) act specifically through GABAARs containing α1/2/3/5, but not α4/6 subunit types22,23. What is the basis for this specificity? The plant alkaloid PTX, one of the most widely used GABAAR antagonists24, is believed to act as a channel blocker. However, its competitive antagonistic properties suggest that additional binding sites might exist25,26. Another broadly used GABAAR antagonist, BCC, is thought to act competitively. However, the BCC preference to bind resting over desensitized receptors suggests that it might also act allosterically27. Where do important reagents like PTX and BCC actually bind, and how do they work?
To address these unknowns, here we present five structures of the human synaptic α1β3γ2L GABAAR in complex with PTX, PTX/GABA, BCC, DZP/GABA and APL/GABA, establishing the binding modes and structural impact of these ligands and explaining the molecular basis for their function. In order to obtain structures where GABAAR can be observed in more physiologically relevant conformations, we employed a full-length receptor variant, from a thoroughly characterised cell line28 and reconstituted it in a lipid bilayer29. Our results lay the foundation for understanding the fundamental principles of small molecule action on heteromeric synaptic GABAARs.
Picrotoxin and GABA binding modes
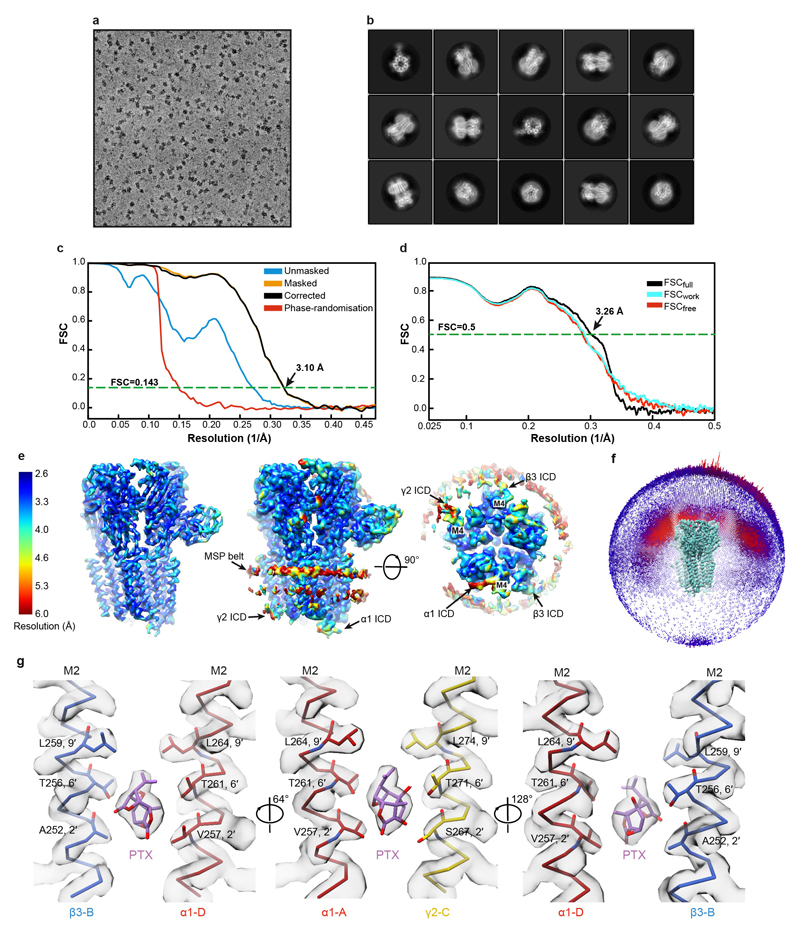
We first solved the structure of the α1β3γ2L receptor in complex with PTX (800 μM) to 3.1 Å nominal resolution (Fig. 1a, Extended Data Fig. 1a-f, Extended Data Table 1, Supplementary Video 1). PTX is an equimolar mix of two highly similar compounds, picrotin and picrotoxinin. Our structure illustrates picrotoxinin, known to be the more active one, fully sequestered in the channel pore between the M2 2′ and 9′ rings (Fig. 1b-c, Extended Data Fig. 1g, Supplementary Video 2). This agrees with mutagenesis and electrophysiology results implicating the 2′, 6′ and 9′ M2 residues in PTX binding30–32 and suggestions that PTX becomes “trapped” in closed/resting GABAAR and GlyR channels upon agonist wash-off33,34. The hydrophobic isoprenyl moiety is surrounded by the 9′ Leu ring, whereas the exocyclic oxygen atoms in the main PTX body form putative hydrogen bonds with the 6′ ring (Fig. 1b, c). In picrotin, the isoprenyl group is replaced by a polar tertiary alcohol, not compatible with the 9′ Leu ring interactions, explaining why this compound is less active.
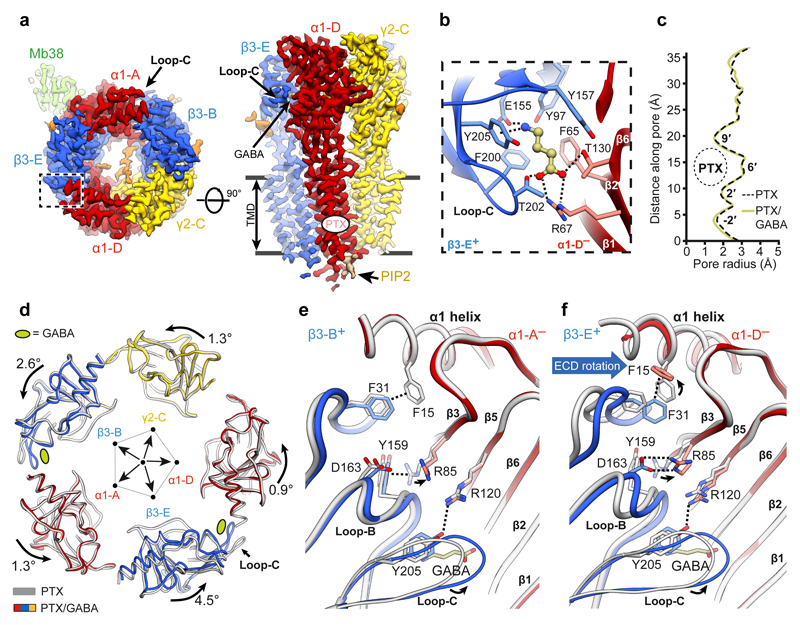
Figure 1. Structure of the α1β3γ2L GABAAR in complex with picrotoxin (PTX).
a, Cryo-EM map of the PTX-bound α1β3γ2L GABAAR viewed from the extracellular space (left) and parallel to the membrane plane (right). PTX binding site is boxed. b, c, Side-on (b) and top-down views (c) of PTX (carbon atoms in pink, oxygen atoms in red) bound to the channel pore, with the amino acid side chains lining the site shown as sticks. Dashed lines indicate hydrogen bonds.
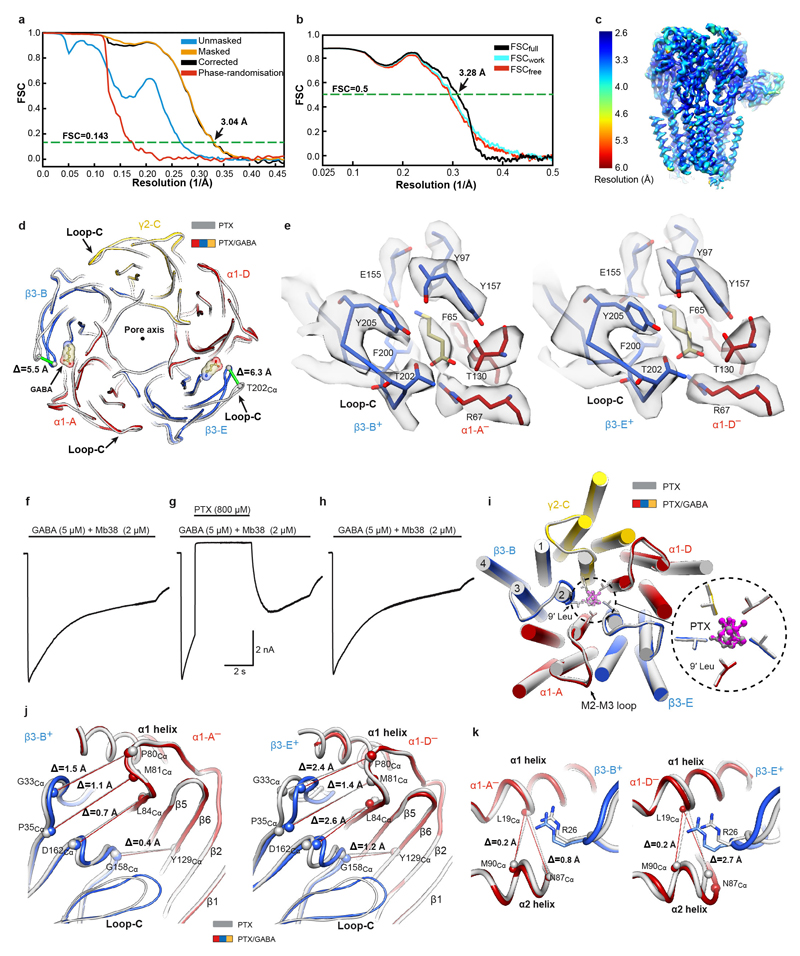
We next determined a GABAAR structure in complex with PTX (800 μM) and the neurotransmitter GABA (5 μM) to 3.04 Å nominal resolution (Fig. 2a, Extended Data Fig. 2a-c, Extended Data Table 1, Supplementary Video 3). The orthosteric GABA-binding sites are located at the two β3+/α1– interfaces [the principal (+) and complementary (–) annotation of subunit faces is used], capped by the extracellular loops-C of the β subunits18,19,29. Reminiscent of the Torpedo nAChR α subunits35, in the agonist-free GABAAR the β3 loops-C adopt “open” (outwards-projecting) conformations, whereas in the PTX/GABA-bound state they are “closed” (Extended Data Fig. 2d). Strong EM densities are present in the two orthosteric ligand binding sites allowing unambiguous modelling of GABA molecules in the “aromatic boxes” formed by β3Tyr157, β3Phe200, β3Tyr205 and α1Phe65 (Fig. 2b, Extended Data Fig. 2e, Supplementary Video 4). The GABA amino group engages in a cation-π interaction with β3Tyr205 and a network of hydrogen bonds involving the β3Glu155 carboxyl, main chain carbonyls of β3Ser156 and β3Tyr157, and the β3Tyr97 hydroxyl. The GABA carboxylate forms salt bridges with α1Arg67 and hydrogen bonds with α1Thr130 and β3Thr202 (Fig. 2b). The GABA binding modes we observe are generally consistent with those proposed in lower resolution α1β1γ2 and α1β2γ2 GABAAR models18,19, however there are differences in detail29.
Figure 2. Conformational impact of GABA binding to the α1β3γ2L GABAAR.
a, Cryo-EM map of the PTX/GABA-bound α1β3γ2L receptor viewed from the extracellular space (left) and parallel to the membrane plane (right). b, One GABA (balls and sticks; carbon atoms, khaki; oxygens, red; nitrogen, blue) binding pocket viewed from the extracellular space. c, Plot of the pore radii for the receptor bound to PTX and PTX/GABA. d, Superimposition of ECDs from the PTX- (grey) and PTX/GABA-bound receptor structures based on the global TMD alignment. Subunits were radially translated away by 10 Å from the pore axis to allow better visualisation of conformational changes in the ECD upon GABA binding. GABA-induced ECD rotation is defined as angles of rotation around the ECD rotation axes and the direction of motion are shown. e, f, Superimposition of α1 ECDs from PTX-bound and PTX/GABA-bound structures reveals conformational changes induced by GABA binding in the orthosteric pockets at β3-B+/α1-A– (e) and β3-E+/α1-D– interfaces (f). Dashed lines indicate hydrogen bonds, π-π stacking, π-cation interactions and salt bridges.
Allosteric cross-talk between PTX and GABA
Co-application of PTX (800 μM) with GABA (5 μM) and Mb38 (2 μM) causes rapid and complete inhibition of whole-cell currents in HEK293 cells, with complete recovery after PTX washout (Extended Data Fig. 2f-h). Unexpectedly, in both PTX- and PTX/GABA-bound structures TMDs adopt the same conformation, where all five M2 helices present the hydrophobic 9′ Leu side chains towards the centre of the pore, constricting its radius to ~1.5 Å (Fig. 2c and Extended Data Fig. 2i). This suggests that PTX inhibition is not caused by blocking an open pore, but by inducing and maintaining a closed pore conformation. It is likely that, by stabilising the closed/resting TMD state, PTX affects the ECD conformation and impacts on agonist binding. Indeed, it has been shown that PTX reduced the apparent agonist affinity in GABAARs26,36 and increased GABA dissociation37. Therefore, TMD closure by PTX constitutes the basis for allosteric communication between the PTX and GABA binding sites and explains how PTX appears to act as a competitive inhibitor34,38,39 without binding to other receptor pockets. We conclude that the PTX-bound structure best illustrates the α1β3γ2L receptor in a closed/resting state (closed TMD, agonist-free ECD).
Mechanistic impact of GABA binding
Previous observations suggested that the two GABA binding sites may not be functionally equivalent21,40, and the β-E+/α-D– site was estimated to have a threefold higher affinity for GABA than the β-B+/α-A– one21. By comparing ECDs in the PTX- versus PTX/GABA-bound structures, both with closed-state TMDs, one could visualise the initial conformational changes at the two agonist binding sites upon GABA binding. Closure of β3 loops-C, likely the first step in the process, triggers remodelling of the β3-B+/α1-A– and β3-E+/α1-D– interfaces which leads to an anti-clockwise (looking down the pore axis from the extracellular space) asymmetric rotation of all subunit ECDs (Fig. 2d). This state is stabilised by new hydrogen bond networks involving the β3Gly158, β3Tyr205 and α1Arg85 residues. The cation-π interaction between α1Arg85 and β3Tyr159 breaks and the α1Arg85 side chain moves to the periphery of the interface (Fig. 2e, f). At the β3-B+/α1-A– interface, these changes allow the β3-B subunit to move closer to the α1-A subunit by 1.5 Å as measured between β3Gly33Cα and α1Pro80Cα, and the total buried surface between the two subunit ECDs increases by 184 Å (Extended Data Fig. 2j, Extended Data Table 2). In the GABA-bound conformation, α1Phe15 and β3Phe31 residues form a hydrogen-π stacking interaction and the side chains of α1Arg85 and β3Asp163 form new salt bridges, further interlocking the β3-E+/α1-D– ECD interface and increasing its total buried surface area by 234 Å (Fig. 2f, Extended Data Table 2, Supplementary Video 5).
The “incomplete” β3-B+/α1-A– interface closure in the PTX/GABA-bound structure, relative to β3-E+/α1-D–, delineates an intermediate conformation from which GABA can presumably dissociate more readily. Interestingly, in the desensitised (high affinity to GABA41) receptor states, described later in this paper, both β3+/α1– interfaces close to the same degree. We conclude that the PTX/GABA-bound structure represents a pre-active receptor state, where agonist induced conformational changes at the ECD level are not large enough to perturb the closed/resting TMD conformation42.
Mechanism of bicuculline antagonism
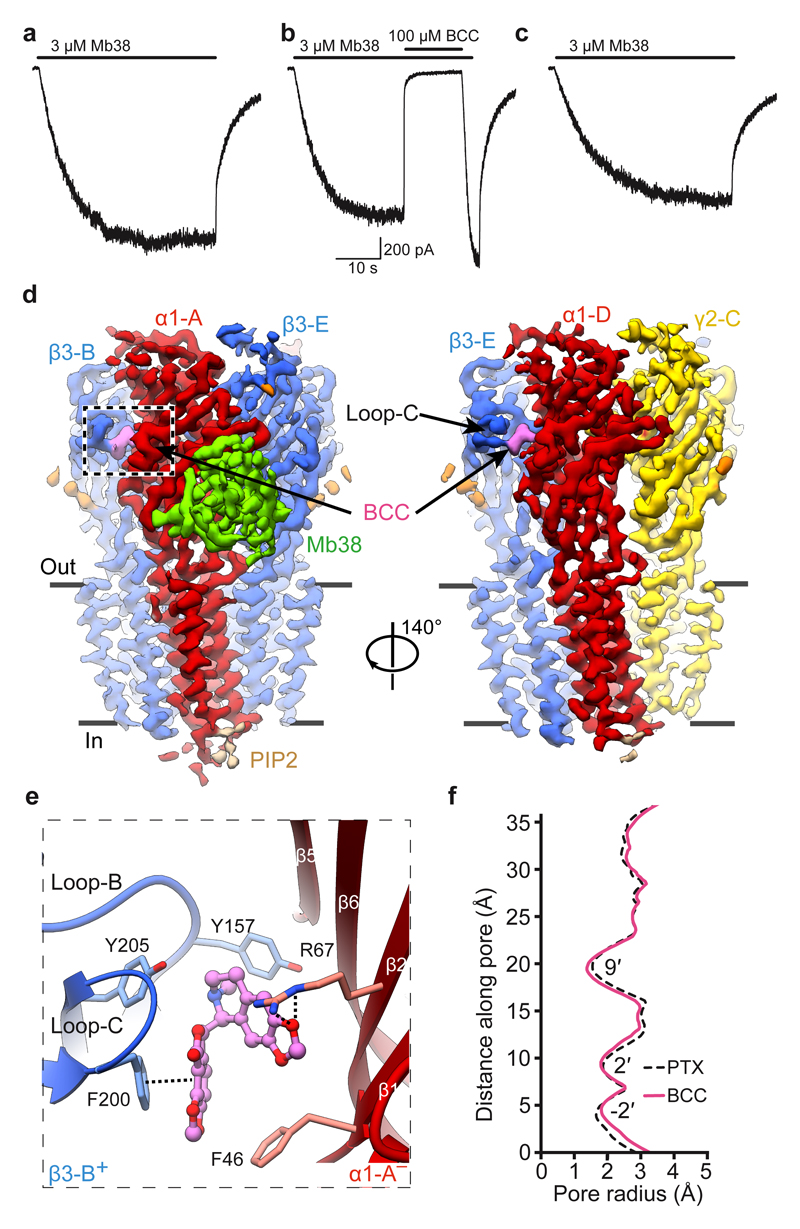
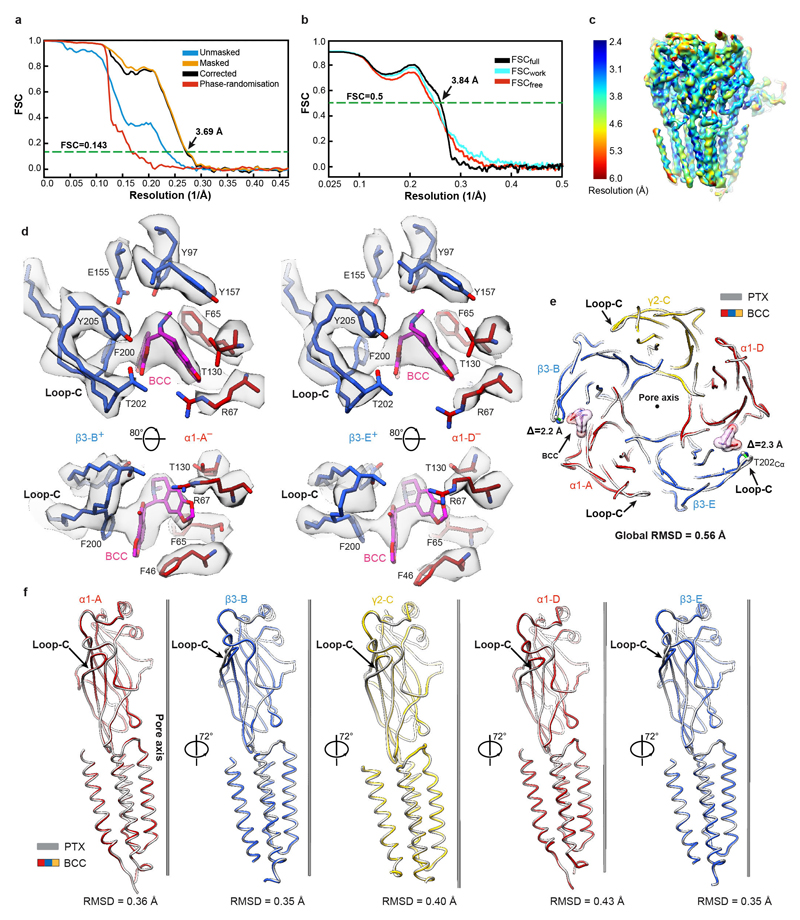
A highly efficient competitive antagonist, BCC was expected to induce a bona fide GABAAR closed state43. We first verified whether BCC could close the α1β3γ2L receptor pre-bound to Mb38. In whole-cell voltage-clamp experiments, application of a 42 second pulse of Mb38 produced currents (Fig. 3a) that were inhibited (102 ± 7 %; n = 4) by co-application of bicuculline (100 μM) (Fig. 3b) in a reversible fashion (Fig. 3c). We solved the cryo-EM structure of the α1β3γ2L heteromer in complex with Mb38 and BCC to 3.69 Å nominal resolution (Fig. 3d, Extended Data Fig. 3a-c, Extended Data Table 1). EM densities corresponding to BCC were observed at both orthosteric agonist sites (Extended Data Fig. 3d), where the hydrophobic nature of its phthalide and isoquinoline rings allows it to interact with “aromatic box” residues β3Tyr157, β3Phe200, β3Tyr205 and α1Phe65 (Fig. 3e, Supplementary Video 6). Relative to the PTX-bound structure, the β3-B and β3-E subunit loops-C flex inward, ~2.2 Å at the tip (Extended Data Fig. 3e), to accommodate BCC, but retain overall “open” conformations (Extended Data Fig. 3f). The channel pore of the BCC-bound α1β3γ2 receptor is fully closed by the M2 residues at three levels, 9′, -2′ and 2′ (Fig. 3f) and its subunit conformations are virtually identical to the PTX-bound structure (Extended Data Fig. 3e, f). BCC binding to the orthosteric sites prevents closure of the β3+/α1– subunit interfaces and ECD rotation, and stabilizes TMDs in the closed/resting state, thus inactivating the channel.
Figure 3. Structure of a α1β3γ2L GABAAR closed by the competitive antagonist bicuculline.
a-c, Representative whole-cell current traces elicited from the same cell (n = 4) by a 42s pulse of: Mb38 alone (a); Mb38 plus bicuculline (BCC) co-applied for 13s at 25s mark (b); Mb38 again, after BCC was washed out (c). d, Cryo-EM map of the α1β3γ2 GABAAR-BCC complex viewed parallel to the membrane plane. e, One BCC binding pocket at the β3+/α1– interface, viewed parallel to the membrane. Dashed lines indicate π-π interactions and hydrogen bonds. f, Plot of the pore radii for the α1β3γ2 receptor bound to PTX or BCC.
Benzodiazepine binding modes and mechanisms
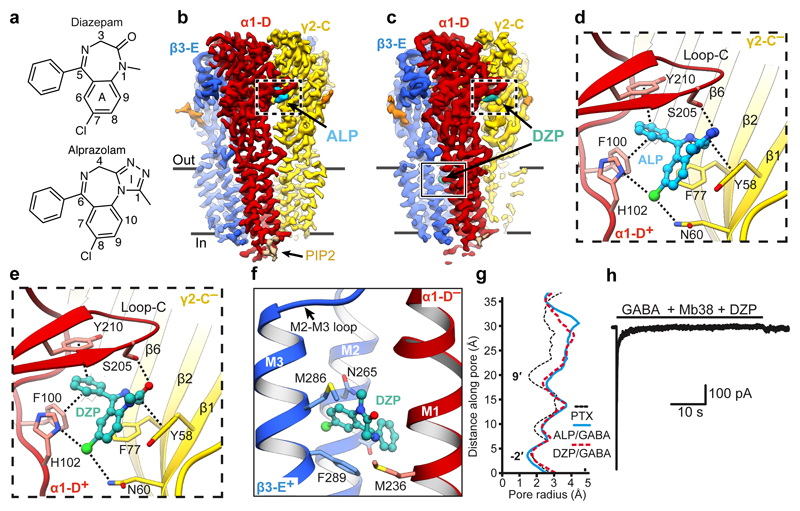
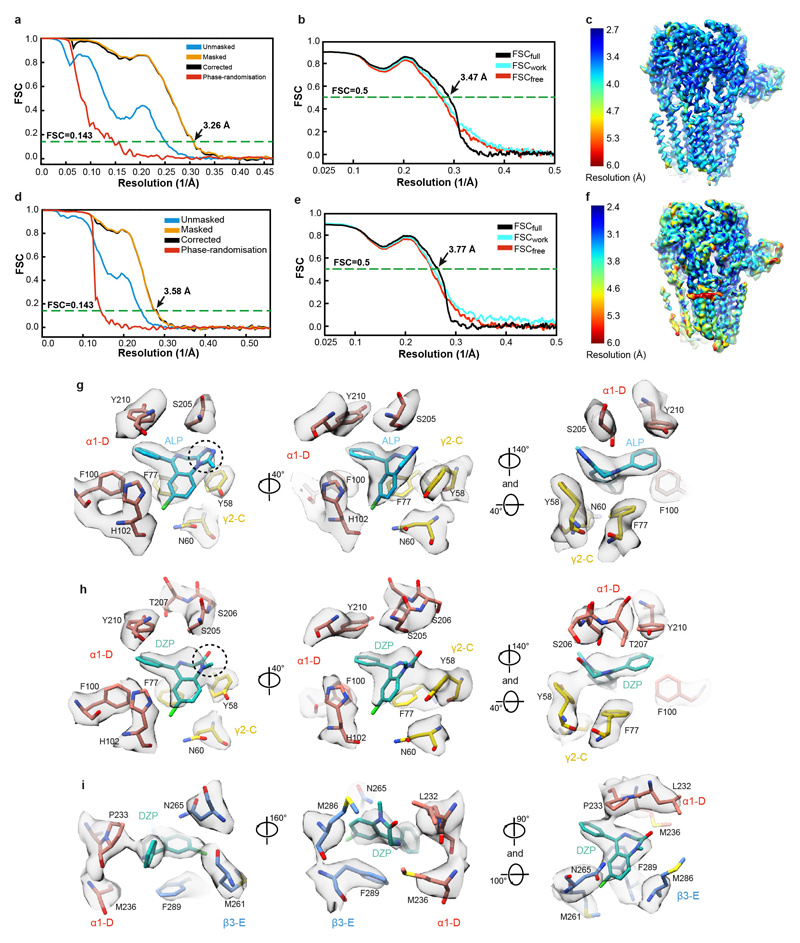
We next solved cryo-EM structures of the α1β3γ2L receptor in complex with GABA and ALP, as well as GABA and DZP, to 3.26 Å and 3.58 Å nominal resolutions, respectively (Fig. 4a-c, Extended Data Figure. 4a-f, Extended Data Table 1, Supplementary Video 7). In both structures, GABA molecules are bound to the orthosteric agonist pockets and ALP/DZP occupy the canonical BZD binding site at the α1+/γ2– interface, where they form extensive interactions (Fig. 4d-e). Densities for ALP and DZP are well defined, allowing us to distinguish the fused benzene-diazepine from the pendant phenyl rings (Extended Data Figure. 4g-h, Supplementary Video 8).
Figure 4. Structures of a α1β3γ2L GABAAR in desensitised states induced by GABA and alprazolam/diazepam.
a, Structural formulae of diazepam and alprazolam. Diazepine ring atoms are numbered. Imidazole (I) and benzene rings (A) are labelled. b,c, The cryo-EM map of the α1β3γ2 GABAAR in complex with ALP (cyan) (b) and DZP (teal) (c) viewed parallel to the membrane plane. d,e, Views of the benzodiazepine binding site at the α1+/γ2– interface showing ALP (d) and DZP (e) binding modes. Dashed lines indicate π-π interactions and hydrogen bonds. f, The low affinity DZP binding site in the β3+/α1– interface TMD region. g, Plot of the pore radii for the receptor bound to PTX, ALP/GABA and DZP/GABA. h, Representative current traces evoked by co-application of GABA (10 mM) with Mb38 (2 μM) and DZP (100 μM) for 40s to outside-out patches pulled from HEK cells. The currents (n = 6 patches) desensitized completely in three phases; a slow (0.78± 0.84 s-1); medium (16.32 ± 9.34 s-1), and a fast (306.5± 185.9 s-1) rates. Rate values are mean ± S.D. The upper black solid bar shows the duration of ligand application.
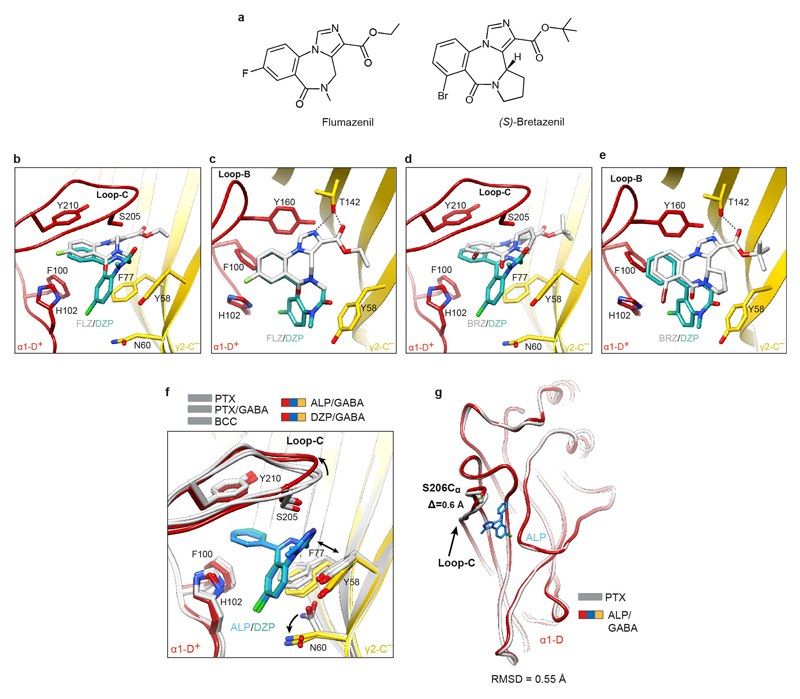
The ALP/DZP binding modes are in agreement with the cysteine crosslinking experiments where isothiocyanate substitutions in the DZP C(7) position reacted with cysteines introduced at the α1His102, α1Asn103, γ2Asn60 positions and the DZP C(3) ones reacted with the α1Ser206Cys and α1Thr207Cys mutants44. The chlorine atoms at the C(8) and C(7) positions in ALP and DZP, respectively, interact with the α1His102 side chain. In α4/6 subunits the equivalent positions are occupied by arginine residues, whose larger side chains would sterically clash with ALP and DZP. This can explain why classical BZDs do not act on GABAAR subtypes containing α4/6 subunits22,45,46. The ALP and DZP-bound structures also demonstrate that BZDs with a pendant phenyl ring do not share the binding mode reported for the benzodiazepine antagonist FLZ and partial agonist BRZ18,20 (Extended Data Fig. 5a-e). FLZ/BRZ bind deeper and higher from the BZD pocket floor delineated by the side chain of γ2Asn60, possibly due to additional hydrogen bonds between the imidazole nitrogen and ester carbonyl of FLZ/BRZ (both groups are absent in ALP/DZP structures) and the hydroxyl group of γ2Thr14220 (Extended Data Fig. 5c, e).
In the DZP/GABA-bound map, we also observed two strong EM densities in the putative general anaesthetic binding sites at the β3+/α1– TMD interfaces47 (Extended Data Figure. 4i, Supplementary Video 9). These are not present in the ALP/GABA-bound map and have a distinct shape attributable to DZP. In these pockets, the DZP A ring forms hydrophobic interactions with β3Met286 and β3Phe289 and the phenyl ring points towards α1Pro233 (Fig. 4f, Extended Data Figure. 4i). Our structure validates previous electrophysiology and mutagenesis data suggesting the existence of secondary DZP binding sites, responsible for the anaesthetic activity and biphasic GABAAR potentiation at higher DZP concentrations40,48.
We next compared the α1+/γ2– interfaces in PTX-, PTX/GABA-, BCC-, ALP/GABA- and DZP/GABA-bound structures. Surprisingly, ALP or DZP binding induced only minor rearrangements in the BZD pocket: γ2Asn60 adopted a different rotamer (Extended Data Fig. 5f) and the tip of α1 loop-C flexed outwards ~0.6Å (Extended Data Fig. 5f, g). We thus propose that BZDs such as ALP and DZP act as “connectors” to stabilize the weakest ECD interface, α1-D+/γ2-C– (Extended Data Table 2), and facilitating the concerted ECD rotation upon GABA binding. Nb38 and Mb38 might act similarly by “crosslinking” the α1-A+/β3-E– and α1-D+/γ2-C– interfaces20,29. FLZ antagonizes classical BZDs by competing for the same pocket but, since it interacts largely with the α1-D+ face18,20, its binding would not confer the same inter-subunit connectivity benefits (Extended Data Fig. 5b, c).
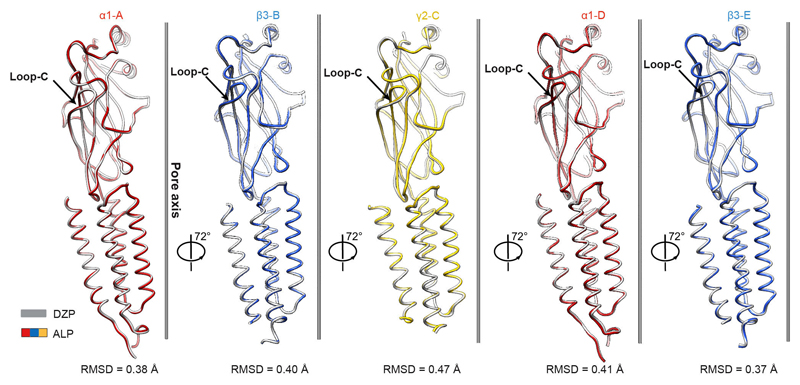
The channel pore radii in ALP/GABA and DZP/GABA-bound structures are 2.6 Å and 2.3 Å, respectively, at the 9′ level, further constricted to 1.6 Å and 1.8 Å by the -2′ residues (Fig. 4g). Whole-cell voltage-clamp experiments indicate that a prolonged exposure to a combination of GABA (10 mM), Mb38 (2 μM), and diazepam (100 μM) leads to the complete desensitization of the α1β3γ2L receptor (Fig. 4h). Subunit comparison between ALP/GABA and DZP/GABA-bound structures reveals that they adopt similar conformations (Extended Data Fig. 6), illustrating a desensitized state of the receptor, bound to agonist but with the channel closed only at the -2′ gate (Supplementary Video 7).
Allosteric interactions between ECDs and TMDs
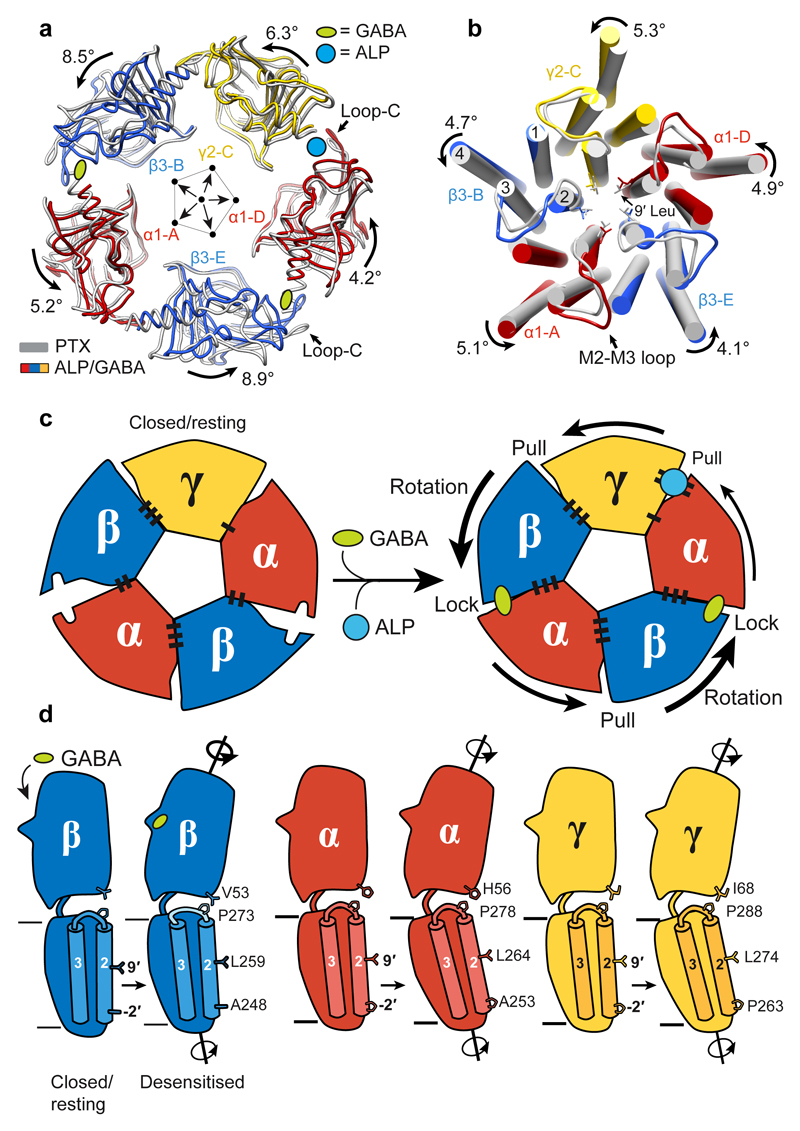
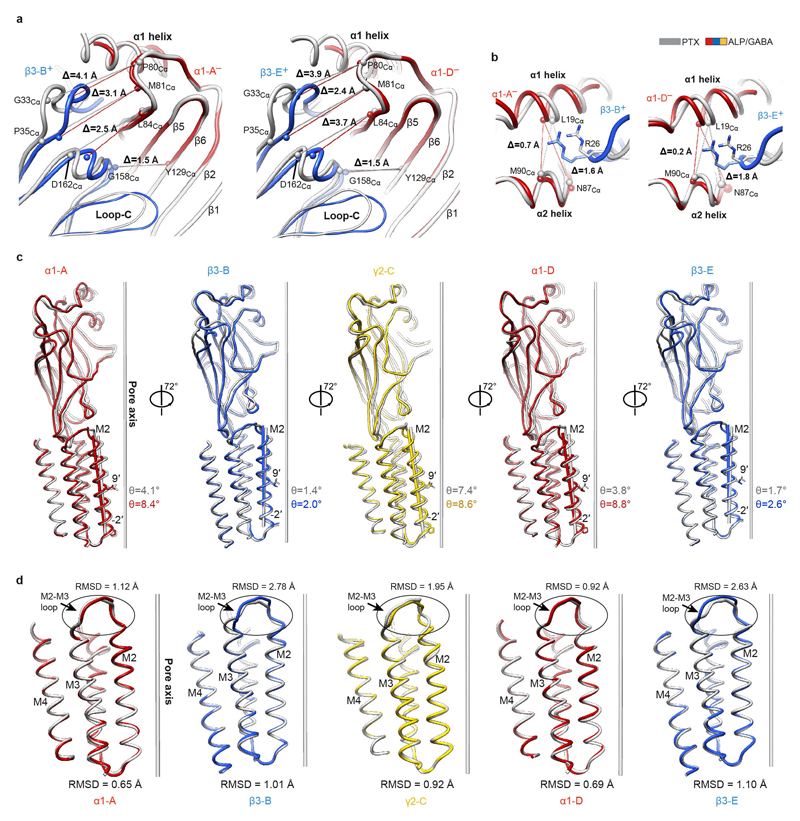
To understand how the GABA-induced ECD rotation induces conformational changes in the TMD region, we compared ALP/GABA- and PTX-bound structures (Fig. 5a,b). In the presence of ALP, GABA binding leads to equal closure of both β3+/α1– interfaces and a larger ECD rotation compared to the pre-open PTX/GABA-bound structure (Fig. 5a, Extended Data Fig. 2j, k, Extended Data Fig. 7a, b, Supplementary Video 10). This ECD conformational change triggers an anti-clockwise TMD rotation. The resulting tilt of M2 helices moves the 9′ Leu side chains away from the channel pore and towards the inter-subunit interfaces (Fig. 5b, Extended Data Fig. 7c). These motions are transmitted through interactions between the β1-β2 and M2-M3 loops, whereas the β6-β7 (Cys) loops act as pivot points and the TMD bundles rotate as rigid bodies (Extended Data Fig.7d, Extended Data Fig. 8a-f, Supplementary Video 10).
Figure 5. Conformational differences between closed-resting and desensitised states in a GABAA receptor.
a, Superimposition of ECDs from PTX (grey) and ALP/GABA structures based on the global TMD alignment. Subunits were radially translated by 10 Å away from the pore axis to allow better visualisation of conformational changes in the ECD upon GABA and ALP binding. GABA- and ALP-induced ECD rotation angles, around the rotational ECD axes, and the direction of motion are shown. b, Global TMD alignment for the PTX- (grey) and ALP/GABA-bound (coloured) structures. 9' Leu side chains are shown as sticks. c, Schematic illustration of conformational changes initiated by GABA binding at the extracellular domain (ECD) level. GABA stabilizes closure of loop-C in each β subunit, causing ECDs to rotate and form stronger β3+/α1– interfaces. The direction and magnitude of rotation are depicted as black arrows of varying thickness. BZDs such as alprazolam bind at the α1+/γ2– interface and reinforce it, facilitating the concerted rotation of the ECDs. Black bars (“stitches”) at the subunit interfaces represent the strength of the interfaces (See Extended Data Table 2.). d, Differences in the ECD-TMD relative orientations between the closed/resting and desensitised states illustrate how GABA binding and ECD rotation impact on transmembrane domains (TMDs). Notably, the M2-M3 loops in β subunits deform more than α and γ equivalents, resulting in lower degrees of M2 tilt and TMD rotation.
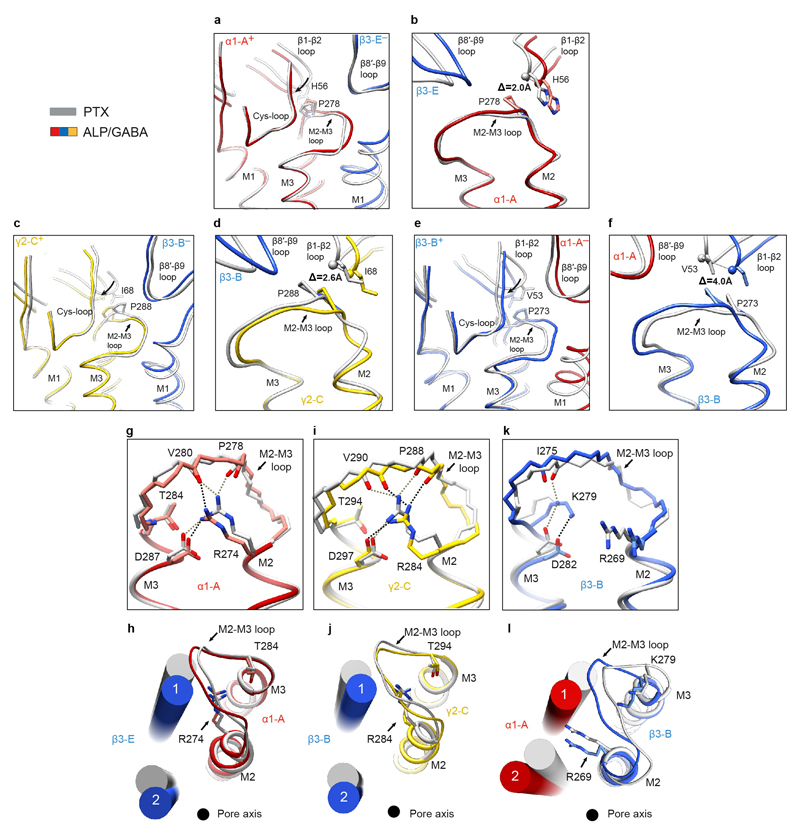
The relative flexibility in M2-M3 loops appears to regulate the ECD-TMD signal transduction efficiency. In α1 and γ2 subunits, the highly conserved Arg residues at the M2 19′ positions interact with and rigidify the M2-M3 loops. However, in β3 subunits, the strictly conserved Lys279 residues displace the 19′ Arg269 side chains, causing them to rotate and wedge in between the M1 and M2 helices of the neighbouring α1 subunits. This restricts the β3 TMD rotations (Extended Data Fig. 8g-l), possibly dampening signal transduction. In α1 and γ2 subunits, positions equivalent to β3Lys279 are occupied by conserved Thr residues which do not clash with 19′ Arg (Extended Data Fig. 8g-l). The β3 M2-M3 loops appear therefore more flexible than α1 and γ2 ones (Extended Data Fig. 7d, Supplementary Video 10). In agreement with these observations, α1β3γ2L receptors containing β3Lys279Thr mutations are 20-fold more sensitive to GABA relative to wild-type ones49.
We propose that GABA-induced signalling can be described by a “lock and pull” mechanism. GABA binding triggers loops-C closure in β subunits, initiating their ECD rotation and “locking” them to the neighbouring α– interfaces. These conformational changes “pull” the other ECDs, leading to a concerted anti-clockwise rotation. Inclusion of a BZDs strengthens the α1+/γ2– ECD interface to facilitate these motions (Fig. 5c). In β subunits, signal transduction to TMDs is modulated by the flexible M2-M3 loops, whereas the ECD rotations of α and γ subunits couple to the TMDs more efficiently, as their M2-M3 loops are more rigid (Fig. 5d).
Conclusion
The structures presented here illustrate how important pharmacological compounds, used broadly in research and clinic, interact with a full-length human heteromeric GABAAR to modulate its conformation and function. Picrotoxin must initially bind to an open channel pore and subsequently stabilises a closed/resting receptor state, which explains its simultaneous channel blocker and allosteric antagonist activities. Bicuculline occupies the agonist-binding sites. However, unlike GABA, it cannot drive the rotation of β subunits and therefore stabilizes the closed channel pore. Comparison of agonist-free and GABA-bound structures delineates the molecular mechanism by which neurotransmitter binding to the β3+/α1– interfaces prompts a global rotation of ECD regions, initially in an asymmetrical fashion, and explains how different subunit types transduce this conformational change to their TMDs. We also characterise the binding sites of two major classical benzodiazepines, alprazolam and diazepam, and define their primary role as stabilizers of the α+/γ– interface, facilitating the concerted motion of GABAAR subunits. This work underlines the potential of cryo-EM to study drug interactions with challenging yet highly valuable human membrane protein targets50. Specifically, these structures might lead to the rational design of safer and more specific anxiolytic, sedative, hypnotic and anticonvulsant drugs.
Methods
GABAA receptor production, purification and nanodisc reconstitution
Human tri-heteromeric α1β3γ2L was expressed in a stable, doxycycline-inducible HEK293S-TetR cell line28 grown in suspension. The cell line was not authenticated or tested for mycoplasma contamination. The receptor comprised the full-length human α1 (UniProtKB P14867), β3 (P28472) and γ2L (P18507) subunits, each under individual antibiotic selection (zeocin, hygromycin-B, geneticin/blasticidin, respectively). For quality control and purification, a FLAG tag (DYKDDDDK)51 was fused to the α1 subunit N-terminus and a Rhodopsin-1D4 tag (TETSQVAPA)52 was fused to the γ2L subunit C-terminus, downstream of a (GGS)3GK spacer sequence. Cells were grown in FreeStyle 293 expression medium (Gibco) supplemented with 1% fetal bovine serum (Invitrogen), and antibiotics for selection (geneticin, hygromycin-B, zeocin and blasticidin, Thermo Fisher Scientific) at 37 °C, 160 rpm, 8% CO2. GABAAR expression was induced by the addition of doxycycline (2 μg ml-1, Sigma) at a cell density of ~2×10⁶ cells ml-1. At the same time, the medium was supplemented with 5mM sodium butyrate and the class I α-mannosidase inhibitor kifunensine (1 mg l-1, Toronto Research Chemicals), in order to boost recombinant protein yields. Due to this treatment, the majority of N-linked glycans were restricted to the immature, ER-type Man9GlcNAc2. Cells were harvested by centrifugation ~24 h after doxycycline addition. All steps of purification were performed at 4°C or on ice. Cell pellets from 0.4 l of suspension culture were resuspended by brief vortexing in dilution buffer (50mM HEPES pH 7.6, 300mM NaCl) supplemented with 1 % (v/v) mammalian protease inhibitor cocktail (Sigma-Aldrich). Membrane proteins were solubilised with 1% (v/v) n-dodecyl β-D-maltopyranoside (DDM, Anatrace; used for BCC- and DZP/GABA-bound samples) or lauryl maltose neopentyl glycol (LMNG, Anatrace; used for PTX-, PTX/GABA-, ALP/GABA-bound samples) with cholesterol hemisuccinate (CHS, Anatrace) at a 10:1 molar ratio, respectively, for 1 h. Insoluble material was removed by centrifugation (10,000 g, 30 min). The α1β3γ2 GABAARs in the supernatant were captured on 1D4 affinity resin13 (300 μl) while mixing slowly for 2 h. The beads were recovered by centrifugation (300 g, 5 min) and washed with 100 ml of dilution buffer supplemented with 0.1% (v/v) DDM:CHS (10:1) or LMNG:CHS (10:1). To reduce the time α1β3γ2 GABAAR spends solubilised in detergent, and to streamline protein specimen preparation for cryoEM, we reconstituted the α1β3γ2 heteromer into nanodiscs while it was bound to the 1D4 beads. Receptors were equilibrated with 1 ml of dilution buffer containing an excess (40 μl) of a phosphatidylcholine (POPC, Avanti) and bovine brain lipid (BBL) extract (Type I, Folch fraction I, Sigma-Aldrich) mixture (POPC:BBL=85:15) for 30 min. POPC and BBL extract stocks (10 and 20 mg ml-1, respectively) were prepared by solubilisation in 3% DDM. Beads were collected by centrifugation and an excess of MSP2N2 (0.6 mg ml-1 final concentration) was added together with Bio-Beads (40 mg ml-1 final concentration) and incubated for 2 h rotating gently. The MSP2N2 belt protein was produced as previously described53. After nanodisc reconstitution, the 1D4 resin and Bio-Bead mixture was washed extensively with dilution buffer to remove empty nanodiscs. For protein elution, 100 μl of mixture containing 1 part of dilution buffer and 3 parts of 2 mM 1D4 peptide stock (in MilliQ-grade H2O) was added onto the 1D4 resin for incubation overnight. The next day, beads were settled down by a short centrifugation (300 g, 5 min) and the eluate was collected. Typically, the eluate contains 0.1–0.25 mg ml-1 of α1β3γ2 heteromer, which was then directly used for cryo-EM grid preparation.
Mb38 production and purification
Megabodies (Mbs) are chimeric proteins comprised of Nanobodies (Nbs) fused to larger scaffold proteins (to be published elsewhere). A circular permutant of the extracellular adhesin domain of H. pylori (HopQ)54 was inserted into the first β-turn connecting β-strands A and B of anti-α1 subunit Nb3820 resulting in monomeric (~58 kDa). was expressed as a C-terminally His6-tagged periplasmic protein in E. coli WK6 cells. Cell cultures were grown at 37 °C (120 rpm) in Terrific Broth medium supplemented with ampicillin to an optical density of 0.8 at 600 nm followed by induction with 1mM IPTG and overnight expression 28 °C (120 rpm). was extracted from periplasm by osmotic shock55, and further purified using nickel affinity chromatography and size-exclusion chromatography (Superdex 200 16/60 column, GE Healthcare) in 10 mM Tris pH 7.3, 140 mM NaCl at 21 °C. Purified was concentrated to ~15 mg ml-1, frozen in liquid nitrogen and stored at -80 °C.
Cryo-EM sample preparation
α1β3γ2L heteromeric receptors reconstituted into nanodiscs were supplemented with small molecule compounds at the concentrations indicated in the main text, and with Mb38 (1-2 μM) to improve particle alignment and the proportion of side views in cryoEM images. 3.5 μl of sample was applied onto glow-discharged gold R1.2/1.3 300 mesh UltraAuFoil grids (Quantifoil) for 30 s and then blotted for 5.5 s before plunge-freezing the grids into liquid ethane cooled by liquid nitrogen. Plunge-freezing was performed using a Vitrobot Mark IV (Thermo Fisher Scientific) at ~100% humidity and 14.5°C.
Cryo-EM image collection and processing
Cryo-EM data were collected on a 300 kV Titan Krios microscopes (Thermo Fisher Scientific) fitted with a GIF-Quantum energy filter (Gatan) and Volta Phase Plate (VPP, Thermo Fisher Scientific). Micrographs were recorded in counting mode using K2 Summit (Gatan) or Falcon 3EC (Thermo Fisher Scientific) direct electron detectors. For sample-specific data collection parameters, see Extended Data Table 2.
Datasets were analysed using the same basic processing pipeline in RELION 3.056 as described below. First, MotionCor257 and Gctf58 wrappers in RELION 3.0 were used to motion-correct movies, and to estimate the contrast transfer function (CTF) and phase shift parameters, respectively. Poor quality images were discarded after manual inspection. For particle picking, a Gaussian blob was used as a template to auto-pick particles from a small set of micrographs and 2D classification was performed. Selected 2D classes were used as templates for auto-picking particles from all micrographs. Two rounds of reference-free 2D classifications were performed and well-aligned 2D classes showing clear GABAAR projections were selected for 3D reconstruction. An initial reference-free 3D model was generated in RELION 3.0 using stochastic gradient descent (SGD) methodology59. Selected particles were 3D-refined (‘gold standard’ refinement) and Bayesian polishing of particles was performed60. Next, the polished particles were classified into eight 3D volumes without particle alignment. Particles from volumes with the highest resolution were combined and 3D-refined using a soft mask and solvent-flattened FSCs. Beam tilt correction and per-particle CTF refinement implementations in RELION 3.0 were applied, resulting in further 0.1–0.2 Å increase in resolution. Most notably, for the DZP/GABA-bound GABAAR dataset, beam tilt correction helped increase the resolution from 3.82 Å to 3.58 Å. The resolution was estimated using relion_postprocess with the FSC criteria of 0.143. Local map resolution was estimated with MonoRes61.
The initial atomic model used in this work was obtained from the truncated α1β3γ2 heteromer structure20. First, ECDs and TMDs from this model were fit to the PTX/GABA-bound α1β3γ2 heteromer map (3.04 Å nominal resolution) as rigid bodies using UCSF Chimera62. COOT63 was used to adjust the model and build the regions absent in the truncated receptor form. The model was then subjected to several rounds of global refinement and minimisation in real space using phenix_real_space_refine64. The resulting model served as a starting point for the other structures, applying the same refinement strategy. The geometry constraint files for small molecule ligands used in the refinement were generated using the Grade Web Server (Global Phasing Ltd.). The quality assessment of geometry in all models was performed using the MolProbity65 Web Server. For the refinement protocol validation, each final model coordinates were displaced by 0.5 Å and refined using phenix_real_space_refine against one of each half-map sets produced by RELION 3.0. FSC curves were then calculated between this model and the half-map used for refinement (‘work’) and the half-map, which was not used for refinement, (‘free’) using phenix.mtriage66. In addition, the refined models were also compared against the final sharpened map (‘full’). For all structures, the separation between FSCwork and FSCfree curves was not significant, indicating that the models were not over-refined.
Subunit interface surface and associated free energy parameter analysis was performed using the PDBePISA server67. Pore diameters were calculated using the HOLE68 plug-in in COOT. Structural figures were prepared using UCSF Chimera62. Global TMD alignments were performed using the align command in PyMol (Schrödinger, LLC). TMD boundaries for global alignments: α1 residues 233-309 and 392-418, β3 residues 218-302 and 419-447, γ2 residues 233-319 and 411-436. ECD alignments were performed using the match command in UCSF Chimera. ECD boundaries for structural alignments: α1 residues 9-222, β3 residues 8-217, γ2 residues 26-232. Root mean square deviations (RMSD) were calculated using the rmsd function in UCSF Chimera. M2-M3 loop boundaries for RMSD calculations: α1 residues 276-284, β3 residues 271-279, γ2 residues 286-294. Rotation angles were calculated using UCSF Chimera.
Electrophysiology
HEK 293S cells producing α1β3γ2L receptors28, were grown on glass coverslips, and expression was induced with 0.1-2 μg ml-1 doxycycline for 14 to 28 hours depending on the level of current required. For pulling outside-out macro-patches, we used poly-L lysine coated glass coverslips (Becton Dickinson, Franklin Lakes, NJ). Cells were also treated with kifunensine (5 μg ml-1) at the time of induction.
Currents were recorded in either whole-cell or outside-out configuration of patch clamp using an Axopatch 200A amplifier (Molecular Devices, San Jose, CA). Ligands were applied via a quad-channel super-perfusion pipette coupled to a piezoelectric element that switched the super-perfusion solution in <1 ms as described previously69. Data were acquired using Clampex 8.2 (Molecular Devices, San Jose, CA). For short drug applications, data were acquired at 10 kHz and filtered at 5 kHz, whereas for longer applications, data were collected at 2 kHz and filtered at 1 kHz. Cells or patches were continually perfused with a bath solution consisting of (in mM): 145 NaCl, 5 KCl, 10 HEPES, 2 CaCl2, 1 MgCl2 and 10 glucose, pH 7.4 (adjusted with NaOH). The pipette solution consisted of (in mM): 140 KCl, 10 HEPES, 1 EGTA, 2 MgCl2 and 2 Mg-ATP, pH 7.3 (adjusted with KOH). For whole-cell recordings, the open pipette resistances ranged from 1.3 – 2.5 MΩ and for outside-out patches 6 –10 MΩ. For whole-cell recordings, cell capacitance ranged from 5 – 13 pF and series resistance ranged from 0.2 – 2.5 MΩ. Series resistances were electronically compensated by <85% with a lag of 10 μs. Cells and patches were voltage-clamped at –52 mV unless otherwise stated. The liquid junction potential of –2 mV between the bath and pipette solution was corrected post-recordings.
Electrophysiology Data Analysis
Clampfit 9 (Molecular Devices, San Jose, CA) was used to measure the peak current amplitudes. Current traces were normalized and prepared for presentation in Origin 6 (OriginLab Corporation, Northampton, MA). All data are presented as mean ± S.D. Statistical analysis was done using Prism 6 (Graphpad Software, La Jolla, CA).
Materials
All reagents for electrophysiology solutions were purchased from either Millipore Sigma (Burlington, MA) or ThermoFisher Scientific (Waltham, MA). Diazepam, doxycycline and DMSO were purchased from Millipore Sigma (Burlington, MA). Bicuculline and Kifunensine were purchased from Tocris (Pittsburg, PA). A stock solution of bicuculline (100 mM) was prepared fresh each day in DMSO. The stock solution of diazepam (500 mM) in DMSO was stored at -80°C. A working solution of diazepam (100 μM) in the bath solution was prepared fresh daily and was dissolved by sonication. In control experiments, patches exposed to GABA (10 mM) in the presence of DMSO (0.02% used in application of diazepam) did not differ from those exposed to GABA (10 mM) alone. The small Mb38 elicited currents were enhanced by a similar small amount by 0.1% DMSO (84 ± 41% (n = 3).
Extended Data
Extended Data Figure 1. Single particle cryo-EM analysis of human α1β3γ2L GABAAR bound to the channel blocker picrotoxin (PTX).
a, Representative micrograph of the PTX-bound GABAAR particles embedded in vitreous ice. b, Representative 2D class averages. c, FSC curves for the 3D reconstruction using gold-standard refinement in RELION56. Curves shown for the phase randomisation, unmasked maps, masked and phase-randomisation corrected masked maps. d, Validation of model refinement: model versus summed map (FSCfull), model refined in half-map 1 versus half-map 1 (FSCwork), model refined in half-map 1 versus half-map 2 (FSCfree). e, The final, unsharpened cryo-EM map coloured by local resolution (estimated using MonoRes61) shown at a higher contour level (left) and at a lower level (right) to highlight the nanodisc belt and flexible intracellular domains (ICDs). f, Angular distribution of particle projections. The map of GABAAR-PTX complex is shown in teal. g, Cryo-EM density segments for the PTX binding site between residues 2' and 9' of the M2 transmembrane helices.
Extended Data Figure 2. Structural and electrophysiological analyses of human α1β3γ2L GABAAR in complex with PTX and GABA.
a, FSC curves for the 3D reconstruction of the GABAAR bound to PTX and GABA. Curves shown for the phase randomisation, unmasked maps, masked and phase-randomisation corrected masked maps. b, Validation of the model refinement protocol. Curves shown for model versus summed map (FSCfull), model refined in half-map 1 versus half-map 1 (FSCwork), model refined in half-map 1 versus half-map 2 (FSCfree). c, The final, unsharpened cryo-EM map coloured by local resolution (estimated using MonoRes61). d, Superposition of the PTX- and PTX/GABA-bound α1β3γ2 receptor based on the global TMD alignment. The GABA-induced movements of loop-C in each of the of β3 subunits are highlighted by green lines between Cα atoms of Thr202 residues. GABA is shown as spheres (carbon atoms in khaki; nitrogen, blue; oxygens, red). e, Cryo-EM density segments showing GABA binding sites the PTX/GABA-bound structure. f-h, Representative whole-cell current traces elicited from the same HEK cell by three 8.8 s pulses of GABA (5 μM) plus Mb38 (2 μM) each separated by a 1 min wash: (f) Control; (g) one second after the start of the second 8.8 s pulse, PTX (800 μM) was co-applied for 4 s; (h) wash control showing full recovery. PTX inhibited currents by 106 ± 2.6 % (mean ± S.D.; n= 6 cells). In addition, the protocol was repeated with outside–out patches (117 ± 9 % (mean ± S.D.; n = 5 patches). i, Globally superposed PTX- and PTX/GABA-bound α1β3γ2 receptor transmembrane domains viewed from the extracellular space. Side chains of 9' Leu residues are shown as sticks, whereas PTX is represented as balls and sticks. j, k, Superposition of α1 subunit ECDs from PTX-bound and PTX/GABA-bound α1β3γ2 receptors reveal the relative β3 ECD motions towards α1 ECDs, as viewed from outside of the receptor (j) and from the vestibule (k). Differences of distances (Å) between the selected Cα atoms in the complexes without and with GABA are indicated by lines. The PTX-bound structure is shown in grey and the PTX/GABA-bound structure is coloured by subunit (α1, red; β3, blue; γ2, yellow).
Extended Data Figure 3. Structural analysis of human α1β3γ2L GABAAR bound to the competitive antagonist bicuculline (BCC).
a, FSC curves for the 3D reconstruction of the GABAAR bound to BCC. Curves shown for the phase randomisation, unmasked maps, masked and phase-randomisation corrected masked maps. b, Validation of the model refinement protocol. Curves shown for model versus summed map (FSCfull), model refined in half-map 1 versus half-map 1 (FSCwork), model refined in half-map 1 versus half-map 2 (FSCfree). c, The final, unsharpened cryo-EM map coloured by local resolution (estimated using MonoRes61). d, Cryo-EM density maps of the BCC-binding pockets. e, Superposition of the PTX- and BCC-bound α1β3γ2 receptor based on the global TMD alignment. The BCC-induced movements of loop-C in each of the β3 subunits are highlighted by green lines between Cα atoms of Thr202 residues. BCC is shown as spheres (carbon atoms in khaki; nitrogen, blue; oxygens, red). f, Superposition of individual subunits from the PTX- and BCC-bound GABAAR structures. Root mean square deviation (RMSD) values (Å) for equivalent Cα in the entire subunits are shown. Loops-C are marked by arrows. The PTX-bound structure is shown in grey and the BCC-bound structure is coloured by subunit (α1, red; β3, blue; γ2, yellow).
Extended Data Figure 4. Structural analysis of human α1β3γ2L GABAAR in complexes with alprazolam (ALP) and diazepam (DZP).
a, FSC curves for the 3D reconstruction of the GABAAR bound to ALP. Curves shown for the phase randomisation, unmasked maps, masked and phase-randomisation corrected masked maps. b, Validation of the model refinement protocol. Curves shown for model versus summed map (FSCfull), model refined in half-map 1 versus half-map 1 (FSCwork), model refined in half-map 1 versus half-map 2 (FSCfree). c, The final, unsharpened cryo-EM map coloured by local resolution (estimated using MonoRes61). d-f, same as a-c but for the GABAAR bound to diazepam (DZP). g-i, Cryo-EM density maps of the ligand binding sites: ALP binding in benzodiazepine (BZD) pocket (g), DZP binding in the BZD pocket (h), DZP binding in the general anaesthetic pocket at the β3+/α1– interface (i). Ligands are shown in sticks, ALP carbon atoms coloured in blue, DZP carbon atoms coloured in teal, nitrogens in blue and chlorine atoms in green. Side chains of residues lining the binding pockets are shown as sticks and are numbered. Dotted circles highlight the difference between the structures of alprazolam and diazepam.
Extended Data Figure 5. Classical benzodiazepines, flumazenil and bretazenil bind to the same BZD pocket in GABAARs, but use different modes.
ALP/GABA- and DZP/GABA-bound structures are coloured by subunit (α1, red; β3, blue; γ2, yellow), whereas the other superposed structures are shown in grey. Loop-C is in coil representation, to allow better visualization of the benzodiazepine (BZD) pocket. a, Structural formulae of flumazenil (FZL) and (S)-bretazenil (BRZ). b, c, Superposition of γ2 subunit ECDs from the DZP-bound α1β3γ2 and FZL-bound α1β2γ2 receptor structures reveals the FZL16 (white) position in the BZD pocket relative to DZP (teal). Side-on (b) and top-down views (c) of the pocket are presented. d, e, the same as for b, c but the structural alignment shows the relative position of the BRZ15 (white). Grey dashed lines indicate hydrogen bonds FZL and BRZ form with γ2Thr142 in the BZD pocket. f, Superposition of γ2 subunit ECDs from the PTX-, PTX/GABA-, BCC-, DZP/GABA- to ALP/GABA-bound γ2 ECD illustrates BZD pocket conformational changes associated with ALP/DZP binding: (i) an outward movement of loop-C; (ii) rearrangement of γ2Tyr58 and γ2Phe77 side chains, and (iii) change of the γ2Asn60 rotamer. g, Superposition of the α1-D subunit ECDs from the PTX-bound and ALP/GABA-bound α1β3γ2 structures shows that ALP binding causes only a minimal outwards motion of the α1 loop-C, by 0.8 Å as measured between Ser206 Cα atom positions.
Extended Data Figure 6. Superimposition of individual subunits from ALP- and DZP-bound α1β3γ2L GABAAR structures.
Superposition of the individual subunits from the DZP- (grey) and ALP-bound (α1, red; β3, blue; γ2, yellow) GABAAR structures. Root mean square deviation (RMSD) values are in the 0.38-0.41 Å range for α1 (343-344 equivalent Cα positions), 0.37-0.40 Å for β3 (334-336 equivalent Cα positions) and 0.47 Å for γ2 subunits (330 equivalent Cα positions). Loops-C are marked by arrows.
Extended Data Figure 7. Structural analysis of PTX- and ALP/GABA-bound α1β3γ2L GABAAR structures.
The PTX-bound structure is shown in grey and the ALP/GABA-bound structure is coloured by subunit (α1, red; β3, blue; γ2, yellow). a, b, Superposition of α1 subunit ECDs from PTX-bound and ALP/GABA-bound GABAARs reveals the relative β3 ECD motions towards α1 ECDs, as viewed from outside of the receptor (a) and from the vestibule (b). Differences in distances (Å) between the selected Cα atoms in the complexes without and with GABA are indicated with lines. c, Individual subunits from the PTX- and ALP/GABA-bound GABAAR structures superposed based on the global TMD alignment (ALP/GABA TMD over PTX TMD). Angles between vectors representing M2 helices and the pore axis of the PTX-bound structure are shown. Side chains of residues at -2′ and 9′ positions are shown. d, Superposition of TMDs from PTX- and ALP/GABA-bound structures. RMSD values (Å) are shown for entire TMDs and for the M2-M3 loops (see Methods for boundary definitions).
Extended Data Figure 8. Conformational differences at the ECD-TMD interfaces between PTX-bound (closed) and ALP/GABA-bound (desensitised) α1β3γ2L GABAAR structures.
The PTX-bound structure is shown in grey and the ALP/GABA-bound structure is coloured by subunit (α1, red; β3, blue; γ2, yellow). The TMDs of the principal subunits of PTX-bound and ALP/GABA-bound structures were superposed allowing visualisation of relative movements of neighbouring ECDs and TMDs. a, b, Structural rearrangements of the ECD–TMD interface between α1-A and β3-E subunits. c, d, the same as a, b, but for γ2-C and β3-B subunits. e, f, the same as a, b, but for β3-B and α1-A subunits. Amino acid residues present in β1-β2 loop tip in each subunit are shown, the Cαs for these residues are represented as spheres and the distances of displacement indicated. The strictly conserved M2-M3 loop proline residue interacting with the β1-β2 loop is shown for each subunit. β1-β2 loop motions are indicated by curved arrows. g-l, Conformational differences in the M2-M3 loop and 19' Arg side chain positions between the PTX- and the ALP/GABA-bound structures shown for α-A (g, h), g2-C (i, j) and b3-B (k, l) subunits. Neighbouring subunit M1 and M2 helices are shown as cylinders. Dashed lines indicate putative hydrogen bond interactions between amino acid side chains and mainchain carbonyls.
Extended Data Table 1. Cryo-EM data collection, refinement and validation statistics.
*Local resolution range. ΨResolution at which FSC between map and model is 0.5.
| PTX | PTX/GABA | BCC | ALP/GABA | DZP/GABA | |
|---|---|---|---|---|---|
| EMDB-0275 PDB: 6HUG |
EMDB-0279 PDB 6HUJ |
EMDB-0280 PDB 6HUK |
EMDB-0282 PDB 6HUO |
EMDB-0283 PDB 6HUP |
|
| Data collection and processing | |||||
| Microscope, location | Krios-S, STRUBI |
Krios-II, MRC-LMB |
Krios-II, MRC- LMB |
Krios-II, MRC- LMB |
Krios-I, MRC- LMB |
| Magnification | 75,000 | 75,000 | 75,000 | 75,000 | 130,000 |
| Voltage (kV) | 300 | 300 | 300 | 300 | 300 |
| Detector | Falcon 3EC with VPP |
Falcon 3EC with VPP |
Falcon 3EC | Falcon 3EC with VPP |
K2 Summit with GIF |
| Pixel size (Å) | 1.055 | 1.07 | 1.07 | 1.07 | 0.89 |
| Electron exposure (e–/Å2) | 30 | 30 | 30 | 30 | 62 |
| Exposure length (s) | 60 | 60 | 60 | 60 | 14 |
| Dose rate (e–/pixel/s) | 0.5 | 0.55 | 0.55 | 0.55 | 4.5 |
| Frame number | 75 | 75 | 75 | 75 | 40 |
| Defocus range (μm) | -0.7 to -0.5 | -0.7 to -0.5 | -0.7 to -0.5 | -0.7 to -0.5 | -3.6 to -2.4 |
| Micrographs collected (no.) | 803 | 794 | 988 | 815 | 768 |
| Micrographs selected (no.) | 664 | 659 | 964 | 617 | 593 |
| Initial particle images (no.) | 205,673 | 292,669 | 489,434 | 210,073 | 233,543 |
| Final particle images (no.) | 56,269 | 67,604 | 30,536 | 39,050 | 55077 |
| Symmetry imposed | C1 | C1 | C1 | C1 | C1 |
| Map resolution (Å) | 3.10 | 3.04 | 3.69 | 3.26 | 3.58 |
| FSC threshold | 0.143 | 0.143 | 0.143 | 0.143 | 0.143 |
| Map resolution range (Å)* | 2.6-6.0 | 2.6-6.0 | 2.4-6.0 | 2.7-6.0 | 2.4-6.0 |
| Refinement | |||||
| Initial model used (PDB code) | N/A | N/A | N/A | N/A | N/A |
| Model resolution (Å2) | 3.15 | 3.13 | 3.75 | 3.34 | 3.66 |
| FSC threshold | 0.5 | 0.5 | 0.5 | 0.5 | 0.5 |
| Model resolution range (Å)Ψ | 3.15 | 3.13 | 3.75 | 3.34 | 3.66 |
| Map sharpening B factor (Å2) | -73 | -82 | -128 | -79 | -119 |
| Model composition | |||||
| Protein residues | 1,817 | 1,814 | 1,817 | 1,810 | 1,810 |
| Non-hydrogen atoms | 15,297 | 15,263 | 15,308 | 15,235 | 15,273 |
| Protein atoms | 14,788 | 14,763 | 14,788 | 14,733 | 14,733 |
| N-linked glycan atoms | 394 | 372 | 372 | 372 | 372 |
| PTX atoms | 21 | 21 | - | - | - |
| GABA atoms | - | 14 | - | 14 | 14 |
| BCC atoms | - | - | 54 | - | - |
| ALP atoms | - | - | - | 22 | - |
| DZP atoms | - | - | - | - | 60 |
| PIP2 atoms | 94 | 94 | 94 | 94 | 94 |
| R.m.s. deviations | |||||
| Bond lengths (Å) | 0.005 | 0.005 | 0.009 | 0.005 | 0.013 |
| Bond angles (°) | 0.81 | 0.79 | 0.78 | 0.81 | 1.11 |
| Validation | |||||
| MolProbity score | 1.45 | 1.50 | 1.53 | 1.50 | 1.66 |
| Clashscore | 4.64 | 4.55 | 4.97 | 4.66 | 5.86 |
| Poor rotamers (%) | 0 | 0 | 0 | 0 | 0 |
| Ramachandran plot | |||||
| Favored (%) | 96.65 | 96.03 | 96.04 | 96.19 | 95.07 |
| Allowed (%) | 3.35 | 3.97 | 3.96 | 3.81 | 4.93 |
| Disallowed (%) | 0 | 0 | 0 | 0 | 0 |
Extended Data Table 2. Analysis of interfaces between α1β3γ2L GABAAR subunits.
*Buried surface area per interface (sum of monomer areas buried at the interface, divided by 2, calculated using PDBePISA67). †ΔiG (solvation energy gain at complex formation) is the change of the solvation energy of a subunit due to interface formation, in kcal/mol, calculated using PDBePISA67).
| Subunit interface | Interface area* (Å2) | ΔiG† (kcal/mol) | |||||
|---|---|---|---|---|---|---|---|
| ECD | TMD | Full subunit | ECD | TMD | Full subunit | ||
| PTX | α1-A+/ β3-E− | 1536 | 1182 | 2797 | -11.5 | -23.7 | -35.7 |
| β3-E+/ α1-D− | 1246 | 1583 | 2905 | -12.3 | -30.4 | -43.8 | |
| α1-D+/ γ2-C− | 1400 | 1229 | 2781 | -5.8 | -25.2 | -32.3 | |
| γ2-C+/ β3-B− | 1619 | 1203 | 2895 | -13.7 | -20.4 | -34.7 | |
| β3-B+/ α1-A− | 1251 | 1652 | 2990 | -13.3 | -31.1 | -45.7 | |
| Mb38/ α1-A | 810 | - | 829 | -6.0 | - | -6.1 | |
| Mb38/ β3-E | 232 | - | 232 | -2.1 | - | -2.1 | |
| PTX/GABA | α1-A+/ β3-E− | 1534 | 1224 | 2856 | -11.9 | -24.8 | -35.8 |
| β3-E+/ α1-D− | 1480 | 1534 | 3113 | -13.2 | -28.9 | -43.6 | |
| α1-D+/ γ2-C− | 1423 | 1221 | 2781 | -6.4 | -25.0 | -32.4 | |
| γ2-C+/ β3-B− | 1618 | 1204 | 2911 | -13.8 | -21.6 | -36.5 | |
| β3-B+/ α1-A− | 1435 | 1618 | 3166 | -14.5 | -29.8 | -45.9 | |
| Mb38/ α1-A | 822 | - | 834 | -7.0 | - | -7.1 | |
| Mb38/ β3-E | 248 | - | 248 | -2.3 | - | -2.3 | |
| BCC | α1-A+/ β3-E− | 1531 | 1180 | 2810 | -10.5 | -24.5 | -36.1 |
| β3-E+/ α1-D− | 1309 | 1555 | 2982 | -14.0 | -29.4 | -44.4 | |
| α1-D+/ γ2-C− | 1426 | 1155 | 2737 | -7.9 | -23.4 | -32.6 | |
| γ2-C+/ β3-B− | 1589 | 1214 | 2894 | -12.7 | -21.1 | -34.9 | |
| β3-B+/ α1-A− | 1319 | 1602 | 3043 | -11.8 | -30.0 | -43.7 | |
| Mb38 / α1-A | 815 | - | 830 | -6.2 | - | -6.3 | |
| Mb38 / γ3-E | 248 | - | 248 | -2.9 | - | -2.9 | |
| GABA/ALP | α1-A+/ β3-E− | 1563 | 1167 | 2833 | -11.8 | -23.3 | -35.8 |
| β3-E+/ α1-D− | 1501 | 1353 | 2960 | -13.8 | -24.0 | -39.9 | |
| α1-D+/ γ2-C− | 1346 | 1051 | 2512 | -5.6 | -19.5 | -25.1 | |
| γ2-C+/ β3-B− | 1620 | 1220 | 2937 | -11.9 | -22.0 | -34.4 | |
| β3-B+/ α1-A− | 1510 | 1415 | 3034 | -14.4 | -25.8 | -40.9 | |
| Mb38 / α1-A | 834 | - | 834 | -5.8 | - | -5.9 | |
| Mb38 / β3-E | 238 | - | 238 | -2.6 | - | -2.6 | |
| GABA/DZP | α1-A+/ β3-E− | 1527 | 1103 | 2733 | -11.2 | -24.0 | -36.4 |
| β3-E+/ α1-D− | 1453 | 1273 | 2838 | -13.3 | -22.1 | -37.0 | |
| α1-D+/ γ2-C− | 1324 | 1063 | 2505 | -4.1 | -23.5 | -28.4 | |
| γ2-C+/ β3-B− | 1564 | 1168 | 2846 | -13.2 | -19.7 | -33.3 | |
| β3-B+/ α1-A− | 1473 | 1377 | 2955 | -12.9 | -23.3 | -37.1 | |
| Mb38 / α1-A | 794 | - | 800 | -5.5 | - | -5.7 | |
| Mb38 / β3-E | 231 | - | 231 | -2.4 | - | -2.4 | |
Supplementary Material
Acknowledgments
We thank G. Cannone and S. Chen for cryo-EM assistance at the MRC-LMB; Y. Chaban and K. Dent for cryo-EM assistance at the Electron Bio-Imaging Centre (eBIC), Diamond Light Source; L. Dong, T. Nakane and S. Scheres for advice on cryo-EM data processing; J. Grimmett and T. Darling for IT and computing support; members of the Aricescu laboratory discussions and comments on the manuscript. This work was supported by the UK Medical Research Council grants MR/L009609/1, MC_UP_1201/15 (A.R.A., S.M., D.L.) and MC_UP_A025_1013 (J.Z.); UK Biotechnology and Biological Sciences Research Council grant BB/M024709/1 (A.R.A., D.L.); Human Frontier Science Program grant RGP0065/2014 (A.R.A.); Cancer Research UK grant C20724/A14414 (T.M.); Swiss National Science Foundation fellowship 168735 (J.Z.). R.D. and K.W.M. were supported by a grant from the National Institute for General Medical Sciences (GM 58448) and by the Department of Anaesthesia, Critical Care and Pain Medicine, Massachusetts General Hospital. We thank INSTRUCT, part of the European Strategy Forum on Research Infrastructures and the Research Foundation-Flanders (FWO) for funding nanobody discovery and for a doctoral fellowship to T.U.
Footnotes
Author Contributions S.M. and A.R.A. conceived the project. S.M. carried out protein purification, collected and processed the cryo-EM data, built and refined the models, with assistance from A.R.A. R.D. and K.W.M. designed and analysed the electrophysiological experiments, which were performed by R.D. T.U., E.P. and J.S. designed and generated Mb38. I.S.M. contributed to sample screening by cryo-EM. D.L. developed VPP data collection protocols and contributed to model building. D.K. and A.K. contributed to cryo-EM data collection on the Krios-S. T.M. contributed to the analysis of structural data. J.Z. developed CTF refinement algorithms. S.M. and A.R.A. wrote the manuscript with input from all co-authors.
Author information Reprints and permissions information is available at www.nature.com/reprints.
The authors declare no competing interests.
Data availability
All data are available from the authors and/or included in the manuscript or Supplementary Information. Atomic coordinates for PTX-, PTX/GABA-, BCC-, ALP/GABA- and DZP/GABA-bound structures were deposited in the Protein Data Bank with accession codes 6HUG, 6HUJ, 6HUK, 6HUO and 6HUP, respectively, and the cryo-EM density maps have been deposited in the Electron Microscopy Data Bank with accession codes EMD-0275, EMD-0279, EMD-0280, EMD-0282 and EMD-0283, respectively.
References
- 1.Sieghart W. Structure and pharmacology of gamma-aminobutyric acid A receptor subtypes. Pharmacol Rev. 1995;47:181–234. [PubMed] [Google Scholar]
- 2.Barnard EA, et al. International Union of Pharmacology. XV. Subtypes of gamma-aminobutyric acid A receptors: classification on the basis of subunit structure and receptor function. Pharmacol Rev. 1998;50:291–313. [PubMed] [Google Scholar]
- 3.Sigel E, Steinmann ME. Structure, function, and modulation of GABAA receptors. J Biol Chem. 2012;287:40224–31. doi: 10.1074/jbc.R112.386664. [DOI] [PMC free article] [PubMed] [Google Scholar]
- 4.Möhler H. GABAA receptors in central nervous system disease: anxiety, epilepsy and insomnia. J Recept Signal Transduct. 2006;26:731–740. doi: 10.1080/10799890600920035. [DOI] [PubMed] [Google Scholar]
- 5.Olsen RW. Analysis of γ-aminobutyric acid (GABA) type A receptor subtypes using isosteric and allosteric ligands. Neurochem Res. 2014;39:1924–1941. doi: 10.1007/s11064-014-1382-3. [DOI] [PubMed] [Google Scholar]
- 6.Olsen RW. Allosteric ligands and their binding sites define γ-aminobutyric acid (GABA) type A receptor subtypes. Adv Pharmacol. 2015;73:167–202. doi: 10.1016/bs.apha.2014.11.005. [DOI] [PubMed] [Google Scholar]
- 7.Hunkeler W. Benzodiazepines, the story of the antagonist flumazenil and of the partial agonist bretazenil. Chim Int J Chem. 1993;47:141–147. [Google Scholar]
- 8.Squires RF, Brastrup C. Benzodiazepine receptors in rat brain. Nature. 1977;266:732–734. doi: 10.1038/266732a0. [DOI] [PubMed] [Google Scholar]
- 9.Sigel E, Mamalaki C, Barnard EA. Isolation of a GABA receptor from bovine brain using a benzodiazepine affinity column. FEBS Lett. 1982;147:45–8. doi: 10.1016/0014-5793(82)81008-9. [DOI] [PubMed] [Google Scholar]
- 10.Schofield PR, et al. Sequence and functional expression of the GABAA receptor shows a ligand-gated receptor super-family. Nature. 1987;328:221–227. doi: 10.1038/328221a0. [DOI] [PubMed] [Google Scholar]
- 11.Hibbs RE, Gouaux E. Principles of activation and permeation in an anion-selective Cys-loop receptor. Nature. 2011;474:54–60. doi: 10.1038/nature10139. [DOI] [PMC free article] [PubMed] [Google Scholar]
- 12.Miyazawa A, Fujiyoshi Y, Unwin N. Structure and gating mechanism of the acetylcholine receptor pore. Nature. 2003;423:949–955. doi: 10.1038/nature01748. [DOI] [PubMed] [Google Scholar]
- 13.Miller PS, Aricescu AR. Crystal structure of a human GABAA receptor. Nature. 2014;512:270–275. doi: 10.1038/nature13293. [DOI] [PMC free article] [PubMed] [Google Scholar]
- 14.Miller PS, et al. Structural basis for GABAA receptor potentiation by neurosteroids. Nat Struct Mol Biol. 2017;24:986–992. doi: 10.1038/nsmb.3484. [DOI] [PMC free article] [PubMed] [Google Scholar]
- 15.Laverty D, et al. Crystal structures of a GABAA-receptor chimera reveal new endogenous neurosteroid-binding sites. Nat Struct Mol Biol. 2017;24:977–985. doi: 10.1038/nsmb.3477. [DOI] [PMC free article] [PubMed] [Google Scholar]
- 16.Chen Q, et al. Structural basis of neurosteroid anesthetic action on GABAA receptors. Nat Commun. 2018;9 doi: 10.1038/s41467-018-06361-4. 3972. [DOI] [PMC free article] [PubMed] [Google Scholar]
- 17.Liu S, et al. Cryo-EM structure of the human α5β3 GABAA receptor. Cell Res. 2018;28:958–961. doi: 10.1038/s41422-018-0077-8. [DOI] [PMC free article] [PubMed] [Google Scholar]
- 18.Zhu S, et al. Structure of a human synaptic GABAA receptor. Nature. 2018;559:67–72. doi: 10.1038/s41586-018-0255-3. [DOI] [PMC free article] [PubMed] [Google Scholar]
- 19.Phulera S, et al. Cryo-EM structure of the benzodiazepine-sensitive α1β1γ2S tri-heteromeric GABAA receptor in complex with GABA. Elife. 2018;7:e39383. doi: 10.7554/eLife.39383. [DOI] [PMC free article] [PubMed] [Google Scholar]
- 20.Miller P, et al. Heteromeric GABAA receptor structures in positively-modulated active states. bioRxiv. 2018 doi: 10.1101/338343. 338343. [DOI] [Google Scholar]
- 21.Baumann SW, Baur R, Sigel E. Individual properties of the two functional agonist sites in GABAA receptors. J Neurosci. 2003;23:11158–11166. doi: 10.1523/JNEUROSCI.23-35-11158.2003. [DOI] [PMC free article] [PubMed] [Google Scholar]
- 22.Tan KR, Rudolph U, Lüscher C. Hooked on benzodiazepines: GABAA receptor subtypes and addiction. Trends Neurosci. 2011;34:188–197. doi: 10.1016/j.tins.2011.01.004. [DOI] [PMC free article] [PubMed] [Google Scholar]
- 23.Knoflach F, et al. Pharmacological modulation of the diazepam-insensitive recombinant gamma-aminobutyric acidA receptors alpha 4 beta 2 gamma 2 and alpha 6 beta 2 gamma 2. Mol Pharmacol. 1996;50:1253–1261. [PubMed] [Google Scholar]
- 24.Johnston GAR. Advantages of an antagonist: Bicuculline and other GABA antagonists. British Journal of Pharmacology. 2013;169:328–336. doi: 10.1111/bph.12127. [DOI] [PMC free article] [PubMed] [Google Scholar]
- 25.Krishek BJ, Moss SJ, Smart TG. A functional comparison of the antagonist bicuculline and picrotoxin at recombinant GABAA receptors. Neuropharmacology. 1996;35:1289–1298. doi: 10.1016/s0028-3908(96)00089-5. [DOI] [PubMed] [Google Scholar]
- 26.Goutman JD, Calvo DJ. Studies on the mechanisms of action of picrotoxin, quercetin and pregnanolone at the GABA rho 1 receptor. Br J Pharmacol. 2004;141:717–727. doi: 10.1038/sj.bjp.0705657. [DOI] [PMC free article] [PubMed] [Google Scholar]
- 27.Xu X-J, Roberts D, Zhu G-N, Chang Y-C. Competitive antagonists facilitate the recovery from desensitization of α1β2γ2 GABAA receptors expressed in Xenopus oocytes. Acta Pharmacol Sin. 2016;37:1020–1030. doi: 10.1038/aps.2016.50. [DOI] [PMC free article] [PubMed] [Google Scholar]
- 28.Dostalova Z, et al. Human α1β3γ2L gamma-aminobutyric acid type A receptors: High-level production and purification in a functional state. Protein Sci. 2014;23:157–166. doi: 10.1002/pro.2401. [DOI] [PMC free article] [PubMed] [Google Scholar]
- 29.Laverty D, et al. Structure of the human synaptic α1β2γ2 GABAA receptor in a lipid bilayer. Nature. doi: 10.1038/s41586-018-0833-4. In this issue. [DOI] [PMC free article] [PubMed] [Google Scholar]
- 30.Chen L, Durkin KA, Casida JE. Structural model for gamma-aminobutyric acid receptor noncompetitive antagonist binding: widely diverse structures fit the same site. Proc Natl Acad Sci U S A. 2006;103:5185–5190. doi: 10.1073/pnas.0600370103. [DOI] [PMC free article] [PubMed] [Google Scholar]
- 31.Xu M, Covey DF, Akabas MH. Interaction of picrotoxin with GABAA receptor channel-lining residues probed in cysteine mutants. Biophys J. 1995;69:1858–67. doi: 10.1016/S0006-3495(95)80056-1. [DOI] [PMC free article] [PubMed] [Google Scholar]
- 32.Gurley D, Amin J, Ross PC, Weiss DS, White G. Point mutations in the M2 region of the alpha, beta, or gamma subunit of the GABAA channel that abolish block by picrotoxin. Recept Channels. 1995;3:13–20. [PubMed] [Google Scholar]
- 33.Bali M, Akabas MH. The location of a closed channel gate in the GABAA receptor channel. J Gen Physiol. 2007;129:145–159. doi: 10.1085/jgp.200609639. [DOI] [PMC free article] [PubMed] [Google Scholar]
- 34.Wang D-S, Mangin J-M, Moonen G, Rigo J-M, Legendre P. Mechanisms for picrotoxin block of 2 homomeric glycine receptors. J Biol Chem. 2006;281:3841–3855. doi: 10.1074/jbc.M511022200. [DOI] [PubMed] [Google Scholar]
- 35.Unwin N. Nicotinic acetylcholine receptor and the structural basis of neuromuscular transmission: insights from Torpedo postsynaptic membranes. Q Rev Biophys. 2013;46:283–322. doi: 10.1017/S0033583513000061. [DOI] [PMC free article] [PubMed] [Google Scholar]
- 36.Qian H, Pan Y, Zhu Y, Khalili P. Picrotoxin accelerates relaxation of GABAC receptors. Mol Pharmacol. 2004;67:470–479. doi: 10.1124/mol.104.003996. [DOI] [PubMed] [Google Scholar]
- 37.Chang Y, Weiss DS. Site-specific fluorescence reveals distinct structural changes with GABA receptor activation and antagonism. Nat Neurosci. 2002;5:1163–1168. doi: 10.1038/nn926. [DOI] [PubMed] [Google Scholar]
- 38.Mehta AK, Ticku MK. Characterization of the picrotoxin site of GABAA receptors. Curr Protoc Pharmacol. 2001;8 doi: 10.1002/0471141755.ph0118s08. [DOI] [PubMed] [Google Scholar]
- 39.Talwar S, Lynch JW. Phosphorylation mediated structural and functional changes in pentameric ligand-gated ion channels: Implications for drug discovery. Int J Biochem Cell Biol. 2014;53:218–223. doi: 10.1016/j.biocel.2014.05.028. [DOI] [PubMed] [Google Scholar]
- 40.Olsen RW. GABAA receptor: Positive and negative allosteric modulators. Neuropharmacology. 2018;136:10–22. doi: 10.1016/j.neuropharm.2018.01.036. [DOI] [PMC free article] [PubMed] [Google Scholar]
- 41.Chang Y, et al. Desensitization mechanism of GABA receptors revealed by single oocyte binding and receptor function. J Neurosci. 2002;22:7982–7990. doi: 10.1523/JNEUROSCI.22-18-07982.2002. [DOI] [PMC free article] [PubMed] [Google Scholar]
- 42.Gielen M, Corringer P-J. The dual-gate model for pentameric ligand-gated ion channels activation and desensitization. J Physiol. 2018;596:1873–1902. doi: 10.1113/JP275100. [DOI] [PMC free article] [PubMed] [Google Scholar]
- 43.Ueno S, Bracamontes J, Zorumski C, Weiss DS, Steinbach JH. Bicuculline and gabazine are allosteric inhibitors of channel opening of the GABAA receptor. J Neurosci. 1997;17:625–634. doi: 10.1523/JNEUROSCI.17-02-00625.1997. [DOI] [PMC free article] [PubMed] [Google Scholar]
- 44.Middendorp SJ, et al. Relative positioning of classical benzodiazepines to the γ2 subunit of GABAA receptors. ACS Chem Biol. 2014;9:1846–1853. doi: 10.1021/cb500186a. [DOI] [PubMed] [Google Scholar]
- 45.Wieland HA, Lüddens H, Seeburg PH. A single histidine in GABAA receptors is essential for benzodiazepine agonist binding. J Biol Chem. 1992;267:1426–1429. [PubMed] [Google Scholar]
- 46.Rudolph U, Knoflach F. Beyond classical benzodiazepines: novel therapeutic potential of GABAA receptor subtypes. Nat Rev Drug Discov. 2011;10:685–697. doi: 10.1038/nrd3502. [DOI] [PMC free article] [PubMed] [Google Scholar]
- 47.Forman SA, Miller KW. Anesthetic sites and allosteric mechanisms of action on Cys-loop ligand-gated ion channels. Canadian Journal of Anesthesia. 2011;58:191–205. doi: 10.1007/s12630-010-9419-9. [DOI] [PMC free article] [PubMed] [Google Scholar]
- 48.Walters RJ, Hadley SH, Morris KDW, Amin J. Benzodiazepines act on GABAA receptors via two distinct and separable mechanisms. Nat Neurosci. 2000;3:1274–1281. doi: 10.1038/81800. [DOI] [PubMed] [Google Scholar]
- 49.Fisher JL. A lysine residue in the β3 subunit contributes to the regulation of GABAA receptor activity by voltage. Mol Cell Neurosci. 2002;20:683–694. doi: 10.1006/mcne.2002.1143. [DOI] [PubMed] [Google Scholar]
- 50.Renaud J-P, et al. Cryo-EM in drug discovery: achievements, limitations and prospects. Nat Rev Drug Discov. 2018;17:471–492. doi: 10.1038/nrd.2018.77. [DOI] [PubMed] [Google Scholar]
- 51.Einhauer A, Jungbauer A. The FLAG peptide, a versatile fusion tag for the purification of recombinant proteins. J Biochem Biophys Methods. 2001;49:455–465. doi: 10.1016/s0165-022x(01)00213-5. [DOI] [PubMed] [Google Scholar]
- 52.Molday RS, MacKenzie D. Monoclonal antibodies to rhodopsin: characterization, cross-reactivity, and application as structural probes. Biochemistry. 1983;22:653–660. doi: 10.1021/bi00272a020. [DOI] [PubMed] [Google Scholar]
- 53.Ritchie TK, et al. Methods in enzymology. 2009;464:211–231. doi: 10.1016/S0076-6879(09)64011-8. [DOI] [PMC free article] [PubMed] [Google Scholar]
- 54.Javaheri A, et al. Helicobacter pylori adhesin HopQ engages in a virulence-enhancing interaction with human CEACAMs. Nat Microbiol. 2017;2:16189. doi: 10.1038/nmicrobiol.2016.189. [DOI] [PubMed] [Google Scholar]
- 55.Pardon E, et al. A general protocol for the generation of Nanobodies for structural biology. Nat Protoc. 2014;9:674–693. doi: 10.1038/nprot.2014.039. [DOI] [PMC free article] [PubMed] [Google Scholar]
- 56.Zivanov J, et al. New tools for automated high-resolution cryo-EM structure determination in RELION-3. Elife. 2018;7:e42166. doi: 10.7554/eLife.42166. [DOI] [PMC free article] [PubMed] [Google Scholar]
- 57.Zheng SQ, et al. MotionCor2: Anisotropic correction of beam-induced motion for improved cryo-electron microscopy. Nature Methods. 2017;14:331–332. doi: 10.1038/nmeth.4193. [DOI] [PMC free article] [PubMed] [Google Scholar]
- 58.Zhang K. Gctf: Real-time CTF determination and correction. J Struct Biol. 2016;193:1–12. doi: 10.1016/j.jsb.2015.11.003. [DOI] [PMC free article] [PubMed] [Google Scholar]
- 59.Punjani A, Rubinstein JL, Fleet DJ, Brubaker MA. CryoSPARC: Algorithms for rapid unsupervised cryo-EM structure determination. Nat Methods. 2017;14:290–296. doi: 10.1038/nmeth.4169. [DOI] [PubMed] [Google Scholar]
- 60.Zivanov J, Nakane T, Scheres SHW. A Bayesian approach to beam-induced motion correction in cryo-EM single-particle analysis. IUCrJ. 2019;6 doi: 10.1107/S205225251801463X. [DOI] [PMC free article] [PubMed] [Google Scholar]
- 61.Vilas JL, et al. MonoRes: automatic and accurate estimation of local resolution for electron microscopy maps. Structure. 2018;26:337–344. doi: 10.1016/j.str.2017.12.018. [DOI] [PubMed] [Google Scholar]
- 62.Pettersen EF, et al. UCSF Chimera - A visualization system for exploratory research and analysis. J Comput Chem. 2004;25:1605–1612. doi: 10.1002/jcc.20084. [DOI] [PubMed] [Google Scholar]
- 63.Emsley P, Lohkamp B, Scott WG, Cowtan K. Features and development of Coot. Acta Crystallogr Sect D Biol Crystallogr. 2010;66:486–501. doi: 10.1107/S0907444910007493. [DOI] [PMC free article] [PubMed] [Google Scholar]
- 64.Afonine PV, et al. Real-space refinement in PHENIX for cryo-EM and crystallography. Acta Crystallogr Sect D, Struct Biol. 2018;74:531–544. doi: 10.1107/S2059798318006551. [DOI] [PMC free article] [PubMed] [Google Scholar]
- 65.Chen VB, et al. MolProbity: All-atom structure validation for macromolecular crystallography. Acta Crystallogr Sect D Biol Crystallogr. 2010;66:12–21. doi: 10.1107/S0907444909042073. [DOI] [PMC free article] [PubMed] [Google Scholar]
- 66.Afonine PV, et al. New tools for the analysis and validation of cryo-EM maps and atomic models. Acta Crystallogr Sect D Struct Biol. 2018;74:814–840. doi: 10.1107/S2059798318009324. [DOI] [PMC free article] [PubMed] [Google Scholar]
- 67.Krissinel E, Henrick K. Inference of macromolecular assemblies from crystalline state. J Mol Biol. 2007;372:774–797. doi: 10.1016/j.jmb.2007.05.022. [DOI] [PubMed] [Google Scholar]
- 68.Smart OS, Neduvelil JG, Wang X, Wallace BA, Sansom MSP. HOLE: A program for the analysis of the pore dimensions of ion channel structural models. J Mol Graph. 1996;14:354–360. doi: 10.1016/s0263-7855(97)00009-x. [DOI] [PubMed] [Google Scholar]
- 69.Forman SA. A hydrophobic photolabel inhibits nicotinic acetylcholine receptors via open-channel block following a slow step. Biochemistry. 1999;38:14559–14564. doi: 10.1021/bi9914457. [DOI] [PubMed] [Google Scholar]
Associated Data
This section collects any data citations, data availability statements, or supplementary materials included in this article.


