Abstract
Nonalcoholic steatohepatitis (NASH) is a progressive form of nonalcoholic fatty liver disease that can develop into cirrhosis, hepatic failure, and hepatocellular carcinoma. Although several metabolic pathways are disrupted and endogenous metabolites may change in NASH, the alterations in serum metabolites during NASH development remain unclear. To gain insight into the disease mechanism, serum metabolite changes were assessed using metabolomics with ultraperformance liquid chromatography-electrospray ionization-quadrupole time-of-flight mass spectrometry and a conventional mouse NASH model induced by a methionine- and choline-deficient (MCD) diet. Significant decreases in serum palmitoyl-, stearoyl-, and oleoyl-lysophosphatidylcholine (LPC) and marked increases in tauro-β-muricholate, taurocholate and 12-hydroxyeicosatetraenoic acid (12-HETE) were detected in mice with NASH. In agreement with these metabolite changes, hepatic mRNAs encoding enzymes and proteins involved in LPC degradation (lysophosphatidylcholine acyltransferase [Lpcat] 1–4), basolateral bile acid excretion (ATP-binding cassette subfamily C member [Abcc] 1/4/5 and organic solute transporter β), and 12-HETE synthesis (arachidonate 12-lipoxygenase) were significantly up-regulated. In contrast, the expression of solute carrier family 10 member 1 (Slc10a1) and solute carrier organic anion transporter family member (Slco) 1a1 and 1b2, responsible for transporting bile acids into hepatocytes, were markedly suppressed. Supplementation of the MCD diet with methionine revealed that the changes in serum metabolites and the related gene expression were derived from steatohepatitis, but not dietary choline deficiency or steatosis. Furthermore, tumor necrosis factor-α and transforming growth factor-β1 induced the expression of Lpcat2/4 and Abcc1/4 and down-regulated Slc10a1 and Slco1a1 in primary hepatocytes, suggesting an association between the changes in serum LPC and bile acids and proinflammatory cytokines. Finally, induction of hepatitis in ob/ob mice by D- galactosamine injection led to similar changes in serum metabolites and related gene expression.
Conclusion:
Phospholipid and bile acid metabolism is disrupted in NASH, likely due to enhanced hepatic inflammatory signaling.(HEPATOLOGY 2012;56:118-129)
The prevalence of nonalcoholic fatty liver disease (NAFLD) is increasing worldwide.1,2 NAFLD is classified into two disease entities, simple steatosis (SS) and steatohepatitits, based on the histological findings. Although SS has a potentially benign clinical course, nonalcoholic steatohepatitis (NASH) is the progressive form of NAFLD and can develop into cirrhosis, hepatic failure, and hepatocellular carcinoma.3-5 Indeed, population-based studies demonstrated that humans with NASH show significantly higher mortality rates compared with those who have SS and the general population.6,7 Thus, elucidating the mechanism of NASH development and establishing noninvasive methods to differentiate NASH from NAFLD are of great importance.
Several studies have demonstrated a major contribution of proinflammatory cytokines, such as tumor necrosis factor-α (TNF-α), interleukin (IL)-1β, and IL-6, oxidative stress, and endoplasmic reticulum (ER) stress to the progression from steatosis to steatohepatitis.8–11 Additionally, aberrant intrahepatic accumulation of saturated fatty acids, cholesterol, and iron was reported to be associated with the pathogenesis of NASH.8–11 As steatohepatitis develops, metabolic cascades in the liver are disrupted and endogenous metabolites change accordingly. However, the alterations in serum metabolites associated with NASH and its mechanism are not fully understood.
Metabolomics using ultraperformance liquid chromatography-electrospray ionization-quadrupole time-of-flight mass spectrometry (UPLC-ESI-QTOFMS) has been employed for the detection and characterization of small organic molecules in biological materials.12,13 This method can detect global metabolic changes in response to various stimuli in an unbiased manner. Such analysis using serum has clarified the metabolic alteration in various liver diseases, such as viral hepatitis,14 acetaminophen-induced liver toxicity,15 and cholestatic liver disease16. Thus, the intriguing possibility has emerged that serum metabolomic analysis enables the discovery of endogenous metabolites that are significantly altered in NASH.
In the present study, to explore endogenous metabolites associated with NASH, a comprehensive analysis of serum metabolites was carried out using UPLC-ESI-QTOFMS in mice treated with a methionine- and choline-deficient (MCD) diet, a representative mouse model of NASH, and gene expression patterns were assessed to understand the mechanism of serum metabolite changes.
Materials and Methods
Mice.
All animal studies were conducted in accordance with Institute of Laboratory Animal Resource (ILAR) guidelines and were approved by the National Cancer Institute Animal Care and Use Committee. The mice were housed in a specific pathogen-free environment controlled for temperature and light (25°C, 12-hour light/dark cycle) and maintained with NIH31 regular chow and tap water ad libitum.
For MCD diet-induced NASH, male C57BL/6NCr mice at 8–10 weeks of age were used. The MCD diet was purchased from Dyets Inc. (#518810; Bethlehem, PA), and a methionine- and choline-supplemented MCD diet (MCS, #518754; Dyets) was used as a control diet. Five days before starting the experiments, NIH31 chow was replaced with the MCS diet for acclimatization.
The study of MCD diet-induced NASH consisted of three independent experiments. First, male C57BL/ 6NCr mice (n = 16) were randomly divided into four groups and treated with the MCD and MCS diets for 2 and 8 weeks, respectively (n = 4 in each group). Second, male C57BL/6NCr mice (n = 30) were randomly divided into six groups and treated with the MCD and MCS diets for 3 days, 1 week, and 2 weeks, respectively (n = 5 in each group) as a time- course study. Finally, a third experiment was performed to examine the contribution of methionine or choline deficiency to the changes in serum metabolites induced by MCD diet treatment. Male C57BL/6NCr mice (n = 20) were randomly divided into four groups as follows: (1) MCS diet with sterile deionized drinking water (n = 5); (2) MCD diet with sterile deionized drinking water (n = 5); (3) MCD diet with sterile deionized drinking water containing choline bitartrate (30 mg/mL; Sigma-Aldrich, St. Louis, MO; n = 5); and (4) MCD diet with sterile deionized drinking water containing L-methionine (4 mg/mL; Sigma-Aldrich; n = 5). These interventions were continued for 2 weeks, and the drinking water was changed every 2 days. The amount of water/food consumption was measured and no significant differences among the groups were confirmed. At the prescribed time points, mice were killed after 6-hour fasting, and blood was collected using Serum Separator Tubes (Becton, Dickinson and Company, Franklin Lakes, NJ) and centrifuged for 10 minutes at 8000 g at 4°C to isolate serum. Sera and livers were immediately frozen and kept at —80°C until use.
For validation, 8-week-old male ob/ob mice with a C57BL/6J background (n = 10) were randomly divided into two groups. Male C57BL/6J mice of the same age (n = 5) were used as controls. D-galactosamine (GalN, 800 mg/kg body weight, dissolved in saline) was injected intraperitoneally in one ob/ob mouse group to induce hepatitis.17 For the other groups, the same amount of saline was injected in a similar manner. Sixty hours after the injection, mice were killed to collect sera and livers.
UPLC-ESI-QTOFMS Analysis.
Serum was diluted with 66% acetonitrile containing 5 μM of chlorpropamide as an internal standard and centrifuged twice at 18,000g for 25 minutes at 4°C for removal of precipitated proteins and other particulates. The detailed UPLC-ESI-QTOFMS method has been described elsewhere.16,18 The eluted sample (5 μL/injection) was introduced by electrospray ionization into the mass spectrometer [Q-TOF Premier (Waters Corp., Milford, MA)] operating in either negative or positive electrospray ionization modes. All samples were analyzed in a randomized fashion to avoid complications caused by artifacts related to injection order and changes in instrument efficiency. MassLynx software (Waters) was used to acquire the chromatogram and mass spectrometric data.
Centroided and integrated chromatographic mass data were processed by MarkerLynx (Waters) to generate a multivariate data matrix. Pareto-scaled MarkerLynx matrices including information on sample identity were analyzed by principal components analysis (PCA) and supervised orthogonal projection to latent structures (OPLS) analysis using SIMCA-P+12 (Umetrics, Kinnelon, NJ). The OPLS loadings scatter S-plot was used to determine those ions that contributed significantly to the separation between MCD diet-treated and MCS diet-treated mice. The identity of ions with a correlation of 0.8 or higher to the model was further investigated. The identity of ions was confirmed by tandem mass spectrometry MS/MS fragmentation patterns as reported.16
Quantitative Polymerase Chain Reaction (qPCR) Analysis.
Total liver RNA was extracted using a TRI-zol Reagent (Invitrogen, Carlsbad, CA), and cDNA was generated from 1 μg RNA with a SuperScript II Reverse Transcriptase kit and random oligonucleotides (Invitrogen). qPCR was performed using SYBR green PCR master mix and ABI-Prism 7900HT Sequence Detection System (Applied Biosystems, Foster City, CA).19,20 The primer pairs were designed using qPrimerDepot and are listed in Supporting Table 1. Measured mRNA levels were normalized to those of 18S ribosomal RNA and expressed as fold change relative to those of control mice.
Histological Analysis.
Small blocks of liver tissue from all mice were immediately fixed in 10% neutral formalin and embedded in paraffin. Sections (4 μm thick) were stained by the hematoxylin and eosin or Sirius red method.19,20 At least three discontinuous liver sections were evaluated for each mouse.
Biochemical Analysis.
Serum activities of alanine aminotransferase (ALT) and alkaline phosphatase (ALP) were measured with ALT and ALP assay kits, respectively (Catachem, Bridgeport, CT). Hepatic triglyceride (TG) contents were determined as described elsewhere.19,20
Preparation and Culture of Primary Hepatocytes.
Primary hepatocytes were isolated from C57BL/ 6NCr mice as described16 and treated with 100 ng of TNF-α (Sigma-Aldrich), 10 ng of transforming growth factor-β1 (TGF-β1; R & D Systems, Minneapolis, MN), and 100 μM of H2O2 (Sigma-Aldrich), respectively. At the prescribed time points, cells were harvested and subjected to qPCR analysis.
Statistical Analysis.
Quantitative data were expressed as mean ± standard deviation, and statistical analyses were performed using the two-tailed Student t test and one-way ANOVA with Tukey’s test and Dunnett’s test, respectively. Correlation analysis was carried out by Pearson’s method. A P value of less than 0.05 was considered to be statistically significant.
Results
Serum Metabolomic Analysis of Mice Treated With MCD Diet.
Mice treated for 8 weeks with the MCD diet demonstrated typical steatohepatitis, as revealed by the presence of lobular inflammation, hepatocyte ballooning, and perivenular/perisinusoidal fibrosis in addition to macrovesicular steatosis (Supporting Fig. 1A). Significant increases in serum ALT and ALP levels and hepatic TG contents were observed in these mice as well (Supporting Fig. 1B). To examine serum metabolites, PCA was performed using UPLC- ESI-QTOFMS negative mode data derived from sera of mice treated with the MCD and MCS diets for 8 weeks. PCA demonstrated clear discrimination between the two groups (Fig. 1A), and the loading plot identified several metabolites that were significantly altered in MCD diet-treated mice (Fig. 1B). OPLS analysis also showed a clear separation between the two groups (data not shown), which was further examined with an S-plot and contribution analysis.
Fig. 1.
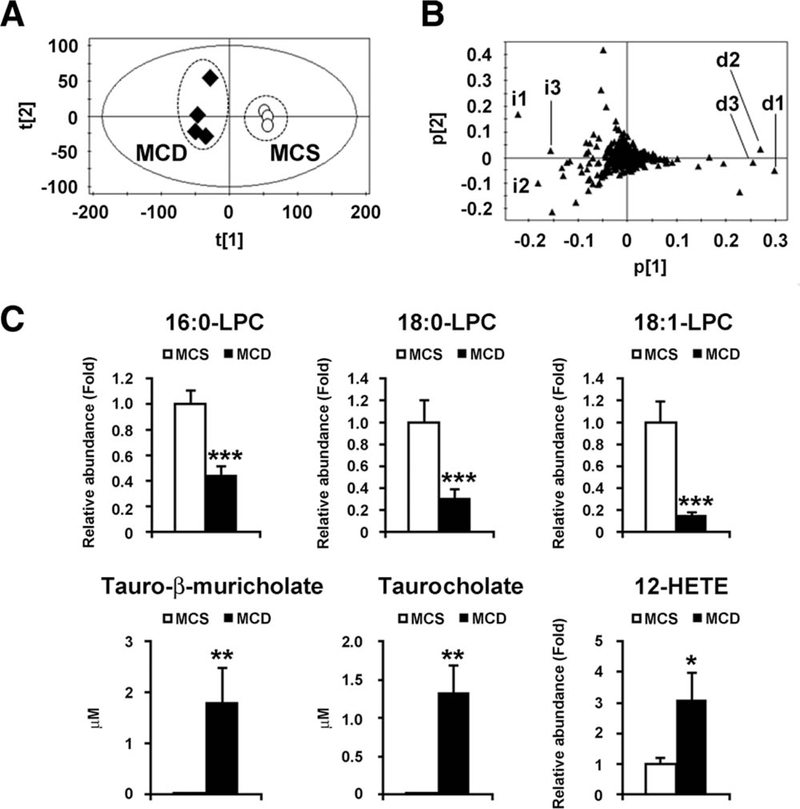
Identification of serum metabolites significantly altered in mice with 8-week MCD diet treatment. (A) PCA of serum metabolites between MCD diet (n = 4, closed diamond) and MCS diet (n = 4, open circle). (B) Loading plot of PCA. i, increased ions; d, decreased ions. (C) Serum levels of LPC, tauro-β-muricholate, tauro- cholate, and 12-HETE. The levels of LPC and 12-HETE were normalized to those of MCS-treated mice and are expressed as relative abundance. Statistical analysis was performed using the two-tailed Student t test (n = 4 in each group). *, P < 0.05; **, P < 0.01; ***, P < 0.001.
The top 10 ions that were significantly altered in MCD diet-treated mice selected by contribution analysis are listed in Table 1. Of these, the top three decreased ions were 1-palmitoyl-sn-glycero-3-phosphocholine (palmitoyl-lysophosphatidylcholine [LPC]; 16:0-LPC), 1-stearoyl-sn-glycero-3-phospho- choline (stearoyl-LPC; 18:0-LPC), and 1-oleoyl-sn- glycero-3-phosphocholine (oleoyl-LPC; 18:1-LPC) (d1, d2, and d3 in Fig. 1B, respectively). Serum 16:0, 18:0-, and 18:1-LPC levels in MCD diet- treated mice were significantly decreased to approximately 40%, 30%, and 15%, respectively, of such levels in MCS diet-treated mice (Fig. 1C). Furthermore, the top three increased ions were tauro-β-muricholate, tauocholate, and 12-hydroxyei- cosatetraenoic acid (12-HETE) (i1, i2, and i3 in Fig. 1B, respectively, and Fig. 1C). Similar results were obtained using the UPLC-ESI-QTOFMS positive mode data (data not shown).
Table 1.
Top Ten Serum Ions That Were Significantly Altered in Mice Treated With MCD Diet for 8 Weeks Compared With Mice Treated With MCS Diet*
| Rank | RT (min) | Found (m/z) | Identity | Mass Error (ppm) | Elemental Composition |
|---|---|---|---|---|---|
| Increased ions | |||||
| 1 | 2.55 | 514.2843 | Tauro-β-muricholate | 0.97 | C26H45NO7S |
| 2 | 4.71 | 319.2271 | 12-Hydroxyeicosatetraenoic acid | 0.63 | C20H32O3 |
| 3 | 2.92 | 514.2829 | Taurocholate | 1.75 | C26H45NO7S |
| 4 | 6.44 | 381.1723 | Not determined | ||
| 5 | 5.81 | 327.2319 | Docosahexaenoic acid | 1.53 | C22H32O2 |
| 6 | 5.97 | 379.1568 | Not determined | ||
| 7 | 5.97 | 279.2318 | Linoleic acid | 2.15 | C18H32O2 |
| 8 | 6.44 | 281.2474 | Oleic acid | 2.49 | C18H34O2 |
| 9 | 2.59 | 512.2684 | Not determined | ||
| 10 | 4.34 | 241.1808 | Not determined | ||
| Decreased ions | |||||
| 1 | 4.78 | 540.3303 | Palmitoyl-LPC (16:0-LPC) | 0.37 | C25H52NO9P |
| 2 | 5.40 | 568.3615 | Stearoyl-LPC (18:0-LPC) | 0.18 | C27H56NO9P |
| 3 | 4.94 | 566.3463 | Oleoyl-LPC (18:1-LPC) | 0.88 | C27H54NO9P |
| 4 | 4.57 | 564.3303 | Linoleoyl-LPC (18:2-LPC) | 0.35 | C27H52NO9P |
| 5 | 0.28 | 215.0325 | Not determined | ||
| 6 | 4.57 | 588.3306 | Arachidonoyl-LPC (20:4-LPC) | 0.85 | C29H52NO9P |
| 7 | 4.53 | 612.3291 | Docosahexanoyl-LPC (22:6-LPC) | 1.63 | C31H52NO9P |
| 8 | 4.40 | 538.3137 | Palmitoleoyl-LPC (16:1-LPC) | 1.49 | C25H50NO9P |
| 9 | 4.53 | 524.2776 | Not determined | ||
| 10 | 4.77 | 590.3455 | Not determined | ||
The ion ranking, based on OPLS analysis, shows the highest confidence and greatest contribution to separation between MCD and MCS diet treatment. RT, retention time; LPC, lysophosphatidylcholine.
To rule out the possibility that such metabolite changes are simply the result of advancement of NASH, the same analysis was performed using mice with 2-week MCD and MCS diet treatment. PCA showed clear separation between the two groups (Fig. 2A). The top 10 ions that changed in the MCD diet-treated mice are listed in Supporting Table 2. Interestingly, the top three increased and decreased ions were completely identical to those in the 8-week MCD diet treatment: decreased ions were 16:0-LPC, 18:0-LPC, and 18:1-LPC (d1, d2, and d3 in Fig. 2B, respectively, and Fig. 2C), and increased ions were tauro-β-muricholate, tauocholate, and 12-HETE (i1, i2, and i3 in Fig. 2B, respectively, and Fig. 2C). These results indicate that MCD diet treatment significantly decreases serum LPC levels and increases serum levels of bile acids and 12-HETE.
Fig. 2.
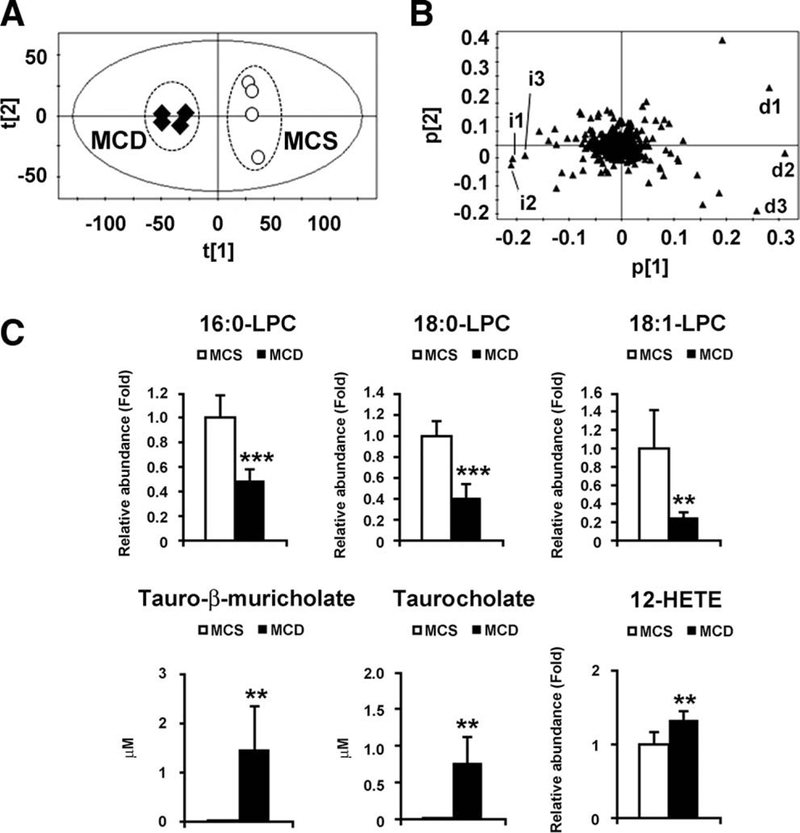
Identification of serum metabolites significantly altered in mice with 2-week MCD diet treatment. (A) PCA of serum metabolites between MCD diet (n = 4, closed diamond) and MCS diet (n = 4, open circle). (B) Loading plot of PCA. i, increased ions; d, decreased ions. (C) Serum levels of LPC, tauro-β-muricholate, taurocholate, and 12-HETE. The levels of LPC and 12-HETE were normalized to those of MCS-treated mice and are expressed as relative abundance. Statistical analysis was performed using the two-tailed Student t test (n = 4 in each group). **, P < 0.01; ***, P < 0.001.
Hepatic Expression of Genes Related to Metabolism of LPC, Bile Acid, and 12-HETE.
To determine the mechanism of the changes in metabolites, hepatic mRNA levels of the genes associated with LPC metabolism were examined in mice treated with the MCD diet for 8 weeks. LPC is catabolized by lysophosphati-dylcholine acyltransferase (Lpcat) 1–4, lysophospholi-pase A1 (Lypla1), and ectonucleotide pyrophosphatase/ phosphodiesterase 2 (Enpp2). Of these, the mRNAs encoding Lpcat1–4, key enzymes that convert LPC into phosphatidylcholine (PC; i.e., Lands’ cycle), were significantly increased in MCD diet-treated mice (Fig. 3A). The mRNA levels of Lyplal, Enpp2, and lecithin cholesterol acyltransferase (Lcat), an enzyme that converts PC into LPC, did not differ between the groups. These results suggest that decreased serum LPC is associated with hepatic up-regulation of Lpcatl-4.
Fig. 3.
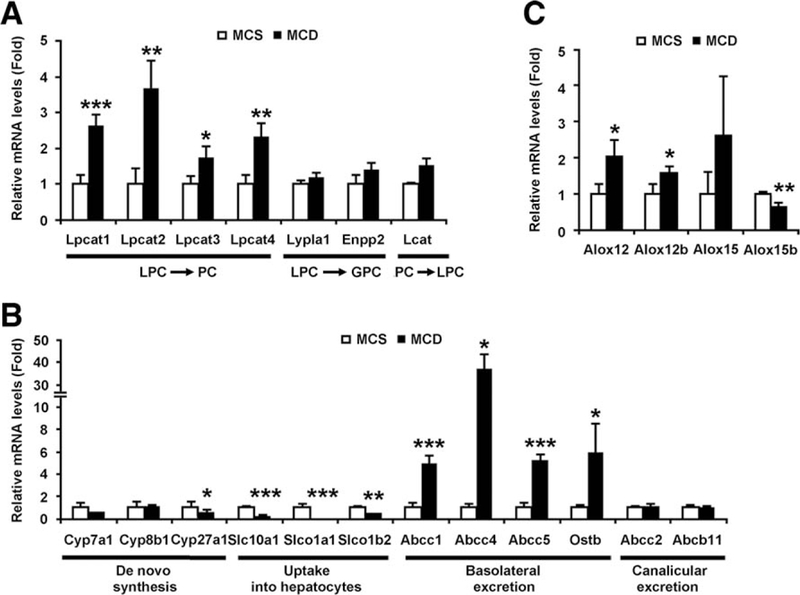
Hepatic mRNA levels of genes associated with metabolism of LPC (A), bile acids (B), and 12-HETE (C) in mice with 8-week MCD diet treatment. The mRNA levels were normalized to those of 18S ribosomal mRNA and subsequently normalized to those of MCS-treated mice. Statistical analysis was performed using the two-tailed Student t test (n = 4 in each group). *, P < 0.05; **, P < 0.01; ***, P < 0.001; PC, phos-phatidylcholine; GPC, glycerophosphocholine.
Next, hepatic mRNA levels of the genes related to bile acid metabolism were measured. The mRNAs encoding cholesterol 7α-hydroxylase (Cyp7a1) and 8β- hydroxylase (Cyp8b1) were unchanged, and those encoding sterol 27-hydroxylase (Cyp27a1) were decreased by MCD diet treatment (Fig. 3B). The levels of the genes involved in bile acid uptake into hepatocytes (solute carrier family 10 member 1 [Slc10a1, also known as Ntcp] and solute carrier organic anion transporter family member 1a1 [Slco1a1, also known as Oatp1] and 1b2 [Slco1b2, also known as Oatp2]) were significantly down-regulated in MCD diet- treated mice (Fig. 3B).
Additionally, the mRNA levels of the genes encoding basolateral bile acid excretion transporters (ATP-binding cassette subfamily C member 1/4/5 [Abcc1/4/5, also known as Mrp1/4/5] and organic solute transporter β [Ostb]) were markedly increased in MCD diet-treated mice (Fig. 3B). The expression of canalicular bile acid excretion transporters (Abcc2 [also known as Mrp2] and ATP-binding cassette subfamily B member 11 [Abcb11, also known as Bsep]) was unchanged (Fig. 3B). Furthermore, mRNA encoding arachidonate 12-lipoxygenase (Alox12), involved in 12-HETE metabolism, was increased by MCD diet treatment (Fig. 3C). All these changes in the mRNA levels were also detected in mice treated with the MCD diet for 2 weeks (Supporting Fig. 2).
Time Course of the Changes in Serum Metabolites and the Related Genes.
To further clarify the association between the development of NASH and the changes in serum metabolites and related genes, mice were fed an MCD diet for 3 days, 1 week, and 2 weeks, and the changes in serum metabolites and related gene expression were investigated. Serum ALT levels and hepatic TG contents were increased as early as 3 days after starting MCD treatment and further increased after 2 weeks of treatment (Supporting Fig. 3). The increases in serum ALP levels followed those in serum ALT levels, and both were correlated with altered hepatic pathologies (Supporting Fig. 3). Although the changes in serum LPC and 12-HETE became greater in a time-dependent manner, serum tauro-β-muricholate and taurocholate were rapidly increased in mice treated with the MCD diet for 2 weeks (Supporting Fig. 4A).
Serum LPC levels were decreased with the increases in hepatic expression of Lpcat1–4 (Supporting Fig. 4). Indeed, serum concentrations of 16:0-, 18:0-, and 18:1-LPC demonstrated a strong negative correlation with hepatic mRNAs encoding Lpcat1–4, especially Lpcat1/2/4 (Supporting Fig. 5A). Increased tauro-β- muricholate and taurocholate levels paralleled the increases in Abcc1/4/5 and Ostb mRNAs and the decreases in mRNAs encoding Slc10a1 and Slco1a1 (Supporting Fig. 4). These bile acid levels were strongly correlated with Abcc1 mRNA levels (Supporting Fig. 5B). However, serum 12-HETE levels did not correlate with hepatic Alox12 mRNA levels (Supporting Fig. 5C).
Decreased LPC and Increased Bile Acids in Serum Are Characteristic of Steatohepatitis.
Because LPC is a precursor of PC and PC is known to be an important endogenous compound associated with bile acid excretion and maintenance of choline homeostasis,21,22 it is reasonable to consider that the decreased LPC and the increased tauro-β-muricholate and taurocholate in serum simply result from dietary choline deficiency Therefore, supplementation of methionine or choline to the MCD diet was examined. Methionine supplementation to the MCD diet, i.e., choline-deficient (CD) diet treatment, induced steatosis without lobular inflammation and hepatocyte degeneration, resembling the features of SS (Fig. 4A). In contrast, choline supplementation to MCD diet treatment, i.e., methionine-deficient (MD) diet treatment, produced no abnormalities in the liver (Fig. 4A,B). Interestingly, the decreases in serum LPC and the increases in Lpcat1–4 mRNA levels were detected in mice with MCD diet treatment, but not in mice with CD treatment (Figs. 4C, 5).
Fig. 4.
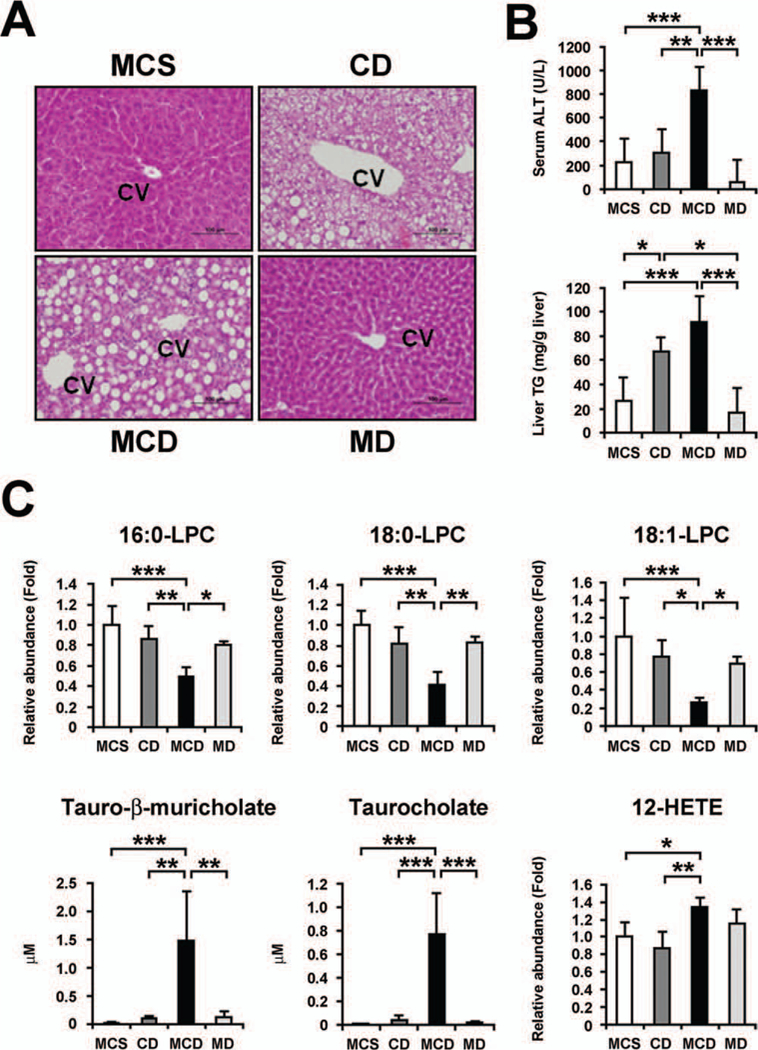
The effect of methionine and choline supplementation to MCD diet treatment on liver phenotypes and serum metabolites. (A) Liver histology. Liver sections were stained by the hematoxylin and eosin method. Methionine supplementation to MCD diet (dietary choline-deficient treatment [CD]) caused severe steatosis without apparent lobular inflammation, but choline supplementation (dietary methionine-deficient treatment [MD]) showed no liver abnormalities. Bars represent 100 im. CV, central vein. (B) Serum ALT levels and hepatic TG contents. Statistical analysis was performed using one-way ANOVA with Tukey’s test (n = 5 in each group). *, P < 0.05; **, P < 0.01; ***, P < 0.001. (C) Serum levels of LPC, tauro-β- muricholate, taurocholate, and 12- HETE. The levels of LPC and 12- HETE were normalized to those of MCS-treated mice and are expressed as relative abundance. Statistical analysis and abbreviations are the same as those in (B).
Fig. 5.
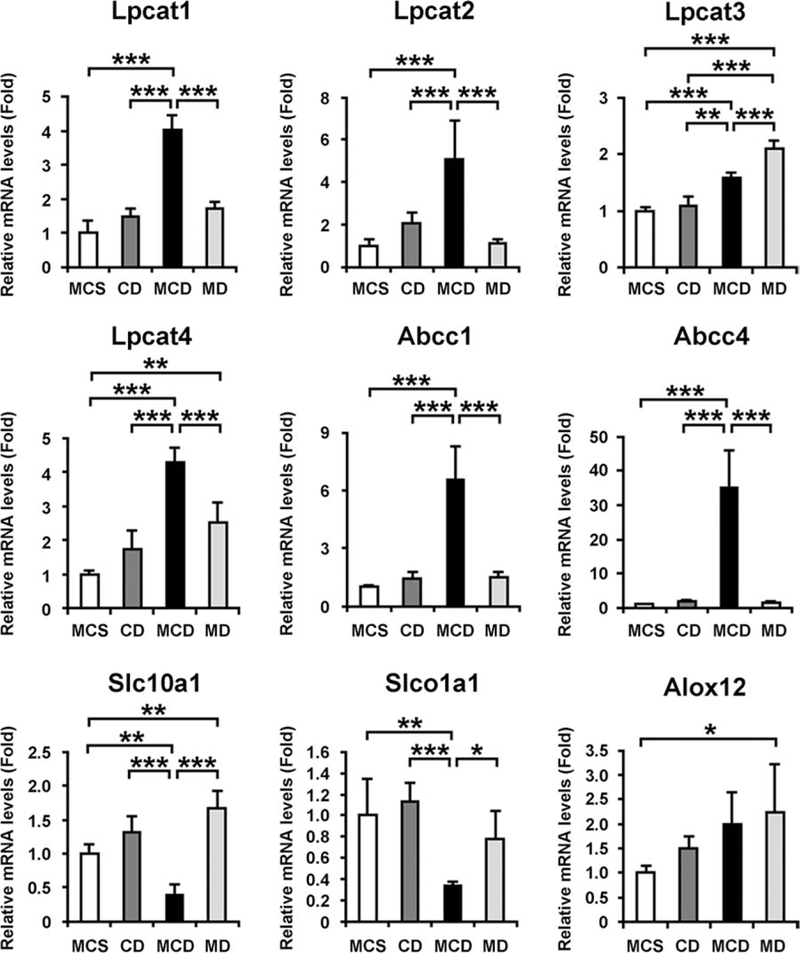
The effect of methionine and choline supplementation to MCD diet treatment on hepatic mRNA levels of genes associated with metabolism of LPC, bile acids, and 12- HETE. The mRNA levels were normalized to those of 18S ribosomal mRNA and subsequently normalized to those of MCS-treated mice. Statistical analysis was performed using the one-way ANOVA with Tukey’s test (n = 5 in each group). *, P < 0.05; **, P < 0.01; ***, P < 0.001; MD, methionine-deficient treatment; CD, choline-deficient treatment.
Similarly, the increases in serum tauro-β-muricholate and taurocholate and the changes in hepatic expression of Abcc1/4, Slc10a1, and Slco1a1 were found in MCD-treated mice only (Figs. 4C, 5). However, there was no significant difference in serum 12-HETE and hepatic Alox12 mRNA levels between the mice treated with MCD and MD diets (Figs. 4C, 5). Overall, these results clearly demonstrate that decreased LPC and increased tauro-β-muricholate and taurocholate in serum were not a consequence of dietary choline deficiency or steatosis and were closely associated with steatohepatitis.
TNF-α and TGF-β1 Up-Regulate the Expression of Lpcat2/4 in Primary Hepatocytes.
Proinflammatory cytokines, such as TNF-α, IL-6, and TGF-β1, are among the major contributors to the pathogenesis of NASH.8–11,23 Indeed, hepatic mRNA levels of TNF-α and TGF-β1 were increased in a time-dependent manner by MCD diet treatment, but not by CD or MD treatment (Supporting Fig. 6). To examine the direct contribution of these cytokines to serum LPC decreases, the mRNAs encoding Lpcat1–4 were measured in primary hepatocytes treated with TNF-α and TGF-β1. TNF-α significantly induced the expression of Lpcat2/4 mRNA, whereas TGF-β1 markedly up-regulated the Lpcat4 mRNA levels (Fig. 6A). Thus, hepatic up-regulation of TNF-α and TGF-β1 and the accompanying induction of Lpcat2/4 were considered to be among causes of steatohepatitis-specific decreases in serum LPC.
Fig. 6.
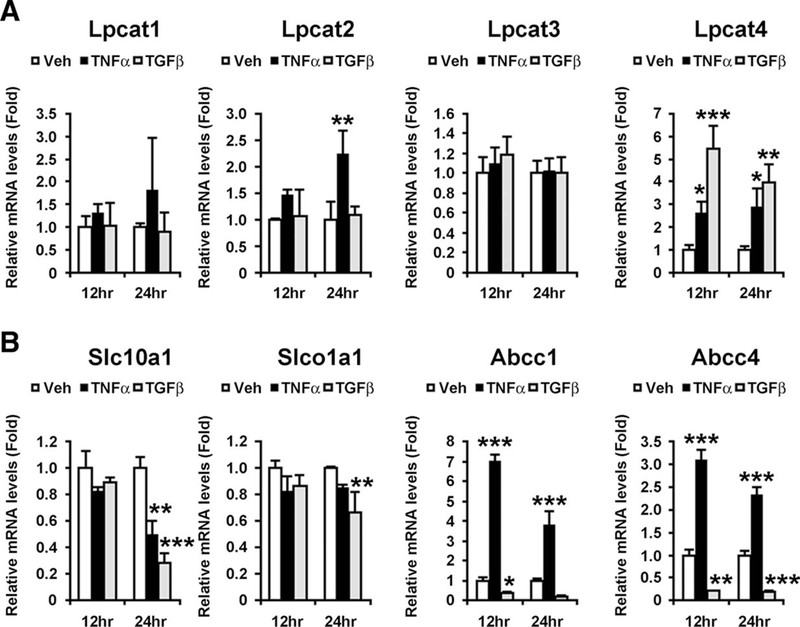
Changes in expression of Lpcats (A) and bile acid transporters (B) by TNF-α and TGF-β1 in primary hepatocytes. Primary hepatocytes were treated with TNF-α (100 ng) and TGF-β1 (10 ng) for 12 and 24 hours, respectively, and harvested to extract total RNA. The mRNA levels were normalized to those of 18S ribosomal mRNA and subsequently normalized to those of vehicle-treated hepatocytes in the same time point. Statistical analysis was performed using one-way ANOVA with Dunnett’s test (n = 3 in each group). *, P < 0.05; **, P < 0.01; ***, P < 0.001.
TNF-α and TGF-β1 Modulate the Expression of Bile Acid Transporters in Primary Hepatocytes.
The relationship between these cytokines and the expression of bile acid transporters was also examined. TNF-α markedly enhanced the mRNA levels of Abcc1/4, but TGF-β1 had the opposite effect (Fig. 6B). Furthermore, TNF-α down-regulated the expression of Slc10a1, and TGF-b1 also significantly suppressed the mRNAs encoding Slc10a1 and Slco1a1 (Fig. 6B). These results suggest a close relationship between increases in serum bile acid levels and these proinflammatory cytokines.
Effect of H2O2 on the Expression of Lpcats and Bile Acid Transporters in Primary Hepatocytes.
Oxidative stress is another key mediator of NASH development.8–11 Hepatic mRNA encoding NADPH oxidase 2 (NOX2, also designated Cybb), a representative reactive oxygen species-generating enzyme, was significantly induced in a time-dependent manner and by MCD diet treatment (Supporting Fig. 7A,B). However, treatment of primary hepatocytes with H2O2 did not increase the mRNAs encoding Lpcat1–4 and Abcc1/4 or decrease those of Slc10a1 and Slcolal (Supporting Fig. 7C).
Decreases in LPC and Increases in Bile Acids in Serum of ob/ob Mice Treated With GalN.
To determine whether similar metabolite changes were seen in another steatosis/steatohepatitis model, genetically obese ob/ob mice were treated with GalN.17 ob/ob mice showed severe steatosis without apparent hepatitis; GalN injection induced severe inflammation and hepatocyte injury, large increases in serum ALT levels, and marked up-regulation of hepatic mRNAs encoding TNF-α and TGF-β1 (Supporting Fig. 8). Although serum levels of 18:0- and 18:1-LPC were constitutively higher in ob/ob mice than those in wild-type mice, serum LPC levels were significantly decreased and serum levels of tauro-β-muricholate and taurocholate were markedly increased in GalN-injected ob/ob mice compared with saline-injected ob/ob mice (Supporting Fig. 9A). The changes in the related gene expression corresponded to those in serum metabolites (Supporting Fig. 9B). Therefore, these results corroborate the view that decreased LPC and increased tauro-β-muricholate and taurocholate in serum were caused by enhancement of hepatic inflammatory signaling (Fig. 7.).
Fig. 7.
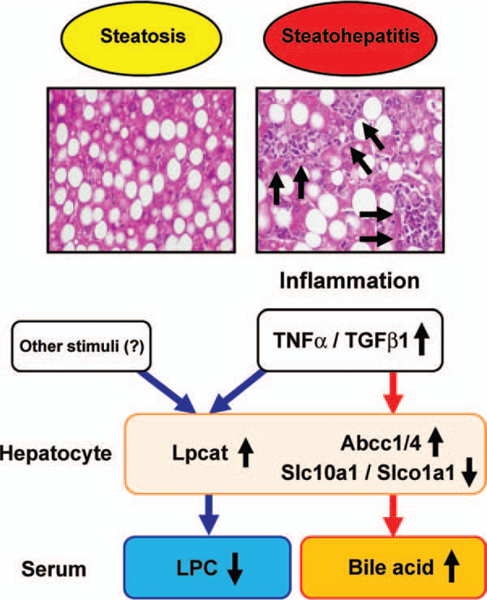
Proposed mechanism of serum metabolite changes in NASH.
Discussion
Serum metabolomic analysis in the present study revealed that 16:0-, 18:0-, and 18:1-LPC were significantly decreased and tauro-β-muricholate, taurocholate, and 12-HETE markedly increased in mice with NASH induced by MCD diet treatment. The decreases in serum LPC resulted from hepatic up-regulation of Lpcat1–4, and the increases in serum bile acids were related to increased expression of Abcc1/4 and reduced expression of Slc10a1 and Slco1a1. Interestingly, these changes depended on steatohepatitis, but not dietary choline deficiency and the resultant steatosis. Furthermore, the mRNAs encoding Lpcat2/4 and Abcc1/4 were induced and those encoding Slc10a1 and Slco1a1 were suppressed by TNF-α and/ or TGF-β1 in primary hepatocytes, suggesting a direct contribution of proinflammatory cytokines to altered expression of these genes. Finally, similar changes in serum metabolites and related gene expression were also detected in GalN-injected ob/ob mice showing steatohepatitis. These results demonstrate that phospholipid and bile acid metabolism is disrupted or significantly altered in NASH, likely because of enhancement of hepatic inflammation (Fig. 7.).
The decreases in serum LPC concentrations detected in mice with NASH were significantly correlated with hepatic up-regulation of Lpcat1–4, especially Lpcat1/2/ 4. Because the liver is known to be a major source of serum LPC,24,25 it is plausible that serum LPC levels are strongly influenced by hepatic Lpcat expression. However, serum concentrations of 18:0- and 18:1- LPC were increased in ob/ob mice compared with wild-type mice regardless of unaltered Lpcat1–4 mRNA levels (Supporting Fig. 9), suggesting the presence of complex regulatory mechanisms of serum LPC concentrations.
Lpcat1 expression was also significantly increased in both NASH models, but was not induced by exposure to TNF-α, TGF-β1, and H2O2 in primary hepatocytes. This is in agreement with a report that the activity and expression of Lpcat1 are independent of inflammatory stimuli in macrophages, in contrast to Lpcat2.26 At present, the precise mechanism of Lpcat1 regulation during these disease processes remains unclear. Lpcat1 is a key enzyme of the Lands’ cycle, involving remodeling of PC from LPC, and is localized in the ER. PC is not only an essential component of biomembranes, but also protects cells and their organelles from oxidative stress, lipotoxicity, and ER stress.27 Under circumstances in which various cytotoxic stresses are augmented in the liver, such as NASH, alcoholic liver disease,28 and cholestasis,16 a demand for PC may become greater and Lpcat1 might be induced accordingly. Further studies are needed to clarify the molecular mechanism of Lpcat1 induction.
It has been demonstrated that Lpcat3 is the most abundant isoform of Lpcats in liver.29 However, in this study, the correlation coefficients of Lpcat1/2/4 mRNA levels with serum LPC concentrations were greater than those of Lpcat3 mRNA levels. Furthermore, Lpcat3 was not induced by TNF-α, TGF-β1, and H2O2 in primary hepatocytes. These findings suggest a different expression of Lpcats in the liver under pathological conditions.
As revealed using two steatosis/steatohepatitis models, the decreases in serum LPC were associated with steatohepatitis, but not steatosis. Although LPC itself is reported to possess lipotoxic properties,30,31 the decreases in serum LPC levels are likely the result of hepatic inflammation.
One of the intriguing findings in this study was the significant increases in serum bile acid concentrations specifically in NASH. Tauro-β-muricholate is produced mainly by the alterative bile acid synthetic pathway involving Cyp27a1, whereas taurocholate is synthesized by the classic pathway through the involvement of Cyp7a1.32 Although proinflammatory cytokines can modulate the hepatic bile acid biosynthesis pathway,32 the levels of Cyp27a1 mRNA were decreased whereas Cyp7a1 mRNA remained unchanged in mice under MCD treatment. In addition, the expression of bile acid transporters on the canalicular membrane of the hepatocyte for biliary secretion, i.e., Abcc2 and Abcb11, was also unchanged by the MCD diet. Thus, the contribution of these two pathways to increased serum bile acid levels appears to be minor. It is well known that inflammatory signals act as potent regulators of the expression of sinusoidal and basolateral bile acid transporters. For example, li-popolysaccharide (LPS) down-regulates the expression of Slc10a1 and Slco1a1 and increases Abcc1.33 In human primary hepatocytes, TNF-α, IL-6, and IL-1β reduce the expression of Slc10a1.34 Furthermore, depletion of Kupffer cells inhibits LPS-induced down-regulation of Slc10a1 and up-regulation of Abcc4 through attenuating the increases in TNF-α expression.35,36 The present results support these previous observations and provide one of the mechanisms of how inflammatory signaling disrupts bile acid homeostasis in the liver.
A plasma lipidomic analysis showed increased 5-HETE and 11-HETE in patients with NASH.37 In this study, 12-HETE was significantly increased by MCD diet treatment, but there was no significant difference between MD and MCD treatment, indicating that 12-HETE increase is associated with dietary methionine deficiency. The relationship between methionine deficiency and fatty acid/eicosanoid metabolism is under investigation.
The findings in the present study suggest that serum levels of LPC and bile acids are altered with disease severity and progression also in alcoholic liver disease. Additionally, it may be of great interest to investigate the differences in serum metabolites between alcoholic steatohepatitis and NASH. Future studies would answer these questions.
Lastly, the metabolomic analysis in the current study is advantageous in detecting global metabolite changes in an unbiased manner. Of the numerous endogenous serum metabolites, LPC and bile acids were selected as metabolites that were significantly altered in mice with NASH. Indeed, the increases in taurocholate and the decreases in some kinds of LPC have been reported in serum of NASH patients.37,38 Thus, the mechanism proposed in this study might apply to humans. In addition, these results provide the possibility that the metabolomic approach could detect serum biomarkers for discrimination between steatosis and steatohepatitis. Future large-scale metabolomic studies using serum of NAFLD/NASH patients might lead to the identification of biomarkers of clinical diagnostic value for NASH.
Supplementary Material
Acknowledgment:
We thank Linda Byrd and John Buckley for animal management.
Supported by the National Cancer Institute Intramural Research Program and U54 ES16015 (F. J. G) and a fellowship from the Japanese Society for the Promotion of Science (T. M.).
Abbreviations:
- Abcb
ATP-binding cassette subfamily B member
- Abcc
ATP-binding cassette subfamily C member
- Alox12
arachidonate 12-lipoxygenase
- ALP
alkaline phosphatase
- ALT
alanine aminotransferase
- CD
choline-deficient
- Cyp
cytochrome P450
- Enpp2
ectonucleotide pyrophosphatase/phosphodiesterase 2
- ER
endoplasmic reticulum
- GalN
D-galactosamine
- HETE
hydroxyeicosatetraenoic acid
- IL
interleukin
- LPC
lysophosphatidylcholine
- Lpcat
lysophosphatidylcholine acyltransferase
- LPS
lipopolysaccharide; Lyplal, lysophospholipase A1
- MCD
methionine- and choline-deficient
- MCS
methionine- and choline-supplemented
- MD
methionine-deficient
- NAFLD
nonalcoholic fatty liver disease
- NASH
nonalcoholic steatohepatitis
- NOX
NADPH oxidase
- OPLS
orthogonal projection to latent structures
- PC
phosphatidylcholine
- PCA
principal components analysis
- Ostb
organic solute transporter β
- qPCR
quantitative polymerase chain reaction
- Slc10a1
solute carrier family 10 member 1
- Slco
solute carrier organic anion transporter family member
- SS
simple steatosis
- TG
triglycerides
- TGF
transforming growth factor
- TNF
tumor necrosis factor
- UPLC-ESI-QTOFMS
ultraperformance liquid chromatography-electrospray ionization-quadrupole time-of-flight mass spectrometry
Footnotes
Potential conflict of interest: Nothing to report.
References
- 1.Vernon G, Baranova A, Younossi ZM. Systematic review: the epidemiology and natural history of nonalcoholic fatty liver disease and non-alcoholic steatohepatitis in adults. Aliment Pharmacol Ther 2011;34: 274–285. [DOI] [PubMed] [Google Scholar]
- 2.Tsuruta G, Tanaka N, Hongo M, Komatsu M, Horiuchi A, Hama- moto K, et al. Nonalcoholic fatty liver disease in Japanese junior high school students: its prevalence and relationship to lifestyle habits. J Gastroenterol 2010;45:666–672. [DOI] [PubMed] [Google Scholar]
- 3.Powell EE, Cooksley WG, Hanson R, Searle J, Halliday JW, Powell LW. The natural history of nonalcoholic steatohepatitis: a follow-up study of forty-two patients for up to 21 years. HEPATOLOGY 1990;11: 74–80. [DOI] [PubMed] [Google Scholar]
- 4.Feldstein AE, Charatcharoenwitthaya P, Treeprasertsuk S, Benson JT, Enders FB, Angulo P. The natural history of non-alcoholic fatty liver disease in children: a follow-up study for up to 20 years. Gut 2009;58: 1538–1544. [DOI] [PMC free article] [PubMed] [Google Scholar]
- 5.Starley BQ, Calcagno CJ, Harrison SA. Nonalcoholic fatty liver disease and hepatocellular carcinoma: a weighty connection. HEPATOLOGY 2010;51:1820–1832. [DOI] [PubMed] [Google Scholar]
- 6.Söderberg C, Stal P, Askling J, Glaumann H, Lindberg G, Marmur J, et al. Decreased survival of subjects with elevated liver function tests during a 28-year follow-up. HEPATOLOGY 2010;51:595–602. [DOI] [PubMed] [Google Scholar]
- 7.Adams LA, Lymp JF, St Sauver J, Sanderson SO, Lindor KD, Feldstein A, et al. The natural history of nonalcoholic fatty liver disease: a population-based cohort study. Gastroenterology 2005;129:113–121. [DOI] [PubMed] [Google Scholar]
- 8.Tilg H, Moschen AR. Evolution of inflammation in nonalcoholic fatty liver disease: the multiple parallel hits hypothesis. HEPATOLOGY 2010; 52:1836–1846. [DOI] [PubMed] [Google Scholar]
- 9.Day CP. From fat to inflammation. Gastroenterology 2006;130: 207–210. [DOI] [PubMed] [Google Scholar]
- 10.Neuschwander-Tetri BA. Hepatic lipotoxicity and the pathogenesis of nonalcoholic steatohepatitis: the central role of nontriglyceride fatty acid metabolites. HEPATOLOGY 2010;52:774–788. [DOI] [PubMed] [Google Scholar]
- 11.Nagaya T, Tanaka N, Suzuki T, Sano K, Horiuchi A, Komatsu M, et al. Down-regulation of SREBP-1c is associated with the development of burned-out NASH. J Hepatol 2010;53:724–731. [DOI] [PubMed] [Google Scholar]
- 12.Chen C, Gonzalez FJ, Idle JR. LC-MS-based metabolomics in drug metabolism. Drug Metab Rev 2007;39:581–597. [DOI] [PMC free article] [PubMed] [Google Scholar]
- 13.Patterson AD, Gonzalez FJ, Idle JR. Xenobiotic metabolism: a view through the metabolometer. Chem Res Toxicol 2010;23:851–860. [DOI] [PMC free article] [PubMed] [Google Scholar]
- 14.Soga T, Sugimoto M, Honma M, Mori M, Igarashi K, Kashikura K, et al. Serum metabolomics reveals y-glutamyl dipeptides as biomarkers for discrimination among different forms of liver disease. J Hepatol 2011;55:896–905. [DOI] [PubMed] [Google Scholar]
- 15.Chen C, Krausz KW Shah YM, Idle JR, Gonzalez FJ. Serum metabolomics reveals irreversible inhibition of fatty acid ß-oxidation through the suppression of PPARα activation as a contributing mechanism of acet-aminophen-induced hepatotoxicity. Chem Res Toxicol 2009;22:699–707. [DOI] [PMC free article] [PubMed] [Google Scholar]
- 16.Matsubara T, Tanaka N, Patterson AD, Cho JY, Krausz KW, Gonzalez FJ. Lithocholic acid disrupts phospholipid and sphingolipid homeostasis leading to cholestasis in mice. HEPATOLOGY 2011;53: 1282–1293. [DOI] [PMC free article] [PubMed] [Google Scholar]
- 17.Kwon HJ, Won YS, Yoon WK, Nam KH, Kim DY, Kim HC. The role of osteopontin in D-galactosamine-induced liver injury in genetically obese mice. Toxicol Appl Pharmacol 2010;242:344–351. [DOI] [PubMed] [Google Scholar]
- 18.Li F, Patterson AD, Höfer CC, Krausz KW, Gonzalez FJ, Idle JR A comprehensive understanding of thioTEPA metabolism in the mouse using UPLC-ESI-QTOFMS-based metabolomics. Biochem Pharmacol 2011;81:1043–1053. [DOI] [PMC free article] [PubMed] [Google Scholar]
- 19.Tanaka N, Zhang X, Sugiyama E, Kono H, Horiuchi A, Nakajima T, et al. Eicosapentaenoic acid improves hepatic steatosis independent of PPARα activation through inhibition of SREBP-1 maturation in mice. Biochem Pharmacol 2010;80:1601–1612. [DOI] [PMC free article] [PubMed] [Google Scholar]
- 20.Tanaka N, Moriya K, Kiyosawa K, Koike K, Gonzalez FJ, Aoyama T. PPARa activation is essential for HCV core protein-induced hepatic steatosis and hepatocellular carcinoma in mice. J Clin Invest 2008;118: 683–694. [DOI] [PMC free article] [PubMed] [Google Scholar]
- 21.Li Z, Vance DE. Phosphatidylcholine and choline homeostasis. J Lipid Res 2008;49:1187–1194. [DOI] [PubMed] [Google Scholar]
- 22.Buchman AL. The addition of choline to parenteral nutrition. Gastroenterology 2009;137:S119–S128. [DOI] [PubMed] [Google Scholar]
- 23.Yamaguchi K, Itoh Y, Yokomizo C, Nishimura T, Niimi T, Fujii H, et al. Blockade of interleukin-6 signaling enhances hepatic steatosis but improves liver injury in methionine choline-deficient diet-fed mice. Lab Invest 2010;90:1169–1178. [DOI] [PubMed] [Google Scholar]
- 24.Sekas G, Patton GM, Lincoln EC, Robins SJ. Origin of plasma lyso- phosphatidylcholine: evidence for direct hepatic secretion in the rat. J Lab Clin Med 1985;105:190–194. [PubMed] [Google Scholar]
- 25.Baisted DJ, Robinson BS, Vance DE. Albumin stimulates the release of lysophosphatidylcholine from cultured rat hepatocytes. Biochem J 1988;253:693–701. [DOI] [PMC free article] [PubMed] [Google Scholar]
- 26.Harayama T, Shindou H, Ogasawara R, Suwabe A, Shimizu T. Identification of a novel noninflammatory biosynthetic pathway of platelet-activating factor. J Biol Chem 2008;283:11097–11106. [DOI] [PubMed] [Google Scholar]
- 27.van der Sanden MH, Houweling M, van Golde LM, Vaandrager AB. Inhibition of phosphatidylcholine synthesis induces expression of the endoplasmic reticulum stress and apoptosis-related protein CCAAT/ enhancer-binding proteinhomologous protein (CHOP/GADD153). Biochem J 2003;369:643–650. [DOI] [PMC free article] [PubMed] [Google Scholar]
- 28.Okiyama W, Tanaka N, Nakajima T, Tanaka E, Kiyosawa K, Gonzalez FJ, et al. Polyenephosphatidylcholine prevents alcoholic liver disease in PPARα-null mice through attenuation of increases in oxidative stress. J Hepatol 2009;50:1236–1246. [DOI] [PMC free article] [PubMed] [Google Scholar]
- 29.Zhao Y, Chen YQ, Bonacci TM, Bredt DS, Li S, Bensch WR, et al. Identification and characterization of a major liver lysophosphatidylcholine acyltransferase. J Biol Chem 2008;283:8258–8265. [DOI] [PubMed] [Google Scholar]
- 30.Kakisaka K, Cazanave SC, Fingas CD, Guicciardi ME, Bronk SF, Werneburg NW, et al. Mechanisms of lysophosphatidylcholine-induced hepatocyte lipoapoptosis. Am J Physiol Gastrointest Liver Physiol 2012;302:G77–G84. [DOI] [PMC free article] [PubMed] [Google Scholar]
- 31.Han MS, Park SY, Shinzawa K, Kim S, Chung KW, Lee JH, et al. Lysophosphatidylcholine as a death effector in the lipoapoptosis of he- patocytes. J Lipid Res 2008;49:84–97. [DOI] [PubMed] [Google Scholar]
- 32.Roma MG, Crocenzi FA, Sanchez Pozzi EA. Hepatocellular transport in acquired cholestasis: new insights into functional, regulatory and therapeutic aspects. Clin Sci (Lond) 2008;114:567–588. [DOI] [PubMed] [Google Scholar]
- 33.Cherrington NJ, Slitt AL, Li N, Klaassen CD. Lipopolysaccharide-mediated regulation of hepatic transporter mRNA levels in rats. Drug Metab Dispos 2004;32:734–741. [DOI] [PubMed] [Google Scholar]
- 34.Vee ML, Lecureur V, Stieger B, Fardel O. Regulation of drug transporter expression in human hepatocytes exposed to the proinflammatory cytokines tumor necrosis factor-alpha or interleukin-6. Drug Metab Dispos 2009;37:685–693. [DOI] [PubMed] [Google Scholar]
- 35.Sturm E, Havinga R, Baller JF, Wolters H, van Rooijen N, Kamps JA, et al. Kupffer cell depletion with liposomal clodronate prevents suppression of Ntcp expression in endotoxin-treated rats. J Hepatol 2005;42:102–109. [DOI] [PubMed] [Google Scholar]
- 36.Campion SN, Johnson R, Aleksunes LM, Goedken MJ, van Rooijen N, Scheffer GL, et al. Hepatic Mrp4 induction following acetaminophen exposure is dependent on Kupffer cell function. Am J Physiol Gastrointest Liver Physiol 2008;295:G294–G304. [DOI] [PMC free article] [PubMed] [Google Scholar]
- 37.Puri P, Wiest MM, Cheung O, Mirshahi F, Sargeant C, Min HK, et al. The plasma lipidomic signature of nonalcoholic steatohepatitis. HEPATOLOGY 2009;50:1827–1838. [DOI] [PMC free article] [PubMed] [Google Scholar]
- 38.Kalhan SC, Guo L, Edmison J, Dasarathy S, McCullough AJ, Hanson RW, et al. Plasma metabolomic profile in nonalcoholic fatty liver disease. Metabolism 2011;60:404–413. [DOI] [PMC free article] [PubMed] [Google Scholar]
Associated Data
This section collects any data citations, data availability statements, or supplementary materials included in this article.


