

SUMMARY
Protein kinase C (PKC)-dependent mechanisms promote synaptic function in the mature brain. However, the roles of PKC signaling during synapse development remain largely unknown. Investigating each brain-enriched PKC isoform in early neuronal development, we show that PKCε acutely and specifically reduces the number of dendritic spines, sites of eventual synapse formation on developing dendrites. This PKCε-mediated spine suppression is temporally restricted to immature neurons and mediated through the phosphorylation and activation of Ephexin5, a RhoA guanine nucleotide exchange factor (GEF) and inhibitor of hippocampal synapse formation. Our data suggest that PKCε acts as an early developmental inhibitor of dendritic spine formation, in contrast to its emerging pro-synaptic roles in mature brain function. Moreover, we identify a substrate of PKCε, Ephexin5, whose early-elevated expression in developing neurons may in part explain the mechanism by which PKCε plays seemingly opposing roles that depend on neuronal maturity.
In Brief
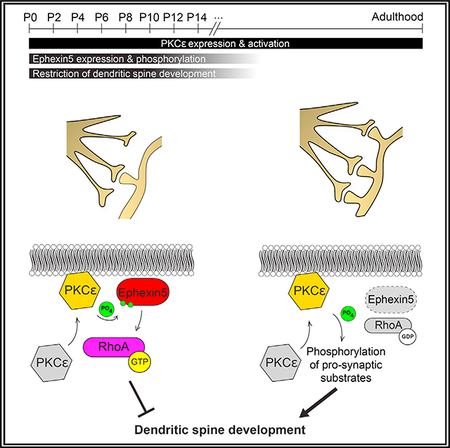
Schaffer et al. define roles in developing hippocampal neurons for specific PKCs, linking neuronal PKCε activation to phosphorylation of RhoA GEF and inhibitor of dendritic spine development Ephexin5. This pathway regulates neuronal RhoA signaling, acutely reducing spine formation and revealing an inducible mechanism that limits spine numbers during neuronal morphogenesis.
Graphical Abstract
INTRODUCTION
Mammals are endowed with 11 isoforms of protein kinase C, a family of serine/threonine protein kinases that fulfill pleiotropic functions across tissues. In the brain, the activity of classical protein kinase C (PKC) isoforms (PKCα, PKCβ, PKCγ) and the novel PKC isoform PKCε is highly enriched compared with nonneuronal tissue (Kikkawa et al., 1982; Lohmann and Kessels, 2014). Activation of classical and novel PKCs occurs when these enzymes bind to membrane-embedded diacylglycerol (DAG) and undergo conformational changes to reveal their kinase domains to target substrates (Kishimoto et al., 1989). DAG analogs such as the phorbol ester phorbol 12-myristate 13-acetate (PMA), along with broad PKC inhibitors, have been relied upon for decades to elucidate the roles for PKC signaling in the nervous system.
In seminal studies, it was demonstrated that the addition of phorbol esters to mouse brain slices rapidly increased neuronal signaling in the form of excitatory synaptic activity (Malenka et al., 1986; Malinow et al., 1988; Olds et al., 1989). Excitatory synapses are sites of communication between neurons, where the passage of neurotransmitters such as glutamate from the presynaptic neuron induces downstream signaling in the postsynaptic neuron (Lohmann and Kessels, 2014). Accordingly, PKC-mediated phosphorylation of the widely expressed glutamatergic neurotransmitter receptor subunit GluR1 acutely increases receptor abundance at the neuronal membrane and promotes excitatory synaptic signaling (Boehm et al., 2006; Lin et al., 2009). Although extensive work has demonstrated a critical role for PKCs in the regulation of excitatory synaptic signaling in the adult nervous system, whether and how PKC signaling regulates excitatory synapse development prior to the presence of synaptic regulators such as GluR1 in the neonatal nervous system remains largely unknown.
Greater than 95% of all excitatory synapses are located at dendritic spines, specialized subcellular compartments of a neuron that protrude from neuronal dendrites (Boyer et al., 1998; Gray, 1959). Dendritic spine formation is the precursor to excitatory synapse formation and is regulated over time during brain development. This is mediated, in part, by cell adhesion molecules that connect pre- and post-synaptic neurons, as well as by secreted growth factors that guide early neuronal morphogenesis (Dyer et al., 2016; Giagtzoglou et al., 2009; Park and Poo, 2013). On the basis of the significance of PKC signaling for mature neuronal excitatory synapse function in the adult brain, we hypothesized that brain-enriched PKC isoforms likewise play significant cell biological roles during brain development.
We report here that the same PKCs enriched in the mature brain are also highly enriched and active in the neonatal brain. Thus, we sought to understand how PKCs expressed in the neonatal brain regulate neuronal development. We found that two specific isoforms of brain-enriched PKCs, PKCα and PKCε, suppress the formation of dendritic spines. Focusing on PKCε, previously attributed with synaptogenic roles in mature neurons (Sen et al., 2016), we determined that acute activation of endogenous PKCε with the PKCε agonist bryostatin I is sufficient to promote a robust decrease in dendritic spine density. We determined that this PKCε-driven suppression of dendritic spine development is temporally regulated, dependent on RhoA signaling, and mediated through dual phosphorylation of Ephexin5, a RhoA activator that is most highly expressed during early brain development.
RESULTS
PKC Isoforms α, β, γ, and ε Are Highly Enriched and Active in Neonatal Brains and in Developing Neurons of Mice
Classical PKC isoforms (PKCα, PKCβ, PKCγ) and novel PKC isoforms (PKCδ, PKCε, PKCη, PKCθ) are all expressed in the adult mammalian nervous system (Baier et al., 1993; Wetsel et al., 1992; Zang et al., 1994). We show here by immunoblot analysis that in neonatal mouse tissues at postnatal day 6 (P6), antibody signals for PKCα, PKCβ, PKCγ, and PKCε isoforms were clearly enriched in neonatal brain, with only minimally detectable signal in other organs (Figures 1A, 1B, and S1A–S1C). Although we find that PKCα, PKCβ, PKCγ, and PKCε exhibit differential expression across brain regions at this age, they are commonly enriched in hippocampus (Figure 1C). Thus, we chose to look specifically at PKC signaling in the hippocampus in order to identify early roles for these brain-enriched kinases in brain development.
Figure 1. Phorbol-Sensitive PKC Isoforms (PKCα, PKCβ, PKCγ, and PKCε) Are Enriched and Activated in Neonatal Hippocampus and Immature Cultured Hippocampal Neurons.

(A) Protein kinase C (PKC) isoform expression is detectable in the developing brain and increases with age. Mouse brains were dissected and lysed at indicated ages and immunoblotted with isoform specific PKC antibodies.
(B) PKC isoforms are brain enriched. Lysates from indicated mouse tissues (Br, brain; Ht, heart; Kd, kidney; Li, liver) at postnatal day 6 (P6) were immunoblotted for the PKC isoforms shown. Equal protein loading was confirmed using Silver Stain.
(C) PKC isoforms are expressed in the hippocampus early in development.Lysates were prepared from cerebral cortex (Ctx), hippocampus (Hip), diencephalon/midbrain/hindbrain (DMH), and olfactory bulbs (OB) from P6 mice and immunoblotted for the PKC isoforms shown.
(D) Experimental setup. Fractionation protocol for collecting samples tomeasure PKC membrane association.
(E) PKC isoforms are localized at neuronal membranes in the hippocampusearly in development, indicative of their activation. Fractionated extracts generated from neonatal mouse hippocampi were immunoblotted for the PKC isoforms shown. Cyto, cytosolic proteins co-fractionating with Tuj1; Mem, membrane-associated proteins co-fractionating with transferrin receptor (TFRC); Insol, remaining fraction of detergent-insoluble proteins.
(F) PKC isoform expression in hippocampal neuronal cultures increases withage of the culture. Cultured hippocampal neurons were lysed at indicated days in vitro (DIV) and immunoblotted for the PKC isoforms shown.
(G) PKCa, PKCb, and PKCg are localized at neuronal membranes in immature hippocampal neuronal cultures. PKCε membrane localization is scarce by comparison. Fractionated extracts of DIV11 neuronal cultures were prepared as in (D) and immunoblotted.
See also Figure S1.
As with all classical and novel PKC isoforms, activation of PKCα, PKCβ, PKCγ, and PKCε isoforms is a multi-step process that leads to the PKC enzyme binding to DAG at intracellular membrane interfaces (Newton, 2010). PKC membrane recruitment induces an allosteric conformational change that reveals the PKC kinase domain to its substrates, thereby enabling PKC substrate phosphorylation (Newton, 2010). Accordingly, monitoring PKC translocation to the neuronal membrane is a robust means for measuring PKC activity in brain tissue (Sacktor et al., 1993). In order to assess whether PKC isoforms in the neonatal mouse brain were activated, we used subcellular fractionation to measure the lipid association of neonatal brain-enriched PKCs (PKCα, PKCβ, PKCγ, and PKCε) as a readout of their activation (Sen et al., 2016). Hippocampi from P6 mice were dissected and fractionated into three biochemical compartments (cytosolic proteins: soluble proteins that co-fractionate with cytosolic bIII-tubulin/Tuj1; membrane proteins: peripheral and integral membrane proteins that co-fractionate with the transmembrane transferrin receptor; and insoluble proteins: dense protein complexes and polymerized cytoskeleton; Figures 1D and S1D). Fractions applied to SDS-PAGE for immunoblot analysis using isoform specific PKC antibodies revealed PKC antibody signal in the membrane protein-enriched detergent-soluble fraction (Figure 1E). On the basis of these data, we concluded that brain-enriched PKC isoforms a, b, g, and ε are largely expressed and active in vivo in the hippocampus of the neonatal mouse brain.
Brain tissue comprises a variety of cell types, including neurons and glial cells. We were interested in the role of PKC isoforms specifically in neurons. In order to characterize the neuron-intrinsic expression and activation of PKCα, PKCβ, PKCγ, and PKCε, we prepared primary hippocampal neuronal cultures from embryonic wild-type mouse pups and asked how PKC isoform expression over time compares with what we observed in intact brain tissue. As cultures matured, cell lysates were prepared on sequential days in vitro (DIV) and then immunoblotted using isoform specific PKC antibodies. The resulting data we obtained mirrored what we measured in whole-brain tissue (Figure 1A), where antibody signal corresponding to the expression of PKCα, PKCβ, PKCγ, and PKCε emerged over time relative to actin antibody signal as neurons matured in culture (Figure 1F). We next applied our subcellular fractionation approach to cultured neurons at DIV11 and, by immunoblot analysis, determined that neuronal PKCα, PKCβ, and PKCγ each associates with membranes, although to a much lesser extent than what was found from intact brain tissue (Figure 1G). In this context, recovered membrane-associated PKCε was only minimally detectable. These data were consistent with our in vivo analysis of PKCs and indicate a potential role for active PKC-mediated signaling early in neuronal development.
PKCα and PKCε Inhibit Dendritic Spine Formation on Immature Neurons
Taking advantage of the low level of PKC isoform activity in cultured hippocampal neurons, we overexpressed PKCs to determine whether PKCα, PKCβ, PKCγ, or PKCε in neurons can affect aspects of neuronal development. To do this, developing hippocampal neurons were co-transfected at DIV10 with plasmids expressing GFP and individual full-length C-terminal hemagglutinin (HA)-tagged PKCα, PKCβ, PKCγ, or PKCε (Figure S2A). At DIV14, neurons were fixed, stained, and imaged using confocal microscopy. Neurons were identified by green fluorescence, which diffusely fills the transfected hippocampal neuron and highlights cellular morphology. Immunofluorescent staining using HA antibodies confirmed PKC isoform expression (Figures 2A and S2B). We then analyzed these transfected neurons by measuring dendritic spine density and dendritic complexity to determine whether they exhibited changes in neuronal morphology.
Figure 2. PKCα and PKCε Inhibit Dendritic Spine Formation on Immature Neurons.

(A) Immunofluorescent staining of ove rexpressed PKC isoforms in hippocampal neurons. DIV10 hippocampal cultures co-transfected with plasmids expressing GFP and HA-tagged PKC isoforms were fixed at DIV14 and immunostained. Representative confocal images are shown. Scale bar, 40 μm; inset scale bar, 5 μm.
(B) PKCα and PKCε inhibit the development of dendritic spines in transfected hippocampal neurons. Neurons from (A) were imaged, and dendritic spines were counted on neuronal dendrite segments as indicated in diagram (top). Data are mean ± SEM (n = 17–22 neurons from three experiments from independent neuronal cultures). **p < 0.01, one-way ANOVA with post hoc Dunnett’s test; spine densities normalized to the transfection of GFP alone.
(C) PKCα, PKCβ, and PKCγ, but not PKCε, increase dendritic complexity. Neurons from (A) were subjected to Sholl analysis as indicated in diagram (left). Data are mean ± SEM (n = 25–30 neurons analyzed per condition). Data were analyzed using two-way ANOVA with post hoc Tukey test; daggers indicate radii where statistically significant differences in dendritic complexity were measured; p values are reported in Table S1.
See also Figure S2 and Table S2.
Hippocampal neurons overexpressing either PKCα-HA or PKCε-HA exhibited decreased dendritic spine densities compared with those transfected with PKCβ-HA, PKCγ-HA, or GFP alone (Figure 2B). A quantification of dendritic outgrowth between overexpression conditions revealed increases in dendritic arborization by Sholl analysis accompanying the overexpression of PKCα, PKCβ, and PKCγ, but not PKCε (Figure 2C; Table S1). On the basis of these data, we concluded that overexpression of brain-enriched PKC isoforms differentially regulates neuronal morphogenesis in an isoform-dependent manner. Interestingly, the overexpression of PKCε protein was sufficient to specifically and cell-autonomously restrict the development of dendritic spines in developing hippocampal neurons.
Acute Activation of Endogenous PKCε Rapidly Reduces Dendritic Spine Densities in Developing Hippocampal Neurons
In order to determine whether, in immature developing neurons, PKCε-mediated restriction of dendritic spine density required PKCε kinase activity, we co-transfected DIV10 cultured hippocampal neurons with plasmids expressing GFP and PKCε-HA or PKCε K437R-HA, a kinase-deficient variant bearing a point mutation in the PKCε active site (Soh and Weinstein, 2003). Quantifying dendritic spine densities at DIV14 revealed that, in contrast to neurons expressing PKCε-HA, neurons expressing PKCε K437R-HA failed to suppress dendritic spine development (Figure 3A). To assess whether acute activation of endogenous PKCε could mediate similar spine restrictive effects, we used the selective chemical activator of PKCε bryostatin I.
Figure 3. Acute Activation of Endogenous PKCε Rapidly Reduces Dendritic Spine Populations.

(A) PKCε kinase dead mutant does not negatively regulate dendritic spine development. At DIV11, hippocampal cultures were co-transfected with plasmids expressing GFP and PKCε-HA or kinase-deficient PKCε K437R-HA. Cultures were fixed at DIV14, and dendritic spines were quantified on imaged neurons. Representative images are shown. Scale bar, 5 mm. Data are mean ± SEM (n = 14–16 neurons per condition from two experiments from independent neuronal cultures). ***p < 0.001, one-way ANOVA with post hoc Dunnett’s test; spine densities normalized to the transfection of expression vector alone.
(B) A short treatment of bryostatin I specifically activates endogenous PKCε in cultured hippocampal neurons. At DIV12, hippocampal cultures were treated with DMSO or 1 nM bryostatin I for 1 hr. Immediately after, cells were homogenized and lysates were separated into cytosolic and membrane-associated fractions. Fractionation inputs and membrane fractions were prepared for immunoblot analysis. Silver staining was used to control for loading of membrane fractions. Arrow shows bryostatin I-induced membrane translocation of PKCε.
(C) Bryostatin I treatment reduces neuronal dendritic spine densities through endogenous PKCε. Hippocampal neurons were cultured from PKCε wild-type or knockout mouse brains and transfected at DIV10 with GFP plasmid. At DIV12, neurons were treated with DMSO or bryostatin I for 1 hr and immediately fixed afterward for confocal imaging. Dendritic spine numbers were quantified. Representative confocal images are shown. Scale bar, 5 μm. Data are mean ± SEM (n = 13–15 neurons per condition). **p < 0.01, Student’s two-tailed t test performed within each genotype.
See also Figure S3 and Table S2.
The macrolide lactone bryostatin I activates endogenous PKCε at low concentrations with high potency and specificity (Nelson and Alkon, 2009; Sen et al., 2016; Szallasi et al., 1994). To verify the selectivity of bryostatin I-mediated PKCε activation, cultured primary hippocampal neurons were treated at DIV12 with DMSO or 1 nM bryostatin I for 1 hr and subjected to fractionation of cytosolic and membrane-associated proteins as described above (Figures 3B and S3). These fractions were then immunoblotted using isoform specific PKC antibodies. Although PKCα, PKCβ, and PKCγ antibody signal from neuronal membrane fractions remained unchanged in both conditions, the presence of bryostatin I induced a robust increase in neuronal membrane PKCε antibody signal (Figure 3B). From these data we inferred that our treatment conditions specifically activated PKCε compared with the other measured brainenriched PKC isoforms.
Previous studies of PKC signaling in the nervous system demonstrated that phorbol ester-mediated PKC activation can lead to rapid effects on neuronal function. To determine whether the rapid and specific activation of endogenous PKCε restricts dendritic spine densities in immature developing neurons, hippocampal neurons cultured from PKCε wild-type or knockout animals were transfected with GFP at DIV10 and treated at DIV12 with 1 nM bryostatin I for 1 hr. Treated cells were then fixed and imaged using confocal microscopy. Counting dendritic before treatment, and the same neurons were imaged again after spines on GFP expressing neurons revealed a robust reduction 1 hr in the presence of DMSO or bryostatin I (Figure 4A, left top). in dentical treatment with bryostatin I failed to reduce dendritic spine numbers in PKCε-knockout neurons, suggesting that bryostatin I treatment reduces neuronal dendritic spine density in immature neurons by specifically activating endogenous PKCε. Neurons treated with bryostatin I were otherwise morphologically normal, with no visible changes in dendritic arborization or cell health (Figure S3A).
Figure 4. Acute Activation of Endogenous PKCε Alters Dendritic Spine Formation and Elimination on Immature Neurons.

(A) Endogenous PKCε activation reduces neuronal dendritic spine densities through a combined mechanism of restricted spine formation and existing spine elimination. Neurons cultured from wild-type mice were transfected with GFP plasmid at DIV10. At DIV13, cells were imaged via live-cell confocal microscopy before and after 1 hr of treatment with DMSO or bryostatin I. In representative images, yellow, green, and red arrows indicate spines that were maintained, newly formed, or eliminated during drug treatment, respectively. Data are mean ± SEM (n = 56–60 dendritic segments spines analyzed from 19 or 20 neurons per condition from independent neuronal cultures). **p < 0.01, Mann-Whitney U test.
(B and C) Activation of endogenous PKCε in young hippocampal neurons using bryostatin I acutely reduces dendritic spine density. Neurons were transfected at DIV10 with GFP plasmid. At DIV12–13 (B) or DIV18 (C), neurons were then treated with DMSO or 1 nM bryostatin I for 1 hr and immediately fixed afterward for confocal imaging. Dendritic spine numbers were quantified. Representative confocal images are shown. Scale bar, 5 μM. Data are mean ± SEM (n = 19–26 neurons per condition from two experiments from independent neuronal cultures). ****p < 0.0001, Student’s two-tailed t test assuming unequal variance; spine densities normalized to DMSO-only controls.
(D) Images of DIV12 neurons in (B) were further analyzed for changes in the proportions of mushroom, stubby, and thin spine subtypes following DMSO or bryostatin I treatment. Data are mean ± SEM (n = 18 or 16 neurons per condition from three experiments for DMSO or bryostatin I treatments, respectively). *p < 0.05, Student’s two-tailed t test assuming unequal variance or two-tailed Mann-Whitney U test.
See also Figure S4 and Table S2.
In developing neurons, a reduction of dendritic spine density could occur through the blockade of new spine development, the elimination of existing spines, or a combined mechanism inhibiting new spine formation while promoting existing spine removal. To investigate how PKCε activation reduces dendritic spine numbers in immature neurons, we transfected cultured hippocampal neurons at DIV10 with GFP and analyzed transfected cells at DIV13 using live-cell confocal imaging following DMSO or bryostatin I treatment. Z stacks of transfected neurons were imaged immediately dritic spine density in bryostatin I-treated neurons By analyzing the same dendritic segments in pre- and post-treatcompared with neurons treated with DMSO (Figure 3C). An iden- ment images for changes in the numbers of both newly formed and existing spines, we found that bryostatin I-treated neurons exhibited significantly reduced new spine formation over 1 hr (Figure 4A). Spine elimination, in contrast, was accelerated following bryostatin I treatment (Figure 4A). From these results, we concluded that neuronal PKCε reduces dendritic spine populations by inhibiting the formation of new dendritic spines, while also inducing existing spine removal.
PKCε expression persists throughout neuronal development into adulthood. Previous studies indicate that PKCε does not have an inhibitory role in synaptic biology in adult mice (Sen et al., 2016). Thus, we suspected that the acute PKCε-mediated spine restriction we observed was confined to an early developmental window. To test this, we compared the effects of bryostatin I treatment on dendritic spine density in hippocampal neurons at both DIV12–13 and DIV18. Treated cells were fixed and imaged using confocal microscopy. Neurons at DIV12–13 undergo robust decreases in dendritic spine densities (Figure 4B). By contrast, DIV18 GFP expressing neurons exhibited no bryostatin I-mediated effects on spine density, although endogenous PKCε was equally susceptible at DIV18 as at DIV12 to bryostatin I-mediated activation (Figures 4C and S4A). By classifying dendritic spine subtypes in DMSO and bryostatin I-treated neurons at DIV12, we observed that bryostatin I-treated neurons exhibited trending reductions in the proportions of mushroom and stubby spine subtypes, accompanied by an increase in the proportion of thin spines relative to all spines detected (Figure 4D). This could arise from a global PKCε-mediated shrinkage of all dendritic spines, such that small spines are eliminated and persisting spines are reduced in size to thin spine morphology; alternatively, the PKCε-mediated mechanism of spine removal may target mushroom and stubby dendritic spine subtypes preferentially.
Acute Activation of Endogenous PKCε Rapidly Reduces Dendritic Spine Density in Immature Neurons in a RhoA Signaling and Ephexin5-Dependent Manner
In order to investigate the biochemical pathways acting downstream of endogenous PKCε activation in DIV12 hippocampal neurons, we repeated short bryostatin I treatments in GFP transfected neurons in the presence of the pan-PKC inhibitor Gö 6983 or the Rho-associated kinase inhibitor Y-27632. Many pathways have been discovered to reduce dendritic spine number through the common activation of the small GTPase RhoA (Fu et al., 2007; Kang et al., 2009; Tashiro and Yuste, 2004; Wills et al., 2012), and Y-27632 inhibits signaling downstream of RhoA activation by targeting ROCK1 and ROCK2, two RhoA-activated kinases. Y-27632 alone had no effects on dendritic spine morphogenesis under our acute treatment conditions (Figure S5B). However, in the presence of bryostatin I, Y-27632 was sufficient to block the acute reduction of dendritic spine density at DIV12 (Figure 5A). Similar results were observed when using the pan PKC inhibitor Gö 6983 (Figure 5A). We concluded from these data that the temporally regulated biochemical pathway bridging endogenous PKCε activation to the resulting reduction in neuronal dendritic spine density involved signaling from PKCε to the small GTPase RhoA.
Figure 5. Acute Activation of Endogenous PKCε Rapidly Reduces Dendritic Spine Populations in Immature Neurons in a RhoA Signaling and Ephexin5-Dependent Manner.

(A) Bryostatin I-mediated reduction of dendritic spine density in DIV13 neurons requires PKC activity and RhoA signaling. Hippocampal neurons were transfected at DIV10 with plasmids expressing GFP. At DIV12, neurons were treated with DMSO or 1 nM bryostatin I for 1 hr in the absence or presence of an inhibitor of RhoA signaling (Y-27632) or PKC (Gö 6983) and immediately fixed afterward for imaging. Dendritic spine numbers were quantified. Representative confocal images are shown. Scale bar, 5 μm. Data are mean ± SEM (n = 16–26 neurons per condition from three experiments from independent neuronal cultures). ****p < 0.0001, one-way Kruskal-Wallis test with post hoc Dunn’s test; spine densities normalized to DMSO-only controls.
(B) Expression and electrophoretic mobility of Ephexin5 are dynamic during brain development. Lysates from brains dissected from wild-type mice at indicated ages were immunoblotted for total Ephexin5 expression compared with other neuronal proteins PSD-95, synapsin, and synaptophysin (SYPH). Arrow indicates slower migrating Ephexin5 signal, suggestive of post-translational modification.
(C) PMA, a PKC agonist, stimulates Ephexin5 post-translational modification inintact cells. HEK293 cells were transfected with Ephexin5-myc and stimulated with phorbol ester PMA. Cell lysates were immunoblotted. Arrow indicates shifted Myc antibody signal.
(D) PKC signaling stimulates Ephexin5 post-translational modification in intactcells. HEK293 cells were transfected with Ephexin5-myc and stimulated with phorbol ester PMA in the presence of vehicle or two different PKC inhibitors: Gö 6983 and GF109203X. Cell lysates were immunoblotted. Arrow indicates shifted Myc antibody signal.
(E) Bryostatin I-mediated reduction of dendritic spine density requires Ephexin5. Hippocampal neurons cultured from wild-type or Ephexin5 knockout mouse pups were transfected at DIV10 with GFP plasmid. DIV12 neurons were treated with DMSO or 1 nM bryostatin I for 1 hr and immediately fixed afterward for confocal imaging. Dendritic spine numbers were quantified. Representative confocal images are shown. Scale bar, 5 μm. Data are mean ± SEM (n = 9–20 neurons per condition from two experiments from independent neuronal cultures). ***p < 0.001, Student’s two-tailed t test assuming unequal variance.
See also Figure S5 and Table S2.
Small GTPases such as RhoA are activated by GEFs, many of which are controlled by phosphorylation (Fu et al., 2007; Kang et al., 2009). For example, the RhoA GEF Ephexin1 is activated in the adult brain by CDK5-mediated phosphorylation on residues T341 and S139. GEF-H1/Lfc, another RhoA GEF whose expression peaks during late brain development, is activated by protein kinase A-mediated phosphorylation at residues T114 and S885 (Meiri et al., 2009). We considered that phosphorylation of an early-expressed neuronal GEF might contribute to PKCε-mediated dendritic spine restriction early in neuronal development. The only known activator of RhoA in the neonatal brain that restricts spine formation in immature mouse hippocampal neurons is the RhoA GEF Ephexin5 (Margolis et al., 2010).
We reasoned that PKCε-mediated inhibition of spine development would occur prior to the onset of spine formation in the developing mouse brain, which begins between P7 and P14 (Lohmann and Kessels, 2014). By immunoblot analysis, we observed an upward electrophoretic shift of Ephexin5 antibody signal from P0 to P7 mouse brain lysates, suggesting that Ephexin5 expressed within this temporal window was posttranslationally modified, possibly by phosphorylation (Figure 5B). In heterologous HEK293 cells, overexpressed Myc tagged Ephexin5 protein also showed a similar shift in electrophoretic mobility upon addition of the PKC agonist PMA (Figure 5C). This PMA-induced shift of Ephexin5 mobility was reversed in the presence of individual PKC inhibitors Gö 6983 or GF109203X (Figure 5D). Thus, we hypothesized that Ephexin5 might mediate the reduction of dendritic spine density in immature neurons caused by acute activation of PKCε.
To test this, we dissected hippocampi from wild-type and Ephexin5-knockout mice and plated dissociated neurons for transfection at DIV10 with a GFP plasmid. At DIV12, we repeated our previous bryostatin I treatment in both wild-type and Ephexin5-knockout neurons, immediately fixing cells afterward for the subsequent quantification of dendritic spine density. In agreement with our hypothesis, bryostatin I failed to reduce dendritic spine densities on hippocampal neurons from Ephexin5-knockout mice (Figure 5E). We concluded that the acute activation of PKCε by bryostatin I addition to immature neurons reduces dendritic spine density through the activation of endogenous Ephexin5, possibly via phosphorylation of specific Ephexin5 residues. Alternatively, Ephexin5 could be required to mediate bryostatin I-induced spine suppression through parallel, indirect means. We favored the hypothesis that Ephexin5 was a direct substrate of PKCε and that the site(s) of phosphorylation would mediate spine inhibition.
Ephexin5 Can Be Inducibly Phosphorylated on Serine Residues 107 and 109 by PKCε
A previous global phospho-proteomic study identified endogenous sites of protein phosphorylation across adult mouse tissues (Huttlin et al., 2010). Searching these data using the Ephexin5 gene name Arhgef15, we noticed that serines 107 and 109 of Ephexin5 were found to be phosphorylated in brown fat, kidney, and lung. Serine residues 107 and 109 are highly conserved among mammals (Figure 6A). We reasoned that the phylogenetic conservation of these residues across species and the conservation of their phosphorylation across tissues might indicate an important role in regulating Ephexin5 function. Thus, we generated a polyclonal antibody to specifically detect dual phosphorylated Ephexin5 at serine residues 107 and 109 (p107/109) to study these phosphoserines in isolation.
Figure 6. Ephexin5 Is Dually Phosphorylated at Serines 107 and 109 by a PKC Isoform.

(A) Schematic of Ephexin5 domain architecture and cross-species alignment of amino acid sequence surrounding phosphorylated serine residues 107 and 109 of mouse Ephexin5.
(B) Ephexin5 is simultaneously phosphorylated atserine residues 107 and 109 early during brain development. Whole brains were dissected from wild-type mice at indicated ages and immunoblotted. Arrows indicate same molecular weight between antibodies.
(C) Dual phosphorylation of Ephexin5 at serine residues 107 and 109 is mediated by an endogenous neuronal kinase. At DIV11, hippocampal cultures from wild-type mice were co-transfected with GFP and Ephexin5-myc or Ephexin5 A/A-myc plasmids. Transfected cultures were fixed and immunostained with Myc and p107/109 antibodies to visualize overlap between phosphorylated Ephexin5 at serine residues 107 and 109 and Myc tagged Ephexin5 protein. Representative images are shown. Scale bar, 50 μm.
(D) The p107/109 antibody recognizes Ephexin5 phosphorylated at serine residues 107 and 109 in neurons. DIV10–12 hippocampal neurons were cotransfected with GFP and Ephexin5-myc plasmids. Two days later, transfected neurons were fixed for co-stained with Myc and p107/109 antibodies in the presence of increasing titrations of peptides corresponding to Ephexin5 amino acids 101–115 that were either phosphorylated (Ephexin5 AA101– 115 p107/109) or non-phosphorylated (Ephexin5 AA101–115) at serines 107 and 109. The depletion of p107/109 antibody staining in the presence of Ephexin5 peptide was quantified. Data are mean ± SEM (n = 10–15 neurons per condition from three experiments from independent neuronal cultures). ***p < 0.001 and ****p < 0.0001, two-way ANOVA with post hoc Tukey test.
(E) Experimental setup. Brain lysate prepared fromP5 mouse neonates was incubated with a mixture of kinase buffer, ATP, and immobilized GSTEphexin5. Kinase reactions were incubated for 1 hr at 37°C and stopped by the addition of Laemmli buffer.
(F) The enzymatic activity that phosphorylatesEphexin5 at 107/109 in vitro is enriched in brain lysates. Recombinant mouse GST-Ephexin5 was incubated in a kinase buffer, ATP, phosphatase inhibitors and indicated lysates (Br, brain; Ht, heart; Kd, kidney; Li, liver; Lu, lung), followed by immunoblotting. Arrows indicate full-length GSTEphexin5.
(G) PKC enzymes are responsible for in vitro Ephexin5 dual phosphorylation at serine residues 107 and 109 from brain lysate. GST-Ephexin5 was incubated in our Ephexin5 in vitro kinase assay and vehicle or PKC inhibitor Gö 6983, followed by immunoblotting. Arrows indicate full-length GST-Ephexin5.
(H) PKCα and PKCε directly phosphorylate Ephexin5 in vitro. Recombinant mouse Ephexin5-GST was incubated with kinase buffer, ATP, phosphatase inhibitors, and purified human (h) PKCα or PKCε followed by immunoblotting. P5 brain lysate used as positive control.
(I) In neurons, bryostatin I induces Ephexin5 phosphorylation at serine residues 107 and 109 comparable with the phorbol ester phorbol 12,13-dibutyrate (PDB), apositive control. At DIV12–13, hippocampal cultures were infected with Ephexin5-myc lentivirus. At DIV16–17, infected cells were treated for 1 hr with bryostatin I followed by lysate harvest and immunoblotting with Ephexin5 and p107/109 antibodies. An apparent reduction in Ephexin5 phosphorylation in the presence of elevated concentrations of bryostatin I likely results from PKCε downregulation, which is widely reported in other experimental systems for various PKC isozymes. Quantification of p107/109 antibody signal for bryostatin I-treated neurons is normalized to DMSO-alone control for each experiment. Data are mean ± SEM (n = 4 experiments from independent neuronal cultures). *p < 0.05, Student’s one-tailed t test.
See also Figure S6.
We validated our antibody by comparing lysates from the dissected brains of P5 wild-type or Ephexin5-knockout mice (Figure S6A). In addition, our antibody did not detect an Ephexin5 mutant where serines 107 and 109 were substituted with alanines (Ephexin5 A/A-myc) or wild-type Ephexin5 that was unphosphorylated (Figures S6B and S6C). Using the p107/109 antibody, we observed that the phosphorylation of Ephexin5 at serine residues 107 and 109 tracks with the upward shift in Ephexin5 mobility during brain development (Figure 6B). Last, to test whether Ephexin5 could be phosphorylated at serine residues 107 and 109 in neurons, we transfected dissociated hippocampal neurons at DIV10 with GFP and Ephexin5-myc or Ephexin5 A/A-myc. Transfected neurons were stained with our p107/109 antibody at DIV14, and subsequent immunofluorescent imaging revealed phosphorylation of Ephexin5 serines 107 and 109 everywhere in neurons where Ephexin5-myc was localized (Figure 6C). Blocking peptides validated this staining result (Figure 6D). Taken together, these data were consistent with the p107/109 antibody specifically targeting phosphorylated Ephexin5 in neurons, leading us to conclude that Ephexin5 is phosphorylated at serine residues 107 and 109 during development and that this phosphorylation can be performed in hippocampal neurons by an endogenous neuronal kinase.
In order to identify all potential kinases that phosphorylate Ephexin5 at N-terminal serine residues 107 and 109, we developed an in vitro biochemical assay using immobilized purified GST-Ephexin5, in combination with ATP, reaction buffer, and lysate from P5 mouse brain as a source of kinase activity (Figure 6E). Following 1 hr of incubation of GST-Ephexin5 with kinase reaction mixture, the reaction was stopped and prepared for SDS-PAGE and immunoblot analysis with the p107/109 antibody. We robustly detected p107/109 antibody signal that was dependent on the presence of ATP, brain lysate, and phosphatase inhibitors (Figure S6D). Using this assay, we found a substantial enrichment of Ephexin5-targeted kinase activity in brain relative to other tissues at P5 (Figure 6F), consistent with our measurements of PKC isoform enrichment in P5 brain. Two prominent kinase activities are known to be highly enriched in brain tissue: those of the calcium/calmodulin-dependent protein kinase (CaMK) and PKC families (Bennett et al., 1983; Kishimoto et al., 1989). Thus, we titrated two distinct kinase active-site inhibitors into our in vitro Ephexin5 kinase assay: Autocamtide, a peptide inhibitor for CaMK members, and Gö 6983, a pan-inhibitor targeting several isoforms of PKC. We revealed a selective reduction of p107/109 antibody signal in response to Gö 6983 treatment (Figures 6G and S6E). Using purified proteins in this assay, we determined that phosphorylation of Ephexin5 at serines 107/109 from purified PKCε was substantially more robust compared with PKCa for the same enzymatic units (Figure 6H). Despite these findings, we detected little to no change in the level of p107/109 antibody signal in PKCε-knockout neonate brain tissue (Figure S6F). Similarly, we detected no change in the level of phosphorylation of Akt at serine residue 473 (pAkt S473), a site previously reported to undergo phosphorylation by PKCε (Newton and Messing, 2010), in PKCε-knockout neonate brain tissue. However, we noted that studies using constitutive genetic knockouts for specific PKCs to dissect how they regulate cellular function often use the deletion of several isoforms at once (Durgan et al., 2008; Gruber et al., 2008; Lutz-Nicoladoni et al., 2013; Seidl et al., 2013), suggesting that several PKC isoforms may share redundant roles and compensation mechanisms may result downstream of constitutive enzyme depletion (Tsokas et al., 2016; Volk et al., 2013). To this point, we find that PKCa can phosphorylate Ephexin5 (Figure 6H).
To determine whether bryostatin I can stimulate the phosphorylation of Ephexin5 at serines 107/109, we infected cultured hippocampal neurons with lentivirus to overexpress Ephexin5-myc or Ephexin5 A/A-myc and treated these cells with DMSO or 1 nM bryostatin I for 1 hr. Cell lysates from these samples showed specific p107/109 antibody signal that increased following bryostatin I treatment, consistent with the acute activation of endogenous PKCε promoting the phosphorylation of Ephexin5 at serine residues 107 and 109 in neurons (Figures 6I and S6G). Neurons treated with higher concentrations of bryostatin I and analyzed in the same manner exhibited reduced amounts of Ephexin5 phosphorylation. Because sustained activation of PKC isozymes induces their downregulation, it is likely that increasingly potent stimulations of neuronal PKCε promote PKCε downregulation and a net reduction in the phosphorylation of neuronal PKCε substrates (Lu et al., 1998).
Ephexin5 Serine Residues 107 and 109 Are Required for Ephexin5-Mediated RhoA Activation and Suppression of Hippocampal Dendritic Spine Formation
Ephexin5 is a GEF that activates RhoA (Margolis et al., 2010). To test the significance of serine residues 107 and 109 in Ephexin5mediated RhoA activation, we used mouse Neuro 2A neuroblastoma cells as a heterologous experimental system that would yield sufficient protein quantity for biochemical analysis. To confirm that Ephexin5 was phosphorylated at serine residues 107 and 109 in this system, Neuro 2A cells were plated on coverslips and co-transfected with plasmids expressing GFP and Ephexin5-myc, Ephexin5 A/A-myc, or a previously described Ephexin5 mutant with impaired GEF activity, Ephexin5 LQR (Ephexin5 LQR-myc). After fixing and immunostaining transfected cells with Myc and p107/109 antibodies, GFP expressing cells were imaged to measure Ephexin5 variant expression and phosphorylation at serine residues 107 and 109. This analysis revealed that Ephexin5-myc, Ephexin5 A/A-myc, and Ephexin5 LQR-myc were expressed to comparable levels and that both Ephexin5-myc and Ephexin5 LQR-myc were phosphorylated at serine residues 107 and 109 in Neuro 2As (Figure 7A).
Figure 7. Serine Residues 107 and 109 in Ephexin5 Are Required for Ephexin5Mediated RhoA Activation and Suppression of Hippocampal Dendritic Spine Development.

(A) Ephexin5 is phosphorylated at serines 107 and 109 in Neuro 2A cells. Mouse Neuro 2A neuroblastoma cells were co-transfected with GFP and Ephexin5-myc, Ephexin5 A/A-myc, or catalytically defective Ephexin5 LQR-myc plasmids. Transfected cultures were fixed and stained with Myc and p107/109 antibodies. Representative images are shown at left. Scale bar, 20 μM. White box indicates location of merged image.
(B) Ephexin5-mediated RhoA activation requiresserine residues 107 and 109. The Ephexin5mediated RhoA activation assay was performed and results for Ephexin5, A/A, and LQR were quantified using densitometry and analyzed for statistically significant changes in active RhoA signal to test the involvement of Ephexin5 serines107 and 109. Data are mean ± SEM (n = 3). *p < 0.05 and **p < 0.01, one-way ANOVA with post hoc Dunnett’s test.
(C) Ephexin5-mediated reduction of dendritic spine numbers requires serine residues 107 and 109. At DIV11, hippocampal cultures from Ephexin5-knockout mice were co-transfected with GFP and expression vector, Ephexin5-myc, or Ephexin5 A/A-myc plasmids. Transfected cultures were fixed and stained with Ephexin5 antibodies. Representative images are shown at left. Scale bar, 5 μM. Data are mean ± SEM (n = 38–45 neurons per condition from three experiments from independent neuronal cultures). **p < 0.01, one-way ANOVA with post hoc Dunnett’s test; spine densities normalized to the transfection of expression vector alone.
(D) Ephexin5 does not mediate global changesin dendritic arborization. Neurons described in (C) were imaged at 253 magnification to visualize neuronal arbors. Representative neuronal traces are shown. Data are mean ± SEM (n = 10 neurons per condition). *p < 0.05, two-way ANOVA with post hoc Dunn’s test.
(E) Mutation of Ephexin5 serines 107 and 109 toglutamic acid recapitulates wild-type Ephexin5 activity in neurons. Hippocampal neurons were cultured from Ephexin5 knockout animals and individually co-transfected at DIV10 with GFP and Ephexin5, A/A, E/E, or LQR constructs. Neurons were then fixed at DIV14 for confocal imaging, and dendritic spine density was measured as described in STAR Methods. Representative images are shown at left. Scale bar, 5 μM. Data are mean ± SEM (n = 19–23 neurons per condition from three experiments from independent neuronal cultures). *p < 0.05 and **p < 0.01, two-way ANOVA with post hoc Dunnett’s test.
See also Figure S7 and Table S2.
To test the requirement for Ephexin5 serines 107 and 109 in the ability of Ephexin5 to activate RhoA, we constructed an assay on the basis of previous methods to robustly detect and quantify Ephexin5-mediated RhoA activation (Reid et al., 1996). Neuro 2As were co-transfected with GFP-tagged RhoA and Ephexin5-myc, Ephexin5 A/A-myc, a variant of Ephexin5 where serine residues 107 and 109 were mutated to glutamic acid to simulate the loading of negative charge at these positions following phosphorylation (Ephexin5 E/E-myc), or Ephexin5 LQR-myc. Extracts from transfected cells were then prepared and incubated with glutathione beads conjugated to a GST fusion protein containing the rho binding domain (GST-RBD) of the mouse protein rhotekin. GST-RBD exclusively interacts with activated, GTP-bound Rho GTPases, serving as a tool to capture all activated Rho GTPases accumulated from the moment of Ephexin5 variant overexpression until cell lysis. Affinity-purified samples following GST-RBD incubation were resolved using SDS-PAGE followed by immunoblot analysis with a RhoA-specific antibody to detect RhoA binding to GSTRBD as a surrogate measure of cellular RhoA activation. As previously described, GST-RBD bound elevated amounts of activated RhoA in the presence of overexpressed Ephexin5-myc compared with overexpressed Ephexin5 LQR-myc (Figures 7B and S7A; Margolis et al., 2010). However, this elevation in RhoA activation was absent in samples overexpressing Ephexin5 A/A-myc (Figures 7B and S7A). Thus, the Ephexin5mediated activation of RhoA in these cells requires intact serine residues 107 and 109. RhoA activation in the presence of overexpressed Ephexin5 E/E-myc recapitulated but failed to surpass wild-type levels, suggesting that although glutamic acid substitution of Ephexin5 serines 107 and 109 can positively regulate Ephexin5 activity, this construct is likely an imperfect mimetic of the natively phosphorylated protein. We noted a visible change in electrophoretic mobility of the Ephexin5 antibody signal in lysates overexpressing Ephexin5-myc compared with Ephexin5 A/A-myc (Figure S7A). We interpreted these data to mean that phosphorylation of Ephexin5 at serine residues 107 and 109 is critical to promote Ephexin5-mediated RhoA activation in Neuro 2A cells.
Ephexin5 GEF activity is required for the ability of Ephexin5 to suppress hippocampal dendritic spine development (Margolis et al., 2010). We thus hypothesized that serine residues 107 and 109 were important for the Ephexin5-mediated suppression of dendritic spine formation. In order to assure no interference from endogenous Ephexin5 protein, we cultured primary hippocampal neurons from Ephexin5-knockout mice. At DIV10–11, we co-transfected these cells with GFP and Ephexin5-myc or Ephexin5 A/A-myc plasmids. Four days later, at DIV14–15, cells were fixed and stained with Myc antibodies to confirm equal expression of Ephexin5-myc and Ephexin5 A/A-myc protein in GFP expressing neurons (Figures 7C and S7B). GFP-positive neurons were imaged, and dendritic spines were counted on three segments of apical dendrite per neuron. We observed that neurons transfected with Ephexin5-myc exhibited a reduction of dendritic spine density (Figure 7C). In contrast, Ephexin5 A/A-myc, which failed to activate RhoA, also failed to suppress spine growth (Figure 7C). To test if Ephexin5 serine residues 107 and 109 contributed to dendritic outgrowth, we performed a Sholl analysis to measure dendritic complexity in neurons previously transfected with Ephexin5-myc or Ephexin5 A/A-myc. This analysis revealed scarce differences in dendritic arborization at DIV14 between control transfected neurons and neurons transfected with Ephexin5-myc or Ephexin5 A/A-myc (Figure 7D). On the basis of these data, serine residues 107 and 109 of Ephexin5 regulate Ephexin5 with respect to RhoA activation and the regulation of neuronal dendritic spine formation. Consistent with thesefindings, Ephexin5 E/E-myc recapitulated the ability of Ephexin5-myc to restrict dendritic spine number (Figure 7E).
DISCUSSION
We find that driving PKCε activity in immature neurons, either through genetic gain of function or acute activation of the endogenous protein, promotes the activation of a biochemical signaling pathway that reduces dendritic spine number through the RhoA GEF Ephexin5. On the basis of data from live-cell imaging of developing neurons, we conclude that this occurs through a combined mechanism that inhibits new spine growth and eliminates existing spines. The failure of PKCε to reduce spine densities in mature neurons may either arise from an enrichment of mature, stabilized dendritic spines or is due to a reduction in expression of the PKCε substrate Ephexin5.
Activation of PKC Signaling during Brain Development
We have discovered that isoforms of PKC are highly enriched and active in the neonatal brain and developing hippocampal neurons. PKCs require the lipid second messenger DAG, localized at the cell surface, for full activation. Just prior to and during when we detect phosphorylated Ephexin5, hippocampal neurons are born from their precursors in the hippocampal ventricular zone and migrate radially to their terminal positions, from which they subsequently elongate neurites and ultimately synapse with their neighbors (Harris et al., 1992; Kitazawa et al., 2014; Tomita et al., 2011). These processes occur in sequence, and each is regulated, in part, by phospholipase Cs (PLCs) and DAG kinases (DGKs), two classes of enzymes responsible for DAG synthesis and removal, respectively. For example, PLCg1 has been ascribed in different systems with roles in neuronal migration, neurite outgrowth, axon guidance, and the maintenance of dendritic spine morphology (Kang et al., 2016). In addition, DGKb-knockout mice exhibit reduced hippocampal dendritic spine densities accompanied by deficits in learning and memory (Shirai et al., 2010). Whether these signaling enzymes operate through specific neuronal PKCs, such as PKCε, to regulate the development of dendritic spines remains unclear.
Neuronal PLCs interact with cell surface receptors and activate in response to ligand binding and receptor signaling. For example, neuronal receptor tyrosine kinases such as the FGF receptor, the BDNF receptor TrkB, and the EphrinA receptor EphA4 induce PLCg1 activity in the regulation of neuronal morphogenesis in various systems (Kang et al., 2016). This inducible control of membrane PLCg1 is predicted to render PKC activity in the developing neuron sensitive to similar upstream signaling through changes in membrane DAG levels (Newton, 2010). Whether extracellular molecules such as FGF, TrkB, and EphrinA activate individual neuronal PKC isoforms in developing neurons, andhowindividual PKC activation isrelevantto the roles of these neuronal morphogens during development remain open and important questions, essential for understanding the complete neurodevelopmental roles of the brain-enriched PKCs.
Substrates Direct PKCε-Mediated Control of Neuronal Function
Although previous reports indicate a pro-synaptogenic function for PKCε in older neurons, we unexpectedly discovered that endogenous PKCε activation in immature neurons restricts dendritic spine number in a temporally regulated manner, in part through the dual phosphorylation of its substrate, the RhoA GEF Ephexin5, at serine residues 107 and 109 (Figure S7). Although rare, there is precedent for PKC-mediated phosphorylation of closely apposed serines in other contexts (Fujimoto et al., 1999).
Rho-family GEFs are commonly autoinhibited by their N termini, and in the case of the GEF Vav1, phosphorylation can serve as a means to relieve this inhibition to confer Dbland Pleckstrin homology domain access to small GTPases in order to facilitate the exchange of GDP with GTP (Aghazadeh et al., 2000). However, we have found that N-terminally truncated Ephexin5 in fact fails to activate RhoA or restrict dendritic spine development (T.B.S. and S.S.M., unpublished data). On the basis of these data we predict that the phosphorylation of Ephexin5 at N-terminal serine residues 107 and 109 is likely not to relieve autoinhibition by the N terminus of Ephexin5 but rather may activate Ephexin5 through another mechanism. One possibility is that the dual phosphorylation of two closely apposed serines within the Ephexin5 N terminus contributes to the changes necessary for structural or cofactor-mediated Ephexin5 activation.
Considering the increasing functions attributed to PKCε in neuronal function, our understanding of how PKCε substrates coordinate these functions is comparatively lacking. In mature neurons, PKCε was shown to promote excitatory synapse formation and potentiate synaptic activity by phosphorylating PSD95 at serine 295 in post-synaptic neurons (Sen et al., 2016). Experiments in rats and C. elegans have also demonstrated requirements for PKCε activity in the formation of new memories in various behavioral paradigms, although which PKCε substrates mediate these activities are unknown (Arey et al., 2018; Hawk et al., 2018; Zisopoulou et al., 2013). Notably, behavioral studies in C. elegans implicate pre-synaptic PKCε, and to what extent post-synaptic PKCε is also active in these experimental models remains undescribed. Ephexin5 expression in the mature brain is significantly reduced compared with during brain development; thus we predict that any pro-synaptogenic function of PKCε in mature neurons is not likely to involve Ephexin5 (Figures 5B and 5E) (Margolis et al., 2010).
In other contexts, PKCε has been shown to phosphorylate Connexin43, STAT3, TRPV1, and Akt, but whether these phosphorylated proteins play related roles in dendritic spine development or synaptic function as a consequence remains unknown (Doble et al., 2000; Newton and Messing, 2010). On the basis of our work, we reason that the roles specific PKCs play in modulating neuronal function are tightly connected to the expression, phosphorylation, and regulation of specific substrates. The presence of Ephexin5 during a specific temporal window confers an inhibitory role to PKCε in the formation of dendritic spines, where excitatory synapses ultimately reside.
Synapse Restriction Pathways in Neurological Disease
Neurodegenerative disorders, such as Alzheimer’s disease (AD), result in part from a loss of synapses due to misregulation of neuronal signaling proteins, such as Ephexin5 and PKCε (Blalock et al., 2004; Hongpaisan et al., 2011; Sell et al., 2017). In healthy brains, Ephexin5 expression is reduced to low levels as the brain matures (Figure 5B). Recently it was shown that Ephexin5 expression is significantly elevated in adult brain tissue from AD patients and AD mouse models (Blalock et al., 2004; Sell et al., 2017). Reducing Ephexin5 expression in an AD mouse model is sufficient to restore characteristic hippocampal dendritic spine and behavioral deficits to wild-type levels (Sell et al., 2017). Although the mechanism required for reactivated expression of Ephexin5 in AD brains has been described (Sell et al., 2017), the mechanisms that regulate the activity of elevated Ephexin5 in AD brains remain unknown. We hypothesize that this could be mediated by PKCε.
It has been reported that levels of PKCε protein are reduced in AD. Subsequently, bryostatin I has been recently investigated as a potential AD therapeutic. Investigators found that 2 or 12 week bryostatin I treatments in AD mouse models reduce deficits in learning and memory observed in these animals (Hongpaisan et al., 2011; Schrott et al., 2015). In addition, measurable improvements in cognitive tests have also been observed in AD patients treated with bryostatin I (Nelson et al., 2017). The exact mechanism of how bryostatin I alleviates AD symptoms remains unknown.
A distinct feature of PKC signaling is that prolonged PKC activation leads to downregulation of PKC activity (Lu et al., 1998). The resulting activity of brain PKCε following bryostatin I administration in AD mice remains to be measured. We observed that with only 1 hr of bryostatin I treatment, PKCε is activated and dendritic spine number is reduced in an Ephexin5-dependent manner. It is therefore possible that experimental doses of bryostatin I lead to PKCε downregulation in the AD mouse or patient brain, thus reducing the activated pool of pathologically elevated Ephexin5 in AD and ameliorating the synaptic loss observed in AD. Our data establishing the link between Ephexin5 and PKCε provide insight into how mechanisms inhibiting synapse formation are normally confined to early brain development and may indicate how they can be pathologically reactivated to promote synaptic loss in adult neurodegenerative disorders.
STAR*METHODS
CONTACT FOR REAGENT AND RESOURCE SHARING
Further information and requests for resources and reagents should be directed to and will be fulfilled by the Lead Contact, Seth S. Margolis (smargol7@jhmi.edu ).
EXPERIMENTAL MODEL AND SUBJECT DETAILS
Mice
All animal studies were performed with protocols that are compliant and approved by the Institutional Animal Care and Use Committees of The Johns Hopkins University School of Medicine. Wild-type C57BL/6 mice were purchased from Charles River Laboratories (Stock number 027; RRID: IMSR_CRL:27). These are general use multipurpose animals that are used by many laboratories in the field. These animals were used for preparing neuronal cultures.The generation of Ephexin5 knockout animals is described elsewhere (Margolis et al., 2010). Genetic deletion of the Ephexin5 locus was bred into both 129 and C57BL/6 lineages, which were used for experiments in this paper. PKCa, PKCb, and PKCg knockout mouse tissues were gifted by D. Fioravante (University of California Davis). PKCε knockout mice were gifted by R. Messing (University of Texas at Austin).
Neuronal cultures
For experiments in cultured neurons, pregnant dams of C57BL/6 lineage were sacrificed after 17.5 days of gestation and dissociated neurons were plated from dissected pups as described previously (Margolis et al., 2010). Experiments done in Ephexin5 wild-type and Ephexin5 null genetic backgrounds were performed in neurons cultured from mouse neonates of C57BL/6 or 129 lineage dissected at P0-P1, with tail snippets saved for subsequent DNA extraction and genotyping.
HEK293 and Neuro2A cells
HEK293 cells were maintained in DMEM supplemented with 10% FBS, 2 mM glutamine, and penicillin/streptomycin (100 U/mL and 100 mg/mL, respectively) at 37°C/5% CO2. Frozen aliquots are cultured for a limited number of passages. HEK293 cells were transfected for 24 or 48 hours using the calcium phosphate method as previously described (Lois et al., 2002). Neuro 2A cells were transfected using Lipofectamine 2000 (Life Technologies) following manufacturer recommendations.
METHOD DETAILS
DNA constructs
The full-length mouse Ephexin5 subcloned into the pEF1-Myc-HisA vector was described previously (Margolis et al., 2010). Ephexin5 GEF mutant (Ephexin5-LQR) was previously described (Margolis et al., 2010). The Ephexin5 phosphorylation mutant (Ephexin5S107A/S109A) was generated using the Stratagene QuikChange site-directed mutagenesis kit. The forward PCR primers used for this mutagenesis were the following: Ephexin5 S107A S109A 5’-ccagtgtcccggcgcgccatcgccccagaaccagctccc-3′ and complementary Ephexin5 S107A S109A 5′-gggagctggttctggggcgatggcgcgccgggacactgg-3′. The Ephexin5 phosphorylation pseudo mimetic (Ephexin5-S107E/S109E) was generated using the Stratagene QuikChange site-directed mutagenesis kit. The forward PCR primers used for this mutagenesis were the following: Ephexin5 S107E S109E 5′-ccagtgtcccggcgcgaaatcgaaccagaaccagctccc-3′ and complementary Ephexin5 S107E S109E 5′-gggagctggttctggttcgatttcgcgccgggacactgg-3′. The following plasmid constructs were gifts from Bernard Weinstein: PKCα-HA, PKCβ-HA, PKCγ-HA, PKCε-HA, and PKCε-K437R-HA (Addgene 21232, 16378, 21236, 21240, and 21243 respectively (Soh and Weinstein, 2003)). The following plasmid constructs were gifts from Klaus Hahn: pcDNA3-GFP-RhoA-WT, pcDNA3-GFP-RhoA-Q63L, pcDNA3-GFP-RhoA-T19N (Addgene 12965, 12968, and 12967 respectively (Subauste et al., 2000)). The GFP plasmid was described previously (Margolis et al., 2010). The FUGW, VSVG, and D8.9 constructs used for lentivirus generation were gifts from Hana Goldschmidt and Daniel Raben. All constructs were verified by DNA sequencing.
Antibodies
Ephexin5 antibodies, raised in rabbit against a GST-fusion protein containing Ephexin5 amino acids 1–418, were previously described (Margolis et al., 2010). The p107/109 antibody was raised in rabbit against a peptide sequence corresponding to Ephexin5 amino acids 101–115 (SPVSRRpSIpSPEPAPC), in which serine residues 107 and 109 were phosphorylated. For immunoblotting, anti-Ephexin5 antibody was used at a concentration of 1:2000 in a blocking buffer consisting of non-fat dry milk dissolved to a concentration of 5% in TBS with 0.05% Tween 20, while anti-p107/109 antibody was used at 1:500 in BSA similarly prepared.
The following antibodies are commercially available and used according to manufacturer’s suggestions for Western Blots, immunocytochemistry and immunoprecipitation: PKCa (BD Biosciences 610107), PKCb (BD Biosciences 610127), PKCg (Santa Cruz Biotechnology SC-211), PKCε (BD Biosciences 610085), RhoA (Santa Cruz Biotechnology SC-418), b-Actin (Abcam ab8226), Tuj1/bIII-tubulin (EMD Millipore TU-20), Transferrin receptor (Invitrogen 136800), HA (Sigma H3663), Myc (Abcam ab32), Synapsin (Millipore AB1543P), Synaptophysin (Millipore MAB368), PSD95 (Thermo Scientific MA1–046), and GAPDH (Goldschmidt et al., 2016). Anti-mouse IgG and anti-rabbit IgG secondary antibodies (Cell Signaling Technology 7076S and 7074S, respectively) were used for immunoblotting at a concentration of 1:5000 in the same blocking buffer as the primary antibody.
Cell culture, transfections, and drug treatments
HEK293 and Neuro 2A cells were cultured in DMEM with added fetal bovine serum (10% final), glutamine (2 mM), and penicillin/ streptomycin (100 U/ml and 100 mg/mL respectively).
For primary mouse neuronal cultures, pregnant wild-type C57BL/6 mice were sacrificed at E17.5 and dissected in order to remove embryos. From isolated embryos, brains were removed and dissected cortices were then moved into dissociation buffer (10 mM MgCl2, 10 mM HEPES, 1 mM Kynurenic Acid in Hank’s Balanced Salt Solution) plus 16.67 U/ml Papain, which was incubated for 30 minutes at 37°C. All hippocampi for cultures of uniform genotype were mixed together and contain both male and female neuronal tissue. It was challenging to tell the sex of a mouse embryo and there was not enough material to separate out each embryo and still be able to perform the described biochemical studies in this manuscript. Proteolyzed tissue was rinsed for 5 minutes twice in 10 mg/ml Trypsin inhibitor. Tissue was then resuspended in Neurobasal and mechanically dissociated into a single-cell suspension. Cells were counted with a hemocytometer and neurons were plated for imaging on glass coverslips within wells of a 24-well plate at a concentration of 200,000 cells/well. Hippocampal cultures were plated in in Neurobasal Medium (Neurobasal A was used for postnatal cultures) supplemented with 2% B27, penicillin/streptomycin (100 U/mL and 100 mg/mL, respectively), 5% donor equine serum, and 2 mM glutamine; after three days, cultures were changed into identical media less serum and maintained by supplementing new media into culture every 3 days (50% of original culture volume). Neurons designated for biochemical analysis were plated in 12-well or 6-well formats at 850,000 cells/well or 2,000,000 cells/well, respectively. Authenticity and viability of neuronal cultures was determined post hoc in part by morphology using light microscopy and immunoblotting of cell lysates with well-validated antibodies against neuronally-enriched proteins.
For imaging experiments, glass coverslips (12 mm) were etched for 16 hours in 70% Nitric Acid, shaking at room temperature. The following day, coverslips were rinsed 20 times in distilled and deionized water (ddH2O), twice in 100% ethanol, and autoclaved. Coverslips were coated overnight prior to neuron plating with 1 mg/ml Poly-L-Lysine dissolved in a sterile-filtered solution of 1 M Tris pH 8.0, then rinsed 3 times on the day of plating with ddH2O. Plastic neuronal culture substrates were coated with Poly-L-Lysine for at least 1 hour.
HEK293 cells were transfected for 24 or 48 hours using the calcium phosphate method as previously described (Lois et al., 2002). Neuro 2A cells were transfected for 30 hours using Lipofectamine 2000 according to the manufacturer’s protocol. Neurons were transfected using Lipofectamine 2000 according to the manufacturer’s protocol, modified as follows: 1) Neurobasal was used for transfection medium; 2) Per-well transfection mixture was composed of 50 mL Neurobasal plus DNA and 50 mL Neurobasal plus 1.5 mL Lipofectamine, incubated for 20 minutes; 3) Plasmid and Lipofectamine complexes were added to cells in reduced culture media for 40 minutes, at which point transfection media was aspirated and replaced with the remainder of culture media for each well. Constructs encoding Ephexin5 variants and PKC isoforms were transfected in quantities of 1 mg each, with 0.1 mg of GFP co-transfected as a cell fill. Neurons destined for drug treatments were transfected with 0.1 mg of GFP and 0.5 mg of empty pEF-myc-HisA expression vector, which was noted to improve transfection efficiency.
In order to activate PKCε in neurons, cells were treated for 1 hour with Bryostatin I. In order activate PKC signaling in HEK293s, cells were treated with 100 nM PMA (Tocris 1201). In both cases, inhibitors Gö 6983, GF109203X, and Y-27632 (Tocris 2285, 0741, and 1254, respectively) were pre-applied in separate samples at indicated concentrations for 10–15 minutes and maintained during the duration of PKC stimulation.
Generation and use of lentivirus
The Ephexin5-myc ORF was cloned into the third generation FUGW lentiviral vector directly downstream of the hUb promoter (Lois et al., 2002). The resulting Ephexin5 lentiviral vector plasmid was then propagated by transformation into E. coli Stbl2 or Stbl3 strains. For the generation of lentiviral particles, the Ephexin5 lentiviral vector was co-transfected with VSVG and Δ8.9 plasmids in amounts of 20 ug, 15 ug, and 10 ug respectively into 4 plates of HEK293 cells plated at 8 million cells per plate one day prior (Goldschmidt et al., 2016). Transfections were performed using Lipofectamine 2000 and opti-mem, and 8 hours after transfection, media was changed into fresh opti-mem and cells were grown for an additional 24 hours. Following 24 hours, lentiviral particles were collected by withdrawing culture media, which was then saved at 4°C. Opti-mem was replaced and cells were cultured for an additional 16 hours prior to a second culture media harvest, after which all collected media was combined and virions were harvested via ultracentrifugation at 100,000 × g for 2 hours at 4°C. Supernatant was discarded and viral pellets were resuspended overnight in stock Neurobasal media prior to use.
For lentiviral transduction of cultured neurons, 20 ul of resuspended lentiviral particle suspension was added per well to neurons cultured in 6 well format. Cultures were grown for an additional 4 days prior to harvest for immunoblot analysis.
Live-cell confocal imaging
Hippocampal neurons were dissected as described above and plated on 24-well, glass bottom tissue culture dishes (MatTek P24G-1.0–10-F). Neurons were cultured until DIV10 and co-transfected with Lipofectamine 2000 as described with 100 ng eGFP plasmid and 500 ng empty pEF-myc overexpression vector.
At DIV13, transfected neurons were equilibrated for 10 minutes at 37°C and 5% CO2 within a custom-built atmospheric chamber attached to a Zeiss AxioObserver.Z1 inverted microscope. Based on preliminary results suggesting that irradiation with 473 nm light inactivated Bryostatin I during continuous imaging, cells were instead imaged prior to and after drug treatment. Neurons in control wells or wells designated for Bryostatin I treatment were first imaged at steady state for green fluorescence excited by a 473 nM laser coupled to a Yogosawa CSU22 spinning disk confocal scanner unit and captured by a 63X objective. Complete Z stacks were recorded for multiple live cells per condition whose positions were recorded in Slidebook software, after which DMSO or Bryostatin I were added at previously described concentrations and incubated for 55–60 minutes. At the end of each incubation, previously recorded cell positions were revisited and cells were imaged again to capture their post-treatment morphologies.
In order to analyze changes in dendritic spine number during the above treatment time course, pre- and post-treatment Z stacks were loaded into ImageJ and cropped into 3 regions of interest (ROIs) containing 200 micron segments of apical dendrite. Dendritic spines were manually counted for each pre- and post-treatment ROI, and designated as either original (present during pre-treatment imaging) or newly formed during the time course of treatment. For each segment, the absolute number of new spines formed during each treatment was calculated as the sum of newly-formed designated spines in the post-treatment segment for either DMSO or Bryostatin I. For each segment, the absolute number of spines eliminated during each treatment were calculated as the absolute value of the difference between the numbers of original spines in the post-treatment and pre-treatment segments for each condition.
Immunocytochemistry
Our transfection protocol inherently sparsely transfects neurons in culture, thus enabling the identification of positive transfectants in isolation among their untransfected neighbors via GFP fluorescence. Neurons were fixed for 8 min at 25°C with 4% paraformaldehyde/4% sucrose in PBS. To visualize overexpressed Ephexin5 protein in the context of the GFP labeled neurons, transfected neurons on coverslips were stained using Myc, Ephexin5, or p107/109 antibodies (1:200 each) in 1 3 GDB (30 mM phosphate buffer [pH 7.4] containing 0.2% gelatin, 0.5% Triton X-100, and 0.8 M NaCl) overnight at 4°C. Goat anti-mouse Cy3 and goat anti-rabbit Cy5 (1:200 each in 1 3 GDB for 1 hr at 25°C, Jackson Immunoresearch 715–165-151 and 711–175-152, respectively) antibodies were used to visualize the primary antibodies. The same protocol was used with HA antibodies to visualize PKC-HA overexpression. Samples on coverslips were mounted on glass slides using Fluoromount-G (Southern Biotech 0100–01). A similar protocol was used for immunocytochemistry in Neuro 2A cells.
To validate the specificity of our p107/109 antibody for immunocytochemistry, the phosphopeptide used to generate the antibody (PSPVSRRpSIpSPEPAPC) and a peptide corresponding to the identical, non-phosphorylated motif (PSPVSRRSISPEPAPC) were pre-incubated with p107/109 antibody to determine antibody binding preference between the two epitopes under imaging conditions. Lyophilized peptides were warmed from 80C to room temperature in a vacuum desiccator. Peptides were resuspended in 100% DMSO to create 10 mM peptide stock solutions. Neurons on coverslips were transfected at DIV 10–12 with GFP and Ephexin5 plasmids and fixed two days later. Meanwhile, p107/109 and Myc antibodies were pre-incubated for 24 hours at 4°C under constant agitation with titrations of phosphorylated or non-phosphorylated peptides diluted into 1X GDB, 1% DMSO. Mixtures were then directly added to coverslips for immunostaining.
Image analysis for protein expression and quantification of dendritic spines
Images were taken as Z stacks at 25x or 40x on a Zeiss LSM710 laser scanning confocal microscope. Z stacks were projected to a single, maximum-intensity image in Fiji/ImageJ (U. Wisconsin-Madison/National Institutes of Health), where all subsequent analyses of immunofluorescent intensity and dendritic arborization were conducted. Dendritic spine counting for each neuron was performed in Metamorph (Molecular Devices) on 25–50 mm segments of secondary and tertiary apical dendrites, 100–200 mm distal to the cell soma of neurons with pyramidal morphology. Where possible, 3 segments were analyzed per neuron. In order to control for cultureintrinsic differences in spine densities between experiments, the dendritic spine density of each neuron in a given experiment was normalized to the average spine density for neurons corresponding to the control conditions of that experiment. For the counting of dendritic spine subtypes, neuron Z stacks were individually imported into NeuronStudio (Rodriguez et al., 2008; Wearne et al., 2005), and neuronal morphology was modeled using built-in algorithms. Spine subtype classification was performed as reported previously (Sell et al., 2017).
Assessments of protein overexpression levels within transfected neurons for imaging experiments were made by quantifying the pixel intensity corresponding to the immunofluorescent signal from that protein’s epitope tag in Fiji. Sholl analysis was performed using built-in plug-ins in Fiji. Briefly, neuronal dendrites were traced from fluorescent micrographs, and from these tracings concentric circles of increasing radii were drawn originating at the cell soma. For each circle, the number of intersecting dendrites for that neuron was tabulated and graphed with respect to radius from the soma to represent the overall complexity of the dendritic arbor (Sholl, 1953).
RhoA activation assays
For the analysis of Ephexin5-mediated RhoA activation, Neuro 2A cells were plated in 10 cm dishes. Cells were grown to 50% confluency and transfected using a mixture of Opti-mem and Lipofectamine 2000, following manufacturer recommended protocols. Each transfection reaction contained 8 ug of expression vector or Ephexin5 variant plasmid and 8 ug of GFP-RhoA plasmid. Culture media was changed 24 hours post-transfection, and cells were grown for an additional 6 hours prior to the harvest and processing of cell lysates according to RhoA Activation Assay kit protocols (Millipore 17–294).
Tissue lysis, cell lysis, immunoblotting
All immunoblot data shown is representative of N ≥ 2 experiments. For the analysis of endogenous protein levels, whole brains were resected from animals of indicated ages that were sacrificed according to institutional protocols. For brain region analysis, brains were dissected according to gross morphological landmarks to isolate hippocampus, olfactory bulbs, and cortical hemispheres from the remainder of tissues. Tissue extracts subjected to immunoblot analysis were first mechanically homogenized on ice in borosilicate glass dounce homogenizers containing RIPA buffer (25 mM Tris pH 7.5, 150 mM NaCl, 1 mM EDTA, 1% SDS, 0.1% Triton X-100, 0.5% sodium deoxycholate, plus 1 tablet/10 mL buffer of Complete EDTA-free protease inhibitor cocktail [Sigma-Aldrich/ Roche 11836170001]), then fractionated into soluble and insoluble material by ultracentrifugation for 1 hour at 4°C at 136,000 × g. The supernatant was then combined with Laemmli buffer and denatured at 95°C for 10 minutes before loading onto SDS-PAGE. Cultured cells (neurons, HEK293, Neuro 2A) were either lysed identically without mechanical homogenization, or lysed directly in Laemmli buffer. SDS-PAGE gels were transferred to nitrocellulose membranes, which were subsequently immunoblotted according to antibody vendor recommendations or as indicated in Antibodies section. After antibody treatments, enhanced chemiluminescent membranes were exposed to film.
Expression and purification of GST-Ephexin5
For the generation of purified full-length Ephexin5 protein, a pGEX plasmid encoding N-terminally fused GST-Ephexin5 was transformed into Rosetta DE3 BL21 bacteria. Starter cultures harboring Ephexin5 plasmid were grown overnight at 37°C and used to inoculate larger cultures the following day at 1:100. Cultures were grown at 37°C until reaching an OD (600) of 0.6–0.8, at which point cultures were divided into 100 mL volumes and GST-Ephexin5 expression was induced by addition of 0.5 mM Isopropyl b-D-1-thiogalactopyranoside for 1 hour. Cells were spun and harvested in 2.3 M sucrose, 50 mM Tris pH 7.5, and 1 mM EDTA. Recovered cells were lysed on ice for 1 hour in 50 mM Tris pH 7.5, 10 mM KCl, 1 mM EDTA, 2 mM DTT, 1 mM PMSF, and 55 mM lysozyme (Sigma L6876). Lysates were then treated with 0.1% sodium deoxycholate, 25 mM MgCl2, 0.4 nM DNase I for 15 minutes and insoluble material was separated from lysate via centrifugation at 4,000 × g for 30 minutes at 4°C. To the supernatant, comprised of bacterial lysate containing overexpressed GST-Ephexin5, Glutathione Sepharose beads (GE Healthcare 17513201) were added and incubated under constant rotation at 4°C for 2–4 hours. Beads with bound GST-Ephexin5 protein were then both rinsed and stored in 10 mM HEPES pH 7.5, 1 mM DTT for a maximum of 2 weeks, during which time aliquots were taken for in vitro phosphorylation assays.
in vitro Ephexin5 phosphorylation assays
For GST-Ephexin5 phosphorylation in the presence of brain lysate, P5 brains were dissected from WT pups, combined on ice with 750 μL of a modified RIPA buffer lacking EDTA (25 mM Tris pH 7.5, 150 mM NaCl, 1% SDS, 0.5% sodium deoxycholate, 0.1% Triton X-100), and mechanically lysed in a dounce homogenizer. Brain lysates were then clarified by spinning in a benchtop ultracentrifuge at 136,000 × g and 4°C for 60 minutes. Approximately 0.05 μg of purified GST-Ephexin5 was combined in a reaction mixture with 50 μM ATP and kinase reaction buffer consisting of 25 mM HEPES pH 7.5, 150 mM NaCl, 10 mM MgCl2, 0.5 mM DTT, and 0.1% Tween-20. Reactions were initiated when equal amounts (typically 1 μL) of brain lysate were added to existing reaction mixtures in a total volume of 100 μL, and subsequently were incubated at 37°C for 60 minutes with constant agitation. Reactions were terminated by the addition of an equal volume of 2X Laemmli buffer, and products were denatured for 10 minutes at 95°C for SDS-PAGE and immunoblot analysis. Kinase assays to compare Ephexin5-targeted kinase activity in mouse tissue lysates were loaded with 200 μg of each tissue lysate as measured via Bradford assay (Bio Rad 5000001). For in vitro Ephexin5 phosphorylation using purified PKCa and PKCε, purified active PKC isoforms (Millipore 14–484 and 14–518, respectively) were titrated into a reaction mixture consisting of PKC lipid activator (Millipore 20–133), 50 μM ATP, 0.05 μg purified GST-Ephexin5, and kinase reaction buffer in a total volume of 50 μL. Reactions were incubated at 37°C for 60 minutes with constant agitation, and were subsequently terminated by the addition of an equal volume of 2X Laemmli buffer. Reaction products were then denatured for 10 minutes at 95°C for SDS-PAGE and immunoblot analysis.
Membrane extraction of activated PKC isoforms
Hippocampi were dissected from whole brains resected as described above. Tissue was homogenized on ice in buffer consisting of 40 mM Tris pH 7.6, 40 mM NaCl, 2 mM 2-mercaptoethanol, 5 mM MgCl2, 5 μM MG132, and protease inhibitors. Small quantities of the resulting homogenates were saved for analysis as the input fraction. Remaining homogenates were fractionated into soluble and insoluble fractions by ultracentrifugation for 1 hour at 4°C at 112,000 × g. Supernatants were kept as cytosolic extracts, while pellets were resuspended in original buffer and centrifuged again. Following this second centrifugation step, supernatants were discarded and pellets were resuspended in original buffer plus 1% Triton X-100 (used generally) or 1% Igepal CA630 (used in our initial characterization of Bryostatin specificity in neurons) to extract lipid-associated proteins, then rotated at 4°C for 10 minutes. Following an additional ultracentrifugation using previous parameters, resulting supernatants were saved as membrane extracts. Protein concentrations of all extract fractions were quantified via Bradford assay (Bio-Rad 5000001) prior to resuspension in Laemmli buffer and denaturation for immunoblot analysis, during which fractionations were subsequently verified according to the separation of canonical cytosolic and membrane proteins.
QUANTIFICATION AND STATISTICAL ANALYSIS
Data shown are mean ± SEM. For spine density experiments, biological data points were designated as individual neurons to address the question of how an average neuron responds to a particular experimental manipulation. To correct for experimental variability between individual spine experiments, the n values described in Table S2 were derived from individual neurons whose mean spine densities were calculated, then normalized to the mean control spine density for a given experiment. This preserves the distribution of and variability between data points for each individual dataset, while standardizing the data for batch statistical analysis. All normalized spine densities were then combined between experimental repeats for statistical analysis and hypothesis testing. Each experiment was repeated several times using multiple coverslips from independent neuronal cultures as specified in each figure legend. No statistical methods were used to predetermine sample size. The experiments were not randomized. All statistical analyses were performed using Prism (Graphpad software) and R, accounting for appropriate distribution and variance to ensure proper statistical parameters were applied. Experimental sample sizes were chosen according to norms within the field. Prior to significance testing, the normal distribution of data for each experimental condition was tested using the Shapiro-Wilk test for normality with an alpha value of 0.05. For dendritic spine experiments, normally-distributed datasets were then tested for statistical significance between samples using the 2-tailed heteroscedastic t test for two samples, or 1-way ANOVA for greater than two samples followed by Dunnett’s post hoc test between control and experimental conditions. Datasets containing non-normally distributed samples were analyzed by Mann-Whitney U test for two samples, or Kruskal-Wallis tests for greater than two samples followed by Dunn’s post hoc test between control and experimental conditions. Dendritic arborization data was analyzed using 2-way ANOVA followed by post hoc Tukey test, where radius from soma and overexpression condition were designated as independent variables. All other experiments analyzed quantitatively were treated similarly. p values ≤ 0.05 were considered significant.
DATA AND SOFTWARE AVAILABILITY
All reagents and protocols used in this study are available for sharing upon reasonable request to the authors.
Supplementary Material
KEY RESOURCES TABLE.
| REAGENT or RESOURCE | SOURCE | IDENTIFIER |
| Antibodies | ||
| Mouse anti-PKCα | BD Biosciences | Cat# 610107; RRID AB_397513 |
| Mouse anti-PKCβ | BD Biosciences | Cat# 610127; RRID AB_397533 |
| Rabbit anti-PKCγ (C–19) | Santa Cruz Biotechnology | Cat# SC–211; RRID AB_632234 |
| Mouse anti-PKCε | BD Biosciences | Cat# 610085; RRID AB_397492 |
| Mouse anti-PSD-95 (7E31B8) | Pierce | Cat# MA1046; RRID AB_2092361 |
| Mouse anti-β-Actin (8226) | Abcam | Cat# ab8226; RRID AB_306371 |
| Mouse anti-TFRC (H68.4) | Invitrogen | Cat# 136800; RRID AB_2533029 |
| Mouse Tuj1/βIII-tubulin | Millipore | Cat# MAB1637; RRID AB_2210524 |
| Mouse anti-HA (HA-7) | Sigma | Cat# H3663; RRID AB_262051 |
| Chicken anti-GFP | Aves Labs | Cat#1020; RRID AB_10000240 |
| Rabbit anti-GAPDH | D. Raben (Hopkins) | (Goldschmidt et al., 2016) |
| Rabbit anti-Ephexin5 | M. Greenberg (Harvard) | (Margolis et al., 2010) |
| Rabbit anti-Synapsin | Millipore | Cat# AB1543P; RRID AB_90757 |
| Mouse anti-Synaptophysin (SVP38) | Millipore | Cat# MAB368; RRID AB_94947 |
| Mouse anti-Myc (9E10) | Abcam | Cat# ab32; RRID AB_303599 |
| Rabbit anti-Ephexin5 p107/p109 | This study | N/A |
| Rabbit anti-Ephexin5 p107/p109 | M. Greenberg (Harvard) | N/A |
| Rabbit anti-pAkt S473 | Cell Signaling Technology | Cat# 9271; RRID AB_329825 |
| Rabbit anti-Akt | Cell Signaling Technology | Cat# 9272; RRID AB_329827 |
| anti-RhoA (26C4) | Santa Cruz Biotechnology | Cat# SC–418; RRID AB_628218 |
| Goat anti–Rabbit IgG, (H+L), HRP | Cell Signaling Technology | Cat# 7074S; RRID AB_2099233 |
| Horse anti-Mouse IgG, (H+L), HRP | Cell Signaling Technology | Cat# 7076S; RRID AB_330924 |
| Donkey anti-mouse Cy3 | Jackson Immunoresearch | Cat# 715–165-151; RRID AB_2315777 |
| Goat anti-rabbit Cy5 | Jackson Immunoresearch | Cat# 711–175–152; RRID AB_2340607 |
| Bacterial and Virus Strains | ||
| DH5α | Thermo Fisher Scientific | Cat# 18265017 |
| Rosetta DE3 BL21 bacteria | E. Goley | N/A |
| Chemicals, Peptides, and Recombinant Proteins | ||
| Poly-L-Lysine (PLL) | Sigma-Aldrich | Cat# P4707 |
| Papain | Worthington | Cat# LS003127 |
| B27 | Thermo Fisher Scientific | Cat# 17504044 |
| Neurobasal | Thermo Fisher Scientific | Cat# 21103049 |
| Neurobasal A | Thermo Fisher Scientific | Cat# 10888–022 |
| Penicillin/streptomycin | Sigma-Aldrich | Cat# 15140122 |
| L-Glutamine | Thermo Fisher Scientific | Cat# 25030081 |
| Trypsin | Thermo Fisher Scientific | Cat# 25200056 |
| Trypsin Inhibitor | Sigma-Aldrich | Cat# T9253; CAS: 9035–81–8 |
| DMEM | Thermo Fisher Scientific | Cat# 11960069 |
| Fetal bovine serum | Thermo Fisher Scientific | Cat# 16000044 |
| Donor equine serum | Thermo Fisher Scientific | Cat# SH3007001 |
| Phosphate buffered saline | Thermo Fisher Scientific | Cat# 10010049 |
| cOmplete Protease inhibitor | Sigma-Aldrich | Cat# 11836170001 |
| Precision Plus Standards | Bio-Rad | Cat# 1610374 |
| PROTOGEL (30%) | ThermoFisher Scientific | Cat# 50–899–90118 |
| Lipofectamine 2000 | Life Technologies | Cat# 11668019 |
| Bryostatin I | Tocris | Cat# 2383; CAS: 83314–01–6 |
| PMA | Tocris | Cat# 1201; CAS: 16561–29–8 |
| Go¨ 6983 | Tocris | Cat# 2285; CAS: 133053–19–7 |
| GF109203X | Tocris | Cat# 0741; CAS: 133052–90–1 |
| Y–27632 | Tocris | Cat# 1254; CAS: 129830–38–2 |
| MG132 | Cell Signaling Technology | Cat# 2194S |
| Autocamtide | Sigma-Aldrich | Cat# A4308; CAS: 167114–91–2 |
| IGEPAL | Sigma-Aldrich | Cat# NP40S |
| Triton X–100 | Sigma-Aldrich | Cat# T9284 |
| Paraformaldehyde | ThermoFisher Scientific | Cat# 50980487 |
| Fluoromount-G | Southern Biotech | Cat# 0100–01 |
| ATP | Sigma-Aldrich | Cat# A7699 |
| DNaseI | QIAGEN | Cat# 79254 |
| DMSO | ThermoFisher Scientific | Cat# 25–950–CQC |
| Opti-mem | ThermoFisher Scientific | Cat# 31985070 |
| lysozyme | Sigma-Aldrich | Cat# L6876 |
| 2-mercaptoethanol | Bio-Rad | Cat# 1610710 |
| Nitric Acid | ThermoFisher Scientific | Cat# A200212 |
| NaCl | Sigma-Aldrich | Cat# S9625 |
| KCl | Sigma-Aldrich | Cat# P9541 |
| IPTG | Sigma-Aldrich | Cat# I5502 |
| Tris base | Sigma-Aldrich | Cat# T1503 |
| PMSF | Sigma-Aldrich | Cat# P7626; CAS: 329–98–6 |
| DTT | Sigma-Aldrich | Cat# D5545 |
| LB broth | Sigma-Aldrich | Cat# L3022 |
| LB plates | Quality Biologicals | Cat# 340–107–231 |
| Purified active PKCα | Millipore | Cat# 14–484 |
| Purified active PKCε | Millipore | Cat# 14–518 |
| PKC lipid activator | Millipore | Cat# 20–133 |
| Ephexin5 p107/p109 peptide: PSPVSRRpSIpSPEPAPC | This study | N/A |
| Ephexin5 107/109 peptide: PSPVSRRSISPEPAPC | This study | N/A |
| Critical Commercial Assays | ||
| RhoA activation assay kit | Millipore | Cat# 17–294 |
| QuickChange II XL site directed | Agilent | Cat# 200523 200521 |
| Bio-Rad protein assay kit | Bio-Rad | Cat# 5000001 |
| Experimental Models: Cell Lines | ||
| HEK293 | ATCC | CRL–1573 |
| Neuro2a | ATCC | CCL-131 |
| Experimental Models: Organisms/Strains | ||
| C57BL/6 | Charles River | RRID: IMSR_CRL:27 |
| PKCα, PKCβ | D. Fioravante (UC Davis) | (Chu et al., 2014) |
| PKCγ | D. Fioravante (UC Davis) | (Chu et al., 2014) |
| PKCε | R. Messing (U. Texas Austin) | (Khasar et al., 1999) |
| Ephexin5 null | M. Greenberg (Harvard) | (Margolis et al., 2010) |
| Oligonucleotides | ||
| Ephexin5 S107A S109A quickchange primer: forward: ccagtgtcccggcgcgccatcgccccagaaccagctccc | This paper | N/A |
| Ephexin5 S107A S109A quickchange primer: reverse: gggagctggttctggggcgatggcgcgccgggacactgg | This paper | N/A |
| Ephexin5 S107E S109E quickchange primer: forward: ccagtgtcccggcgcgaaatcgaaccagaaccagctccc | This paper | N/A |
| Ephexin5 S107E S109E quickchange primer: reverse: gggagctggttctggttcgatttcgcgccgggacactgg | This paper | N/A |
| Recombinant DNA | ||
| FUGW vector | H. Goldschmidt and D. Raben | (Goldschmidt et al., 2016) |
| VSVG plasmid | H. Goldschmidt and D. Raben | (Goldschmidt et al., 2016) |
| D8.9 plasmid | H. Goldschmidt and D. Raben | (Goldschmidt et al., 2016) |
| pcHACE-PKCα-HA | (Soh and Weinstein, 2003) | Addgene Plasmid # 21232 |
| pcHACE-PKCβ-HA | (Soh and Weinstein, 2003) | Addgene Plasmid # 16378 |
| pcHACE-PKCγ-HA | (Soh and Weinstein, 2003) | Addgene Plasmid # 21236 |
| pcHACE-PKCε-HA | (Soh and Weinstein, 2003) | Addgene Plasmid # 21240 |
| pcHACE-PKCε-K437R-HA | (Soh and Weinstein, 2003) | Addgene Plasmid # 21243 |
| pcDNA3-GFP-RhoA-WT | (Subauste et al., 2000) | Addgene Plasmid # 12965 |
| pcDNA3-GFP-RhoA-Q63L | (Subauste et al., 2000) | Addgene Plasmid # 12968 |
| pcDNA3-GFP-RhoA-T19N | (Subauste et al., 2000) | Addgene Plasmid # 12967 |
| EGFP | M. Greenberg (Harvard) | (Margolis et al., 2010) |
| pEF1-Myc-HisA vector | Thermo Fisher | V92120 |
| pGEX-GST-Ephexin5 - WT | This Study | N/A |
| pEF1-Myc-Ephexin5-HisA - WT | M. Greenberg (Harvard) | (Margolis et al., 2010) |
| pEF1-Myc-Ephexin5-HisA – S107A/S109A | This Study | N/A |
| pEF1-Myc-Ephexin5-HisA – S107E/S109E | This Study | N/A |
| pEF1-Myc-Ephexin5-HisA – S107A | This Study | N/A |
| pEF1-Myc-Ephexin5-HisA –S109A | This Study | N/A |
| pEF1-Myc-Ephexin5-HisA - LQR | M. Greenberg (Harvard) | (Margolis et al., 2010) |
| Software and Algorithms | ||
| Fiji/ImageJ | National Institutes of Health | https://imagej.nih.gov/ij/docs/guide/146-2.html |
| Metamorph | Molecular Devices | N/A |
| NeuronStudio | CNIC | http://research.mssm.edu/cnic/tools–ns.html |
| Other | ||
| 12 mm Glass coverslips | Bellco | Cat# 1943–10012A |
| Glass top TC plates | MatTek | Cat# P24G-1.0–10-F |
| Glutathione Sepharose beads | GE Healthcare | Cat# 17513201 |
Highlights.
PKCs are highly expressed and activated in the developing brain
PKCε specifically inhibits dendritic spine formation in developing hippocampal neurons
The early-expressed RhoA GEF Ephexin5 is required for PKCε to restrict spine number
Ephexin5-mediated regulation of RhoA and spine number requires serines targeted by PKCε
ACKNOWLEDGMENTS
We thank Dr. Alex Kolodkin, Dr. Daniel Raben, and Dr. Peter Devreotes for reagents, technical assistance, and advice on the project; additional thanks to Dr. Diasynou Fioravante and Dr. Robert Messing for PKC isoform knockout mice and Dr. Michael Greenberg for Ephexin5-knockout mice and antiEphexin5 and anti-p107/109 antibodies. Finally, we thank members of the Margolis lab for thoughtful discussions and advice. This material is based upon work supported by National Institute of Mental Health grant 5R01MH102364–02 (S.S.M.), NIH training grant T32GM007445 (T.B.S., J.E.S., E.K.C., T.P.), and the National Science Foundation (NSF) Graduate Research Fellowship under grant numbers 1232825 and 1746891 (J.E.S.).
Footnotes
DECLARATION OF INTERESTS
The authors declare no competing interests.
SUPPLEMENTAL INFORMATION
Supplemental Information includes seven figures and two tables and can be found with this article online at https://doi.org/10.1016/j.celrep.2018.11.005
REFERENCES
- Aghazadeh B, Lowry WE, Huang XY, and Rosen MK (2000). Structural basis for relief of autoinhibition of the Dbl homology domain of proto-oncogene Vav by tyrosine phosphorylation. Cell 102, 625–633. [DOI] [PubMed] [Google Scholar]
- Arey RN, Stein GM, Kaletsky R, Kauffman A, and Murphy CT (2018). Activation of Galphaq signaling enhances memory consolidation and slows cognitive decline. Neuron 98, 562–574.e5. [DOI] [PMC free article] [PubMed] [Google Scholar]
- Baier G, Telford D, Giampa L, Coggeshall KM, Baier-Bitterlich G, Isakov N, and Altman A (1993). Molecular cloning and characterization of PKC theta, a novel member of the protein kinase C (PKC) gene family expressed predominantly in hematopoietic cells. J. Biol. Chem 268, 4997–5004. [PubMed] [Google Scholar]
- Bennett MK, Erondu NE, and Kennedy MB (1983). Purification and characterization of a calmodulin-dependent protein kinase that is highly concentrated in brain. J. Biol. Chem 258, 12735–12744. [PubMed] [Google Scholar]
- Blalock EM, Geddes JW, Chen KC, Porter NM, Markesbery WR, and Landfield PW (2004). Incipient Alzheimer’s disease: microarray correlation analyses reveal major transcriptional and tumor suppressor responses. Proc. Natl. Acad. Sci. U S A 101, 2173–2178. [DOI] [PMC free article] [PubMed] [Google Scholar]
- Boehm J, Kang MG, Johnson RC, Esteban J, Huganir RL, and Malinow R (2006). Synaptic incorporation of AMPA receptors during LTP is controlled by a PKC phosphorylation site on GluR1. Neuron 51, 213–225. [DOI] [PubMed] [Google Scholar]
- Boyer C, Schikorski T, and Stevens CF (1998). Comparison of hippocampal dendritic spines in culture and in brain. J. Neurosci 18, 5294–5300. [DOI] [PMC free article] [PubMed] [Google Scholar]
- Chu Y, Fioravante D, Leitges M, and Regehr WG (2014). Calcium-dependent PKC isoforms have specialized roles in short-term synaptic plasticity. Neuron 82, 859–871. [DOI] [PMC free article] [PubMed] [Google Scholar]
- Doble BW, Ping P, and Kardami E (2000). The epsilon subtype of protein kinase C is required for cardiomyocyte connexin-43 phosphorylation. Circ. Res 86, 293–301. [DOI] [PubMed] [Google Scholar]
- Durgan J, Cameron AJ, Saurin AT, Hanrahan S, Totty N, Messing RO, and Parker PJ (2008). The identification and characterization of novel PKCepsilon phosphorylation sites provide evidence for functional cross-talk within the PKC superfamily. Biochem. J 411, 319–331. [DOI] [PubMed] [Google Scholar]
- Dyer AH, Vahdatpour C, Sanfeliu A, and Tropea D (2016). The role of insulin-like growth factor 1 (IGF-1) in brain development, maturation and neuroplasticity. Neuroscience 325, 89–99. [DOI] [PubMed] [Google Scholar]
- Fu WY, Chen Y, Sahin M, Zhao XS, Shi L, Bikoff JB, Lai KO, Yung WH, Fu AK, Greenberg ME, and Ip NY (2007). Cdk5 regulates EphA4mediated dendritic spine retraction through an ephexin1-dependent mechanism. Nat. Neurosci 10, 67–76. [DOI] [PubMed] [Google Scholar]
- Fujimoto K, Ohta K, Kangawa K, Kikkawa U, Ogino S, and Fukui H (1999). Identification of protein kinase C phosphorylation sites involved in phorbol ester-induced desensitization of the histamine H1 receptor. Mol. Pharmacol 55, 735–742. [PubMed] [Google Scholar]
- Giagtzoglou N, Ly CV, and Bellen HJ (2009). Cell adhesion, the backbone of the synapse: “vertebrate” and “invertebrate” perspectives. Cold Spring Harb. Perspect. Biol 1, a003079. [DOI] [PMC free article] [PubMed] [Google Scholar]
- Goldschmidt HL, Tu-Sekine B, Volk L, Anggono V, Huganir RL, and Raben DM (2016). DGKq catalytic activity is required for efficient recycling of presynaptic vesicles at excitatory synapses. Cell Rep. 14, 200–207. [DOI] [PMC free article] [PubMed] [Google Scholar]
- Gray EG (1959). Axo-somatic and axo-dendritic synapses of the cerebral cortex: an electron microscope study. J. Anat 93, 420–433. [PMC free article] [PubMed] [Google Scholar]
- Gruber T, Fresser F, Jenny M, Uberall F, Leitges M, and Baier G (2008). PKCtheta cooperates with atypical PKCzeta and PKCiota in NF-kappaB transactivation of T lymphocytes. Mol. Immunol 45, 117–126. [DOI] [PubMed] [Google Scholar]
- Harris KM, Jensen FE, and Tsao B (1992). Three-dimensional structure of dendritic spines and synapses in rat hippocampus (CA1) at postnatal day 15 and adult ages: implications for the maturation of synaptic physiology and long-term potentiation. J. Neurosci 12, 2685–2705. [DOI] [PMC free article] [PubMed] [Google Scholar]
- Hawk JD, Calvo AC, Liu P, Almoril-Porras A, Aljobeh A, TorruellaSuarez ML, Ren I, Cook N, Greenwood J, Luo L, et al. (2018). Integration of plasticity mechanisms within a single sensory neuron of C. elegans actuates a memory. Neuron 97, 356–367.e4. [DOI] [PMC free article] [PubMed] [Google Scholar]
- Hongpaisan J, Sun MK, and Alkon DL (2011). PKC ε activation prevents synaptic loss, Ab elevation, and cognitive deficits in Alzheimer’s disease transgenic mice. J. Neurosci 31, 630–643. [DOI] [PMC free article] [PubMed] [Google Scholar]
- Huttlin EL, Jedrychowski MP, Elias JE, Goswami T, Rad R, Beausoleil SA, Villén J, Haas W, Sowa ME, and Gygi SP (2010). A tissue-specific atlas of mouse protein phosphorylation and expression. Cell 143, 1174–1189. [DOI] [PMC free article] [PubMed] [Google Scholar]
- Kang DS, Yang YR, Lee C, Kim S, Ryu SH, and Suh PG (2016). Roles of phosphoinositide-specific phospholipase Cgamma1 in brain development. Adv. Biol. Regul 60, 167–173. [DOI] [PubMed] [Google Scholar]
- Kang MG, Guo Y, and Huganir RL (2009). AMPA receptor and GEF-H1/ Lfc complex regulates dendritic spine development through RhoA signaling cascade. Proc. Natl. Acad. Sci. U S A 106, 3549–3554. [DOI] [PMC free article] [PubMed] [Google Scholar]
- Khasar SG, Lin YH, Martin A, Dadgar J, McMahon T, Wang D, Hundle B, Aley KO, Isenberg W, McCarter G, et al. (1999). A novel nociceptor signaling pathway revealed in protein kinase C epsilon mutant mice. Neuron 24, 253–260. [DOI] [PMC free article] [PubMed] [Google Scholar]
- Kikkawa U, Takai Y, Minakuchi R, Inohara S, and Nishizuka Y (1982). Calcium-activated, phospholipid-dependent protein kinase from rat brain. Subcellular distribution, purification, and properties. J. Biol. Chem 257, 13341–13348. [PubMed] [Google Scholar]
- Kishimoto A, Kikkawa U, Ogita K, Shearman MS, and Nishizuka Y (1989). The protein kinase C family in the brain: heterogeneity and its implications. Ann. N Y Acad. Sci 568, 181–186. [DOI] [PubMed] [Google Scholar]
- Kitazawa A, Kubo K, Hayashi K, Matsunaga Y, Ishii K, and Nakajima K (2014). Hippocampal pyramidal neurons switch from a multipolar migration mode to a novel “climbing” migration mode during development. J. Neurosci 34, 1115–1126. [DOI] [PMC free article] [PubMed] [Google Scholar]
- Lin DT, Makino Y, Sharma K, Hayashi T, Neve R, Takamiya K, and Huganir RL (2009). Regulation of AMPA receptor extrasynaptic insertion by 4.1N, phosphorylation and palmitoylation. Nat. Neurosci 12, 879–887. [DOI] [PMC free article] [PubMed] [Google Scholar]
- Lohmann C, and Kessels HW (2014). The developmental stages of synaptic plasticity. J. Physiol 592, 13–31. [DOI] [PMC free article] [PubMed] [Google Scholar]
- Lois C, Hong EJ, Pease S, Brown EJ, and Baltimore D (2002). Germline transmission and tissue-specific expression of transgenes delivered by lentiviral vectors. Science 295, 868–872. [DOI] [PubMed] [Google Scholar]
- Lu Z, Liu D, Hornia A, Devonish W, Pagano M, and Foster DA (1998). Activation of protein kinase C triggers its ubiquitination and degradation. Mol.Cell. Biol 18, 839–845. [DOI] [PMC free article] [PubMed] [Google Scholar]
- Lutz-Nicoladoni C, Thuille N, Wachowicz K, Gruber T, Leitges M, and Baier G (2013). PKCa and PKCb cooperate functionally in CD3-induced de novo IL-2 mRNA transcription. Immunol. Lett 151, 31–38. [DOI] [PMC free article] [PubMed] [Google Scholar]
- Malenka RC, Madison DV, and Nicoll RA (1986). Potentiation of synaptic transmission in the hippocampus by phorbol esters. Nature 321, 175–177. [DOI] [PubMed] [Google Scholar]
- Malinow R, Madison DV, and Tsien RW (1988). Persistent protein kinase activity underlying long-term potentiation. Nature 335, 820–824. [DOI] [PubMed] [Google Scholar]
- Margolis SS, Salogiannis J, Lipton DM, Mandel-Brehm C, Wills ZP, Mardinly AR, Hu L, Greer PL, Bikoff JB, Ho HY, et al. (2010). EphBmediated degradation of the RhoA GEF Ephexin5 relieves a developmental brake on excitatory synapse formation. Cell 143, 442–455. [DOI] [PMC free article] [PubMed] [Google Scholar]
- Meiri D, Greeve MA, Brunet A, Finan D, Wells CD, LaRose J, and Rottapel R (2009). Modulation of Rho guanine exchange factor Lfc activity by protein kinase A-mediated phosphorylation. Mol. Cell. Biol 29, 5963–5973. [DOI] [PMC free article] [PubMed] [Google Scholar]
- Nelson TJ, and Alkon DL (2009). Neuroprotective versus tumorigenic protein kinase C activators. Trends Biochem. Sci 34, 136–145. [DOI] [PubMed] [Google Scholar]
- Nelson TJ, Sun MK, Lim C, Sen A, Khan T, Chirila FV, and Alkon DL (2017). Bryostatin effects on cognitive function and PKCε in Alzheimer’s disease phase IIa and expanded access trials. J. Alzheimers Dis 58, 521–535. [DOI] [PMC free article] [PubMed] [Google Scholar]
- Newton AC (2010). Protein kinase C: poised to signal. Am. J. Physiol. Endocrinol. Metab 298, E395–E402. [DOI] [PMC free article] [PubMed] [Google Scholar]
- Newton PM, and Messing RO (2010). The substrates and binding partners of protein kinase Cepsilon. Biochem. J 427, 189–196. [DOI] [PMC free article] [PubMed] [Google Scholar]
- Olds JL, Anderson ML, McPhie DL, Staten LD, and Alkon DL (1989). Imaging of memory-specific changes in the distribution of protein kinase C in the hippocampus. Science 245, 866–869. [DOI] [PubMed] [Google Scholar]
- Park H, and Poo MM (2013). Neurotrophin regulation of neural circuit development and function. Nat. Rev. Neurosci 14, 7–23. [DOI] [PubMed] [Google Scholar]
- Reid T, Furuyashiki T, Ishizaki T, Watanabe G, Watanabe N, Fujisawa K, Morii N, Madaule P, and Narumiya S (1996). Rhotekin, a new putative target for Rho bearing homology to a serine/threonine kinase, PKN, and rhophilin in the rho-binding domain. J. Biol. Chem 271, 13556–13560. [DOI] [PubMed] [Google Scholar]
- Rodriguez A, Ehlenberger DB, Dickstein DL, Hof PR, and Wearne SL (2008). Automated three-dimensional detection and shape classification of dendritic spines from fluorescence microscopy images. PLoS ONE 3, e1997. [DOI] [PMC free article] [PubMed] [Google Scholar]
- Sacktor TC, Osten P, Valsamis H, Jiang X, Naik MU, and Sublette E (1993). Persistent activation of the zeta isoform of protein kinase C in the maintenance of long-term potentiation. Proc. Natl. Acad. Sci. U S A 90, 8342–8346. [DOI] [PMC free article] [PubMed] [Google Scholar]
- Schrott LM, Jackson K, Yi P, Dietz F, Johnson GS, Basting TF, Purdum G, Tyler T, Rios JD, Castor TP, and Alexander JS (2015). Acute oral bryostatin-1 administration improves learning deficits in the APP/PS1 transgenic mouse model of Alzheimer’s disease. Curr. Alzheimer Res 12, 22–31. [DOI] [PubMed] [Google Scholar]
- Seidl S, Braun U, Roos N, Li S, Lu€dtke TH, Kispert A, and Leitges M (2013). Phenotypical analysis of atypical PKCs in vivo function display a compensatory system at mouse embryonic day 7.5. PLoS ONE 8, e62756. [DOI] [PMC free article] [PubMed] [Google Scholar]
- Sell GL, Schaffer TB, and Margolis SS (2017). Reducing expression of synapse-restricting protein Ephexin5 ameliorates Alzheimer’s-like impairment in mice. J. Clin. Invest 127, 1646–1650. [DOI] [PMC free article] [PubMed] [Google Scholar]
- Sen A, Hongpaisan J, Wang D, Nelson TJ, and Alkon DL (2016). Protein kinase CE (PKCE) promotes synaptogenesis through membrane accumulation of the postsynaptic density protein PSD-95. J. Biol. Chem 291, 16462–16476. [DOI] [PMC free article] [PubMed] [Google Scholar]
- Shirai Y, Kouzuki T, Kakefuda K, Moriguchi S, Oyagi A, Horie K, Morita SY, Shimazawa M, Fukunaga K, Takeda J, et al. (2010). Essential role of neuron-enriched diacylglycerol kinase (DGK), DGKbeta in neurite spine formation, contributing to cognitive function. PLoS One 5, e11602.journalShirai et al., 2010. [DOI] [PMC free article] [PubMed] [Google Scholar]
- Sholl DA (1953). Dendritic organization in the neurons of the visual and motor cortices of the cat. J. Anat 87, 387–406. [PMC free article] [PubMed] [Google Scholar]
- Soh JW, and Weinstein IB (2003). Roles of specific isoforms of protein kinase C in the transcriptional control of cyclin D1 and related genes. J. Biol. Chem 278, 34709–34716. [DOI] [PubMed] [Google Scholar]
- Subauste MC, Von Herrath M, Benard V, Chamberlain CE, Chuang TH, Chu K, Bokoch GM, and Hahn KM (2000). Rho family proteins modulate rapid apoptosis induced by cytotoxic T lymphocytes and Fas. J. Biol. Chem 275, 9725–9733. [DOI] [PubMed] [Google Scholar]
- Szallasi Z, Smith CB, Pettit GR, and Blumberg PM (1994). Differential regulation of protein kinase C isozymes by bryostatin 1 and phorbol 12-myristate 13-acetate in NIH 3T3 fibroblasts. J. Biol. Chem 269, 2118–2124. [PubMed] [Google Scholar]
- Tashiro A, and Yuste R (2004). Regulation of dendritic spine motility and stability by Rac1 and Rho kinase: evidence for two forms of spine motility. Mol. Cell. Neurosci 26, 429–440. [DOI] [PubMed] [Google Scholar]
- Tomita K, Kubo K, Ishii K, and Nakajima K (2011). Disrupted-in-Schizophrenia-1 (Disc1) is necessary for migration of the pyramidal neurons during mouse hippocampal development. Hum. Mol. Genet 20, 2834–2845. [DOI] [PubMed] [Google Scholar]
- Tsokas P, Hsieh C, Yao Y, Lesburgue` res E, Wallace EJC, Tcherepanov A, Jothianandan D, Hartley BR, Pan L, Rivard B, et al. (2016). Compensation for PKMz in long-term potentiation and spatial long-term memory in mutant mice. eLife 5, 5. [DOI] [PMC free article] [PubMed] [Google Scholar]
- Volk LJ, Bachman JL, Johnson R, Yu Y, and Huganir RL (2013). PKM-z is not required for hippocampal synaptic plasticity, learning and memory. Nature 493, 420–423. [DOI] [PMC free article] [PubMed] [Google Scholar]
- Wearne SL, Rodriguez A, Ehlenberger DB, Rocher AB, Henderson SC, and Hof PR (2005). New techniques for imaging, digitization and analysis of three-dimensional neural morphology on multiple scales. Neuroscience 136, 661–680. [DOI] [PubMed] [Google Scholar]
- Wetsel WC, Khan WA, Merchenthaler I, Rivera H, Halpern AE, Phung HM, Negro-Vilar A, and Hannun YA (1992). Tissue and cellular distribution of the extended family of protein kinase C isoenzymes. J. Cell Biol 117, 121–133. [DOI] [PMC free article] [PubMed] [Google Scholar]
- Wills ZP, Mandel-Brehm C, Mardinly AR, McCord AE, Giger RJ, and Greenberg ME (2012). The nogo receptor family restricts synapse number in the developing hippocampus. Neuron 73, 466–481. [DOI] [PMC free article] [PubMed] [Google Scholar]
- Zang R, Mu€ller HJ, Kielbassa K, Marks F, and Gschwendt M (1994). Partial purification of a type eta protein kinase C from murine brain: separation from other protein kinase C isoenzymes and characterization. Biochem. J 304, 641–647. [DOI] [PMC free article] [PubMed] [Google Scholar]
- Zisopoulou S, Asimaki O, Leondaritis G, Vasilaki A, Sakellaridis N, Pitsikas N, and Mangoura D (2013). PKC-epsilon activation is required for recognition memory in the rat. Behav. Brain Res 253, 280–289. [DOI] [PubMed] [Google Scholar]
Associated Data
This section collects any data citations, data availability statements, or supplementary materials included in this article.
Supplementary Materials
Data Availability Statement
All reagents and protocols used in this study are available for sharing upon reasonable request to the authors.