

Abstract
Study Objectives:
Apnea-hypopnea index (AHI) is the main polysomnographic measure to diagnose obstructive sleep apnea (OSA). We aimed to evaluate the effect of three standard hypopnea definitions on the prevalence of OSA and its association with cardiometabolic outcomes in the general population.
Methods:
We analyzed data from the HypnoLaus study (Lausanne, Switzerland), in which 2,162 participants (51% women, 57 ± 19 years) underwent in-home full polysomnography. AHI was calculated using three hypopnea definitions: AASM1999 (≥ 50% decrease in airflow or lower airflow reduction associated with oxygen desaturation ≥ 3% or an arousal), AASM2007 (≥ 30% airflow reduction associated with ≥ 4% oxygen desaturation), and AASM2012 (≥ 30% airflow reduction associated with ≥ 3% oxygen desaturation or an arousal). Participants underwent clinical assessment for hypertension, diabetes, and metabolic syndrome.
Results:
Median AHI of AASM1999, AASM2007 and AASM2012 criteria were 10.9, 4.4, and 10.1 events/h, respectively. OSA prevalence defined as AHI ≥ 5, ≥ 15, and ≥ 30 events/h was 74.5%, 39.3%, and 16.3% using AASM1999; 46.9%, 18.8%, and 6.8% using AASM2007; and 72.2%, 36.6%, and 14.9% using AASM2012. Different AHI thresholds derived from AASM1999, AASM2007, and AASM2012 criteria, respectively, were associated with hypertension (11.5, 4.8, 10.7 events/h), diabetes (15.7, 7.1, 14.4 events/h), and metabolic syndrome (12.8, 5.5, 11.8 events/h).
Conclusions:
Hypopnea definition has a major effect on AHI and on OSA prevalence in the general population and, hence, important implications for public health policies. There is a twofold difference in the threshold above which an association with diabetes, hypertension, and metabolic syndrome is observed using AASM2007 compared to AASM1999 or AASM2012 criteria.
Citation:
Hirotsu C, Haba-Rubio J, Andries D, Tobback N, Marques-Vidal P, Vollenweider P, Waeber G, Heinzer R. Effect of three hypopnea scoring criteria on OSA prevalence and associated comorbidities in the general population. J Clin Sleep Med. 2019;15(2):183–194.
Keywords: general population, hypopnea, methodology, obstructive sleep apnea, polysomnography
BRIEF SUMMARY
Current Knowledge/Study Rationale: The American Academy of Sleep Medicine's rules for scoring hypopneas have changed thrice over the past 20 years, but their clinical effects on the prevalence of obstructive sleep apnea and their association with hypertension, diabetes, and metabolic syndrome in the general population are unknown.
Study Impact: Our findings indicate that the method used for scoring hypopneas significantly influences the prevalence of obstructive sleep apnea and its association with cardiometabolic outcomes. We could provide predictive equations to translate the differences in apnea-hypopnea indexes within three recommended criteria of the American Academy of Sleep Medicine in a general population-based sample. Further, this study highlights the need for standardization of the scoring method to allow compatibility among epidemiological studies.
INTRODUCTION
Obstructive sleep apnea (OSA) is characterized by recurrent partial (hypopneas) or total (apneas) episodes of upper airway obstruction during sleep,1 and has been widely recognized as an important and treatable risk factor for cardiovascular and metabolic conditions.2,3 Polysomnography (PSG) is considered the gold standard for identifying individuals with OSA. Among the several parameters measured by PSG, the apneahypopnea index (AHI), which comprises the average number of apneas and hypopneas per hour of sleep, is the main metric for diagnosing OSA, as well as for assessing the disease severity and responsiveness to the treatment. A recent systematic review showed that, in general populations, OSA prevalence as AHI ≥ 5 events/h varies considerably among studies (9% to 38%).4 Higher estimates were also observed over time in the most recent epidemiological studies.5 Among the possible explanations for these findings, ethnical composition, equipment-related issues, and changes in respiratory events definition might have an important role.
Indeed, several definitions of hypopnea have been used in research and the clinical setting, leading to large interlaboratory variations in AHI depending on the definition used.6–10 These differences relate to the degree of airflow reduction, the amplitude of oxygen desaturation, and the association with electroencephalographic arousal required to define a hypopnea. Because OSA diagnosis and treatment decision are largely based on AHI, the definition of hypopnea may have a direct effect on OSA prevalence estimates and the patients' management. Thus, the aim of our study was to evaluate the effect of three hypopnea definitions on the prevalence and severity of OSA in a middle-aged general population sample. We compared three standard definitions for identifying hypopneas: the 1999 American Academy of Sleep Medicine (AASM) criteria (also known as Chicago criteria),11 and the recommended definitions from The AASM Manual for the Scoring of Sleep and Associated Events: Rules, Terminology and Technical Specifications (AASM Scoring Manual) in 200712 and 2012.13 Next, we sought to establish the AHI thresholds that could predict the presence of hypertension, diabetes, and metabolic syndrome as well as to compare the association between OSA severity and these cardiometabolic outcomes using each hypopnea definition.
METHODS
Population Sample
This is a cross-sectional study that analyzed data from HypnoLaus, a population-based sleep cohort study (Lausanne, Switzerland) performed between September 1, 2009 and June 30, 2013. HypnoLaus participants were recruited among individuals from the CoLaus/PsyCoLaus cohort.14 CoLaus/PsyCo-Laus is a population-based cohort of 6,734 participants (52.5% women) aged 35 to 75 years, identified from a random sample of all age-eligible adults living in the city of Lausanne, Switzerland (117,161 habitants). The CoLaus/PsyCoLaus study was conducted to assess the prevalence of cardiovascular risk factors and to identify new determinants of these risk factors and their association with mental disorders.15 For the HypnoLaus nested study, participants of the CoLaus/PsyCoLaus study were invited to answer sleep questionnaires regarding their sleep habits and potential sleep disorders, and the first consecutive 3,043 were contacted to have a full sleep study at home. Of these, 71% (n = 2,168) accepted the invitation and underwent PSG, among which 3% (n = 60) had technical problems. Of these, 6 participants declined to undergo a second PSG, and 54 participants agreed.16 Therefore, 2,162 PSG recordings composed the HypnoLaus cohort and were included in this study. The Institutional Review Board in Lausanne approved the study, and all participants gave their written informed consent.
Clinical Data Collection
Participants from HypnoLaus study were invited to attend the outpatient clinic at the University Hospital of Lausanne (Centre Hospitalier Universitaire Vaudois [CHUV], Lausanne, Switzerland). After an overnight fasting they were also invited for questionnaires completion, clinical assessment, and blood samples collection. Body weight and height were measured using a calibrated scale and a vertical stadiometer, respectively (Seca, Hamburg, Germany). Body mass index (BMI) was calculated as body mass in kg divided by the square of the participant's height in meters. Waist circumference (at the level of the umbilicus) was measured to within 0.5 cm with plastic tape. Systolic blood pressure (SBP) and diastolic blood pressure (DBP) were evaluated in triplicate on the left arm at 5-minute intervals with the participant seated and resting for at least 10 minutes using a calibrated automated oscillometric sphygmo-manometer (Omron HEM-907, Matsusaka, Japan).17 Overnight fasting blood samples were taken of each participant. Glucose, total cholesterol, high-density lipoprotein (HDL) cholesterol, and triglycerides were quantified by colorimetric assays as previously described.14 These assays were performed on fresh blood samples by the CHUV Clinical Laboratory (Lausanne, Switzerland).
Polysomnography
In-home overnight full PSG was performed, using a digital portable sleep-wake recording system (EMBLA Titanium, Embla Systems, Inc, Broomfield, Colorado, United States). A trained technician hooked up the participant in the CIRS facility (Center for Investigation and Research in Sleep, CHUV, Lausanne, Switzerland). The electrodes and recorder were installed at the laboratory and recordings were done in the normal home environment. PSG measurements included: electroencephalograms (EEG) from frontal, central, and occipital areas (F3-M2, C3-M2, O1-M2, F4-M1, C4-M1, O2-M1) according to the international 10/20 electrode configuration system, right and left electrooculograms, mental-submental electromyogram (EMG), right and left leg EMG, thoracic and abdominal breathing movements by respiratory inductance plethysmography, respiratory airflow by a nasal-cannula connected to a pressure transducer, oxygen saturation (SpO2) by pulse oximetry, heart rate by electrocardiogram (ECG), and body position.
Scoring of PSG
PSG test results were scored using Somnologica software (Embla Systems, Inc) by two experienced scorers (DA, NT), with an interagreement concordance greater than 90%. Sleep, arousal, and movements during sleep were scored based on the 2007 AASM Scoring Manual.12 Concerning respiratory events, an apnea was defined by a complete or almost complete (> 90%) cessation of airflow (measured by nasal pressure) lasting 10 seconds or longer. Hypopneas were initially scored based on the Chicago criteria (AASM1999), being defined by criterion 1 or 2, plus criterion 3:
A clear decrease (> 50%) of airflow amplitude from the baseline. Baseline was defined as the mean amplitude of stable breathing and oxygenation in the 2 minutes preceding onset of the event (in individuals who have a stable breathing pattern during sleep) or the mean amplitude of the three largest breaths in the two minutes preceding onset of the event (in individuals without a stable breathing pattern).
A clear reduction of airflow amplitude, not reaching the aforementioned criterion but associated with either an oxygen desaturation of ≥ 3% or an arousal. From an operational standpoint, a discernible reduction in airflow was considered a > 30% reduction in the airflow signal.
The event lasts 10 seconds or longer.
An AHI for each individual was calculated, consisting of the number of apneas and hypopneas per hour of sleep. Each recording was reviewed for validation of the respiratory scoring by a single investigator (JHR).
Because both recommended 2007 and 2012 AASM criteria represent a subset of Chicago criteria's events, we derived the other two AHI definitions from the first scoring. For the recommended 2007 AASM Scoring Manual criteria (AASM2007), we removed hypopneas that did not fulfill the stricter AASM hypopnea definition, that is, hypopneas that were not associated with ≥ 4% oxygen desaturation. For the recommended 2012 AASM Scoring Manual criteria (AASM2012), we removed hypopneas that were not associated with either an arousal or a ≥ 3% oxygen desaturation (Table S1).
OSA severity was classified according to standard criteria as mild (AHI 5 to < 15 events/h), moderate (AHI 15 to < 30 events/h), and severe (AHI ≥ 30 events/h). AHI < 5 events/h was defined as no-OSA.
Outcomes
Hypertension was defined as a SBP ≥ 140 mmHg and/or DBP ≥ 90 mmHg, and/or use of antihypertensive medication. Diabetes was considered positive when fasting plasma glucose levels were ≥ 7.0 mmol/L or there was use of antidiabetic medication.18 Metabolic syndrome was defined according to the Joint Interim Statement,19 as the presence of at least three risk factors among: high blood pressure (SBP ≥ 130 mmHg or DBP ≥ 85 mmHg or use of antihypertensive medication); visceral obesity (waist circumference ≥ 88 cm in women or ≥ 102 cm in men); high triglycerides (≥ 1.7 mmol/L, or use of fibrates or nicotinic acid); low HDL levels (< 1.30 mmol/L in women or < 1.03 mmol/L in men, or use of fibrates or nicotinic acid); and high fasting plasma glucose (≥ 5.6 mmol/L or use of anti-diabetic medication).
Statistical Analysis
We used AHI as the primary variable in this study for analysis of the differences between hypopnea scoring criteria. AHI is displayed according to the median and interquartile range (IQR) values. The differences between the three different AHIs obtained through AASM1999, AASM2007, and AASM2012 criteria were assessed using the Friedman test, with pairwise comparisons performed by Wilcoxon signed-rank test. Bar graphs were constructed to represent the prevalence of OSA using each AASM criteria at AHI thresholds of ≥ 5, ≥ 15, and ≥ 30 events/h. Equivalent thresholds for the three AHIs were estimated using the receiver operating characteristic curve (ROC) with each AHI as the gold standard, giving equal weight to maximize both sensitivity and specificity. Bland-Altman plots representing the mean difference between each pair of AHIs according to each scoring criteria were built to illustrate the agreement between AHIs. Conversion equations between each pair of AHI were established with linear or quadratic regressions, with the latter being employed when appropriate. AHI thresholds significantly associated with the presence of hypertension, diabetes, and metabolic syndrome were estimated by ROC analysis using each hypopnea criteria. Multivariable logistic regression was used for testing the association between OSA severity (mild, moderate, or severe OSA versus no-OSA) and the presence of hypertension, diabetes, and metabolic syndrome using each scoring criteria.
RESULTS
Population Sample and OSA Prevalence
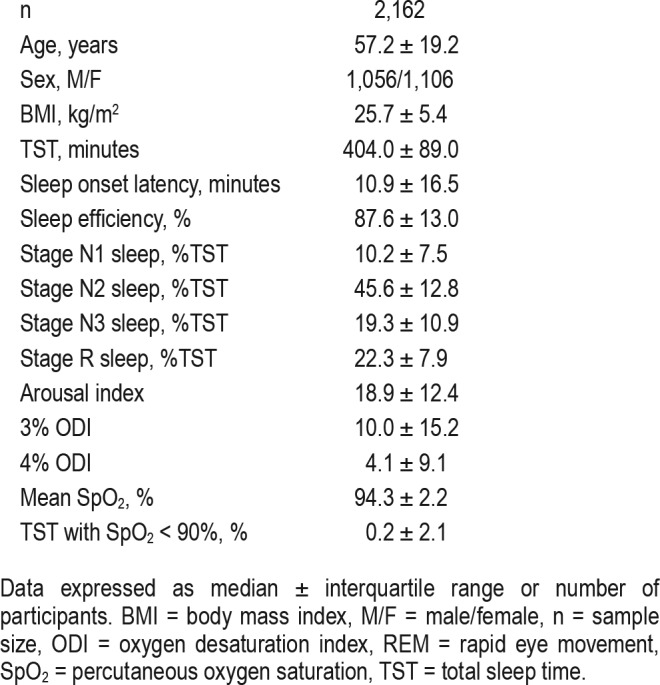
The patient characteristics and PSG results are shown in Table 1. Participants were 57.2 ± 19.2 (median ± IQR) years of age with a BMI of 25.7 ± 5.4 kg/m2. The sample included 51% of women. The average total sleep time was 404.0 ± 89.0 minutes and the sleep efficiency was 87.6 ± 13 %.
Table 1.
Sample characteristics.
The prevalence of OSA in the HypnoLaus cohort based on different AASM scoring criteria is presented in Figure 1. When using AHI thresholds of ≥ 5, ≥ 15, and ≥ 30 events/h, respectively, AASM2007 would provide 34.9%, 48.6%, and 54.2% lower OSA diagnosis rate compared to AASM2012 as well as 37.0%, 52.1%, and 58.1% lower OSA diagnosis rate compared to AASM1999 criteria. Compared to AASM1999 criteria, AASM2012 would provide 3.2%, 6.8%, and 8.5% lower OSA diagnosis rate when using the same AHI thresholds.
Figure 1. Prevalence of obstructive sleep apnea.

Prevalence of apnea-hypopnea index (AHI) thresholds ≥ 5, ≥ 15 and ≥ 30 events/h according to three different recommended American Academy of Sleep Medicine (AASM) criteria (1999, 2007 and 2012) in the whole (A), male (B), and female (C) sample of HypnoLaus cohort (n = 2,162).
AHI Agreement
Table 2 shows median ± IQR of AHI in the HypnoLaus population according to the three scoring criteria. All AHIs were significantly different from each other (P < .001) by Friedman test and post hoc comparisons. The median AHI of AASM2007 and AASM2012 criteria were approximately 40% and 93% of the median AHI of AASM1999. In turn, the median AHI of AASM2007 was approximately 44% of the median AHI of AASM2012. Bland-Altman plots (Figure 2) show the agreement between each pair of AHI according to the different scoring criteria. The variation in the mean AHI difference between each pair of scoring criteria was greater according to the AHI magnitude, except for the comparison between AASM1999 and AASM2012 criteria, which was more stable. The Bland-Altman plots demonstrate a mean increase of 6.4 events/h when comparing AHI definitions between AASM2007 and AASM2012; a mean reduction of 0.9 events/h when comparing AASM2012 and AASM1999; and a mean reduction of 7.3 events/h when comparing AASM2007 and AASM1999 criteria.
Table 2.
Apnea-hypopnea index changes according to hypopnea definitions in the HypnoLaus cohort.

Figure 2. AHI agreement among different hypopnea criteria.
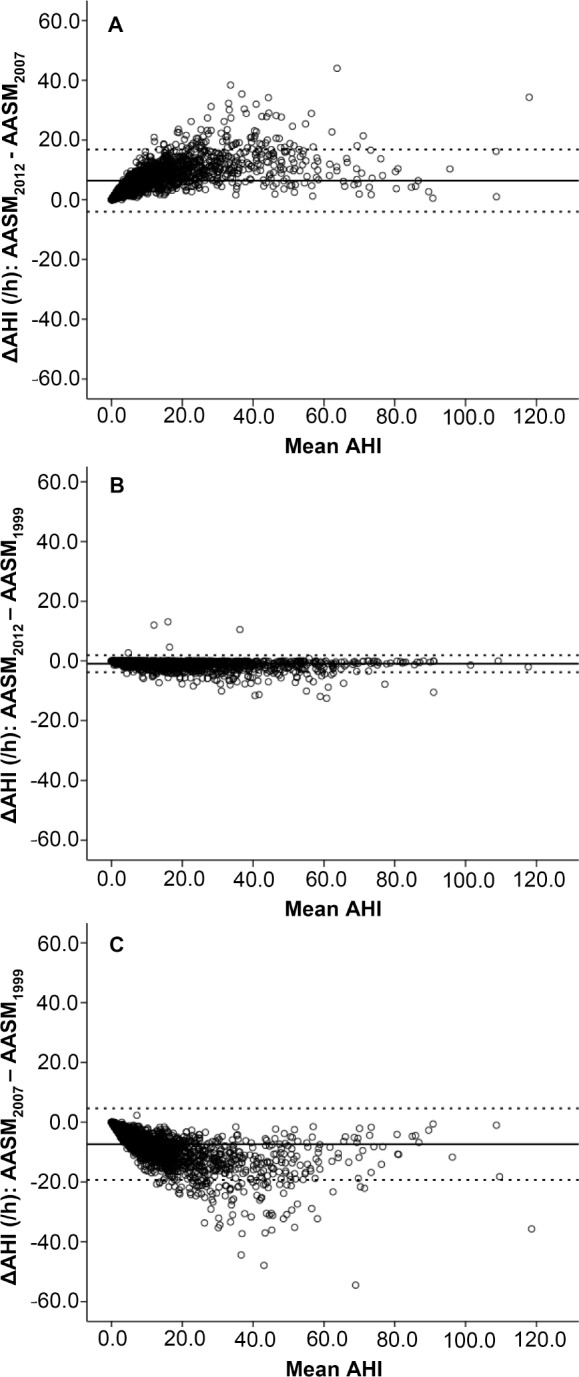
Bland-Altman plots demonstrating the level of agreement for apneahypopnea index (AHI) between American Academy Sleep Medicine (AASM) criteria from 2012 versus 2007, 2012 versus 1999, and 2007 versus 1999, respectively in the HypnoLaus cohort (n = 2,162). The dashed line represents the mean difference between the two measured AHIs and the dotted lines represent the mean difference ± 1.96 standard deviation (SD). The x-axis presents the mean of the two AHIs and the y-axis presents the difference (Δ) between the two measurements.
Equivalent AHIs and Prediction Equations
Table 3 shows the equivalence between the scoring criteria for each AHI threshold. For instance, when using AASM2012 according to AHI thresholds of ≥ 5, ≥ 15 and ≥ 30 events/h, to achieve a similar OSA prevalence AASM2007 would have to shift its thresholds down to about 2.0, 6.6, and 14.9 events/h, respectively. In male and female subsamples, the equivalent AHI threshold conversion factors were similar to those of the whole sample.
Table 3.
Equivalent apnea-hypopnea index thresholds for different hypopnea definitions in the HypnoLaus cohort.

Prediction equations to determine the relationship between each pair of AHI are represented in Figure 3. All equations showed a R2 ≥ 0.90 as high collinearity was present between criteria (R = 0.996 for correlation between AASM1999 and AASM2012 derived AHI; R = 0.959 for correlation between AASM2007 and AASM2012 derived AHI; and R = 0.951 for correlation between AASM2007 and AASM1999 derived AHI). In the prediction equations between AASM2007 and AASM2012 as well as AASM2007 and AASM1999, a quadratic regression better fitted the relationship, but with a small increase in R2 of 0.02 compared to the linear regression.
Figure 3. AHI equivalence equations among different hypopnea criteria.

Least squares regression showing the apnea-hypopnea indexes (AHIs) equations of equivalence according to the different recommended American Academy of Sleep Medicine (AASM) criteria in the HypnoLaus cohort (n = 2,162).
Effect of Scoring Criteria on the Association Between OSA and Outcomes
The AHI thresholds significantly associated with hypertension, diabetes, and metabolic syndrome according to the three scoring criteria are represented in Table 4. For all outcomes assessed, the area under the curves (AUCs) as well as the sensitivity and specificity were similar among the three scoring criteria. Overall, higher AHI thresholds emerged from AASM1999, followed by AASM2012. AHI thresholds derived from AASM2007 criteria were approximately half of the respective AHI thresholds derived from both AASM1999 and AASM2012.
Table 4.
Equivalent apnea-hypopnea index thresholds associated with cardiometabolic outcomes according to different hypopnea criteria in the HypnoLaus cohort.

The association between OSA severity and the presence of cardiometabolic outcomes adjusted for age, sex, and BMI is represented in Figure 4. For hypertension, we observed an independent association with severe OSA versus no-OSA using both AASM2012 (odds ratio [OR] = 1.46, 1.01–2.10) and AASM1999 (OR = 1.55, 1.08–2.22), but not AASM 2007 (OR = 1.30, 0.83–2.05). For diabetes, there was significant associations with all OSA groups versus no-OSA in both AASM2012 (mild OSA: OR = 2.13, 1.16–3.91; moderate OSA: OR = 2.31, 1.23–4.32; severe OSA: OR = 2.44, 1.28–4.68) and AASM1999 (mild OSA: OR = 1.92, 1.02–3.62; moderate OSA: OR = 2.34, 1.23–4.43; severe OSA: OR = 2.35, 1.21–4.55). Regarding AASM2007, diabetes was significantly associated with moderate (OR = 1.61, 1.02–2.56) and severe OSA (OR = 1.81, 1.07–3.05), but not with mild OSA (OR = 1.46, 0.99–2.17) when compared to no-OSA.
Figure 4. Association between AHIs and cardiometabolic outcomes.
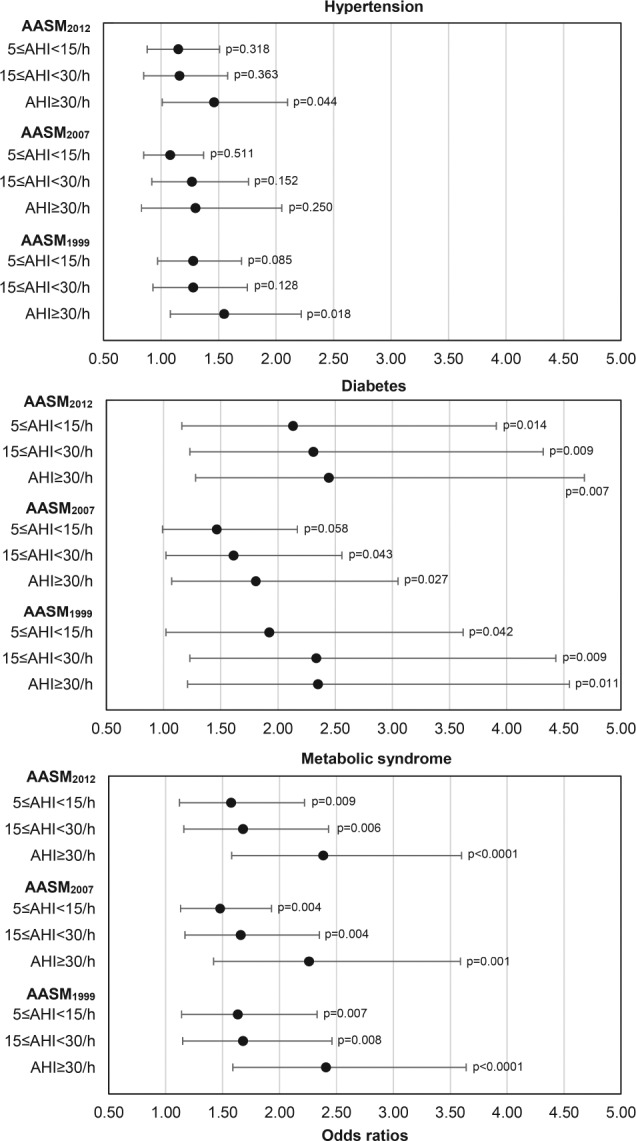
Odds ratio and 95% confidence intervals of the association between apnea-hypopnea index (AHI) categories (AHI 5 to < 15, AHI 15 to < 30, and AHI ≥ 30 events/h compared to AHI < 5 events/h) derived from three different recommended AASM criteria (1999, 2007, and 2012) and the presence of hypertension (n = 2,147), diabetes (n = 2,147) and metabolic syndrome (n = 2,149) in the HypnoLaus cohort. Data analyzed with multivariable logistic regression adjusted for age, body mass index, and sex.
For metabolic syndrome, we found significant associations with all OSA groups versus no-OSA using the three scoring criteria as follows: AASM2012 (mild OSA: OR = 1.58, 1.12–2.22; moderate OSA: OR = 1.68, 1.16–2.43; severe OSA: OR = 2.38, 1.58–3.60); AASM2007 (mild OSA: OR = 1.48, 1.13–1.93; moderate OSA: OR = 1.66, 1.17–2.35; severe OSA: OR = 2.26, 1.42–3.59); AASM1999 (mild OSA: OR = 1.63, 1.14–2.33; moderate OSA: OR = 1.68, 1.15–2.46; severe OSA: OR = 2.41, 1.59–3.64).
There was no association between the different AHI thresh olds and self-reported sleepiness (Epworth Sleepiness Scale) regardless the hypopnea scoring criteria used (Figure S1 and Table S2).
DISCUSSION
To the best of our knowledge, this is the first study that explored the extent to which different hypopnea definitions influence OSA recognition and its association with cardiometabolic outcomes in a general population sample. Using three standard hypopnea definitions with airflow assessed by nasal cannula pressure transducer, we could provide conversion equations between AHIs and equivalent thresholds among the scoring criteria. Our results show up to twofold difference in AHI level above which an association was found with cardiometabolic outcomes between AASM2007 and AASM1999/AASM2012. Last, an independent association between severe OSA and hypertension was only found using AASM1999 or AASM2012 criteria after adjusting for confounders.
To date, all studies that aimed to evaluate the association between OSA and metabolic syndrome,20–24 diabetes,25–31 or hypertension32–40 have used older AASM criteria (AASM1999/ AASM2007) or non-AASM criteria for hypopnea scoring, hampering a reliable comparison among them. In addition to the differences in scoring criteria, important heterogeneity in study design, sample size, outcome definition, and demographic factors may have played a role in the inconsistent results found, as shown in Table 5, Table 6, and Table 7.
Table 5.
Population-based studies on the association between obstructive sleep apnea and metabolic syndrome.

Table 6.
Population-based studies on the association between obstructive sleep apnea and diabetes.

Table 7.
Population-based studies on the association between obstructive sleep apnea and hypertension.

Previous studies have examined the agreement between different approaches to determine AHI, showing significant differences in OSA frequency and mean AHI scores using different hypopnea scoring definitions.41,42 These studies were conducted in small clinical populations using a thermistor to assess airflow. It is also important to highlight that these results may not be relevant any longer considering the technical differences with current clinical practice, as most sleep centers use the nasal-cannula pressure transducer to evaluate hypopneas.
As in our study, Ruehland et al. compared AHIs derived from AASM1999 criteria, AASM2007 recommended criteria, and AASM2007 alternative criteria (≥ 50% airflow reduction associated with 3% desaturation or an arousal).10 They explored the effect of hypopnea definition on the prevalence of OSA in a clinical population using nasal pressure for airflow assessment and demonstrated that using these standard hypopnea definitions leads to marked differences in AHI. For example, the median AHI obtained using the AASM2007 recommended criteria for scoring hypopneas was approximately 30% of the median AHI obtained using the AASM1999 criteria. In our study, this correspondence was a little higher, 40% of the AASM1999 criteria and could be explained by the differences in the source of sample used (clinical versus general population), the sample size (328 versus 2,162), and the more liberal interpretation of “discernible” difference in flow used by the authors.10
Few studies have evaluated the effect of different hypopnea scoring criteria in population-based research samples. Redline et al. analyzed data from the Sleep Heart Health Study.43 They examined the effect of using 11 different criteria for scoring hypopneas on the prevalence of disease and found that the median values of respiratory disturbance index (RDI) varied by approximately tenfold for definitions that used the most liberal criteria for event identification (using amplitude changes without any requirement for associated desaturation or arousal) to the most conservative definition (requiring an associated > 5% desaturation with amplitude changes).
Our findings showing that the AASM2012 recommended criteria results in higher AHI compared to the AASM2007 recommended criteria and doubles approximately the number of patients in whom OSA is diagnosed are in agreement with previous studies.8,9 BaHammam et al.9 showed that the AHI derived from AASM2007 recommended was 62% lower than the AASM2012 recommended criteria. Considering the AHI thresholds of ≥ 5, ≥ 15, and ≥ 30 events/h, they found that the AASM2007 recommended criteria underestimated by 45%, 52%, and 32%, respectively, the patients with OSA identified by the AASM2012 recommended criteria. In our study, we found a lower underdiagnosis rate for mild (34.9%) and moderate OSA (48.6%), but higher for severe OSA (54.2%). This could be because they used a clinical sample suspected for OSA, in which the proportion of OSA severity was overestimated compared to a general population sample.
In a retrospective study performed in 112 consecutive patients of an Australian clinical sleep laboratory in a tertiary hospital, Duce et al.8 investigated the equivalent AHI thresholds regarding the AASM1999, AASM2012 recommended, and both the AASM2007 recommended and alternative criteria. To achieve the same OSA prevalence as the AASM2012 recommended criteria at AHI thresholds of ≥ 5, ≥ 15, and ≥ 30 events/h, they showed that the AASM2007 recommended criteria would have to change their thresholds to 2.6, 7.2, and 14.1 events/h, respectively and the AASM1999 criteria to 7.3, 17.4, and 31.7 events/h, respectively. Overall, these findings are in agreement with our results from a general population sample. They also established equations to convert the different AHIs to one another, which were close to ours.
In terms of clinical relevance, our study additionally compared the association of OSA, based on different AHI thresholds, with the presence of cardiometabolic outcomes using the three scoring criteria. We observed more significant associations with hypertension and diabetes using the AASM2012 and AASM1999 criteria, both of which require a lower oxygen de-saturation and consider arousal for defining a hypopnea when compared to the AASM2007 recommended criteria. Although there is apparently an equivalence in the 3% or 4% criterion of oxygen desaturation for hypopnea definition in terms of increased cardiovascular risk,44,45 a debate about the clinical relevance of the arousal as part of the hypopnea definition exists. The inclusion of an arousal or the decrease in oxygen desaturation threshold (4% versus 3%) from the AASM2007 to AASM2012 recommended criteria seem to contribute almost equally to the resulting AHI increase.8 When testing 3% oxygen desaturation index (ODI), 4% ODI and arousal index as predictors of hypertension, diabetes, and metabolic syndrome in our sample (data not shown), we found independent associations of both 3% ODI and 4% ODI with diabetes and metabolic syndrome, but not with hypertension. No significant association was observed with arousal index alone. However, the treatment of sleep-disordered breathing associated with sleep fragmentation, but not with oxygen desaturation, has shown benefits on daytime sleepiness,46,47 suggesting that the inclusion of arousals may be clinically relevant. Through ROC analysis, we observed that the AHIs derived from the three scoring criteria were significantly and similarly associated with the presence of hypertension, diabetes, and metabolic syndrome. However, the AHI thresholds (considering equal weight to sensitivity and specificity) that better predicted each of these outcomes using the AASM2007 recommended criteria were approximately half of the AHI values established for both the AASM2012 recommended and the AASM1999 criteria. Thus, we believe that the most important is that AHI thresholds need to be adjusted when using stricter hypopnea criteria for a proper interpretation and decision to treat OSA. In our study, we could provide correction factors, reliably translating AHIs from AASM1999, AASM2007 and AASM2012 criteria in a large middle-aged general population sample.
There are several limitations in our study. First, it could be argued that scoring respiratory effort-related arousals (RERAs) would capture events scored with the AASM1999 criteria that do not fulfill the hypopnea requirements of the AASM2012 criteria, and the RDI would be similar using both scoring criteria. Although we did not look specifically at this point, Ruehland et al. have shown that the AHI differences between AASM1999 and AASM2012 were mostly due to events with ≥ 50% flow reduction, and not associated with significant desaturation or arousal, so these events could not be scored as RERAs (as they are not associated with arousal).10 We do not believe that including RERAs in the analysis could explain the differences found because these events are rather rare in our population.48 Second, in this study, OSA was estimated in the presence of respiratory events at different AHI thresholds, but we did not consider other elements as symptoms (sleepiness, fatigue, headache) or associated comorbidities as suggested by the International Classification of Sleep Disorders (ICSD-3).1 Although we believe that symptoms such as sleepiness are important for clinical decision, a very inclusive ICSD-3 definition for OSA syndrome would have led to a much higher and unrealistic rate of OSA.49 Third, due to the cross-sectional design of the study, we cannot infer causality regarding the associations between OSA severity derived from each scoring criteria and the cardiometabolic outcomes.
Last, this study focused on different AHI definitions but other biomarkers such as autonomic activation, inflammation, and genetic and demographic-related factors may prove to be a better predictor or may be used in combination with AHI to stratify OSA-associated risks. Prospective studies are thus required to better understand the parameters that should be used to determine OSA associated risk.
In conclusion, our study demonstrates that using different standard hypopnea definitions leads to marked differences in AHI. The use of AASM2007 hypopnea criteria leads to lower equivalent AHI cutoffs for the association with OSA-related comorbidities compared to both AASM1999 and AASM2012 criteria. However, prospective studies are necessary to further evaluate the extent to which cardiovascular and other health outcomes may be differentially predicted by different AHI definitions, and to identify other sleep-related metrics that may be even more efficient to do so.
DISCLOSURE STATEMENT
All authors have seen and approved the manuscript. All authors declare no financial or other relationship relevant to the subject of this article. Financial support of each author: Peter Vollonweider: Swiss National Science Foundation (grants 33CSCO-122661, 33CS30-139468 and 33CS30-148401). Gérard Waeber: Swiss National Science Foundation (grants 33CSCO-122661, 33CS30-139468 and 33CS30-148401). Raphael Heinzer: Ligue Pulmonaire Vaudoise and Leenaards Foundation. Institution where the work was performed: Center for Investigation and Research in Sleep (CIRS), University Hospital of Lausanne (CHUV), Lausanne, Switzerland.
ACKNOWLEDGMENTS
The authors thank Mehdi Tafti, Martin Preisig, Vincent Mooser and all other investigators of CoLaus/PsyCoLaus study, who made the HypnoLaus study possible. We are grateful to the Lausanne population who volunteered to participate in the HypnoLaus study. The CoLaus study was and is supported by research grants from GlaxoSmithKline, the Faculty of Biology and Medicine of Lausanne (FBM), and the Swiss National Science Foundation (SNF, grants 33CSCO-122661, 33CS30-139468 and 33CS30-148401).
ABBREVIATIONS
- AASM
American Academy of Sleep Medicine
- AASM1999
“Chicago criteria” hypopnea definition
- AASM2007
2007 AASM recommended hypopnea definition
- AASM2012
2012 AASM recommended hypopnea definition
- AHI
apnea-hypopnea index
- AUC
area under the curve
- BMI
body mass index
- CHUV
Centre Hospitalier Universitaire Vaudois
- DBP
diastolic blood pressure
- ECG
electrocardiogram
- EEG
electroencephalogram
- EMG
electromyogram
- HDL
high-density lipoprotein
- ICSD
International Classification of Sleep Disorders
- IQR
interquartile range
- no-OSA
without obstructive sleep apnea
- OR
odds ratio
- OSA
obstructive sleep apnea
- PSG
polysomnography
- RDI
respiratory disturbance index
- RERA
respiratory effort related arousal
- ROC
receiver operating characteristic curve
- SBP
systolic blood pressure
- SpO2
oxygen saturation
REFERENCES
- 1.American Academy of Sleep Medicine. International Classification of Sleep Disorders. 3rd ed. Darien, IL: American Academy of Sleep Medicine; 2014. [Google Scholar]
- 2.Hoyos CM, Drager LF, Patel SR. OSA and cardiometabolic risk: what's the bottom line? Respirology. 2017;22(3):420–429. doi: 10.1111/resp.12984. [DOI] [PubMed] [Google Scholar]
- 3.Drager LF, McEvoy RD, Barbe F, Lorenzi-Filho G, Redline S. Sleep apnea and cardiovascular disease: lessons from recent trials and need for team science. Circulation. 2017;136(19):1840–1850. doi: 10.1161/CIRCULATIONAHA.117.029400. initiative I. [DOI] [PMC free article] [PubMed] [Google Scholar]
- 4.Senaratna CV, Perret JL, Lodge CJ, et al. Prevalence of obstructive sleep apnea in the general population: a systematic review. Sleep Med Rev. 2017;34:70–81. doi: 10.1016/j.smrv.2016.07.002. [DOI] [PubMed] [Google Scholar]
- 5.Franklin KA, Lindberg E. Obstructive sleep apnea is a common disorder in the population-a review on the epidemiology of sleep apnea. J Thorac Dis. 2015;7(8):1311–1122. doi: 10.3978/j.issn.2072-1439.2015.06.11. [DOI] [PMC free article] [PubMed] [Google Scholar]
- 6.Manser RL, Rochford P, Naughton MT, et al. Measurement variability in sleep disorders medicine: the Victorian experience. Intern Med J. 2002;32(8):386–393. doi: 10.1046/j.1445-5994.2002.00256.x. [DOI] [PubMed] [Google Scholar]
- 7.Moser NJ, Phillips BA, Berry DT, Harbison L. What is hypopnea, anyway? Chest. 1994;105(2):426–428. doi: 10.1378/chest.105.2.426. [DOI] [PubMed] [Google Scholar]
- 8.Duce B, Milosavljevic J, Hukins C. The 2012 AASM respiratory event criteria increase the incidence of hypopneas in an adult sleep center population. J Clin Sleep Med. 2015;11(12):1425–1431. doi: 10.5664/jcsm.5280. [DOI] [PMC free article] [PubMed] [Google Scholar]
- 9.BaHammam AS, Obeidat A, Barataman K, Bahammam SA, Olaish AH, Sharif MM. A comparison between the AASM 2012 and 2007 definitions for detecting hypopnea. Sleep Breath. 2014;18(4):767–773. doi: 10.1007/s11325-014-0939-3. [DOI] [PubMed] [Google Scholar]
- 10.Ruehland WR, Rochford PD, O'Donoghue FJ, Pierce RJ, Singh P, Thornton AT. The new AASM criteria for scoring hypopneas: impact on the apnea hypopnea index. Sleep. 2009;32(2):150–157. doi: 10.1093/sleep/32.2.150. [DOI] [PMC free article] [PubMed] [Google Scholar]
- 11.Sleep-related breathing disorders in adults: recommendations for syndrome definition and measurement techniques in clinical research. The report of an American Academy of Sleep Medicine Task Force. Sleep. 1999;22(5):667–689. [PubMed] [Google Scholar]
- 12.Iber C, Ancoli-Israel S, Chesson A, Quan SF for the American Academy of Sleep Medicine. The AASM Manual for the Scoring of Sleep and Associated Events: Rules, Terminology and Technical Specifications. Westchester, IL: American Academy of Sleep Medicine; 2007. [Google Scholar]
- 13.Berry RB, Budhiraja R, Gottlieb DJ, et al. Rules for scoring respiratory events in sleep: update of the 2007 AASM Manual for the Scoring of Sleep and Associated Events. Deliberations of the Sleep Apnea Definitions Task Force of the American Academy of Sleep Medicine. J Clin Sleep Med. 2012;8(5):597–619. doi: 10.5664/jcsm.2172. [DOI] [PMC free article] [PubMed] [Google Scholar]
- 14.Firmann M, Mayor V, Vidal PM, et al. The CoLaus study: a population-based study to investigate the epidemiology and genetic determinants of cardiovascular risk factors and metabolic syndrome. BMC Cardiovasc Disord. 2008;8:6. doi: 10.1186/1471-2261-8-6. [DOI] [PMC free article] [PubMed] [Google Scholar]
- 15.Elliott P, Chambers JC, Zhang W, et al. Genetic Loci associated with C-reactive protein levels and risk of coronary heart disease. JAMA. 2009;302(1):37–48. doi: 10.1001/jama.2009.954. [DOI] [PMC free article] [PubMed] [Google Scholar]
- 16.Heinzer R, Vat S, Marques-Vidal P, et al. Prevalence of sleep-disordered breathing in the general population: the HypnoLaus study. Lancet Respir Med. 2015;3(4):310–318. doi: 10.1016/S2213-2600(15)00043-0. [DOI] [PMC free article] [PubMed] [Google Scholar]
- 17.El Assaad MA, Topouchian JA, Darne BM, Asmar RG. Validation of the Omron HEM-907 device for blood pressure measurement. Blood Press Monit. 2002;7(4):237–241. doi: 10.1097/00126097-200208000-00006. [DOI] [PubMed] [Google Scholar]
- 18.American Diabetes Association. Diagnosis and classification of diabetes mellitus. Diabetes Care. 2010;33(Suppl 1):S62–S69. doi: 10.2337/dc10-S062. [DOI] [PMC free article] [PubMed] [Google Scholar]
- 19.Alberti KG, Eckel RH, Grundy SM, et al. Harmonizing the metabolic syndrome: a joint interim statement of the International Diabetes Federation Task Force on Epidemiology and Prevention; National Heart, Lung, and Blood Institute; American Heart Association; World Heart Federation; International Atherosclerosis Society; and International Association for the Study of Obesity. Circulation. 2009;120(16):1640–1645. doi: 10.1161/CIRCULATIONAHA.109.192644. [DOI] [PubMed] [Google Scholar]
- 20.Hall MH, Okun ML, Sowers M, et al. Sleep is associated with the metabolic syndrome in a multi-ethnic cohort of midlife women: the SWAN Sleep Study. Sleep. 2012;35(6):783–790. doi: 10.5665/sleep.1874. [DOI] [PMC free article] [PubMed] [Google Scholar]
- 21.Theorell-Haglow J, Berne C, Janson C, Lindberg E. The role of obstructive sleep apnea in metabolic syndrome: a population-based study in women. Sleep Med. 2011;12(4):329–334. doi: 10.1016/j.sleep.2010.06.014. [DOI] [PubMed] [Google Scholar]
- 22.Troxel WM, Buysse DJ, Matthews KA, et al. Sleep symptoms predict the development of the metabolic syndrome. Sleep. 2010;33(12):1633–1640. doi: 10.1093/sleep/33.12.1633. [DOI] [PMC free article] [PubMed] [Google Scholar]
- 23.Chin K, Oga T, Takahashi K, et al. Associations between obstructive sleep apnea, metabolic syndrome, and sleep duration, as measured with an actigraph, in an urban male working population in Japan. Sleep. 2010;33(1):89–95. doi: 10.1093/sleep/33.1.89. [DOI] [PMC free article] [PubMed] [Google Scholar]
- 24.Nieto FJ, Peppard PE, Young TB. Sleep disordered breathing and metabolic syndrome. WMJ. 2009;108(5):263–265. [PMC free article] [PubMed] [Google Scholar]
- 25.Nagayoshi M, Punjabi NM, Selvin E, et al. Obstructive sleep apnea and incident type 2 diabetes. Sleep Med. 2016;25:156–161. doi: 10.1016/j.sleep.2016.05.009. [DOI] [PMC free article] [PubMed] [Google Scholar]
- 26.Appleton SL, Vakulin A, McEvoy RD, et al. Nocturnal hypoxemia and severe obstructive sleep apnea are associated with incident type 2 diabetes in a population cohort of men. J Clin Sleep Med. 2015;11(6):609–614. doi: 10.5664/jcsm.4768. [DOI] [PMC free article] [PubMed] [Google Scholar]
- 27.Kendzerska T, Gershon AS, Hawker G, Tomlinson G, Leung RS. Obstructive sleep apnea and incident diabetes. A historical cohort study. Am J Respir Crit Care Med. 2014;190(2):218–225. doi: 10.1164/rccm.201312-2209OC. [DOI] [PubMed] [Google Scholar]
- 28.Botros N, Concato J, Mohsenin V, Selim B, Doctor K, Yaggi HK. Obstructive sleep apnea as a risk factor for type 2 diabetes. Am J Med. 2009;122(12):1122–1127. doi: 10.1016/j.amjmed.2009.04.026. [DOI] [PMC free article] [PubMed] [Google Scholar]
- 29.Ronksley PE, Hemmelgarn BR, Heitman SJ, et al. Obstructive sleep apnoea is associated with diabetes in sleepy subjects. Thorax. 2009;64(10):834–839. doi: 10.1136/thx.2009.115105. [DOI] [PubMed] [Google Scholar]
- 30.Reichmuth KJ, Austin D, Skatrud JB, Young T. Association of sleep apnea and type II diabetes: a population-based study. Am J Respir Crit Care Med. 2005;172(12):1590–1595. doi: 10.1164/rccm.200504-637OC. [DOI] [PMC free article] [PubMed] [Google Scholar]
- 31.Resnick HE, Redline S, Shahar E, et al. Diabetes and sleep disturbances: findings from the Sleep Heart Health Study. Diabetes Care. 2003;26(3):702–709. doi: 10.2337/diacare.26.3.702. [DOI] [PubMed] [Google Scholar]
- 32.Guillot M, Sforza E, Achour-Crawford E, et al. Association between severe obstructive sleep apnea and incident arterial hypertension in the older people population. Sleep Med. 2013;14(9):838–842. doi: 10.1016/j.sleep.2013.05.002. [DOI] [PubMed] [Google Scholar]
- 33.O'Connor GT, Caffo B, Newman AB, et al. Prospective study of sleep-disordered breathing and hypertension: the Sleep Heart Health Study. Am J Respir Crit Care Med. 2009;179(12):1159–1164. doi: 10.1164/rccm.200712-1809OC. [DOI] [PMC free article] [PubMed] [Google Scholar]
- 34.Peppard PE, Young T, Palta M, Skatrud J. Prospective study of the association between sleep-disordered breathing and hypertension. N Engl J Med. 2000;342(19):1378–1384. doi: 10.1056/NEJM200005113421901. [DOI] [PubMed] [Google Scholar]
- 35.Redline S, Sotres-Alvarez D, Loredo J, et al. Sleep-disordered breathing in Hispanic/Latino individuals of diverse backgrounds. The Hispanic Community Health Study/Study of Latinos. Am J Respir Crit Care Med. 2014;189(3):335–344. doi: 10.1164/rccm.201309-1735OC. [DOI] [PMC free article] [PubMed] [Google Scholar]
- 36.Kapur VK, Resnick HE, Gottlieb DJ Sleep Heart Health Study G. Sleep disordered breathing and hypertension: does self-reported sleepiness modify the association? Sleep. 2008;31(8):1127–1132. [PMC free article] [PubMed] [Google Scholar]
- 37.Haas DC, Foster GL, Nieto FJ, et al. Age-dependent associations between sleep-disordered breathing and hypertension: importance of discriminating between systolic/diastolic hypertension and isolated systolic hypertension in the Sleep Heart Health Study. Circulation. 2005;111(5):614–621. doi: 10.1161/01.CIR.0000154540.62381.CF. [DOI] [PubMed] [Google Scholar]
- 38.Nieto FJ, Young TB, Lind BK, et al. Association of sleep-disordered breathing, sleep apnea, and hypertension in a large community-based study. Sleep Heart Health Study. JAMA. 2000;283(14):1829–1836. doi: 10.1001/jama.283.14.1829. [DOI] [PubMed] [Google Scholar]
- 39.Duran J, Esnaola S, Rubio R, Iztueta A. Obstructive sleep apnea-hypopnea and related clinical features in a population-based sample of subjects aged 30 to 70 yr. Am J Respir Crit Care Med. 2001;163(3 Pt 1):685–689. doi: 10.1164/ajrccm.163.3.2005065. [DOI] [PubMed] [Google Scholar]
- 40.Young T, Peppard P, Palta M, et al. Population-based study of sleep-disordered breathing as a risk factor for hypertension. Arch Intern Med. 1997;157(15):1746–1752. [PubMed] [Google Scholar]
- 41.Manser RL, Rochford P, Pierce RJ, Byrnes GB, Campbell DA. Impact of different criteria for defining hypopneas in the apnea-hypopnea index. Chest. 2001;120(3):909–914. doi: 10.1378/chest.120.3.909. [DOI] [PubMed] [Google Scholar]
- 42.Tsai WH, Flemons WW, Whitelaw WA, Remmers JE. A comparison of apnea-hypopnea indices derived from different definitions of hypopnea. Am J Respir Crit Care Med. 1999;159(1):43–48. doi: 10.1164/ajrccm.159.1.9709017. [DOI] [PubMed] [Google Scholar]
- 43.Redline S, Kapur VK, Sanders MH, et al. Effects of varying approaches for identifying respiratory disturbances on sleep apnea assessment. Am J Respir Crit Care Med. 2000;161(2 Pt 1):369–374. doi: 10.1164/ajrccm.161.2.9904031. [DOI] [PubMed] [Google Scholar]
- 44.Mehra R, Benjamin EJ, Shahar E, et al. Association of nocturnal arrhythmias with sleep-disordered breathing: the Sleep Heart Health Study. Am J Respir Crit Care Med. 2006;173(8):910–916. doi: 10.1164/rccm.200509-1442OC. [DOI] [PMC free article] [PubMed] [Google Scholar]
- 45.Redline S, Budhiraja R, Kapur V, et al. The scoring of respiratory events in sleep: reliability and validity. J Clin Sleep Med. 2007;3(2):169–200. [PubMed] [Google Scholar]
- 46.Guilleminault C, Hagen CC, Huynh NT. Comparison of hypopnea definitions in lean patients with known obstructive sleep apnea hypopnea syndrome (OSAHS) Sleep Breath. 2009;13(4):341–347. doi: 10.1007/s11325-009-0253-7. [DOI] [PubMed] [Google Scholar]
- 47.Guilleminault C, Stoohs R, Clerk A, Cetel M, Maistros P. A cause of excessive daytime sleepiness. The upper airway resistance syndrome. Chest. 1993;104(3):781–787. doi: 10.1378/chest.104.3.781. [DOI] [PubMed] [Google Scholar]
- 48.Ogna A, Tobback N, Andries D, et al. Prevalence and clinical significance of respiratory effort-related arousals in the general population. J Clin Sleep Med. 2018;14(8):1339–1345. doi: 10.5664/jcsm.7268. [DOI] [PMC free article] [PubMed] [Google Scholar]
- 49.Heinzer R, Marti-Soler H, Haba-Rubio J. Prevalence of sleep apnoea syndrome in the middle to old age general population. Lancet Respir Med. 2016;4(2):e5–e6. doi: 10.1016/S2213-2600(16)00006-0. [DOI] [PubMed] [Google Scholar]
Associated Data
This section collects any data citations, data availability statements, or supplementary materials included in this article.