

Abstract
Physiological processes, such as respiration, circulation, digestion, and many pathologies alter oxygen concentration in the blood and tissue. When designing culture systems to recapitulate the in vivo oxygen environment, it is important to integrate systems for monitoring and controlling oxygen concentration. Herein, we report the design and engineering of a system to remotely monitor and control oxygen concentration inside a device for 3D cell culture. We integrate a photonic oxygen biosensor into the 3D tissue scaffold and regulate oxygen concentration via the control of purging gas flow. The integrated phosphorescence-based oxygen biosensor employs the quenching of palladium-benzoporphyrin by molecular oxygen to transduce the local oxygen concentration in the 3D tissue scaffold. The system is validated by testing the effects of normoxic and hypoxic culture conditions on healthy and tumorigenic breast epithelial cells, MCF-10A cells and BT474 cells, respectively. Under hypoxic conditions, both cell types exhibited upregulation of downstream target genes for the hypoxia marker gene, hypoxia-inducible factor 1α (HIF1A). Lastly, by monitoring the real-time fluctuation of oxygen concentration, we illustrated the formation of hypoxic culture conditions due to limited diffusion of oxygen through 3D tissue scaffolds.
Keywords: Oxygen, Microdevice, Organs-on-chips, Oxygen biosensor, Biosensors, Hypoxia
1. Introduction
The measurement and control of oxygen concentration in cell culture has been a topic of intense discussion for more than 60 years (Cooper et al., 1958). Oxygen levels are dynamic in the human body, varying from less than 2% in the rectal lumen to 15% in the pulmonary alveoli (Carreau et al., 2011; Lind Due et al., 2003). The terms normoxia, hypoxia and anoxia are relevant to discussions of cell environments, but they are often broadly defined across different research fields in terms of ranges and units, leading to misunderstandings concerning physiologic oxygen levels and oxygen levels outside the human body. Common descriptions of oxygen include partial pressure of oxygen (pO2) or oxygen tension, with units of kilopascal (kPa) (Hashimoto, 2010; Saglio et al., 1988), millimeters of mercury (mmHg) (Acosta et al., 2009; Aquino-Parsons et al., 1999; Evans et al., 2000), dissolved oxygen concentration (μmol L−1) (Domansky et al., 2010; Matsumura et al., 1986) and percent oxygen concentration (%) (Gabig et al., 1979; McKeown, 2014). Such terminology does not capture the physiological description of oxygen tension or oxygen concentration in the human body; thus, it is difficult to accurately replicate physiological oxygen levels in experimental conditions. Nonetheless, there are standard methods to convert between the relevant oxygen measurements. For example, using Henry’s Law to convert from a dissolved oxygen concentration of 100 μM to a percent oxygen concentration of ≈ 7.5%, the temperature (here, 21 °C) and pressure (atmospheric, 101.3 kPa) must be defined. Accordingly, at physiological temperature ) (37 °C) and atmospheric pressure, the conversion to percent oxygen can be roughly estimated by dividing the dissolved oxygen by a factor of 10. This estimate can be used to estimate physiological oxygen conditions in vitro.
The physiological oxygen conditions affecting healthy physiology and pathologies vary widely across the tissues of the human body. During respiration, humans breathe air containing percent oxygen concentration of 20.9%, i.e. the partial pressure of oxygen in the environment (PeO2) is ≈ 21 kPa. The percent oxygen concentration is immediately reduced to ≈ 15% in the pulmonary alveoli, where hemoglobin binds oxygen and transports it throughout the body inside blood (Carreau et al., 2011). Although oxygen is uniformly transported to the edge of the circulatory system through arterioles and capillaries, some parts of the body consume oxygen at higher rates. For example, the brain, with the highest metabolic activity per unit weight of any organ, consumes 20–25% of all the oxygen in the entire body (Kristian, 2004; Lee et al., 2000), while gut and muscle tissue demand variant oxygen levels depending on rest or contraction status (Chou and Coatney, 1994; Shephard, 1966). Consequently, a range of physiological oxygen levels exists throughout the body, including percent oxygen concentration of ≈ 10% in the kidneys, 7% in the intestines and less than 5% in the sub-papillary plexus region of the skin and brain tissues (Carreau et al., 2011). Apart from the entrance of the respiratory tract, tissue in the human body does not contain more than a percent oxygen concentration of ≈ 15%, and this should be considered to be the maximum oxygen concentration for in vitro normoxic tissue culture.
However, the standard tissue culture incubator is held at hyperoxic conditions. The standard tissue culture incubator, which most in vitro systems utilize, maintains a temperature of 37 °C, recapitulating human body temperature at 100% relative humidity to ensure medium does not evaporate and cell metabolism is not compromised by changes in osmolarity. The gaseous mixture contained within the tissue culture incubator is composed of nitrogen gas (N2), gaseous water (H2Og) and carbon dioxide (CO2). When 20.9% oxygen gas (O2) is added to the incubator containing 70.2% N2, 6.2% H2Og and 5.0% CO2, the resulting O2 is 18.6% at sea level (Wenger et al., 2015). The oxygen concentration inside a normobaric incubator (18.6%) is hyperoxic in physiological terms, because no body tissue exists at a higher oxygen environment than the 15% (Ivanovic, 2009; Richter et al., 1972; Toussaint et al., 2011).
Ultimately, environmental oxygen differences between tissue culture and in vivo physiology can hinder translating research findings from benchtop to bedside. Studying cells in inaccurate environments makes predicting appropriate drug dosages for in vivo models difficult, leading to drug failure during clinical trials (Heathman et al., 2015). For example, complex in vitro systems are often developed to investigate pathologies and novel therapies, especially tumorigenesis and metastases (Elliott and Yuan, 2011; Kim et al., 2004; Nelson and Bissell, 2005); however, these systems do not accurately recapitulate the oxygen environment of in vivo tumors (Walsh et al., 2014). This is a particularly notable shortcoming because oxygen concentration has been implicated in tumor metastasis (Brizel et al., 1996; Francis et al., 2007; Secomb et al., 1993). In vivo tumors create a low oxygen environment, i.e. average percent oxygen concentration of ≈ 1.5%, which becomes more hypoxic from outer edge to inner core region, where vasculature is leaky or absent (Jiang et al., 1996; Tredan et al., 2007).
To translate in vitro results and better predict the outcome of in vivo testing, the physiological oxygen environment surrounding a cell or tissue of interest must be accurately recapitulated. For example, hypoxia is implicated in a myriad of developmental and pathological functions (Colgan and Taylor, 2010; Semenza, 2010; Uchida et al., 2004; Zhang et al., 2016). Hypoxia can be any physiologic environment in which a cell or tissue is responding to a reduced oxygen availability, regardless of the quantitative value assigned to the concentration of oxygen present. Creating a desired oxygen concentration and controlling it in a cell culture system is currently limited by the cost and feasibility of available techniques. Large hypoxic incubators can generate stable low oxygen environments, but they require high operating costs (Esteban and Maxwell, 2005; Post and Van Meir, 2003). Alternatively, a smaller hypoxic chamber with microtiter plates can be deoxygenated and placed inside a normobaric tissue culture incubator (Wu and Yotnda, 2011). These small hypoxic chambers are expensive to maintain, as they require significant gas exchange, and cannot be opened or manipulated easily to change media or collect samples during an experiment. Microdevices that recapitulate the hypoxic environment of a tumor have been created using a variety of methods and materials, such as oxygen scavenging chemicals, gas supply channels and oxygen impermeable materials, as reviewed by Byrne et al. (2014). With microdevice technology, even smaller hypoxic chambers, on the scale of a single well in a microtiter plate, can be created in parallel to allow for multiple oxygen environments to be tested simultaneously (Adler et al., 2010). Furthermore, with connections and ports, sampling of fluids can be performed to measure cellular responses while maintaining a hypoxic environment (Bavli et al., 2016).
In the aforementioned systems, an integrated monitoring system and control loop is necessary to maintain the hypoxic environment as cells respond to oxygen deficient environments or injury by increasing cellular respiration. Real-time oxygen biosensors can be integrated into a cell culture system to create the first step in the control loop required to sustain a desired oxygen environment. Next, oxygen must be depleted or quickly expelled from the cell culture device, while maintaining appropriate nutrients and other molecules for cell culture. Hydrogels can be used to maintain a nutrient rich environment for cells, while N2 can be used to expel free O2 from the air above the hydrogel and medium (Khanal et al., 2014). By closely tracking and adjusting the level of oxygen in a microfluidic culture system, gas flow and medium can be simultaneously introduced and exchanged with minimal reagent usage or waste accumulation.
Herein, we present a method and system for real-time, remote monitoring and control of oxygen concentration in 3D cell cultures. The 3D culture and oxygen monitoring system is composed of (1) a microfluidic cell culture-gas exchange chamber and (2) an integrated phosphorescence-based oxygen biosensor (iPOB). The system was validated in a study to control hypoxic conditions and evaluate the effect of oxygen concentration on benign and tumorigenic breast epithelial cells, MCF-10A cells and BT474 cells, respectively.
2. Materials and methods
2.1. Fabrication of 3D culture and oxygen monitoring system
The 3D culture and oxygen monitoring system was fabricated using polymethyl methacrylate (PMMA) and photopolymer resin (Formlabs, Inc.). PMMA was chosen to fabricate the microfluidic cell culture chamber and gas exchange channels because it possesses a very low oxygen diffusion coefficient (2.7 × 10⁻⁸ cm2·s−1), as compared to polydimethylsiloxane and polycarbonate (Byrne et al., 2014; Klinger et al., 2009). PMMA was also selected because it can be easily laser cut or machined without significant variation between replicates. The photopolymer resin was 3D printed to form a bottom frame to support the 3D culture device and simultaneously house the optical reader for the iPOB (Fig. 1a). A Computer-Aided Design file for 3D printing is provided in the Supplementary material.
Fig. 1. 3D Culture and Oxygen Monitoring System.
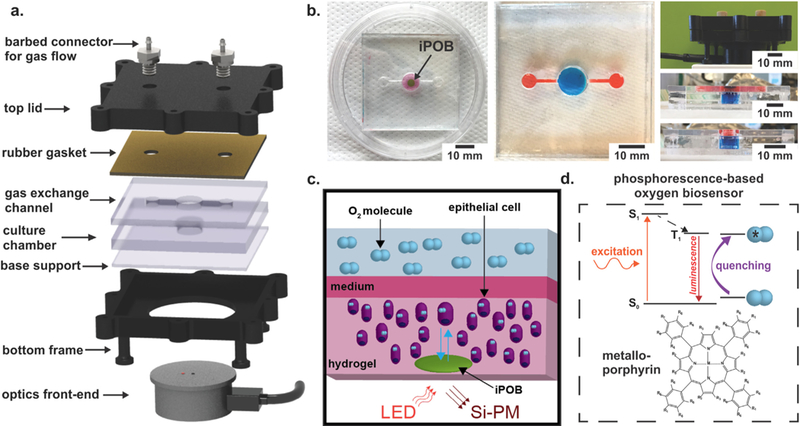
a) A schematic of device compartments. A photopolymer resin bottom frame supports PMMA cell culture chamber and gas exchange channel. Rubber gasket seals gas flow into and out of the culture chamber and gas exchange channel. Barbed connectors screwed into the top lid provide gas flow into and out of the device. The optical reader connects to a phosophorescence-lifetime fluorimeter and interrogates the culture chamber, where the 5 mm diameter, 0.5 mm thick integrated phosphorescence-based oxygen biosensor (iPOB) is located. b) Photographs of device. Left: Image of device with iPOB (black arrow) embedded in hydrogel. Middle and Bottom Right: Images of the assembled device with red and blue dyes to differentiate the gas channels and cell culture chamber, respectively. Top Right: Device enclosed inside frame with optical reader underneath. c) Schematic of oxygen sensing via hydrogel iPOB inside hydrogel containing cells. The iPOB is composed of poly(2-hydroxyethyl methacrylate) gel functionalized with palladium-benzoporphyrin derivatives (Pd-BPD). The photoluminescence excitation and detection wavelengths are 630 nm and 800 nm, respectively. d) Modified Jablonski diagram demonstrating the scheme of oxygen concentration detection from porphyrin luminescence. Luminescence from the triplet state in porphyrin is quenched by energy transfer to molecular oxygen, resulting in a correlated decrease in phosphorescence lifetime. (For interpretation of the references to color in this figure legend, the reader is referred to the web version of this article.)
The microfluidic cell culture chamber and gas exchange channels were fabricated from 5.8 mm and 3 mm polymethyl methacrylate (PMMA) sheets (44352, 44292; US Plastics). The microfluidic culture chamber was composed of a circular chamber with a diameter of 11 mm and rectangular gas channels of 8.3 mm by 1.0 mm by 3.0 mm for length, width and height of, respectively. Three PMMA layers were laser cut and annealed with acetone. The bottom and top pieces of PMMA were laser cut from a 3.0 mm-thick PMMA sheet, while the middle piece, where the circular cell culture chamber was located, was laser cut from a 5.8 mm-thick PMMA sheet. Briefly, to remove dust and burr material with minimal cracking, each PMMA surface was quickly wiped with 100% IPA solution and air dried. Acetone was added to each PMMA piece and pieces were stacked and bonded together between two sheets of stainless steel using a compression clamp. Annealing was performed inside a convection oven set at 80 °C for 2 h, then the device was cooled for 1 h at 60 °C. A rubber gasket was laser cut and placed on top of the PMMA layer to seal the cell culture chamber and gas channels, prior to bolting together. The device was tested for leaks using water and cracks were sealed by application of dichloromethane to the seams (Fig. 1b).
2.2. Integrated phosphorescence-based oxygen biosensor (iPOB)
Oxygen concentration in the system was continuously measured with an iPOB by NIR phosphorescence lifetime fluorimetry (Fig. 1c). Briefly, the iPOB is composed of porous poly(2-hydroxyethyl methacrylate) (pHEMA) gel functionalized with palladium-benzoporphyrin derivatives (Pd-BPD) that respond to local oxygen concentrations via phosphorescence quenching, resulting in an oxygen dependent variation in phosphorescent lifetime (Fig. 1d) (Wisniewski et al., 2017). The iPOB has been manufactured in a variety of sizes, but for all experiments presented here a disk-shaped iPOB with dimensions of 5 mm diameter and 0.5 mm thickness was used. The optical front-end of the NIR phosphorescence lifetime fluoroscope was inserted into the support frame below the 3D culture chamber. The iPOB and NIR phosphorescence lifetime fluoroscopes were provided by Profusa, Inc.
2.3. Breast epithelial cell culture
Immortalized benign human breast epithelial cells (MCF-10A, CRL-10317; ATCC) (Pauley et al., 1993) and non-metastatic tumorigenic human breast epithelial cells (BT474, HTB-20; ATCC) (Lasfargues et al., 1978) were cultured. 3D tissue constructs were composed of cells seeded inside 8.2 mg mL−1 of High Concentration (HC) Matrigel Basement Membrane Matrix (354248; Corning). Detailed culture conditions and protocols for conversion from 2D adherent monolayers to 3D embedded cultures are provided in the Supplemental material.
2.4. Computational model of gas flow in device
COMSOL Multiphysics® (Burlington, MA) was used to simulate the oxygen concentration inside the cell culture-gas exchange chamber. The oxygen transport was simulated for chambers operating under constant flow of N2 at various flow rates to determine the amount of time necessary to create a hypoxic environment, which we have defined as < 2% O2 (Table 1). The geometry of the device was modeled in 3D to represent the cell culture-gas exchange chamber, comprised of medium, with a depth of 5.8 mm and surface area of 0.95 cm2. Inlet and outlet gas channels, comprised of air, were modeled as ports feeding into the cell culture. A video of the simulation is provided in the Supplemental material.
Table 1.
Definitions of relevant oxygen environments at 37 °C.
| Environment | [%] O2 | pO2 [kPa] | CO2 [μM] |
|---|---|---|---|
| “Normoxia” | 21.0 | 19.9 | 210 |
| Normoxia (incubator) | 18.6 | 17.7 | 186 |
| Low Oxygen | 5.0 | 4.75 | 50.2 |
| Hypoxia | 2.0 | 1.90 | 20.1 |
| Near Anoxia | 0.5 | 0.48 | 5.02 |
| Anoxia | 0.0 | 0.0 | 0.0 |
2.5. Characterization of iPOB and 3D culture system
For experiments requiring gas flow, metal barb adapters screwed into the top of the 3D culture device were connected to tubing and an N2 tank. Gas flow was regulated using a pin valve and monitored with a mass flow meter with digital output (GFMS-010061; Aalborg GFM). The device included an input adapter for N2 inflow and an output adapter for O2 outflow (Fig. 1a). To characterize the iPOB and compare to the results of the computational models, initial experiments were performed inside a standard tissue culture incubator at 37 °C. The iPOB was suspended in 1X PBS in the cell culture chamber. Oxygen concentration data was collected without N2 flow for 15 min. Following a stabilization period, N2 flow was introduced into the culture chamber at a constant rate (3, 5, or 7 mL min−1) for 2 h. The device was also tested with alternating N2 flow at a high rate (8 mL min−1) over a period of 6 h to measure the time required to deoxygenate and reoxygenate the cell culture chamber. Lastly, the iPOB was either embedded inside Matrigel® or placed in medium on top of Matrigel® inside the cell culture chamber and oxygen concentration was measured for 20 h.
2.6. Real-time monitoring and control of oxygen concentration in 3D culture
To determine cellular response to sustained hypoxia, breast epithelial cells were grown to confluency inside 75 cm2 culture flasks then trypsinized, counted and re-suspended in Matrigel® inside the cell culture chamber. MCF-10A cells were seeded at a concentration of 0.85 × 10⁶ cells mL−1 inside Matrigel® with the iPOB in the cell culture chamber. Following a Matrigel® polymerization period of 30 min at 37 °C, the rubber gasket and lid were sealed onto the device. The optical reader was attached to the bottom of the device and lifetime, temperature and oxygen measurements were recorded for the duration of each experiment. The device was placed inside an incubator maintaining a temperature of 37 °C, 5% CO2 and 100% humidity and N2 was introduced into the device at a rate of 6.0 mL min−1. The N2 flow rate of 6.0 mL min−1 was chosen to expel oxygen without evaporating liquid medium overlaid on the hydrogel. Within 2 h, the iPOB reported the amount of oxygen inside the cell culture chamber had reached a hypoxic environment. The hypoxic condition was maintained for 24 h with continuous N2 flow. BT474 cell experiments were performed following the same procedure as explained above for MCF-10A cells, except BT474 cells were seeded in Matrigel® at a concentration of 0.6 × 10⁶ cells mL−1, as previously reported (Lee et al., 2007).
2.7. Immunohistochemistry and gene expression
After 24 h under hypoxic conditions, cells were characterized for hypoxia induced responses by immunohistochemical (IHC) and quantitative real-time polymerase chain reaction analyses (qRT-PCR). Samples were stained for cellular apoptosis marker active cleaved Caspase-3 Alexa Fluor 488 conjugate (rabbit, 1:50 dilution in protein block, Cat. No. 96035S; Cell Signaling) for 2 h and nuclei counterstain bisbenzamide (1:1000 dilution in 1X PBS, Cat. No. 1155; Millipore Sigma) for 5 min at room temperature. BT474 cell samples were also stained for Laminin alpha V, beta II Tubulin and bisbenzamide. All samples were imaged using a laser scanning confocal microscope (Zeiss LSM 710) and image analysis was performed using ImageJ (Schneider et al., 2012) to quantify Caspase-3 positive cells (dead cells) and DAPI positive cells (total cell number). From this analysis, we compared % cell death across BT474 and MCF-10A cells culture in either normoxic or hypoxic environments after 24 h. To assess the expression of genes that are responsive to hypoxia, a portion of breast epithelial cells encapsulated in Matrigel® was collected for qRT-PCR analysis. For each sample and experiment, triplicates were made and normalized to 16S mRNA levels. Fold change was expressed relative to normoxic controls using ΔΔCT analysis (Livak and Schmittgen, 2001). All statistics for IHC quantification and gene expression were generated using a Student’s t-test. In all statistical analysis, p < 0.05 was considered significant. Detailed materials and methods for the immunohistochemical and gene expression analysis are provided in the Supplemental information.
3. Results and discussion
A system was designed and engineered for real-time monitoring and control of oxygen concentration in 3D cell culture (Fig. 1). For findings presented in this paper, an oxygen concentration will be considered hypoxic if it is less than 2% oxygen or ≈ 20 μM, and a normoxic oxygen concentration will be 18.6% oxygen or ≈ 186 μM (Table 1).
By using continuous gas exchange of N2 and O2 in the medium above the 3D tissue scaffold, oxygen concentration was precisely controlled to generate a range of normoxic and hypoxic conditions. N2 displaces O2 quickly inside the 3D culture-gas exchange chamber, similar to a tri-gas incubator. Tri-gas incubators create hypoxia by controlling CO2 and O2 using N2 to purge ambient air during incubation (Hsiao et al., 2013; Mathew et al., 2017; Quinn, 2014). On a much a smaller scale, the 3D culture-gas exchange chamber replaced O2 with N2 in the medium above the 3D tissue scaffold to create a hypoxic environment for culturing cells. An intermediate oxygen concentration, such as 5% oxygen, could be maintained for 24-h culture with continuous N2 flow rate lower than 3 mL min−1.
Inside the 3D tissue scaffold, an iPOB was embedded and via NIR phosphorescence lifetime fluorimetry the oxygen concentration inside the culture was monitored (Fig. 1c, d). The operation of the iPOB is based on the principle of phosphorescence quenching of metalloporphyrins by molecular oxygen (Lo et al., 1996; Rumsey et al., 1988). The phosphorescent chromophore (porphyrin) of the probe molecule can be converted to the triplet state by light absorption, followed by return to the ground state either with light emission (phosphorescence and/or delayed fluorescence) or by energy transfer to molecular oxygen (Vinogradov and Wilson, 2002). pHEMA is a biocompatible hydrogel and the porosity of the hydrogel facilitates liquid and gas exchange, along with penetration of the resident cell population. A portable phosphorescence lifetime fluoroscope was utilized to record the signal from the iPOB (Profusa, Inc.). Use of phosphorescence has been demonstrated as a viable method for measuring oxygen distribution in tissue in animals and humans (Eastwood and Gouterma, 1970; Lo et al., 1996; Montero-Baker et al., 2015; Rumsey et al., 1988; Vanderkooi and Wilson, 1986). The phosphorescence lifetime of the metalloporphyrins is inversely related to oxygenation and can be measured within 2 μs, providing an oxygen detection range from 2 to 70 μM (Wisniewski et al., 2017). For in vitro oxygen measurements requiring phosphorescence lifetime detection in seconds, the detection range can be extended to 150 μM.
3.1. Computational model of gas flow and comparison to the experimental performance of the iPOB in the 3D culture and oxygen monitoring system
The computational model developed to recapitulate the geometry and fluid dynamics of the device predicted the amount of time a given N2 flow rate would take to deoxygenate the entire 3D culture-gas exchange chamber. Representative results of the simulation are shown in Fig. 2a. The results of the simulations at various N2 flow rates show that a N2 flow rate of 7.0 mL min−1 creates a hypoxic environment inside the cell culture chamber of PO2 = 1 kPa or ≈ 1% O2 within 45 min (Fig. 2b).
Fig. 2.
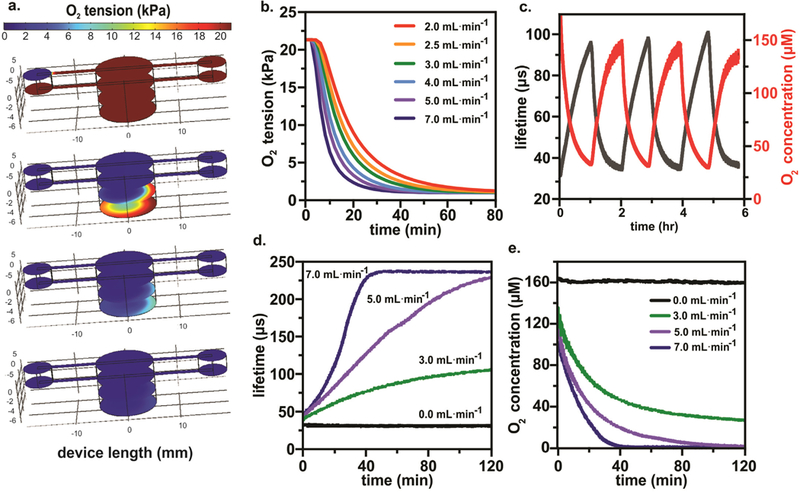
Computational Model of Oxygen Concentration in 3D Culture and Monitoring with Integrated Phosphorescence-based Oxygen Biosensor (iPOB). a) Results from COMSOL Multiphysics® computational model of the 3D culture-gas exchange chamber showing N2 flow at 5.0 mL min−1 used to purge O2 from the left inlet to the right outlet over a 50-min interval, with four color maps displaying oxygen tension after 0, 10, 30 and 50 min. The color maps display the oxygen tension from 0 to 21 kPa. b) COMSOL Multiphysics® simulation results of N2 flow at various flow rates show the amount of oxygen inside the bottom of the cell culture chamber decreases more rapidly with increased N2 flow rates. c) Experimental results of purging and reoxygenating the culture chamber by turning on and off N2 at a flow rate of 8.0 mL min−1 over 6 h and allowing for passive diffusion of oxygen from the atmosphere into the cell culture chamber. d) Experimental results illustrating the operation of the iPOB in PBS measuring changes in phosphorescence lifetime at different N2 flow rates. e) Conversion of phosphorescent lifetime to oxygen concentration for iPOB in PBS at different N2 flow rates. Note the hypoxic environment (O2 concentration < 20 μM) created in < 1 h at N2 flow rate of 7.0 mL min−1.
To experimentally validate the computational models, the iPOB was suspended in PBS solution and N2 flow was introduced into the 3D culture-gas exchange chamber. The phosphorescence intensity output of the iPOB was processed to calculate the phosphorescence lifetime decay (τ), as previously reported (Lo et al., 1996). Phosphorescent lifetime decay of Pd-BPD correlates directly to the oxygen concentration of its surrounding environment (Vinogradov et al., 2003; Wilson et al., 2006).
Repeated cycling of N2 flow for 6 h at a flow rate of 8.0 mL min−1 showed that the oxygen concentration equilibrated to normoxic conditions within one hour after N2 inflow ceased, as shown in Fig. 2c. Based on the Einstein-Smoluchowski equation for diffusion of gases in solution (t = 0.5·r2·D−1) (Einstein, 1905, 1906, 1907, 1908; von Smoluchowski, 1906), where r equals the height of 500 μL of PBS inside the device (5.26 mm) and D is the diffusion coefficient of O2 (2.46 × 10⁻⁹ m2 s-1(van Stroe-Biezen et al., 1993)), the expected time required for O2 to diffuse through PBS was calculated as ≈ 90 min. Because the oxygen concentration returned to normoxia in less than 1.5 h once N2 inflow ceased, the calculated O2 equilibration period through PBS agreed with the experimental cycling of N2 for lifetime decay and oxygen concentration. Although an N2 flow rate of 8.0 mL min−1 was experimentally tested inside the device containing the iPOB suspended in PBS, when this high gas flow rate was used with the device containing a hydrogel and medium, we noticed the high N2 flow rate caused evaporation of the liquid medium overlaid on the hydrogel. Previously reported values for gas flow rates used in hypoxic cell culture devices include a range from 5 mL min−1 to as high as 20 mL min−1 (Acosta et al., 2014; Adler et al., 2012; Adler et al., 2010; Funamoto et al., 2012). Further optimization of N2 flow with the hydrogel revealed that a flow rate of 6 mL min−1 expelled oxygen rapidly while maintaining medium on top of the hydrogel (data not shown).
Experimentally tested flow rates of 3, 5 and 7 mL min−1 reveal similar trends of deoxygenation as predicted by the computational simulations. At 3 mL min−1, the lowest N2 flow rate tested, an oxygen concentration less than 27 μM (≈ 2.7% O2) was achieved in less than 2h (Fig. 2d). Compared to the computation simulation at an N2 flow rate of 3 mL min−1, which found an oxygen concentration less than 27 μM in 36 min, it took more time than predicted to achieved this oxygen concentration experimentally. At an N2 flow rate of 5 mL min−1, an oxygen concentration less than 20 μM (≈ 2% O2) was achieved in less than 40 min (Fig. 2d). The simulation found at this flow rate that an oxygen concentration less than 20 μM was achieved in 30 min, which agrees well with experimentally measured time. Finally, at 7 mL min−1 N2 flow rate, within 23 min an oxygen concentration less than 10 μM (≈ 1% O2) was achieved (Fig. 2d) experimentally, which was approximately 25 min faster than the simulation predicted. Humidity and temperature change inside the incubator could account for slight differences between simulation and experimental results. The 3D culture-gas exchange chamber and iPOB sustained repeated experimental testing at 37 °C with no signs of damage or degradation.
In addition to testing the iPOB embedded inside the tissue scaffold, we tested the response of the iPOB in the medium above the tissue scaffold. We found that there was on average a 20 μM (≈ 2% O2) decrease in oxygen concentration between the medium and inside the Matrigel® (Fig. 3d). When the iPOB was embedded inside Matrigel® the oxygen concentration was on average 119 μM (≈ 12% O2). When the iPOB was placed in medium on top of the Matrigel® the oxygen concentration was on average 139 μM (≈ 14% O2). A similar trend was recorded when the iPOB was inserted in “cell-free” tissue scaffolds and exposed to N2 flow rate of 7.0 mL min−1 (Fig. 3e). A higher oxygen level was measured on top of the tissue scaffold as compared to inside the tissue scaffold, until both conditions dropped below the hypoxic level (20 μM). These results illustrate the spatial resolution of the iPOB and the capability to identify the effects of the tissue scaffold on the oxygen transport; moreover, this demonstrates a method to monitor oxygen concentrations in thicker (> 2 mm) 3D tissue cultures.
Fig. 3. Monitoring and Controlling Oxygen Concentration in 3D Cell Culture.
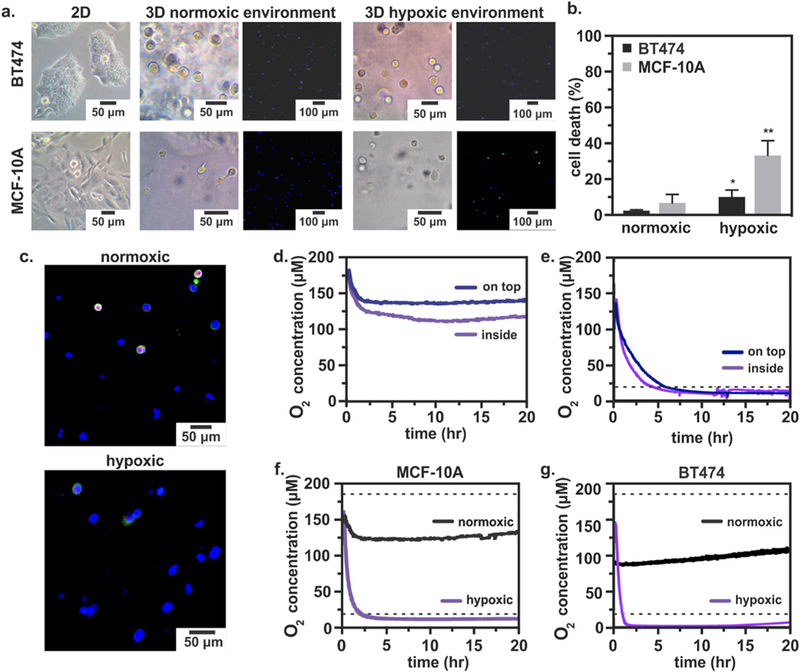
a) Left: Breast epithelial cells grown in T-75 flasks for 6 days. Middle: Breast epithelial cells embedded in Matrigel® and cultured in a normoxic environment for 24 h. Fluorescent images: Caspase-3 (green), DAPI (blue). Right: Breast epithelial cells embedded in Matrigel® and cultured in a hypoxic environment for 24 h. Fluorescent images: Caspase-3 (green), DAPI (blue). b) Quantification of cell death from confocal images using ratio of Caspase-3 positive cells to DAPI positive cells. n = 3; p < 0.05, p < 0.01. c) Fluorescent micrographs of BT474 cells showing basement membrane (Laminin alpha V, red), microtubules (Beta II tubulin, green) and nuclei (Bisbenzimide, blue) after 24 h of normoxic or hypoxic culture inside the device. d) Integrated Phosphorescence-based Oxygen Biosensor (iPOB) measurements of oxygen concentration in “cell-free” tissue scaffolds over 20 h. There is less oxygen inside the tissue scaffold (purple) than on top of the tissue scaffold (blue). e) Oxygen concentration in “cell-free” tissue scaffolds exposed to an N2 flow rate of 7.0 mL min−1 over 20 h. f) Oxygen concentration in MCF-10A culture under hypoxic (purple) and normoxic conditions (black) for 20 h. Average oxygen concentration of 12 μM (≈ 1.2% O2) and 127 μM (≈ 13% O2), respectively. g) Oxygen concentration in MCF-10A culture under BT474 culture under hypoxic (purple) and normoxic (black) conditions for 20 h. Average oxygen concentration of 6.4 μM (≈ 0.6% O2) and 95 μM (≈ 9.5% O2), respectively. Dashed lines are the conventional, assumed normoxic (186 μM) and hypoxic (20 μM) oxygen concentrations. (For interpretation of the references to color in this figure legend, the reader is referred to the web version of this article.)
3.2. Monitoring of oxygen concentration in 3D culture of healthy and tumorigenic breast epithelial cells
The variation of native oxygen environments and tumorigenic status of the two breast epithelial cell lines derived from the same native tissue make them optimal candidates to monitor and compare cellular responses to hypoxia for validation of the reported 3D cell culture and oxygen monitoring system. Benign human breast epithelial cells, MCF-10A cells, and tumorigenic human breast epithelial cells, BT474 cells, have been shown to respond to the same duration and magnitude of hypoxia with unique mRNA and protein expression levels (Bashari et al., 2016; Braunstein et al., 2007; Gabai et al., 2012). MCF-10A cells were derived from benign human breast tissue, where the concentration of oxygen has been reported to be greater than 9%; BT474 cells were derived from solid, invasive ductal breast carcinomas, where the concentration of oxygen has been reported to be as low as 0.3% oxygen (Chun et al., 2005). The native oxygen environments from which the MCF-10A and BT474 cells are derived represent normoxia and hypoxia in breast tissue, respectively.
To compare MCF-10A and BT474 cellular response in the system after 24 h of hypoxia, we fixed hydrogels containing cells and performed immunohistochemical (IHC) analysis for cleaved Caspase-3. Both MCF-10A and BT474 cells responded to hypoxic conditions by exhibiting significant cellular apoptosis, quantified as the ratio of apoptotic marker cleaved Caspase-3 positive cells to nuclei marker bisbenzamide positive cells (Fig. 3a, b). Most importantly, MCF-10A cells exhibited a significantly higher percentage of cell death than BT474 cells. The increased cell death of MCF-10A cells in response to hypoxia, as compared to the tumorigenic BT474 cells, was not unexpected as MCF-10A cells typically occupy a higher oxygen environment and may experience hypoxic stress more quickly than tumorigenic breast epithelial cells. IHC analysis of cellular apoptosis showed that the hypoxic environment induced inside the system instigated the expected apoptotic responses in both MCF-10A and BT474 cells with an exacerbated response in the benign MCF-10A cells.
To investigate 3D cell morphology following hypoxic culture, we examined the cellular basement membrane and microtubules of BT474 cells by staining for Laminin, alpha V and beta II Tubulin, respectively. In BT474 cells cultured for 24 h under hypoxic conditions, there was a noticeable absence of Laminin and alpha V, representing a lack of intact basement membrane, as compared to BT474 cells cultured under normoxic conditions for 24 h (Fig. 3c). BT474 cells also exhibited lower levels of beta II Tubulin, as compared to BT474 cells cultured under normoxic conditions. Confocal images collected from samples of normoxic and hypoxic cultured BT474 cells collectively suggest that the hypoxic environment imposed inside the device imparted morphological changes on the BT474 cells. Although the cell morphology of BT474 cells cultured under hypoxic conditions was qualitatively different than that of normoxic BT474 cells, a quantitative comparison was not made due to increased non-specific staining of the scaffold and hypoxia-induced cellular debris.
When culturing MCF-10A cells under both normoxic and hypoxicconditions, oxygen concentrations were measured below the standard, assumed culture conditions, i.e. less than the conventional hypoxia (2% ≈ 20 μM) or normoxia (18.6% O2 or ≈ 186 μM) conditions. Representative data from one culture period (20 h.) is displayed in Fig. 3f. Under hypoxic conditions, an average oxygen concentration of 12 μM (≈ 1.2% O2) was measured. Under normoxic conditions, an average oxygen concentration of 127 μM (≈ 13% O2) was measured. When culturing BT474 cells, even lower oxygen concentrations were measured in both the hypoxic and normoxic conditions (Fig. 3g). During normoxia experiments, an average oxygen concentration of 95 μM (≈ 9.5% O2) was measured, while during hypoxia experiments the oxygen concentration was 6.4 μM (≈ 0.6% O2). These results suggest the 18.6% O2 contained within the normobaric incubator is significantly limited by diffusion through the thickness of the cell-laden tissue scaffold and medium (4.21 mm), which is corroborated by oxygen concentration measurements made in the “cell free” experiments.
To determine whether known genetic responders to hypoxia were upregulated following hypoxic conditioning in our device, we evaluated the expression of selected downstream target genes of HIF1 (Hypoxia inducible factor-1) using mRNA collected from BT474 and MCF-10A cells. The HIF protein is a transcription factor composed of two subunits: the oxygen-dependent α subunit and the ubiquitously expressed ß subunit (Wigerup et al., 2016). During hypoxia, the HIF-1α subunit is rescued from oxygen-dependent degradation in the proteasome and activates a complement of downstream target genes (Semenza et al., 1998; Wang et al., 1995). The stabilized HIF-1 transcriptional activator binds genetic enhancer sequences in the promoter of HIF-1 target genes (Airley et al., 2003). A subset of these target genes include the following: vascular endothelial growth factor (VEGF) (Forsythe et al., 1996), solute carrier family 2 member 1 (SLC2A1) (Ebert et al., 1995) and BCL2 (B-cell lymphoma 2) interacting protein 3 (BNIP3) (Kothari et al., 2003), which are important for angiogenesis, glucose metabolism and apoptosis, respectively.
Since the oxygen-dependent HIF1A is primarily regulated at the post-transcriptional level by nuclear localization and protein stabilization (Gradin et al., 1996; Huang et al., 1996), we did not expect substantial changes in HIF1A mRNA following 24-h hypoxia. While HIF1A slightly increased in both BT474 and MCF-10A cells, there was a significant and substantial increase in HIF1 target genes VEGFA, SLC2A1 and BNIP3. Interestingly, the tumorigenic BT474 cells had the most significant upregulation of BNIP3 when compared to normoxic controls (Fig. 4a, purple bars, p < 0.05, Student’s t-test). These results contrast greatly with non-tumorigenic MCF-10A cells, which displayed little change in BNIP3 expression. Although BNIP3 upregulation has been previously reported following similar durations of hypoxic conditioning (Thienpont et al., 2016), cells encapsulated in a hydrogel 3D tissue construct differ from previous culture methods in which MCF-10A cells were adherent to tissue culture plates. The 3D tissue scaffold could provide a barrier to protect MCF-10A cells from apoptotic injury, leading to less mRNA expression of BNIP3. Another study comparing durations of hypoxia reported BNIP3 expression peaks after 72 h, suggesting BNIP3 expression is a later hypoxic response than downstream targets VEGFA and SLC2A1 (Kothari et al., 2003). Overall, the difference in BNIP3 expression between MCF-10A cells and BT474 cells suggests tumorigenic BT474 cells are more susceptible to hypoxia-induced apoptosis, as evident from 12-fold increase in BNIP3 expression. MCF-10A cells cultured under hypoxic conditions showed a significant 5.0-fold increase in VEGFA and 7.0-fold increase in SLC2A1 expression, as compared to normoxic controls (Fig. 4b, purple bars, p < 0.05, Student’s t-test). These results support that non-tumorigenic MCF-10A cells initially respond to hypoxia by primarily upregulating the angiogenic (VEGFA) and glycolytic (SLC2A1) pathways. The upregulation of VEGFA mRNA present in both BT474 and MCF-10A cells agrees with previous findings, which showed an increase in endogenous secreted VEGF protein levels via ELISA and VEGF mRNA levels via RT-PCR for the same cell types under similar 24-h hypoxic (defined as 0.5% O2) conditions (Braunstein et al., 2007).
Fig. 4. Response of Breast Epithelial Cells to Hypoxic Culture Conditions.

a) Gene expression analysis of BT474 cells after 24 h of hypoxic or normoxic conditioning (purple and black bars, respectively). Hypoxia-associated genes including HIF1A, VEGFA, SLC2A1 and BNIP3 mRNA measured by qRT-PCR relative to the average expression in normoxic (21% oxygen) controls. n = 4; *p < 0.05. b) Gene expression analysis of MCF-10A cells after 24 h of hypoxic or normoxic conditioning (purple and black bars, respectively). Hypoxia-associated genes including HIF1A, VEGFA, SLC2A1 and BNIP3 mRNA measured by qRT-PCR relative to the average expression in normoxic (21% oxygen) controls. n = 4; *p < 0.05.
While there were consistent increases in VEGFA and SLC2A1 gene expression between the two cell types, in BT474 cells HIF1A expression showed a slight but significant increase, with little change in MCF-10A cells. Because activation of HIF-1 depends in part on post-transcriptional stabilization of HIF-1α (Zhu and Bunn, 1999), its near-absence in mRNA cell samples after 24 h of hypoxic conditioning is unsurprising (Kallio et al., 1997), and the upregulation of downstream reporter genes VEGFA, SLC2A1 and BNIP3 further supports this interpretation. Overall, the 24-h restrictive oxygen conditioning revealed key hypoxia-dependent genes were upregulated within the hypoxia device. These changes were consistent with low oxygen levels that were measured by the iPOB embedded within the Matrigel® containing either BT474 or MCF-10A cells.
4. Conclusion
Microdevices built for in vitro cell culture with iPOBs provide a route to study cells and tissues in more physiologically-relevant oxygen environments. By quickly and accurately monitoring local oxygen concentration in 3D tissue cultures, the oxygen concentration can be manipulated to recapitulate healthy and pathological environments. The reported 3D culture and oxygen monitoring system demonstrated a simple design to remotely monitor oxygen concentration during tissue culture. We recorded fluctuations in the local tissue environment due to external controls (N2 inflow). We demonstrate in situ controllable and reversible oxygen conditions over a relatively short period of time and large oxygen concentration range. As more knowledge concerning the micro-environments surrounding cells is discovered, in vitro cell, tissue and organ models must sustain relevant oxygen levels to generate more “translatable” results.
During the reported validation testing, MCF-10A and BT474 breast epithelial cells revealed distinct differences in response to the same magnitude and duration of hypoxia. IHC analysis showed a significant increase in apoptotic marker cleaved Caspase-3 for both cell types. Genetic analysis differentiated the response of the cell types to hypoxic culture conditions by revealing sizable and significant upregulation of only apoptotic marker BNIP3 for tumorigenic BT474 cells and significant upregulation of both VEGFA and SLC2A1 for MCF-10A cells. The additional upregulation of hypoxia-associated genes VEGFA and SLC2A1 in MCF-10A cells demonstrates that non-tumorigenic breast epithelial cells are more effected by hypoxia, as compared to BT474 cells. Intrinsic markers of hypoxia and their downstream targets provide a mechanistic basis for interpreting cellular response to different oxygen levels. The distinct hypoxic pathways responsible for benign and tumorigenic breast epithelial cell differences could be further investigated using the device and iPOB. With fine control over the oxygen microenvironment, questions concerning the mechanisms influencing cell fate through hypoxic pathways can be answered. When combined with in-line analytical techniques, such as media sampling and imaging, the iPOBs provide a powerful method to remotely measure the interstitial oxygen environment, monitor cell culture performance and study complex phenomena in 3D tissue models.
Supplementary Material
Acknowledgements
This work was done in collaboration with the National Science Foundation (EEC1160483) through a NSF Nanosystems Engineering Research Center (NERC) for Advanced Self-Powered Systems of Integrated Sensors and Technologies (ASSIST). ATY is supported through the NIH Integrative Vascular Biology Traineeship (NIH T32HL069768). The authors would also like to acknowledge Drs. Scott Nichols and Erin Sproul, and Sierra Guidry from Profusa, Inc. for useful training with Profusa software and helpful discussions.
Footnotes
Conflict of interest
KRR, VAP, ATY, PDE, STM and MD declare no competing related financial interests or conflict of interest at the time of the conduct of this study. NAW is an employee and shareholder of Profusa, Inc., South San Francisco, CA.
References
- Acosta MA, Ymele-Leki P, Kostov YV, Leach JB, 2009. Fluorescent microparticles for sensing cell microenvironment oxygen levels within 3D scaffolds. Biomaterials 30 (17), 3068–3074. [DOI] [PMC free article] [PubMed] [Google Scholar]
- Acosta MA, Jiang X, Huang PK, Cutler KB, Grant CS, Walker GM, Gamcsik MP, 2014. A microfluidic device to study cancer metastasis under chronic and intermittent hypoxia. Biomicrofluidics 8 (5). [DOI] [PMC free article] [PubMed] [Google Scholar]
- Adler M, Polinkovsky M, Gutierrez E, Groisman A, 2010. Generation of oxygen gradients with arbitrary shapes in a microfluidic device. Lab Chip 10 (3), 388–391. [DOI] [PMC free article] [PubMed] [Google Scholar]
- Adler M, Erickstad M, Gutierrez E, Groisman A, 2012. Studies of bacterial aerotaxis in a microfluidic device. Lab Chip 12 (22), 4835–4847. [DOI] [PMC free article] [PubMed] [Google Scholar]
- Airley RE, Loncaster J, Raleigh JA, Harris AL, Davidson SE, Hunter RD, West CM, Stratford IJ, 2003. GLUT-1 and CAIX as intrinsic markers of hypoxia in carcinoma of the cervix: relationship to pimonidazole binding. Int. J. Cancer 104 (1), 85–91. [DOI] [PubMed] [Google Scholar]
- Aquino-Parsons C, Luo CM, Vikse CM, Olive PL, 1999. Comparison between the comet assay and the oxygen microelectrode for measurement of tumor hypoxia. Radiother. Oncol 51 (2), 179–185. [DOI] [PubMed] [Google Scholar]
- Bashari MH, Fan F, Vallet S, Sattler M, Arn M, Luckner-Minden C, Schulze-Bergkamen H, Zornig I, Marme F, Schneeweiss A, Cardone MH, Opferman JT, Jager D, Podar K, 2016. Mcl-1 confers protection of Her2-positive breast cancer cells to hypoxia: therapeutic implications. Breast Cancer Res 18 (1), 26. [DOI] [PMC free article] [PubMed] [Google Scholar]
- Bavli D, Prill S, Ezra E, Levy G, Cohen M, Vinken M, Vanfleteren J, Jaeger M, Nahmias Y, 2016. Real-time monitoring of metabolic function in liver-on-chip microdevices tracks the dynamics of mitochondrial dysfunction. Proc. Natl. Acad. Sci. USA 113 (16), E2231–E2240. [DOI] [PMC free article] [PubMed] [Google Scholar]
- Braunstein S, Karpisheva K, Pola C, Goldberg J, Hochman T, Yee H, Cangiarella J, Arju R, Formenti SC, Schneider RJ, 2007. A hypoxia-controlled cap-dependent to cap-independent translation switch in breast cancer. Mol. Cell 28 (3), 501–512. [DOI] [PubMed] [Google Scholar]
- Brizel DM, Scully SP, Harrelson JM, Layfield LJ, Bean JM, Prosnitz LR, Dewhirst MW, 1996. Tumor oxygenation predicts for the likelihood of distant metastases in human soft tissue sarcoma. Cancer Res 56 (5), 941–943. [PubMed] [Google Scholar]
- Byrne MB, Leslie MT, Gaskins HR, Kenis PJA, 2014. Methods to study the tumor microenvironment under controlled oxygen conditions. Trends Biotechnol 32 (11), 556–563. [DOI] [PMC free article] [PubMed] [Google Scholar]
- Carreau A, El Hafny-Rahbi B, Matejuk A, Grillon C, Kieda C, 2011. Why is the partial oxygen pressure of human tissues a crucial parameter? Small molecules and hypoxia. J. Cell Mol. Med 15 (6), 1239–1253. [DOI] [PMC free article] [PubMed] [Google Scholar]
- Chou CC, Coatney RW, 1994. Nutrient-induced changes in intestinal blood flow in the dog. Br. Vet. J 150 (5), 423–437. [DOI] [PubMed] [Google Scholar]
- Chun YS, Adusumilli PS, Fong Y, 2005. Employing tumor hypoxia for oncolytic therapy in breast cancer. J. Mammary Gland Biol. Neoplasia 10 (4), 311–318. [DOI] [PubMed] [Google Scholar]
- Colgan SP, Taylor CT, 2010. Hypoxia: an alarm signal during intestinal inflammation. Nat. Rev. Gastroenterol. Hepatol 7 (5), 281–287. [DOI] [PMC free article] [PubMed] [Google Scholar]
- Cooper PD, Burt AM, Wilson JN, 1958. Critical effect of oxygen tension on rate of growth of animal cells in continuous suspended culture. Nature 182 (4648), 1508–1509. [DOI] [PubMed] [Google Scholar]
- Domansky K, Inman W, Serdy J, Dash A, Lim MHM, Griffith LG, 2010. Perfused multiwell plate for 3D liver tissue engineering. Lab Chip 10 (1), 51–58. [DOI] [PMC free article] [PubMed] [Google Scholar]
- Eastwood D, Gouterma M, 1970. Porphyrins .18. luminescence of (Co), (Ni), Pd, Pt complexes. J. Mol. Spectrosc 35 (3) (359–&). [Google Scholar]
- Ebert BL, Firth JD, Ratcliffe PJ, 1995. Hypoxia and mitochondrial inhibitors regulate expression of glucose transporter-1 via distinct Cis-acting sequences. J. Biol. Chem 270 (49), 29083–29089. [DOI] [PubMed] [Google Scholar]
- Einstein A, 1905. The motion of elements suspended in static liquids as claimed in the molecular kinetic theory of heat. Ann. Phys 17 (8), 549–560. [Google Scholar]
- Einstein A, 1906. The theory of the Brownian motion. Ann. Phys 19 (2), 371–381. [Google Scholar]
- Einstein A, 1907. Theoretical remarks on the Brownian motion. Z. Elktrochem Angew. P 13, 41–42. [Google Scholar]
- Einstein A, 1908. Elementary theory of the Brownian motion. Z. Elktrochem Angew. P 14, 235–239. [Google Scholar]
- Elliott NT, Yuan F, 2011. A review of three-dimensional in vitro tissue models for drug discovery and transport studies. J. Pharm. Sci 100 (1), 59–74. [DOI] [PubMed] [Google Scholar]
- Esteban MA, Maxwell PH, 2005. Manipulation of oxygen tensions for in vitro cell culture using a hypoxic workstation. Expert Rev. Proteom 2 (3), 307–314. [DOI] [PubMed] [Google Scholar]
- Evans SM, Hahn S, Pook DR, Jenkins WT, Chalian AA, Zhang P, Stevens C, Weber R, Weinstein G, Benjamin I, Mirza N, Morgan M, Rubin S, McKenna WG, Lord EM, Koch CJ, 2000. Detection of hypoxia in human squamous cell carcinoma by EF5 binding. Cancer Res 60 (7), 2018–2024. [PubMed] [Google Scholar]
- Forsythe JA, Jiang BH, Iyer NV, Agani F, Leung SW, Koos RD, Semenza GL, 1996. Activation of vascular endothelial growth factor gene transcription by hypoxia-inducible factor 1. Mol. Cell Biol 16 (9), 4604–4613. [DOI] [PMC free article] [PubMed] [Google Scholar]
- Francis P, Namlos HM, Muller C, Eden P, Fernebro J, Berner JM, Bjerkehagen B, Akerman M, Bendahl PO, Isinger A, Rydholm A, Myklebost O, Nilbert M, 2007. Diagnostic and prognostic gene expression signatures in 177 soft tissue sarcomas: hypoxia-induced transcription profile signifies metastatic potential. BMC Genom 8, 73. [DOI] [PMC free article] [PubMed] [Google Scholar]
- Funamoto K, Zervantonakis IK, Liu Y, Ochs CJ, Kim C, Kamm RD, 2012. A novel microfluidic platform for high-resolution imaging of a three-dimensional cell culture under a controlled hypoxic environment. Lab Chip 12 (22), 4855–4863. [DOI] [PMC free article] [PubMed] [Google Scholar]
- Gabai VL, Meng L, Kim G, Mills TA, Benjamin IJ, Sherman MY, 2012. Heat shock transcription factor Hsf1 is involved in tumor progression via regulation of hypoxia-inducible factor 1 and RNA-binding protein HuR. Mol. Cell Biol 32 (5), 929–940. [DOI] [PMC free article] [PubMed] [Google Scholar]
- Gabig TG, Bearman SI, Babior BM, 1979. Effects of oxygen-tension and Ph on the respiratory burst of human-neutrophils. Blood 53 (6), 1133–1139. [PubMed] [Google Scholar]
- Gradin K, McGuire J, Wenger RH, Kvietikova I, fhitelaw ML, Toftgard R, Tora L, Gassmann M, Poellinger L, 1996. Functional interference between hypoxia and dioxin signal transduction pathways: competition for recruitment of the Arnt transcription factor. Mol. Cell Biol 16 (10), 5221–5231. [DOI] [PMC free article] [PubMed] [Google Scholar]
- Hashimoto H, 2010. Study for germination under oxygen partial pressure of 1 kPa. Orig. Life Evol. B 40 (6) (568–568). [Google Scholar]
- Heathman TR, Nienow AW, McCall MJ, Coopman K, Kara B, Hewitt CJ, 2015. The translation of cell-based therapies: clinical landscape and manufacturing challenges. Regen. Med 10 (1), 49–64. [DOI] [PubMed] [Google Scholar]
- Hsiao ST, Lokmic Z, Peshavariya H, Abberton KM, Dusting GJ, Lim SY, Dilley RJ, 2013. Hypoxic conditioning enhances the angiogenic paracrine activity of human adipose-derived stem cells. Stem Cells Dev 22 (10), 1614–1623. [DOI] [PMC free article] [PubMed] [Google Scholar]
- Huang LE, Arany Z, Livingston DM, Bunn HF, 1996. Activation of hypoxia-inducible transcription factor depends primarily upon redox-sensitive stabilization of its alpha subunit. J. Biol. Chem 271 (50), 32253–32259. [DOI] [PubMed] [Google Scholar]
- Ivanovic Z, 2009. Hypoxia or in situ normoxia: the stem cell paradigm. J. Cell Physiol 219 (2), 271–275. [DOI] [PubMed] [Google Scholar]
- Jiang BH, Semenza GL, Bauer C, Marti HH, 1996. Hypoxia-inducible factor 1 levels vary exponentially over a physiologically relevant range of O-2 tension. Am. J. Physiol.-Cell Phys 271 (4), C1172–C1180. [DOI] [PubMed] [Google Scholar]
- Kallio PJ, Pongratz I, Gradin K, McGuire J, Poellinger L, 1997. Activation of hypoxia-inducible factor 1alpha: posttranscriptional regulation and conformational change by recruitment of the Arnt transcription factor. Proc. Natl. Acad. Sci. USA 94 (11), 5667–5672. [DOI] [PMC free article] [PubMed] [Google Scholar]
- Khanal G, Hiemstra S, Pappas D, 2014. Probing hypoxia-induced staurosporine resistance in prostate cancer cells with a microfluidic culture system. Analyst 139 (13), 3274–3280. [DOI] [PMC free article] [PubMed] [Google Scholar]
- Kim JB, Stein R, O’Hare MJ, 2004. Three-dimensional in vitro tissue culture models of breast cancer– a review. Breast Cancer Res. Treat 85 (3), 281–291. [DOI] [PubMed] [Google Scholar]
- Klinger M, Tolbod LP, Gothelf KV, Ogilby PR, 2009. Effect of polymer cross-links on oxygen diffusion in glassy PMMA films. ACS Appl. Mater. Interfaces 1 (3), 661–667. [DOI] [PubMed] [Google Scholar]
- Kothari S, Cizeau J, McMillan-Ward E, Israels SJ, Bailes M, Ens K, Kirshenbaum LA, Gibson SB, 2003. BNIP3 plays a role in hypoxic cell death in human epithelial cells that is inhibited by growth factors EGF and IGF. Oncogene 22 (30), 4734–4744. [DOI] [PubMed] [Google Scholar]
- Kristian T, 2004. Metabolic stages, mitochondria and calcium in hypoxic/ischemic brain damage. Cell Calcium 36 (3–4), 221–233. [DOI] [PubMed] [Google Scholar]
- Lasfargues EY, Coutinho WG, Redfield ES, 1978. Isolation of two human tumor epithelial cell lines from solid breast carcinomas. J. Natl. Cancer Inst 61 (4), 967–978. [PubMed] [Google Scholar]
- Lee GY, Kenny PA, Lee EH, Bissell MJ, 2007. Three-dimensional culture models of normal and malignant breast epithelial cells. Nat. Methods 4 (4), 359–365. [DOI] [PMC free article] [PubMed] [Google Scholar]
- Lee JM, Grabb MC, Zipfel GJ, Choi DW, 2000. Brain tissue responses to ischemia. J. Clin. Investig 106 (6), 723–731. [DOI] [PMC free article] [PubMed] [Google Scholar]
- Lind Due V, Bonde J, Kann T, Perner A, 2003. Extremely low oxygen tension in the rectal lumen of human subjects. Acta Anaesthesiol. Scand 47 (3), 372. [DOI] [PubMed] [Google Scholar]
- Livak KJ, Schmittgen TD, 2001. Analysis of relative gene expression data using real-time quantitative PCR and the 2(-Delta Delta C(T)) Method. Methods 25 (4), 402–408. [DOI] [PubMed] [Google Scholar]
- Lo LW, Koch CJ, Wilson DF, 1996. Calibration of oxygen-dependent quenching of the phosphorescence of Pd-meso-tetra (4-carboxyphenyl) porphine: a phosphor with general application for measuring oxygen concentration in biological systems. Anal. Biochem 236 (1), 153–160. [DOI] [PubMed] [Google Scholar]
- Mathew SA, Chandravanshi B, Bhonde R, 2017. Hypoxia primed placental mesenchymal stem cells for wound healing. Life Sci 182, 85–92. [DOI] [PubMed] [Google Scholar]
- Matsumura T, Kauffman FC, Meren H, Thurman RG, 1986. O-2 Uptake in Periportal and Pericentral Regions of Liver Lobule in Perfused Liver. Am. J. Physiol 250 (6), G800–G805. [DOI] [PubMed] [Google Scholar]
- McKeown SR, 2014. Defining normoxia, physoxia and hypoxia in tumours-implications for treatment response. Br. J. Radiol 87 (1035). [DOI] [PMC free article] [PubMed] [Google Scholar]
- Montero-Baker MF, Au-Yeung KY, Wisniewski NA, Gamsey S, Morelli-Alvarez L, Mills JL Sr., Campos M, Helton KL, 2015. The First-in-Man “Si Se Puede” Study for the use of micro-oxygen sensors ) (MOXYs) to determine dynamic relative oxygen indices in the feet of patients with limb-threatening ischemia during endovascular therapy. J. Vasc. Surg 61 (6), 1501–1509 (e1501). [DOI] [PubMed] [Google Scholar]
- Nelson CM, Bissell MJ, 2005. Modeling dynamic reciprocity: engineering three-dimensional culture models of breast architecture, function, and neoplastic transformation. Semin Cancer Biol 15 (5), 342–352. [DOI] [PMC free article] [PubMed] [Google Scholar]
- Pauley RJ, Soule HD, Tait L, Miller FR, Wolman SR, Dawson PJ, Heppner GH, 1993. The MCF10 family of spontaneously immortalized human breast epithelial cell lines: models of neoplastic progression. Eur. J. Cancer Prev 2 (Suppl 3), S67–S76. [PubMed] [Google Scholar]
- Post DE, Van Meir EG, 2003. A novel hypoxia-inducible factor (HIF) activated oncolytic adenovirus for cancer therapy. Oncogene 22 (14), 2065–2072. [DOI] [PubMed] [Google Scholar]
- Quinn P, 2014. Culture Media, Solutions, and Systems in Human ART Cambridge University Press, Cambridge, New York. [Google Scholar]
- Richter A, Sanford KK, Evans VJ, 1972. Influence of oxygen and culture media on plating efficiency of some mammalian tissue cells. J. Natl. Cancer Inst 49 (6), 1705–1712. [DOI] [PubMed] [Google Scholar]
- Rumsey WL, Vanderkooi JM, Wilson DF, 1988. Imaging of phosphorescence: a novel method for measuring oxygen distribution in perfused tissue. Science 241 (4873), 1649–1651. [DOI] [PubMed] [Google Scholar]
- Saglio PH, Drew MC, Pradet A, 1988. Metabolic acclimation to anoxia induced by low (2–4 Kpa Partial-Pressure) oxygen pretreatment (Hypoxia) in Root-Tips of Zea-Mays. Plant Physiol 86 (1), 61–66. [DOI] [PMC free article] [PubMed] [Google Scholar]
- Schneider CA, Rasband WS, Eliceiri KW, 2012. NIH Image to ImageJ: 25 years of image analysis. Nat. Methods 9 (7), 671–675. [DOI] [PMC free article] [PubMed] [Google Scholar]
- Secomb TW, Hsu R, Dewhirst MW, Klitzman B, Gross JF, 1993. Analysis of oxygen transport to tumor tissue by microvascular networks. Int. J. Radiat. Oncol. Biol. Phys 25 (3), 481–489. [DOI] [PubMed] [Google Scholar]
- Semenza GL, 2010. Vascular responses to hypoxia and ischemia. Arterioscler. Thromb. Vasc. Biol 30 (4), 648–652. [DOI] [PMC free article] [PubMed] [Google Scholar]
- Semenza GL, Agani F, Iyer N, Jiang BH, Leung S, Wiener C, Yu A, 1998. Hypoxia-inducible factor 1: from molecular biology to cardiopulmonary physiology. Chest 114 (1 Suppl), 40S–45S. [DOI] [PubMed] [Google Scholar]
- Shephard RJ, 1966. The oxygen cost of breathing during vigorous exercise. Q. J. Exp. Physiol. Cogn. Med. Sci 51 (4), 336–350. [DOI] [PubMed] [Google Scholar]
- von Smoluchowski M, 1906. The kinetic theory of Brownian molecular motion and suspensions. Ann. Phys 21 (14), 756–780. [Google Scholar]
- Thienpont B, Steinbacher J, Zhao H, D’Anna F, Kuchnio A, Ploumakis A, Ghesquiere B, Van Dyck L, Boeckx B, Schoonjans L, Hermans E, Amant F, Kristensen VN, Peng Koh K, Mazzone M, Coleman M, Carell T, Carmeliet P, Lambrechts D, 2016. Tumour hypoxia causes DNA hypermethylation by reducing TET activity. Nature 537 (7618), 63–68. [DOI] [PMC free article] [PubMed] [Google Scholar]
- Toussaint O, Weemaels G, Debacq-Chainiaux F, Scharffetter-Kochanek K, Wlaschek M, 2011. Artefactual effects of oxygen on cell culture models of cellular senescence and stem cell biology. J. Cell Physiol 226 (2), 315–321. [DOI] [PubMed] [Google Scholar]
- Tredan O, Galmarini CM, Patel K, Tannock IF, 2007. Drug resistance and the solid tumor microenvironment. J. Natl. Cancer Inst 99 (19), 1441–1454. [DOI] [PubMed] [Google Scholar]
- Uchida T, Rossignol F, Matthay MA, Mounier R, Couette S, Clottes E, Clerici C, 2004. Prolonged hypoxia differentially regulates hypoxia-inducible factor (HIF)-1alpha and HIF-2alpha expression in lung epithelial cells: implication of natural antisense HIF-1alpha. J. Biol. Chem 279 (15), 14871–14878. [DOI] [PubMed] [Google Scholar]
- van Stroe-Biezen SAM, Everaerts FM, Janssen LJJ, Tacken RA, 1993. Diffusion coefficients of oxygen, hydrogen peroxide and glucose in a hydrogel. Anal. Chim. Acta 273 (1–2), 553–560. [Google Scholar]
- Vanderkooi JM, Wilson DF, 1986. A new method for measuring oxygen concentration in biological systems. Adv. Exp. Med. Biol 200, 189–193. [DOI] [PubMed] [Google Scholar]
- Vinogradov S, Wilson DF, 2002. Porphyrin Compounds for Imaging Tissue Oxygen In: States., U. (Ed.). The Trustees of the University of Pennsylvania. [Google Scholar]
- Vinogradov SA, Grosul P, Rozhkov V, Dunphy I, Shuman L, Dugan BW, Evans S, Wilson DF, 2003. Oxygen distributions in tissue measured by phosphorescence quenching. Adv. Exp. Med. Biol 510, 181–185. [DOI] [PubMed] [Google Scholar]
- Walsh JC, Lebedev A, Aten E, Madsen K, Marciano L, Kolb HC, 2014. The clinical importance of assessing tumor hypoxia: relationship of tumor hypoxia to prognosis and therapeutic opportunities. Antioxid. Redox Signal 21 (10), 1516–1554. [DOI] [PMC free article] [PubMed] [Google Scholar]
- Wang GL, Jiang BH, Rue EA, Semenza GL, 1995. Hypoxia-inducible factor 1 is a basic-helix-loop-helix-PAS heterodimer regulated by cellular O2 tension. Proc. Natl. Acad. Sci. USA 92 (12), 5510–5514. [DOI] [PMC free article] [PubMed] [Google Scholar]
- Wenger RH, Kurtcuoglu V, Scholz CC, Marti HH, Hoogewijs D, 2015. Frequently asked questions in hypoxia research. Hypoxia 3, 35–43. [DOI] [PMC free article] [PubMed] [Google Scholar]
- Wigerup C, Pahlman S, Bexell D, 2016. Therapeutic targeting of hypoxia and hypoxia-inducible factors in cancer. Pharmacol. Ther 164, 152–169. [DOI] [PubMed] [Google Scholar]
- Wilson DF, Vinogradov SA, Grosul P, Sund N, Vacarezza MN, Bennett J, 2006. Imaging oxygen pressure in the rodent retina by phosphorescence lifetime. Adv. Exp. Med. Biol 578, 119–124. [DOI] [PMC free article] [PubMed] [Google Scholar]
- Wisniewski NA, Nichols SP, Gamsey SJ, Pullins S, Au-Yeung KY, Klitzman B, Helton KL, 2017. Tissue-integrating oxygen sensors: continuous tracking of tissue hypoxia. Adv. Exp. Med. Biol 977, 377–383. [DOI] [PMC free article] [PubMed] [Google Scholar]
- Wu D, Yotnda P, 2011. Induction and testing of hypoxia in cell culture. J. Vis. Exp 54. [DOI] [PMC free article] [PubMed] [Google Scholar]
- Zhang C, Samanta D, Lu H, Bullen JW, Zhang H, Chen I, He X, Semenza GL, 2016. Hypoxia induces the breast cancer stem cell phenotype by HIF-dependent and ALKBH5-mediated m(6)A-demethylation of NANOG mRNA. Proc. Natl. Acad. Sci. USA 113 (14), E2047–E2056. [DOI] [PMC free article] [PubMed] [Google Scholar]
- Zhu H, Bunn HF, 1999. Oxygen sensing and signaling: impact on the regulation of physiologically important genes. Respir. Physiol 115 (2), 239–247. [DOI] [PMC free article] [PubMed] [Google Scholar]
Associated Data
This section collects any data citations, data availability statements, or supplementary materials included in this article.