

Abstract
INTRODUCTION:
Converging evidence suggests electroconvulsive therapy (ECT) induces neuroplasticity in patients with severe depression, though how this relates to antidepressant response is less clear. Arterial spin-labeled (ASL) functional MRI (fMRI) tracks absolute changes in cerebral blood flow (CBF) linked with brain function, and offers a potentially powerful tool when observing neurofunctional plasticity with fMRI.
METHODS:
Using ASL-fMRI, we measured global and regional CBF associated with clinically prescribed ECT and therapeutic response in patients (n=57, 30 female) before ECT, after two treatments, after completing an ECT treatment “index” (~4 weeks), and after long-term follow-up (6 months). Age- and sex-matched controls were also scanned twice (n=36, 19 female), ~4 weeks apart.
RESULTS:
Patients with lower baseline global CBF were more likely to respond to ECT. Regional CBF increased in the right anterior hippocampus in all patients irrespective of clinical outcome, both after 2 treatments and after ECT index. However, hippocampal CBF increases post-index were more pronounced in nonresponders. ECT responders exhibited CBF increases in the dorsomedial thalamus and motor cortex near the vertex ECT electrode, as well as decreased CBF within lateral fronto-parietal regions.
CONCLUSIONS:
ECT induces functional neuroplasticity in the hippocampus, which could represent functional precursors of ECT-induced increases in hippocampal volume reported previously. However, excessive functional neuroplasticity within the hippocampus may not be conducive to positive clinical outcome. Instead, our results suggest that, although hippocampal plasticity may contribute to antidepressant response in ECT, balanced plasticity in regions relevant to seizure physiology including thalamo-cortical networks may also play a critical role.
Keywords: electroconvulsive therapy, depression, seizure, fMRI, cerebral blood flow, hippocampus
INTRODUCTION
Electroconvulsive therapy (ECT) is an effective intervention for severe major depression, with response rates (50–80%) and response times (≤1 month) superior to other currently available treatments (1–3). With ECT, a controlled transient seizure is elicited every 2–3 days over 2–4 weeks with anesthesia and muscle relaxants, and is sometimes followed by maintenance treatments after the ECT index phase (4). Although generalized seizures are elicited, a growing body of evidence suggests that ECT induces structural and functional neuroplasticity in specific brain structures and networks, though how these changes relate to therapeutic response remains less clear (5–11).
An increasing number of neuroimaging studies have addressed the neural effects of ECT, implicating several regions throughout the brain. ECT-related hippocampal volume enlargements are most replicated (10, 11), complementing reports of decreased hippocampal volume in depression (12) and functional plasticity in hippocampal networks with ECT (13, 14). Electroconvulsive shock, the animal model of ECT, is shown to promote neurotrophic effects including hippocampal neurogenesis (15, 16), which may explain neuroplastic effects in humans. However, links between hippocampal plasticity and symptom improvement in ECT are less replicated and a subject of debate (17, 18). Further, ECT-related changes in several other brain regions have been identified, including the ACC (7–9, 19), thalamus (5, 20–22), basal ganglia (14, 23), and amygdala (11, 24). A complete mechanistic understanding of ECT and its success as an antidepressant treatment thus remains elusive.
A critical issue in ECT research is parsing the nonspecific effects of ECT from those effects related to (and perhaps responsible for) antidepressant response to ECT. Although considered the “gold standard” treatment for intractable major depression, not all patients respond to ECT; for example, just over half (55–65%) experience remission when using right- unilateral ECT with optimal parameters (25, 26). Therefore, brain networks affected by ECT-induced seizures in all patients may differ from, or only partially overlap, networks supporting improved depressive symptoms. Previously reported ECT-related effects may thus not underlie clinical outcome, but instead reflect nonspecific physiological effects of ECT.
In the current study, we use arterial spin-labeled (ASL) perfusion fMRI to track absolute changes in cerebral blood flow (CBF) at rest (i.e., “functional neuroplasticity”) associated with the lasting effects of ECT itself, as well as antidepressant response to ECT. Application of ASL-fMRI offers a novel, complementary contribution to existing functional neuroimaging literature with certain advantages. Most importantly, ASL-fMRI offers an absolute measure of brain function like positron emission tomography (PET) and single-photon emission computed tomography (SPECT), but without the use of radioactive tracers and with greater spatial resolution. Since ASL-fMRI offers an absolute metric of blood flow (i.e., mL/min/100g), it provides an important advantage over more widely used blood-oxygenation-level-dependent (BOLD) fMRI, where relative metrics (i.e., arbitrary units) indirectly estimate brain function by determining: A) changes in BOLD signal between active and rest or baseline conditions, or B) correlations in BOLD timecourses amongst brain regions to infer “functional connectivity.” Thus, ASL-fMRI is particularly well-suited for multi-session longitudinal studies, where CBF changes can be more directly interpreted as changes in brain function over time. To our knowledge, no previous ECT studies have measured CBF changes with ASL-fMRI, and thus ours constitutes a novel contribution to the field.
Here, we measure global and regional CBF with ASL-fMRI in depressed patients followed prospectively while receiving ECT, as well as non-depressed control volunteers not receiving treatment. We report CBF changes associated with ECT and therapeutic response occurring after the initial 2 ECT sessions and after the ECT “index” treatment series. We hypothesized that, while some CBF changes would occur in all patients regardless of ECT outcome, separable brain regions would associate with positive antidepressant response. We also explored the extent to which acute and postindex functional neuroplasticity is maintained 6-months after treatment. Finally, because CBF measured with ASL-fMRI can be related to tissue content (27), we explored relationships, if any, between CBF and gray-matter (GM) plasticity.
MATERIALS AND METHODS
Subjects
Patients (n=57) and demographically similar non-depressed volunteers (n=36) gave informed written consent to participate in this UCLA IRB-approved study. All patients were diagnosed as experiencing a major depressive episode (MDE; DSM-IV-TR(28)), and were treatment refractory (i.e., did not respond to 2+ prior antidepressant therapies). Patients with comorbid psychiatric or neurological disorders, or concurrent serious illness were excluded. All patients ceased psychotropic medications (antidepressants and benzodiazepines) at least 48–72 hours prior to and for the duration of the index treatment, and had not received neuromodulation treatment within 6 months prior. For healthy volunteers, exclusion criteria included any history of serious illness, neurological disorders, or psychiatric disorders (Mini-International Neuropsychiatric Interview (29)).
Depressive symptoms were assessed in patients using the Hamilton Depression Inventory (17-item) (30), Montgomery Asberg Depression Rating Scale (31), and Quick Inventory of Depressive Symptomatology (32). Scores on these inventories were highly intercorrelated; therefore, clinical response was characterized using a composite score calculated as the mean proportional change between baseline and post-ECT-index scores (averaged across the three scales). ECT responders were identified as having >50% reduction in composite depression scores after ECT index (33). Prior publications including participants overlapping with the current cohort reported ECT-related structural (7, 11, 23, 34), functional (14, 35, 36), and neurochemical (37, 38) changes, and evaluation of cognitive measures (39).
Study Visits and ECT
Patients volunteered for this research study before initiating a clinically prescribed course of right-unilateral ECT (Supplemental Methods); 20 were transitioned to bilateral electrode placement per clinical determination (Table 1). Patients completed four MRI scans: 1) within 24 hours before first ECT session (baseline), 2) immediately before their third ECT appointment (~4 days after baseline), 3) after their clinically determined ECT index series (~4 weeks after baseline), and 4) approximately 6 months after ECT index. Non-depressed volunteers completed two MRIs approximately 4 weeks apart.
Table 1.
Demographic and clinical information
| Depressed | Controls | |||||
|---|---|---|---|---|---|---|
| Sample Size | n = 57 | n = 36 | ||||
| Age, mean (SD) | 41.42 (12.98) | 39.06 (12.29) | ||||
| Sex, females/males | 30/27 | 19/17 | ||||
| Clinical Information | ||||||
| Diagnosis, unipolar/bipolar | 47/10 | |||||
| ECT lead placement, only-RUL/other | 37/20 | |||||
| ECT outcome (any scale), responder/nonresponder | 25/21 | |||||
| ECT outcome (composite), responder/nonresponder | 19/27 | |||||
| Age at 1st diagnosed depressive episode, mean (SD) | 25.30 (11.46) | |||||
| Study Visits | Baseline | Post-2tx | Post-Index/4wk | Post-6mo | Baseline | Post-4wk |
| HAM-17, mean (SD) | 23.88 (5.94) | 18.08 (6.93)a | 13.26 (7.46) a,b | 11.52 (8.22)a | ||
| MADRS, mean (SD) | 37.64 (8.49) | 29.0 (10.97) a | 19.05 (11.26) a,b | 16.81 (12.76)a | ||
| QIDS-SR, mean (SD) | 19.75 (4.12) | 15.84 (5.99) a | 11.26 (5.77) a,b | 10.48 (6.30) a | ||
| Corrected Sample Size (after attrition and MRI QC) | n = 57 | n = 51 | n = 43 | n = 27 | n = 32 | n = 33 |
Results of paired t-tests for depression scores are indicated as follows:
significant difference between baseline and follow-up, p < 0.0001
Significant difference from previous visit, p < 0.005; Baseline depression scores were missing for a single volunteer due to clerical error, and this volunteer was not included in any calculations or analyses requiring depression scores
Image Acquisition and Preprocessing
ASL functional and T1-weight anatomical images were acquired using a 3T Siemens Allegra scanner (Supplemental Methods). ASL images were first corrected for motion (FSL; FMRIB, Functional MRI of the Brain), and then CBF was quantified using the simple subtraction method in ASLtoolbox (27). CBF images were registered to T1-weighted anatomical scans and MNI templates including interpolation to 2×2×2 mm3 resolution using SPM8 (Wellcome Trust Centre for Neuroimaging) and smoothed (6mm FWHM Gaussian kernel, FSL). Images were then averaged to yield a single CBF image per session for subsequent analysis. Voxelwise gray matter volume (GMV) was calculated in SPM8 during standard MNI normalization processes. Upon visual inspection, 7 baseline (3 patients, 4 controls) and 13 follow-up (10 patients, 3 controls) ASL scans were identified to have poor quality (i.e., susceptibility artifacts, slice artifacts, and/or global CBF <20 mL/100g/min) and were not analyzed further (Table 1). After preprocessing and normalization, ASL images were masked using SPM8’s GM template (>20% probability GM classification), and to ensure a common field of view (ASL pseudo-BOLD value > 100 (27) for all images). Because the ASL-fMRI field-of-view did not include the entire cerebellum in all subjects, this mask did not include the cerebellum. Global CBF was calculated by averaging voxelwise CBF within this mask for each ASL-CBF image. GMV was similarly calculated by averaging voxelwise GMV within the mask for each GMV image.
Statistical Analyses
All statistical analyses were completed in R (https://www.r-project.org). See Supplemental Methods for additional details. Global CBF was analyzed with linear mixed-effects models, targeting a main effect of time (a fixed categorical factor including all four timepoints) and ECT response (fixed factor) in depressed patients. Nuisance factors included age, ECT lead placement (percentage right-unilateral), total number of treatments (fixed factors), and subject (random factor). Pairwise comparisons were applied post hoc to assess significant change between timepoints in patients, as well as between patients and controls (nuisance factors: age, global GMV).
Regional (voxelwise) CBF was analyzed with two omnibus linear mixed-effects models, which specifically targeted changes hypothesized to be most neurobiologically relevant to ECT and therapeutic response. These were: (1) changes that occurred acutely (pre-treatment vs. after two ECT treatments), and (2) changes that occurred after treatment (pretreatment vs. after ECT index). Here, time was the fixed factor of interest, and nuisance factors included age, change in depression score after ECT index, ECT lead placement, total number of treatments (fixed factors), and subject (random factor). These models examined effects of ECT on brain function irrespective of antidepressant response; thus, change in depression score post-index was a nuisance variable in this analysis. In these voxelwise analyses, a cluster-level correction of p(corr) < 0.05 was applied using random field theory (40), with voxelwise threshold p < 0.01.
In clusters identified by voxelwise tests, post-hoc region of interest (ROI) analyses assessed whether the results of the omnibus tests were influenced by tissue content (Supplemental Methods). These analyses used the same linear mixed effects models described above, but included mean GMV (calculated using SPM8 as described above) for each ROI as an additional fixed nuisance factor. Pairwise post-hoc ROI tests compared CBF between relevant timepoints; each timepoint was compared to baseline and its immediate precursor using the same linear mixed effects models to yield five distinct tests per ROI. The Bonferroni method corrected for the number of tests performed at each ROI. Post-hoc ROI tests also compared GMV across timepoints, also using the same statistical models and Bonferroni-correction, but including mean CBF for each ROI as a nuisance factor.
Additional ROI analyses were applied to CBF data in healthy controls, for each region defined by the previously described omnibus analyses. First, linear mixed-effects models measured possible CBF change in each region in healthy controls (baseline vs. after 4 weeks), with age and GMV as fixed nuisance factors and subject as a random nuisance factor. Second, CBF was compared between healthy controls and depressed patients, with age and GMV as fixed nuisance factors.
Finally, exploratory analyses attempted to identify regional (voxelwise) CBF changes associated with antidepressant response. Here, we separated depressed patients into responders and nonresponders to ECT as described in the Subjects section. In these analyses, we examined changes between baseline and post-index CBF, using the same voxelwise and post-hoc ROI statistical tests described above.
RESULTS
Demographic and clinical variables
Depression scores improved significantly after ECT index (p < 0.00001 for all), with 22 of 42 of patients exhibiting at least a 50% reduction in depression scores and 16 patients meeting criteria for remission on any symptom inventory (Table 1; see also Table S1). Patients and healthy controls did not differ in age or sex (p > 0.05 for both).
Global CBF
Global CBF did not change over time in patients or controls, nor was there a significant response-by-time interaction in patients (p > 0.05, Figure 1). However, there was an overall effect of response, such that CBF was elevated in patients who did not respond to ECT (p = 0.02×10⁻¹⁴).
Figure 1.
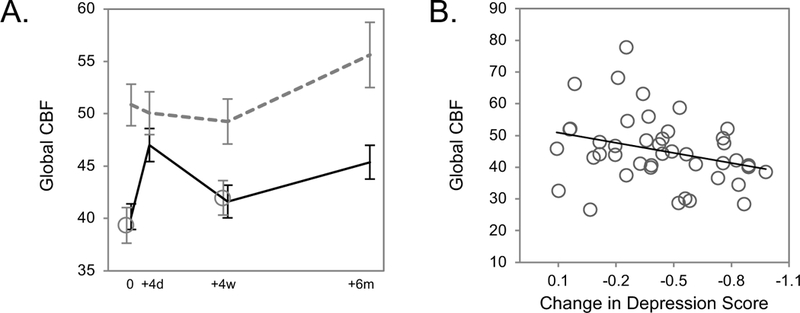
Global CBF and antidepressant response to ECT. A. Mean global CBF is plotted for responders (R, black solid line) and nonresponders (NR, gray dashed lines) to ECT, measured before treatment (“0”), after 2 treatments or approximately four days later (“+4d”), after ECT index approximately four weeks after baseline (“+4w”), and 6 months after finishing ECT treatment (“+6m”). Global CBF is also plotted for healthy control volunteers (HC, open gray circles), measured at baseline and approximately 4 weeks later (HC did not receive ECT). Error bars reflect standard error. B. Baseline global CBF is plotted for each patient against change in depression scores after ECT treatment (where −1 = 100% reduction/improvement). Regression line highlights a modest negative correlation between these values, p = 0.02.
In pairwise comparisons conducted post hoc separately for responders and nonresponders (Figure 1A), global CBF was elevated in nonresponders at baseline compared to both responders (p = 0.004) and healthy controls (p = 0.027), while baseline global CBF was not different between responders and controls (p = 0.541). Global CBF was also elevated in nonresponders after ECT index (vs. controls p = 0.027; vs. responders p = 0.06) and at the 6-month follow-up visit at the trend level (vs. controls p = 0.056 vs. responders p = 0.177). However, global CBF did not differ between responders and nonresponders after 2 treatments (p = 0.181), indicating an acute increase in global CBF occurred in responders at this timepoint (p = 0.003).
In analyses addressing the relationship between baseline global CBF and ECT response, change in depression scores after ECT index correlated with baseline global CBF (i.e., patients with lower baseline CBF were more likely to improve, Figure 1B).
Regional CBF: acute changes after 2 ECT sessions
In all depressed patients, acute CBF increases were noted in the right anterior hippocampus, and CBF decreases were identified in the dorsal caudate after two ECT treatments (Figure 2). This cluster did not appear to overlap the amygdala (e.g., Figure 2A, bottom left panel), though previous studies demonstrated ECT effects in this region (24, 41, 42). These acute effects persisted in post hoc ROI analyses when controlling for GMV. Additional pairwise comparisons between other timepoints indicated that CBF remained significantly elevated in the right anterior hippocampus after ECT index and 6 months post-index compared to baseline measurements (Figure 2B). Notably, regional GMV in this anterior hippocampal region increased after ECT index as indicated previously for this dataset (41) and others (13, 24, 43, 44); however GMV did not significantly increase acutely (after 2 sessions Figure 2C, left panel). Post-hoc analyses also indicated that acute CBF decreases in bilateral dorsal caudate returned to baseline levels after ECT index, and this transient CBF decrease was accompanied by a transient increase in GMV. Coordinates for these and all other analyses are displayed in Table 2.
Figure 2.
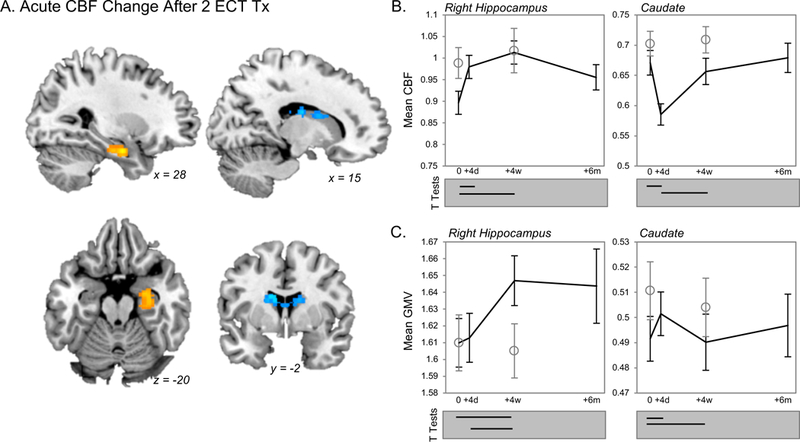
Acute regional CBF change after two treatments. A. Basal brain function measured with CBF increased in right anterior hippocampus after 2 ECT treatments (orange), and decreased in bilateral dorsal basal ganglia (caudate, blue voxels). B & C. Mean regional CBF (corrected for global CBF) and mean regional GM volume (GMV, corrected for global GM) are plotted for the significant results shown in A at top (B) and bottom (C) panels, respectively. Data for patients is plotted in black lines; open circles reflect data from healthy controls. The results of post-hoc pairwise comparisons amongst timepoints of interest in patients are indicated below each graph (Bonferroni corrected, p(corr) < 0.05).
Table 2.
Regional CBF change with ECT
| Model Effect | Anatomical Location | MNI Coordinates (Center of Gravity) |
Volume (mm3) |
p, RFT corrected |
||
|---|---|---|---|---|---|---|
| X | Y | Z | ||||
| Baseline vs. +2tx | Right hippocampus | 31.2 | −13.1 | −24.8 | 370 | 0.0328 |
| Caudate | −2.7 | −9.3 | 19.5 | 797 | 0.000188 | |
| Baseline vs. post-ECT (+4wks) | Right hippocampus | 34.3 | −15.1 | −21.1 | 550 | 0.00785 |
| Left putamen & accumbens | −19.3 | 3.3 | −2.9 | 622 | 0.00363 | |
| Right putamen & accumbens | 21.1 | 2.8 | −2.9 | 477 | 0.0177 | |
| Responders Only, Baseline vs. post-ECT (+4wks) | Left thalamus Left somatomotor cortex |
−10.9 −22.7 |
−14.5 −10.2 |
−3.0 60.4 |
1133 879 |
2.50E-06 3.68E-05 |
| Left occipital cortex | −13.7 | −90.5 | 0.6 | 321 | 0.0438 | |
| Right angular gyrus | 49.4 | −50.2 | 24.0 | 2260 | 1.09E-10 | |
| Right frontal operculum | 43.6 | 13.0 | 3.1 | 457 | 0.00622 | |
| Precuneus | 3.3 | −50.2 | 66.7 | 344 | 0.031 | |
| Nonresponders Only, Baseline vs. post-ECT (+4wks) | Right hippocampus & accumbens Posterior cingulate cortex | 29.7 −7.3 |
−5.1 −58.3 |
−13.8 33.3 |
1931 843 |
1.79E-07 0.000767 |
Regional CBF: changes after ECT index
After ECT index, CBF increased in the anterior portion of the right hippocampus (Figure 3A), extending slightly more posteriorly than the site of acute change described above. Post-hoc ROI analyses indicated CBF increases occurred both acutely and post-index when controlling for GM content (Figure 3B), with corresponding GM increases occurring after ECT index that were maintained for 6 months after index (Figure 3C).
Figure 3.
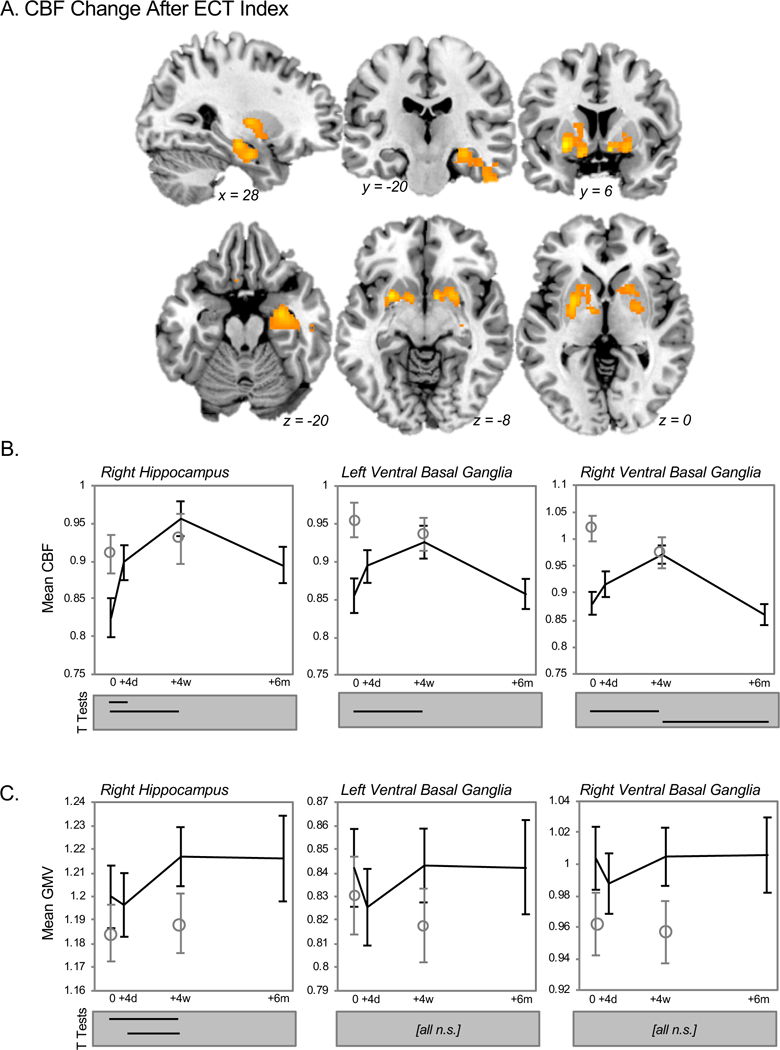
Regional CBF change after ECT treatment (index series). A. Basal brain function measured with CBF increased in three regions after ECT treatment (orange), including the right anterior hippocampus and bilateral ventral basal ganglia. B & C. Mean regional CBF (corrected for global CBF) and mean regional GM volume (GMV, corrected for global GM) are plotted for three regions surviving cluster-level thresholding at top (B) and bottom (C) panels, respectively. Black lines reflect means for patients, open circles plot means for healthy controls, and standard error bars are plotted for both groups. The results of post-hoc pairwise comparisons amongst time-points of interest are indicated below each graph (p(corr) < 0.05, Bonferroni correction). Note that analyses of CBF shown in B statistically control for cluster GMV, and vice versa for panel C.
CBF increases were also observed in bilateral ventral basal ganglia, overlapping the ventral striatum and pallidum (Figure 3A). Here, post-hoc tests indicated that post-index CBF increases persisted when controlling for GMV (Figure 3B). GMV did not change significantly in these regions over time (Figure 3C).
Exploring regional CBF with respect to antidepressant outcome
In exploratory analyses targeting regional CBF separately in patients who responded to ECT, CBF increases were noted in the bilateral thalamus and left somatomotor cortex after ECT index, while decreases were observed in lateral parietal and inferior frontal cortices, as well as the precuneus (Figure 4A). These effects persisted in post-hoc analyses controlling for regional GMV. CBF did not change significantly in these regions in ECT-nonresponders or controls. Notably, CBF in bilateral thalamus was lower in ECT-responders prior to treatment when compared to both nonresponders and controls.
Figure 4.
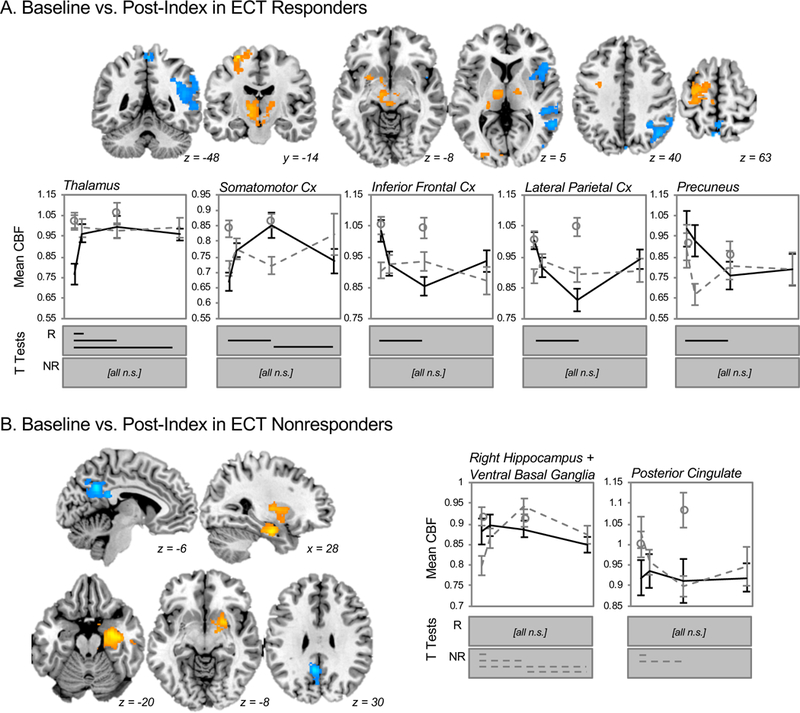
Exploratory analyses yielded different patterns of regional CBF change after ECT treatment (index series) in Responders and Nonresponders. A. In ECT responders, basal brain function measured with CBF increased in the thalamus, brainstem, and left somatomotor cortex after ECT treatment (orange), and decreased the regions of the right lateral frontal and parietal cortex (blue). Mean CBF values (corrected for global CBF) are plotted for each region below, with solid black lines indicating responders, gray dashed lines indicating nonresponders, and open circles reflecting data from healthy controls. Error bars mark standard error. Statistically significant (p(corr) < 0.05, Bonferroni correction) changes over time are plotted for responders in solid black lines (R, top); nonresponders and healthy controls did not change over time (n.s.). B. Regions of significant change in CBF after ECT index are shown for nonresponders, including increased CBF (orange) in right hippocampus and bilateral ventral basal ganglia and decreased CBF in posterior cingulate cortex (blue). At right, mean CBF (corrected for global values) are plotted for responders in black, nonresponders in gray dashed lines, and for healthy controls in open circles. Again, error bars reflect standard error. Significant pairwise tests for these regions are indicated below each plot for nonresponders in gray dashed lines (p(corr) < 0.05, Bonferroni correction); responders and healthy controls did not change over time (n.s.).
By contrast, ECT nonresponders exhibited CBF increases after ECT index in a large cluster overlapping the right anterior hippocampus and ventral striatum, along with CBF decreases in the posterior cingulate cortex and inferior precuneus (Figure 4B). These effects were robust to tissue-content in post-hoc tests, and did not change in responders or controls over time.
DISCUSSION
Understanding the mechanisms of antidepressant response is paramount to developing more effective treatments for depression. In our study, we targeted ECT, arguably the most effective fast-acting treatment for severe depression, using ASL-fMRI, a powerful and novel quantitative functional neuroimaging technique. Our data demonstrate that ECT is associated with increased CBF in a subregion of the right anterior hippocampus in all patients regardless of antidepressant outcome. Notably, hippocampal CBF increased acutely after only two treatments, and appeared to precede associated GM increases reported previously (24, 41, 43, 44). Furthermore, robust hippocampal and striatal plasticity in our study was associated with poor clinical response to ECT, while successful antidepressant response was linked to functional changes in other structures like the dorsomedial thalamus and cortical regions. Taken together, our results suggest that a balance between functional plasticity in brain regions located near the right-temporal ECT electrode (hippocampus, striatum) and plasticity in regions near the vertex electrode and associated with seizure generalization (dorsal thalamus and cortex) is key to successful clinical outcome in right-unilateral ECT (Figure 5). Our results also indicate that excessive hippocampal plasticity may not be a biomarker of positive ECT outcome.
Figure 5.
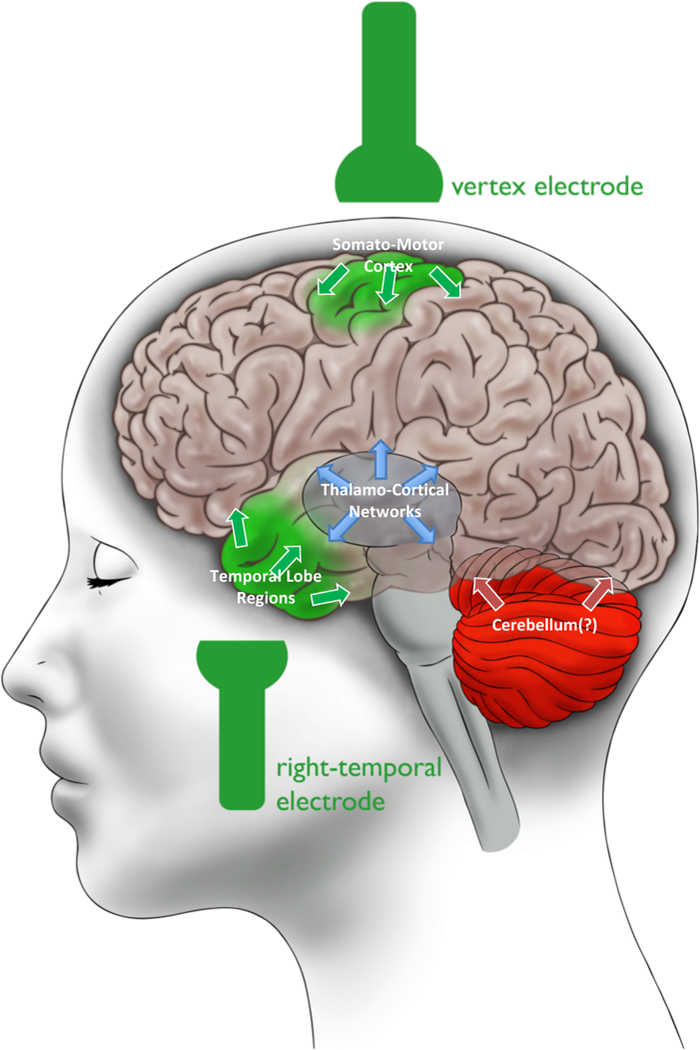
Results Summary: Balanced Long-Term Neuroplastic Effects in ECT. We propose that a balance in functional neuroplasticity in brain regions associated with the three well-known stages of seizure progression - initiation (green), generalization (blue), and termination (red) - may be an indicator of positive antidepressant response to ECT. This schematic summarizes the results of our study in ECT responders, who exhibited CBF changes in right hippocampus and somato-motor cortex (green) and thalamo-cortical regions (blue). The cerebellum (red) was not measured (as indicated by the question mark), but has been linked to seizure termination in previous studies and may also play a role in ECT.
Global vs. Regional Neurofunctional Plasticity in ECT
In ECT, alternating electrical current is briefly applied via electrodes placed on the head to elicit generalized seizures, where seizure activity occurs throughout the brain. A “successful” ECT session is typically defined as inducing a generalized seizure, evidenced by highly coordinated seizure activity at all/most recording sites during multi-channel EEG and motor symptoms (45). However, there is an abundance of evidence from animal models (46, 47), patients with epilepsy (48), and ECT (5, 22, 49) demonstrating that neuronal activity measured during generalized seizures is not homogenous throughout the brain (20). Correspondingly, global CBF remained relatively static in our study, while robust regional CBF change occurred in circumscribed areas in all patients and according to antidepressant response (discussed further below).
Global CBF was, however, associated with ECT outcome. Pre-treatment global CBF was lower in ECT responders than both nonresponders and healthy controls, and a modest linear correlation between pre-treatment global CBF and symptom change was apparent. Global CBF also increased transiently after the initial two ECT treatments in ECT responders. This latter effect supports a previous PET study reporting increased global CBF during ECT-induced seizures, though relationships with antidepressant response were not reported (50). However, the nature of this potential link between lower levels of pre-treatment global brain activity and successful antidepressant response is unclear. Lower global function at baseline could prevent neuronal hyperexcitability during treatment (which can be detrimental to cell health), or could allow more capacity for neurons to respond when exposed to ECT-related electric fields and/or seizure activity. Future animal studies will be better able to probe this putative relationship between baseline CBF and antidepressant response at a cellular level. Clinical studies could also explore whether inducing a state of lower global brain function prior to initiating ECT treatment would increase the probability of positive antidepressant outcome. This modest effect aside, overall our data support that the effects of ECT are not global, but instead occur in specific brain networks relevant to depression and seizure physiology.
Hippocampal plasticity and ECT outcome
The most consistent finding reported across the ECT literature is increased structural plasticity of the hippocampi and surrounding regions after treatment, including increases in a variety of neuroimaging markers of gray matter in humans (24, 41, 43, 44, 51), increased cellular plasticity including neurogenesis in animal models (15, 16, 52), and several reports of associated neurofunctional plasticity (13, 14, 19, 38). Our data corroborate these findings using a novel technique; we report that brain activity measured with ASL-fMRI increased in right anterior hippocampus in all volunteers after right- unilateral ECT (effects were bilateral at more lenient thresholds). Notably, CBF increased after only two treatments, apparently preceding changes in gray-matter volume in this region. These neurofunctional changes could occur alongside microstructural changes not resolved by MRI (15, 16, 52), perhaps also related to inflammatory processes (and associated neurotrophic effects) (53). Furthermore, when analyzing data from ECT nonresponders separately from responders, hippocampal CBF change appeared more pronounced in nonresponders. Previous human neuroimaging studies have either reported modest (41) or no (24, 43, 44) correlations (including in meta-analyses (54, 55) and a megaanalysis (56)) between improved depressive symptoms and GMV increases in hippocampus and/or surrounding cortical tissue. Thus, the nature of the link between hippocampal plasticity and antidepressant response to ECT remains tenuous, though our results suggest that more may not be beneficial when it comes to neurofunctional plasticity in the hippocampus and other ventral structures like the striatum. Hippocampal plasticity may also be linked to possible ECT-related memory complaints (57), though this area is understudied (39, 58).
Perhaps the most parsimonious explanation of ECT-related hippocampal plasticity is the long-term consequences of seizure activity due to its proximity to the temporal electrode(s). The anteromedial temporal lobes are highly susceptible to seizures as indicated by the epilepsy literature (59). SPECT studies have shown increased activity in anteromedial temporal regions at the beginning of the ECT session, which is often interpreted as reflecting seizure initiation (60). After seizure initiation, however, brain-activity changes occur elsewhere during ECT-induced seizures, typically including increased thalamic and brainstem activity coupled with decreased cortical activity (50, 60–62) consistent with patterns of long-term changes we report in ECT responders (discussed below). Given the complexity of current models of both seizure neurophysiology and depressive neuropathophysiology, the hippocampus is unlikely to be the sole (or perhaps even the most) critical component of the mechanisms of antidepressant response to ECT.
Relevance of dorsal thalamo-cortical regions to ECT physiology
Patients who responded to ECT in our study had lower thalamic CBF before treatment compared to both nonresponders and healthy controls. These thalamic CBF levels increased, or “normalized,” acutely after two ECT treatments in ECT responders and remained stable through the 6-month follow-up MRI. The thalamus has been linked to the propagation of generalized seizures in animal models (63, 64), and the thalamus and/or thalamo-cortical networks are thought to play an important role in the generalization of seizures during ECT (60, 65), which may be critical to its clinical success (66). Acute increases in thalamic activity in responders were accompanied by decreased cortical activity in lateral frontal and parietal areas in our study, similar to patterns reported in SPECT studies tracking real-time changes in brain activity during generalized seizures induced during ECT (thalamic and brainstem increases, cortical decreases) (50, 60–62). Clearly, generalized seizures occur in both responders and nonresponders to ECT; this is closely monitored during each treatment (45). However, our data suggest that perhaps the lasting neuroplastic effects of seizure generalization (i.e., long-term plasticity in thalamo-cortical networks occurring during ECT index) are more pronounced in ECT responders.
ECT responders also exhibited increased CBF in somatomotor cortices contralateral to the position of the vertex electrode, which is just right of midline in right unilateral ECT (67). Our group and others have reported links between ECT and motor/supplementary-motor regions (35, 68–70), which could be relevant to avolitional and amotivational symptoms often associated with depression (though complex goal-oriented and motor-planning behavior is typically linked to more rostrofrontal structures (71)). Animal studies also show that lateral somatomotor cortex is susceptible to “kindling” (i.e., the initiation of seizure activity with electrical stimulation) (72, 73). Given the proximity of our reported effect in lateral somatomotor cortex to the vertex electrode, it is also possible that CBF increases in this region reflect the lasting neuroplastic effects of motor-cortex seizure activity initiated under or near the vertex electrode, and/or the effects of alternating current applied at the vertex electrode during treatment.
Conclusions and Limitations
Taken together, our results suggest that balanced neurofunctional plasticity across putative sites of seizure initiation near the right-temporal (hippocampus, ventral striatum) and vertex (somatomotor cortex) electrodes, as well as regions linked to seizure generalization (thalamus, cortex), may be critical to positive outcome. By contrast, “too much” plasticity in regions near the right-temporal electrode (hippocampus, ventral striatum) may not be conducive to positive outcome. Thus, although the distribution of electrical current applied at each electrode may be comparable during ECT (74, 75) and all patients experience generalized seizures (45), the regional distribution of ECT-induced seizure activity and/or its lasting functional effects may differ according to antidepressant response (Figure 5).
Our results require further empirical validation in independent samples and using complementary model systems and techniques. We interpreted our results as reflecting the long-term effects of seizure activity; however, future longitudinal studies monitoring brain activity during ECT-induced seizures (e.g., high-field EEG, SPECT, high-resolution PET-MRI) will be able to directly assess these relationships, and their consequences for antidepressant response. Such studies could also address relationships between pre-treatment brain “states” and patterns of seizure activity elicited during ECT with respect to outcome. Several additional limitations could be addressed by future research (see also Supplemental Discussion). Our sample was intentionally heterogeneous to boost generalizability and translational value (76), yet multisite studies with larger sample sizes are needed to parse the potential contributions of diagnosis, co-morbidities, ECT stimulation parameters, cognitive outcomes (39, 57), antidepressant treatment history, and other factors on ECT-induced neuroplasticity. The cerebellum is linked to seizure termination in both humans (61) and animal models (77, 78), and yet was excluded from our analyses because it was not fully captured by our field-of-view. New ASL sequences with improved spatio-temporal resolution will be helpful in measuring the effects of ECT on the cerebellum and smaller structures like the amygdala. Finally, our interpretation is speculative (Figure 5); however, the field is need of testable, mechanistic models beyond the continued characterization of ECT. We propose this interpretation with the goal of informing much-needed future research.
Supplementary Material
ACKNOWLEDGEMENTS
This work was supported by the NIH, including R01 MH092301 and U01 MH110008 to Drs. Narr and Espinoza and K24 MH102743 to Dr. Narr, the Muriel Harris Chair in Geriatric Psychiatry to Dr. Espinoza, as well as the Brian and Behavior Research Foundation, a NARSAD Young Investigator award to Dr. Leaver.
Footnotes
CONFLICT OF INTEREST
All authors report no biomedical financial interests or conflicts of interest.
Publisher's Disclaimer: This is a PDF file of an unedited manuscript that has been accepted for publication. As a service to our customers we are providing this early version of the manuscript. The manuscript will undergo copyediting, typesetting, and review of the resulting proof before it is published in its final citable form. Please note that during the production process errors may be discovered which could affect the content, and all legal disclaimers that apply to the journal pertain.
REFERENCES
- 1.Dierckx B, Heijnen WT, van den Broek WW, Birkenhäger TK (2012): Efficacy of electroconvulsive therapy in bipolar versus unipolar major depression: a meta-analysis. Bipolar Disord. 14: 146–150. [DOI] [PubMed] [Google Scholar]
- 2.Fink M (2014): What was learned: studies by the consortium for research in ECT (CORE) 1997–2011. Acta Psychiatr Scand. 129: 417–26. [DOI] [PubMed] [Google Scholar]
- 3.Husain MM, Rush AJ, Fink M, Knapp R, Petrides G, Rummans T, et al. (2004): Speed of response and remission in major depressive disorder with acute electroconvulsive therapy (ECT): a Consortium for Research in ECT (CORE) report. J Clin Psychiatry. 65: 485–91. [DOI] [PubMed] [Google Scholar]
- 4.Lisanby SH (2007): Electroconvulsive therapy for depression. N Engl J Med. 357: 1939–45. [DOI] [PubMed] [Google Scholar]
- 5.Blumenfeld H, Westerveld M, Ostroff RB, Vanderhill SD, Freeman J, Necochea A, et al. (2003): Selective frontal, parietal, and temporal networks in generalized seizures. NeuroImage. 19: 1556–1566. [DOI] [PubMed] [Google Scholar]
- 6.Nobler MS (1994): Regional Cerebral Blood Flow in Mood Disorders, III. Arch Gen Psychiatry. 51: 884. [DOI] [PubMed] [Google Scholar]
- 7.Lyden H, Espinoza RT, Pirnia T, Clark K, Joshi SH, Leaver AM, et al. (2014): Electroconvulsive therapy mediates neuroplasticity of white matter microstructure in major depression. Transl Psychiatry. 4: e380. [DOI] [PMC free article] [PubMed] [Google Scholar]
- 8.Abbott CC, Lemke NT, Gopal S, Thoma RJ, Bustillo J, Calhoun VD, Turner JA (2013): Electroconvulsive therapy response in major depressive disorder: a pilot functional network connectivity resting state FMRI investigation. Front Psychiatry. 4: 10. [DOI] [PMC free article] [PubMed] [Google Scholar]
- 9.van Waarde JA, Scholte HS, van Oudheusden LJB, Verwey B, Denys D, van Wingen GA (2015): A functional MRI marker may predict the outcome of electroconvulsive therapy in severe and treatment-resistant depression. Mol Psychiatry. 20: 609–614. [DOI] [PubMed] [Google Scholar]
- 10.Tendolkar I, van Beek M, van Oostrom I, Mulder M, Janzing J, Voshaar RO, van Eijndhoven P (2013): Electroconvulsive therapy increases hippocampal and amygdala volume in therapy refractory depression: a longitudinal pilot study. Psychiatry Res. 214: 197–203. [DOI] [PubMed] [Google Scholar]
- 11.Joshi SH, Espinoza RT, Pirnia T, Shi J, Wang Y, Ayers B, et al. (2015): Structural plasticity of the hippocampus and amygdala induced by electroconvulsive therapy in major depression. Biol Psychiatry. 79: 282–92. [DOI] [PMC free article] [PubMed] [Google Scholar]
- 12.Sheline YI, Sanghavi M, Mintun MA, Gado MH (1999): Depression Duration But Not Age Predicts Hippocampal Volume Loss in Medically Healthy Women with Recurrent Major Depression. J Neurosci. 19: 5034–5043. [DOI] [PMC free article] [PubMed] [Google Scholar]
- 13.Abbott CC, Jones T, Lemke NT, Gallegos P, McClintock SM, Mayer AR, et al. (2014): Hippocampal structural and functional changes associated with electroconvulsive therapy response. Transl Psychiatry. 4: e483. [DOI] [PMC free article] [PubMed] [Google Scholar]
- 14.Leaver AM, Espinoza R, Pirnia T, Joshi SH, Woods RP, Narr KL (2016): Modulation of Intrinsic Brain Activity by Electroconvulsive Therapy in Major Depression. Biol Psychiatry Cogn Neurosci Neuroimaging. 1: 77–86. [DOI] [PMC free article] [PubMed] [Google Scholar]
- 15.Chen F, Madsen TM, Wegener G, Nyengaard JR (2009): Repeated electroconvulsive seizures increase the total number of synapses in adult male rat hippocampus. Eur Neuropsychopharmacol. 19: 329–338. [DOI] [PubMed] [Google Scholar]
- 16.Madsen TM, Treschow A, Bengzon J, Bolwig TG, Lindvall O, Tingström A (2000): Increased neurogenesis in a model of electroconvulsive therapy. Biol Psychiatry. 47: 1043–1049. [DOI] [PubMed] [Google Scholar]
- 17.Eisch AJ, Petrik D (2012): Depression and hippocampal neurogenesis: a road to remission? Science. 338: 72–5. [DOI] [PMC free article] [PubMed] [Google Scholar]
- 18.Hanson ND, Owens MJ, Nemeroff CB (2011): Depression, Antidepressants, and Neurogenesis: A Critical Reappraisal. Neuropsychopharmacology. 36: 2589–2602. [DOI] [PMC free article] [PubMed] [Google Scholar]
- 19.Argyelan M, Lencz T, Kaliora S, Sarpal DK, Weissman N, Kingsley PB, et al. (2016): Subgenual cingulate cortical activity predicts the efficacy of electroconvulsive therapy. Transl Psychiatry. 6: e789. [DOI] [PMC free article] [PubMed] [Google Scholar]
- 20.McNally KA, Blumenfeld H (2004): Focal network involvement in generalized seizures: new insights from electroconvulsive therapy. Epilepsy Behav. 5: 3–12. [DOI] [PubMed] [Google Scholar]
- 21.Bolwig TG (2014): Neuroimaging and electroconvulsive therapy: a review. J ECT. 30: 138–42. [DOI] [PubMed] [Google Scholar]
- 22.Enev M, McNally KA, Varghese G, Zubal IG, Ostroff RB, Blumenfeld H (2007): Imaging onset and propagation of ECT-induced seizures. Epilepsia. 48: 238–44. [DOI] [PubMed] [Google Scholar]
- 23.Wade BSC, Joshi SH, Njau S, Leaver AM, Vasavada M, Woods RP, et al. (2016): Effect of Electroconvulsive Therapy on Striatal Morphometry in Major Depressive Disorder. Neuropsychopharmacology. 41: 2481–2491. [DOI] [PMC free article] [PubMed] [Google Scholar]
- 24.Dukart J, Regen F, Kherif F, Colla M, Bajbouj M, Heuser I, et al. (2014): Electroconvulsive therapy-induced brain plasticity determines therapeutic outcome in mood disorders. Proc Natl Acad Sci U S A. 111: 1156–61. [DOI] [PMC free article] [PubMed] [Google Scholar]
- 25.Kellner CH, Knapp R, Husain MM, Rasmussen K, Sampson S, Cullum M, et al. (2010): Bifrontal, bitemporal and right unilateral electrode placement in ECT: randomised trial. Br J Psychiatry J Ment Sci. 196: 226–34. [DOI] [PMC free article] [PubMed] [Google Scholar]
- 26.Sackeim HA, Prudic J, Devanand DP, Nobler MS, Lisanby SH, Peyser S, et al. (2000): A prospective, randomized, double-blind comparison of bilateral and right unilateral electroconvulsive therapy at different stimulus intensities. Arch Gen Psychiatry. 57: 425. [DOI] [PubMed] [Google Scholar]
- 27.Wang Z, Aguirre GK, Rao H, Wang J, Fernandez-Seara MA, Childress AR, Detre JA (2008): Empirical optimization of ASL data analysis using an ASL data processing toolbox: ASLtbx. Magn Reson Imaging. 26: 261–269. [DOI] [PMC free article] [PubMed] [Google Scholar]
- 28.American Psychiatric Association (2000): Diagnostic and Statistical Manual of Mental Disorders, Fourth Edition: DSM- IV-TR®. American Psychiatric Association. [Google Scholar]
- 29.Sheehan D V, Lecrubier Y, Sheehan KH, Amorim P, Janavs J, Weiller E, et al. (1998): The Mini-International Neuropsychiatric Interview (M.I.N.I.): the development and validation of a structured diagnostic psychiatric interview for DSM-IV and ICD-10. J Clin Psychiatry. 59 Suppl 2: 22–33;quiz 34–57. [PubMed] [Google Scholar]
- 30.Hamilton M (1980): Rating depressive patients. J Clin Psychiatry. 41: 21–24. [PubMed] [Google Scholar]
- 31.Montgomery SA, Asberg M (1979): A new depression scale designed to be sensitive to change. Br J Psychiatry J Ment Sci. 134: 382–389. [DOI] [PubMed] [Google Scholar]
- 32.Rush AJ, Trivedi MH, Ibrahim HM, Carmody TJ, Arnow B, Klein DN, et al. (2003): The 16-Item Quick Inventory of Depressive Symptomatology (QIDS), clinician rating (QIDS-C), and self-report (QIDS-SR): a psychometric evaluation in patients with chronic major depression. Biol Psychiatry. 54: 573–583. [DOI] [PubMed] [Google Scholar]
- 33.Nierenberg AA, DeCecco LM (2001): Definitions of antidepressant treatment response, remission, nonresponse, partial response, and other relevant outcomes: a focus on treatment-resistant depression. J Clin Psychiatry. 62 Suppl 16: 5–9. [PubMed] [Google Scholar]
- 34.Pirnia T, Joshi SH, Leaver AM, Vasavada M, Njau S, Woods RP, et al. (2016): Electroconvulsive therapy and structural neuroplasticity in neocortical, limbic and paralimbic cortex. Transl Psychiatry. 6: e832. [DOI] [PMC free article] [PubMed] [Google Scholar]
- 35.Leaver AM, Wade B, Vasavada M, Hellemann G, Joshi SH, Espinoza R, Narr KL (2018): Fronto-Temporal Connectivity Predicts ECT Outcome in Major Depression. Front Psychiatry. 9. doi: 10.3389/fpsyt.2018.00092. [DOI] [PMC free article] [PubMed] [Google Scholar]
- 36.Leaver AM, Espinoza R, Joshi SH, Vasavada M, Njau S, Woods RP, Narr KL (2016): Desynchronization and Plasticity of Striato-frontal Connectivity in Major Depressive Disorder. Cereb Cortex N Y N 1991. 26: 4337–4346. [DOI] [PMC free article] [PubMed] [Google Scholar]
- 37.Njau S, Joshi SH, Espinoza R, Leaver AM, Vasavada M, Marquina A, et al. (2017): Neurochemical correlates of rapid treatment response to electroconvulsive therapy in patients with major depression. J Psychiatry Neurosci JPN. 42: 6–16. [DOI] [PMC free article] [PubMed] [Google Scholar]
- 38.Njau S, Joshi SH, Leaver AM, Vasavada M, Fleet J, Espinoza R, Narr KL (2016): Variations in myo-inositol in fronto- limbic regions and clinical response to electroconvulsive therapy in major depression. J Psychiatr Res. 80: 45–51. [DOI] [PMC free article] [PubMed] [Google Scholar]
- 39.Vasavada MM, Leaver AM, Njau S, Joshi SH, Ercoli L, Hellemann G, et al. (2017): Short- and Long-term Cognitive Outcomes in Patients With Major Depression Treated With Electroconvulsive Therapy. J ECT. 33: 278–285. [DOI] [PMC free article] [PubMed] [Google Scholar]
- 40.Worsley KJ, Evans AC, Marrett S, Neelin P (1992): A three-dimensional statistical analysis for CBF activation studies in human brain. J Cereb Blood Flow Metab. 12: 900–18. [DOI] [PubMed] [Google Scholar]
- 41.Joshi SH, Espinoza RT, Pirnia T, Shi J, Wang Y, Ayers B, et al. (2015): Structural plasticity of the hippocampus and amygdala induced by electroconvulsive therapy in major depression. Biol Psychiatry. 79: 282–92. [DOI] [PMC free article] [PubMed] [Google Scholar]
- 42.Redlich R, Bürger C, Dohm K, Grotegerd D, Opel N, Zaremba D, et al. (2017): Effects of electroconvulsive therapy on amygdala function in major depression - a longitudinal functional magnetic resonance imaging study. Psychol Med. 47: 2166–2176. [DOI] [PubMed] [Google Scholar]
- 43.Redlich R, Opel N, Grotegerd D, Dohm K, Zaremba D, Bürger C, et al. (2016): Prediction of Individual Response to Electroconvulsive Therapy via Machine Learning on Structural Magnetic Resonance Imaging Data. JAMA Psychiatry. 73: 557. [DOI] [PubMed] [Google Scholar]
- 44.Tendolkar I, Beek M, Oostrom I, Mulder M, Janzing J, Voshaar RO, Eijndhoven P (2013): Electroconvulsive therapy increases hippocampal and amygdala volume in therapy refractory depression: a longitudinal pilot study. Psychiatry Res. 214: 197–203. [DOI] [PubMed] [Google Scholar]
- 45.Kellner CH, Pritchett JT, Beale MD, Coffey CE (1997): Handbook of ECT. Washington, D.C.: American Psychiatric Press. [Google Scholar]
- 46.Nersesyan H, Hyder F, Rothman DL, Blumenfeld H (2004): Dynamic fMRI and EEG recordings during spike-wave seizures and generalized tonic-clonic seizures in WAG/Rij rats. J Cereb Blood Flow Metab. 24: 589–599. [DOI] [PubMed] [Google Scholar]
- 47.Blumenfeld H, McCormick DA (2000): Corticothalamic Inputs Control the Pattern of Activity Generated in Thalamocortical Networks. J Neurosci. 20: 5153–5162. [DOI] [PMC free article] [PubMed] [Google Scholar]
- 48.Blumenfeld H, Varghese GI, Purcaro MJ, Motelow JE, Enev M, McNally KA, et al. (2009): Cortical and subcortical networks in human secondarily generalized tonic-clonic seizures. Brain J Neurol. 132: 999–1012. [DOI] [PMC free article] [PubMed] [Google Scholar]
- 49.Miller JW (2010): Are Generalized Tonic-Clonic Seizures Really “Generalized”? Epilepsy Curr. 10: 80–81. [DOI] [PMC free article] [PubMed] [Google Scholar]
- 50.Takano H, Motohashi N, Uema T, Ogawa K, Ohnishi T, Nishikawa M, Matsuda H (2011): Differences in cerebral blood flow between missed and generalized seizures with electroconvulsive therapy: A positron emission tomographic study. Epilepsy Res. 97: 225–228. [DOI] [PubMed] [Google Scholar]
- 51.Cano M, Martfnez-Zalacaín I, Bernabéu-Sanz Á, Contreras-Rodríguez O, Hernández-Ribas R, Via E, et al. (2017): Brain volumetric and metabolic correlates of electroconvulsive therapy for treatment-resistant depression: a longitudinal neuroimaging study. Transl Psychiatry. 7: e1023. [DOI] [PMC free article] [PubMed] [Google Scholar]
- 52.Perera TD, Coplan JD, Lisanby SH, Lipira CM, Arif M, Carpio C, et al. (2007): Antidepressant-induced neurogenesis in the hippocampus of adult nonhuman primates. J Neurosci Off J Soc Neurosci. 27: 4894–4901. [DOI] [PMC free article] [PubMed] [Google Scholar]
- 53.van Buel EM, Patas K, Peters M, Bosker FJ, Eisel ULM, Klein HC (2015): Immune and neurotrophin stimulation by electroconvulsive therapy: is some inflammation needed after all? Transl Psychiatry. 5: e609. [DOI] [PMC free article] [PubMed] [Google Scholar]
- 54.Wilkinson ST, Sanacora G, Bloch MH (2017): Hippocampal Volume Changes Following Electroconvulsive Therapy: A Systematic Review and Meta-analysis. Biol Psychiatry Cogn Neurosci Neuroimaging. 2: 327–335. [DOI] [PMC free article] [PubMed] [Google Scholar]
- 55.Takamiya A, Chung JK, Liang K, Graff-Guerrero A, Mimura M, Kishimoto T (2018): Effect of electroconvulsive therapy on hippocampal and amygdala volumes: systematic review and meta-analysis. Br J Psychiatry. 212: 19–26. [DOI] [PubMed] [Google Scholar]
- 56.Oltedal: et al. (In Press; ): Volume of the Human Hippocampus and Clinical Response Following Electroconvulsive Therapy Biol Psychiatry. . doi: 10.1016/j.biopsych.2018.05.017. [DOI] [PMC free article] [PubMed] [Google Scholar]
- 57.Lisanby SH, Maddox JH, Prudic J, Devanand DP, Sackeim HA (2000): The Effects of Electroconvulsive Therapy on Memory of Autobiographical and Public Events. Arch Gen Psychiatry. 57: 581–590. [DOI] [PubMed] [Google Scholar]
- 58.Szabo K, Hirsch JG, Krause M, Ende G, Henn FA, Sartorius A, Gass A (2007): Diffusion weighted MRI in the early phase after electroconvulsive therapy. Neurol Res. 29: 256–259. [DOI] [PubMed] [Google Scholar]
- 59.Margerison JH, Corsellis JA (1966): Epilepsy and the temporal lobes. A clinical, electroencephalographic and neuropathological study of the brain in epilepsy, with particular reference to the temporal lobes. Brain J Neurol. 89:499–530. [DOI] [PubMed] [Google Scholar]
- 60.Enev M, McNally KA, Varghese G, Zubal IG, Ostroff RB, Blumenfeld H (2007): Imaging onset and propagation of ECT-induced seizures. Epilepsia. 48: 238–244. [DOI] [PubMed] [Google Scholar]
- 61.Blumenfeld H, Varghese GI, Purcaro MJ, Motelow JE, Enev M, McNally KA, et al. (2009): Cortical and subcortical networks in human secondarily generalized tonic-clonic seizures. Brain. 132: 999–1012. [DOI] [PMC free article] [PubMed] [Google Scholar]
- 62.Takano H, Motohashi N, Uema T, Ogawa K, Ohnishi T, Nishikawa M, et al. (2007): Changes in regional cerebral blood flow during acute electroconvulsive therapy in patients with depression: Positron emission tomographic study. Br J Psychiatry. 190: 63–68. [DOI] [PubMed] [Google Scholar]
- 63.McCormick DA, Contreras D (2001): On The Cellular and Network Bases of Epileptic Seizures. Annu Rev Physiol. 63: 815–846. [DOI] [PubMed] [Google Scholar]
- 64.Bertram EH, Zhang D, Williamson JM (2008): Multiple roles of midline dorsal thalamic nuclei in induction and spread of limbic seizures. Epilepsia. 49: 256–268. [DOI] [PubMed] [Google Scholar]
- 65.Bolwig TG (2011): How does electroconvulsive therapy work? Theories on its mechanism. Can J Psychiatry Rev Can Psychiatr. 56: 13–18. [DOI] [PubMed] [Google Scholar]
- 66.Jan Shah A, Wadoo O, Latoo J (2013): Electroconvulsive Therapy (ECT): Important parameters which influence its effectiveness. Br J Med Pract. 6: 31–36. [Google Scholar]
- 67.d’Elia G (1970): Unilateral electroconvulsive therapy. Acta Psychiatr Scand Suppl. 215: 1–98. [PubMed] [Google Scholar]
- 68.Waarde JA, Scholte HS, Oudheusden LJB, Verwey B, Denys D, Wingen GA (2015): A functional MRI marker may predict the outcome of electroconvulsive therapy in severe and treatment-resistant depression. Mol Psychiatry. 20:609–614. [DOI] [PubMed] [Google Scholar]
- 69.Jiang R, Abbott CC, Jiang T, Du Y, Espinoza R, Narr KL, et al. (2017): SMRI Biomarkers Predict Electroconvulsive Treatment Outcomes: Accuracy with Independent Data Sets. Neuropsychopharmacology. . doi: 10.1038/npp.2017.165. [DOI] [PMC free article] [PubMed] [Google Scholar]
- 70.Wade BSC, Sui J, Hellemann G, Leaver AM, Espinoza RT, Woods RP, et al. (2017): Inter and intra-hemispheric structural imaging markers predict depression relapse after electroconvulsive therapy: a multisite study. Transl Psychiatry. 7: 1270. [DOI] [PMC free article] [PubMed] [Google Scholar]
- 71.Grafton ST, de C. Hamilton AF (2007): Evidence for a distributed hierarchy of action representation in the brain. Hum Mov Sci. 26: 590–616. [DOI] [PMC free article] [PubMed] [Google Scholar]
- 72.French J, Gernandt B, Livingston R (1955): Regional differences in seizure susceptibility in monkey cortex. Trans Am Neurol Assoc. 194–196. [PubMed] [Google Scholar]
- 73.Fukushima J, Kohsaka S, Fukushima K, Kato M (1987): Motor Cortical Kindling in Cats: A Comparison of Adult Cats and Kittens. Epilepsia. 28: 651–657. [DOI] [PubMed] [Google Scholar]
- 74.Bai S, Loo C, Al Abed A, Dokos S (2012): A computational model of direct brain excitation induced by electroconvulsive therapy: comparison among three conventional electrode placements. Brain Stimulat. 5: 408–421. [DOI] [PubMed] [Google Scholar]
- 75.Lee WH, Deng Z-D, Kim T- S, Laine AF, Lisanby SH, Peterchev AV (2012): Regional electric field induced by electroconvulsive therapy in a realistic finite element head model: Influence of white matter anisotropic conductivity. NeuroImage. 59: 2110–2123. [DOI] [PMC free article] [PubMed] [Google Scholar]
- 76.Insel T, Cuthbert B, Garvey M, Heinssen R, Pine DS, Quinn K, et al. (2010): Research domain criteria (RDoC): toward a new classification framework for research on mental disorders. Am J Psychiatry. 167: 748–51. [DOI] [PubMed] [Google Scholar]
- 77.Krook-Magnuson E, Szabo GG, Armstrong C, Oijala M, Soltesz I (2014): Cerebellar Directed Optogenetic Intervention Inhibits Spontaneous Hippocampal Seizures in a Mouse Model of Temporal Lobe Epilepsy. eNeuro. 1. doi: 10.1523/ENEUR0.0005-14.2014. [DOI] [PMC free article] [PubMed] [Google Scholar]
- 78.Salgado-Benftez A, Briones R, Fernandez-Guardiola A (1982): Purkinje Cell Responses to a Cerebral Penicillin- Induced Epileptogenic Focus in the Cat. Epilepsia. 23: 597–606. [DOI] [PubMed] [Google Scholar]
Associated Data
This section collects any data citations, data availability statements, or supplementary materials included in this article.