Abstract
Background
AP2/ERF transcription factors perform indispensable functions in various biological processes, such as plant growth, development, biotic and abiotic stresses responses. The AP2/ERF transcription factor family has been identified in many plants, and several AP2/ERF transcription factors from Arabidopsis thaliana (A. thaliana) have been functionally characterized. However, little research has been conducted on the AP2/ERF genes of tartary buckwheat (Fagopyum tataricum), which is an important edible and medicinal crop. The recently published whole genome sequence of tartary buckwheat allowed us to study the tissue and expression profiles of AP2/ERF genes in tartary buckwheat on a genome-wide basis.
Results
In this study, 134 AP2/ERF genes of tartary buckwheat (FtAP2/ERF) were identified and renamed according to the chromosomal distribution of the FtAP2/ERF genes. According to the number conserved domains and gene structure, the AP2/ERF genes were divided into three subfamilies by phylogenetic tree analysis, namely, AP2 (15 members), ERF (116 members) and RAV (3 members). A total of 10 motifs were detected in tartary buckwheat AP2/ERF genes, and some of the unique motifs were found to be important for the function of AP2/ERF genes.
Conclusion
A comprehensive analysis of AP2/ERF gene expression patterns in different tissues and fruit development stages by quantitative real-time PCR (qRT-PCR) showed that they played an important role in the growth and development of tartary buckwheat, and genes that might regulate flower and fruit development were preliminarily identified. This systematic analysis establishes a foundation for further studies of the functional characteristics of FtAP2/ERF genes and improvement of tartary buckwheat crops.
Electronic supplementary material
The online version of this article (10.1186/s12870-019-1681-6) contains supplementary material, which is available to authorized users.
Keywords: Tartary buckwheat, FtAP2/ERF, Genome-wide, Fruit development, Expression patterns
Background
AP2/ERF transcription factors (TFs) compose one of the largest families of plant transcriptional regulation genes and regulate the signaling networks of various biological processes in plants [1, 2]. The AP2/ERF genes contain one or two AP2 DNA-binding domains with 60 to 70 conserved amino acid residues [3, 4]. According to the number of AP2 domains and other DNA binding domains, the AP2/ERF family can be divided into three subfamilies: AP2, RAV, and ERF gene families [5]. Among the three subfamilies, only the AP2 family contains two conserved AP2 domains, whereas all the others contain only one AP2 domain [6]. The members of the RAV family include not only an AP2 domain but also a DNA-binding domain B3 that exists in other plant-specific transcription factors [7, 8]. Furthermore, according to differences in the promoter sequence of ERF family binding interaction genes, a categorization into ERF and DREB subfamilies can be established [9]. The ERF subfamily and DREB subfamily were further divided into six groups consisting of clades A1-A6 and clades B1-B6 in A. thaliana [9].
Since AP2 transcription factors can regulate A. thaliana flower development [10], a large number of AP2 genes have been identified in various plants. The TFs from the AP2 family are mainly involved in the regulation of plant growth and development, such as flower development [11–13], leaf shape [14] and seed growth [15]. Ethylene response factors (ERFs) are located downstream of the ethylene signaling pathway, and many proteins in the ERF family have been identified and found to be involved in many functions, such as metabolic regulation [16–18], responses to biotic and abiotic stresses [19–21], hormone signaling [22], and plant development [23]. However, RAV TFs can regulate leaf senescence [24] and participate in biotic and abiotic stress responses [25].
Tartary buckwheat (Fagopyrum tataricum) is recognized as an important functional food material because it contains abundant flavonoids with antioxidant activity [26]. The essential amino acid composition of the seed protein is not only balanced but also the total content is higher than that of primary grain crops. The auxin response factor gene family has been identified from tartary buckwheat, and the potential role of Fagopyrum tataricum ARF2 (FtARF2) in tartary Buckwheat fruit size has been deeply studied [27, 28]. Meanwhile, the MADS gene family has also been identified from tartary buckwheat [29]. With the increasing demand for tartary buckwheat, understanding the potential regulatory mechanism of growth and development has been a key problem. The AP2/ERF family plays an important role in regulating plant growth and development. At present, whole-genome identification and analysis of the AP2/ERF gene family have been performed in many plants, including A. thaliana [5], rice [30], cauliflower [31], Chinese cabbage [32], pear [33], sesame [34], and pepper [35].
However, there is no information about the AP2/ERF family in tartary buckwheat (Fagopyrum tataricum). Because of the importance of AP2/ERF genes in various physiological processes, it is important to systematically study the AP2/ERF family of tartary buckwheat. The evolutionary characteristics and tissue-specific expression of the AP2/ERF gene family in tartary buckwheat can be characterized by recently completed genome sequencing. In this study, we comprehensively analyzed the gene structure, motif composition, chromosomal locations, gene duplications, and expression patterns of 134 tartary buckwheat AP2/ERF genes and compared the evolutionary relationships with A. thaliana, Beta vulgaris, Glycine max, Solanum lycopersicum, Vitis vinifera, Oryza sativa, and Helianthus annuus. In addition, we studied the expression pattern of AP2/ERF genes in developmental stages of tartary buckwheat fruit. By global expression analysis, the participation of members of specific AP2/ERF family genes in different biological processes of tartary buckwheat was determined. The results of this study could provide valuable information for screening important AP2/ERF genes in tartary buckwheat growth and development.
Methods
Genes identification and classification
The largest number of AP2/ERF genes were found in tartary buckwheat genome downloaded from the Tartary Buckwheat Genome Project (TBGP; http://www.mbkbase.org/Pinku1/) by two BLASTP methods. The candidate genes were searched by BLASTP using a score value of ≥100 and e-value ≤ e− 10. Then the hidden Markov model (HMM) file from the Pfam protein family database (http://pfam.xfam.org/) corresponding to the AP2 domain (PF00847) and the B3 domain (PF02362) was downloaded. AP2/ERF genes were retrieved from the tartary buckwheat genomic database by HMMER3.0. The default parameter was determined and the cutoff set to 0.01. Using the PFAM and SMART programs to determine the existence of AP2 core sequence and genes contains AP2 domain were further verified by HMMER. Finally, 134 AP2/ERF gene models were identified in the tartary buckwheat genome for further analysis. The basic information of the identified AP2/ERF proteins were obtained using the tools at the ExPasy website (http://web.expasy.org/protparam/).
Sequence analysis
The structural differences between Fagopyrum tataricum AP2/ERF (FtAP2/ERF) genes were investaged by studying the conserved motifs of the encoded AP2/ERF proteins. Alignment of FtAP2/ERF protein sequences with ClustalW default parameters. The exon-intron structure of the FtAP2/ERF genes were determined by Gene Structure Display Server (GSDS: http://gsds.cbi.pku.edu.cn/) and the conserved motifs of AP2/ERF proteins were evaluated by MEME online program (http:/meme.nbcr.net/meme/intro.html) [36].
Chromosomal distribution and gene duplication of FtAP2/ERF genes
The method of mapping FtAP2/ERF genes on the chromosome of tartary buckwheat was the same as that of FtARFs genes [36]. Analysis of gene replication events using Multiple collinear scanning toolkits (MCScanX). The syntenic analysis maps of the Dual Systeny Plotter software (https://github.com/CJ-Chen/TBtools) was constructed to determine the syntenic relationship between FtAP2/ERF gene and AP2/ERF genes in other selected plants.
Phylogenetic analysis and classification of the FtAP2/ERF gene family
According to the number of AP2 conserved domain and the existence of B3 conserved domain, FtAP2/ERF genes were divided into different groups. The AP2/ERF protein sequences of A. thaliana, Beta vulgaris, Glycine max, Solanum lycopersicum, Vitis vinifera, Oryza sativa and Helianthus annuus were downloaded from the UniProt database (https://www.uniprot.org/). The phylogenetic trees were constructed by the neighbor-joining (NJ) method, the parameters refer to Liu et al. [36].
Plant materials
Professor Wang Anhu of Xichang University gave the tartary buckwheat accessions (XIQIAO) used in this study. The XIQIAO with high rutin content were obtained by physical and chemical mutagenesis [37]. Since 2013, XIQIAO has been introduced into the College of Life Science, Sichuan Agricultural University (Lat. 29°97’ N, 102°97′ E, Alt. 580 m), Sichuan Province, China, and grown in experimental field. The materials including tartary buckwheat flowers, the fruit from three (13, 19, and 25 days after pollination, DAP) different developmental fruit stages, and the stem, root, and leaf of mature tartary buckwheat were collected in 2017. The collected samples were quickly placed in liquid nitrogen and stored at− 80 °C for further extract RNA.
Expression analysis of FtAP2/ERF genes by real-time PCR
Using the tartary buckwheat (Pinku1) genome sequence database (http://www.mbkbase.org/Pinku1/) to download the corresponding sequences of FtAP2/ERF genes. Meanwhile, the qRT-PCR primers were designed using Primer3 software (http://frodo.wi.mit.edu/) (Additional file 1: Table S4). Analysis of spatial and temporal expression of some FtAP2/ERF gene by qRT-PCR. Histone H3 gene are expressed in almost all tissues with little difference in expression levels and are often used as internal reference genes. The FtH3 gene was used as an internal control, and each qRT-PCR experiment with SYBR Premix Ex Taq II (TaKaRa) was performed at least three times using a CFX96 Real Time System (Bio-Rad). The experimental data were processed by the 2-△△CT method [38].
Statistical analysis
All the data were analyzed by analysis of variance using the Origin Pro 2018b (OriginLab Corporation., Northampton, Massachusetts, USA) statistics program, and the means were compared by the least significant difference test (LSD) at significance levels of 0.05 and 0.01.
Results
Identification of FtAP2/ERF genes in tartary buckwheat
All possible AP2/ERF genes were excavated from the tartary buckwheat genome using the two BLAST methods. Because buckwheat genomes are sequenced using a genome-wide shotgun strategy, although they are located on different scaffolds, some of these AP2/ERF genes may be redundant. After removing the redundant and alternate forms of the same gene, 134 potential AP2/ERF proteins were identified and renamed based on their chromosomal location (Additional file 2: Table S1).
Gene characteristics included the coding sequence length (CDS), protein molecular weight (MW), isoelectric point (PI) and subcellular localization. Of the 134 FtAP2/ERF proteins, FtPinG0003194700.01 was the smallest protein with 71 amino acids (213 aa) and FtPinG0003183000.01 was the largest one with 641 amino acids (1923 aa) (Additional file 1). The MW of the proteins ranged from 8.09 to 71.06 KDa, and the pI ranged from 4.62 (FtPinG0005080800.01) to 12.01 (FtPinG0007485600.01). The predicted subcellular localization results showed that 111 FtAP2/ERF proteins were located in the nuclear region, 13 FtAP2/ERF proteins were located in the chloroplast region, 5 FtAP2/ERF proteins were located in the mitochondrial region, 4 FtAP2/ERF proteins were located in the cytoplasmic region, and 1 Ft AP2/ERF protein was located in the plasma membrane (Additional file 2: Table S1).
Multiple sequence alignment, phylogenetic analysis, and classification of FtAP2/ERF genes
The phylogenetic relationship of FtAP2/ERF proteins was performed by multiple sequence alignment of the AP2 domain involving approximately 60–70 amino acids and the B3 domain consisting of 100–120 residues. The sequence alignment of all AP2/ERF genes showed that the YRG (7th amino acid to 9th amino acid), LG (59th amino acid and 60th amino acid), AA (68th amino acid and 69th amino acid) and YD (72th amino acid and 73th amino acid) elements were highly conserved (Additional file 3: Figure S1). The WLG element (58th amino acid to 60th amino acid) was more highly conserved in the ERF family and RAV family than in the AP2 family. In the AP2 family, WLG elements (58th amino acid to 60th amino acid) were converted into YLG elements (58th amino acid to 60th amino acid). These conserved amino acid profiles may contribute to the classification of AP2/ERF genes in other species. By comparing the protein structure, we can effectively predict the function of proteins [5].
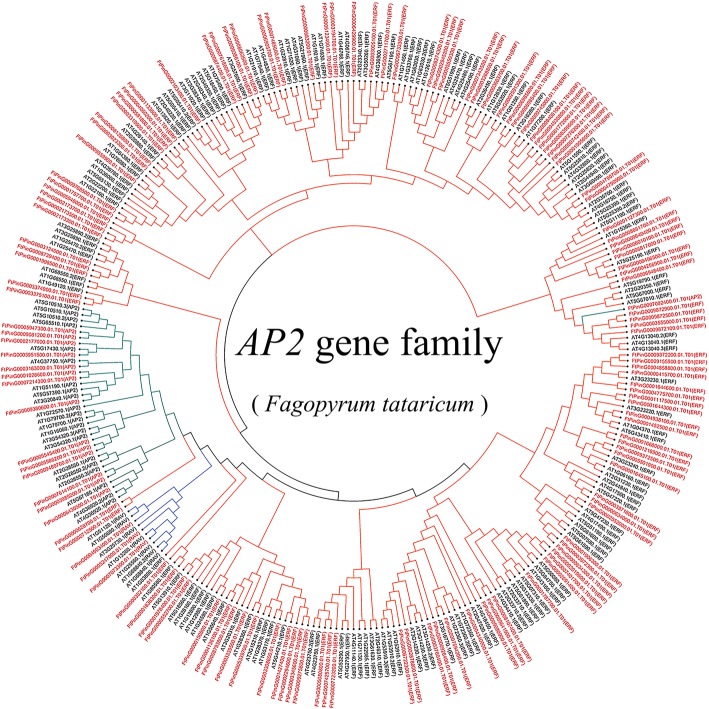
To explore the phylogenetic relationship of AP2/ERF proteins in tartary buckwheat, we constructed a phylogenetic tree using the neighbor-joining (NJ) method based on multiple sequence alignments of 166 A. thaliana AP2/ERF proteins and 134 tartary buckwheat AP2/ERF proteins. The phylogenetic distribution showed that AP2/ERF genes were divided into three major categories, AP2, ERF, and RAV (Fig. 1). Among 134 candidate FtAP2/ERF genes, 15 FtAP2/ERF genes containing two AP2/ERF domains were assigned to the AP2 family; 116 FtAP2/ERF genes encoding proteins containing a single AP2/ERF domain belonged to the ERF family; only 3 FtAP2/ERF genes encoded a single AP2/ERF domain; and a B3 domain was assigned to the RAV family (Fig. 1). Interestingly, FtPinG0007082400 was also found to encode two AP2/ERF domains, but they were distinct from the AP2 family and instead clustered in the ERF family.
Fig. 1.
Unrooted phylogenetic tree representing the relationships among 134 AP2/ERF genes of tartary buckwheat and Arabidopsis. The genes in tartary buckwheat are marked in red, while those in Arabidopsis are marked in black
Gene structure and motif composition of the FtAP2/ERF gene family
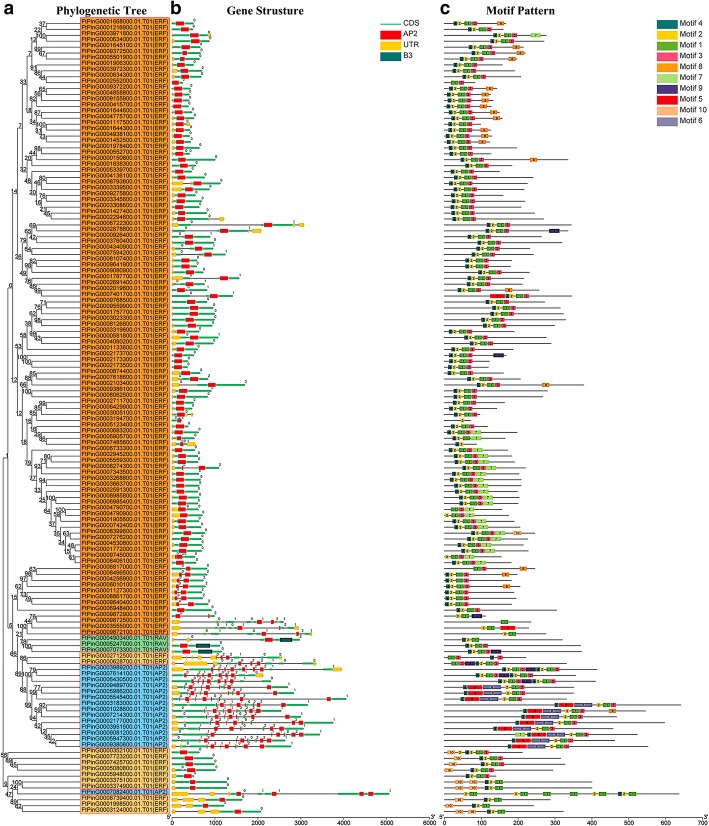
By comparing the genomic DNA sequences of FtAP2/ERF genes, we obtained the intron and exon structure of FtAP2/ERF genes to further understand the structural composition of FtAP2/ERF genes (Fig. 2b). The coding sequences of all tartary buckwheat AP2/ERF genes were disrupted by introns, with exon numbers ranging from 1 to 9 (Fig. 2b). Excluding four exons in the FtPinG0007082400 gene, the other members of the AP2 subfamily contained more than 7 exons. Moreover, the number of exons was conserved in the AP2 family, although the exon positions varied. Most members of the RAV subfamily and ERF subfamily contained only one exon and the AP2 domain located in the exon region (Fig. 2b). In general, the closest members from the same subfamily had similar exon / intron structures in terms of the intron number and exon length. Further analysis showed that FtAP2/ERF proteins contained, at most, two characteristic regions (Fig. 2b). The N-terminal region of all FtAP2/ERF proteins had a highly conserved AP2 region of approximately 60–70 amino acid residues corresponding to the DNA binding region, and the RAV subfamily also contained the B3 region composed of 100–120 amino acids. In general, many conserved motifs can be detected in transcriptional factor protein sequences, which may be involved in activating the expression of genes as potential DNA binding sites.
Fig. 2.
Phylogenetic relationships, gene structure and architecture of conserved protein motifs in AP2/ERF genes from tartary buckwheat. a The phylogenetic tree was constructed based on the full-length sequences of tartary buckwheat AP2/ERF proteins using Geneious R11 software. b Exon-intron structure of tartary buckwheat AP2/ERF genes. Yellow boxes indicate untranslated 5′- and 3′-regions; blue boxes indicate exons; black lines indicate introns. The AP2 domains are highlighted by red boxes and B3 domain by blackish green boxes. The number indicates the phases of the corresponding introns. c The motif composition of tartary buckwheat AP2/ERF proteins. The motifs, numbers 1–10, are displayed in different colored boxes. The sequence information for each motif is provided in Table S2. The protein length can be estimated using the scale at the bottom
The motifs of 134 FtAP2/ERF genes were analyzed using online MEME software to further study the characteristic regions of FtAP2/ERF proteins (Additional file 4: Table S2). According to the results of the MEME motif analysis, a schematic diagram was constructed to characterize the structure of FtAP2/ERF proteins. A total of 10 conserved motifs were found in the FtAP2/ERF proteins (Fig. 2c). Motif-1, Motif-2, Motif-3, Motif-4, and Motif-7 were found in the AP2 domain regions, in which Motif-1, Motif-2, Motif-3, and Motif-4 were detected in almost all AP2/ERF proteins. All ERF subfamily genes contained Motif-1, Motif-2, Motif-3, and Motif-4, Motif-8 was detected in 17 ERF genes, Motif-7 in 20 ERF genes, Motif-10 in 5 ERF genes, and Motif-9 in only 3 ERF genes. In the AP2 subfamily, 11 genes contained Motif-1 to Motif-6 and 3 AP2 genes contained Motif-1, Motif-2, Motif-3, Motif-4, and Motif-9. The similarity in motif composition in the same subfamily indicated the conserved protein structure of a specific subfamily, and the functions of these conserved motifs must be further elucidated. The conserved motif composition and gene structure of the same subfamily were similar, thus verifying the reliability of the phylogenetic tree population classification.
Chromosomal distribution and gene duplication and synteny analysis of FtAP2/ERF genes
Chromosome mapping of FtAP2/ERF genes was performed using the latest tartary buckwheat genome database. A total of 134 AP2/ERF TFs were unevenly distributed on eight tartary buckwheat chromosomes (Fig. 3). The largest number of AP2/ERF TFs was found on chromosomes 6 and 8 (23 and 21, respectively), while chromosome 4 had the smallest number of AP2/ERF TFs (11 genes). We found only ERF subfamily members on chromosomes 5 and 7, an absence of AP2 subfamily members on chromosomes 4, 5 and 7, and three RAV subfamily members distributed on chromosomes 2, 4 and chromosome 6 (Fig. 3). Interestingly, some transcription factors with similar conserved sequences were located on the same chromosome. Similar patterns have been found in A. thaliana [9], Vitis vinifera [39] and Chinese cabbage genomes [32], which were thought to represent homologous fragments caused by ancestral polyploidy events.
Fig. 3.
Schematic representations for the chromosomal distribution of tartary buckwheat AP2/ERF genes. The red lines indicate duplicated AP2/ERF gene pairs. The chromosome number is indicated to the left of each chromosome
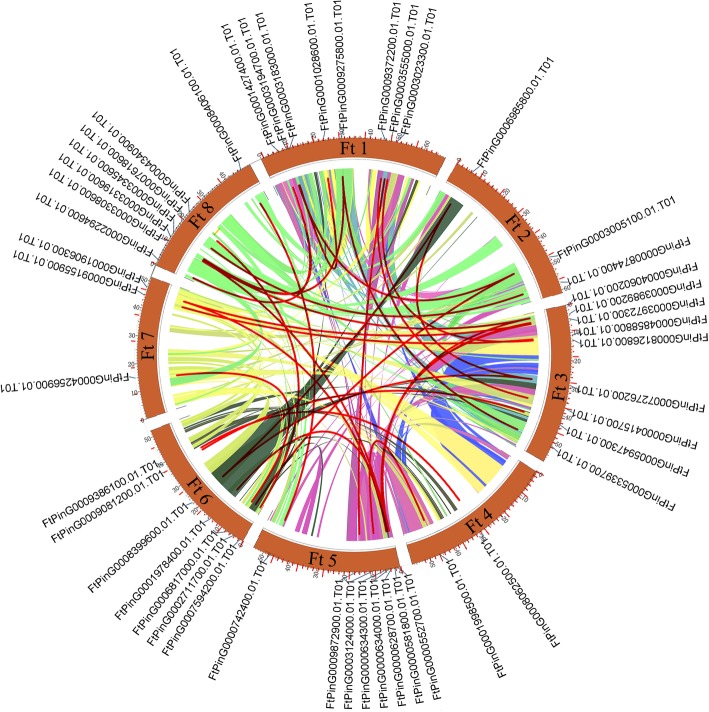
In addition, we also analyzed the duplication events of AP2/ERF genes in the tartary buckwheat genome since gene replication plays an important role in the occurrence of novel functions and gene expansion. Chromosomal regions within the 200 kb range of two or more genes were defined as tandem replication events. Twelve FtAP2/ERF genes were clustered into six tandem repeat event regions in tartary buckwheat linkage group (LG) 6 and 8 (Fig. 3). LG8 had four clusters, indicating hot spots of FtAP2/ERF gene distribution. A pair of tandem replication genes (FtPinG0004790900.1 and FtPinG0004790700.1) located on LG8 contained different motifs with other genes clustered together. In addition to tandem duplications, many pairs of segmental duplications were found in the tartary buckwheat chromosomes (Fig. 4). Analyses of homologous protein families is of great significance in establishing the kinship of species and predicting the function of new protein sequences. Many homologous genes were present on different chromosomes in tartary buckwheat, supporting the high conservation of the AP2/ERF gene family (Fig. 4). In brief, based on the above results, some FtAP2/ERF genes might be produced by gene replication, and these replication events were the main driving force of FtAP2/ERF evolution.
Fig. 4.
Schematic representations of the interchromosomal relationships of tartary buckwheat AP2/ERF genes. Colored lines indicate all syntenic blocks in the tartary buckwheat genome
Evolutionary analysis of FtAP2/ERF genes and several different species
To deduce the evolutionary relationship of AP2/ERF genes, phylogenetic tree analysis was performed for seven dicotyledonous plants (A. thaliana, Beta vulgaris, Glycine max, Solanum lycopersicum, Vitis vinifera, Helianthus annuus and Tartary buckwheat) and a monocotyledonous plants Oryza sativa. The AP2/ERF family of tartary buckwheat contained three subfamilies: AP2, ERF and RAV. To explore the evolutionary relationship of each gene, a phylogenetic tree analysis was performed between each subfamily of tartary buckwheat and other plant members of the same subfamily. Simultaneously, the motifs of the corresponding member proteins were determined.
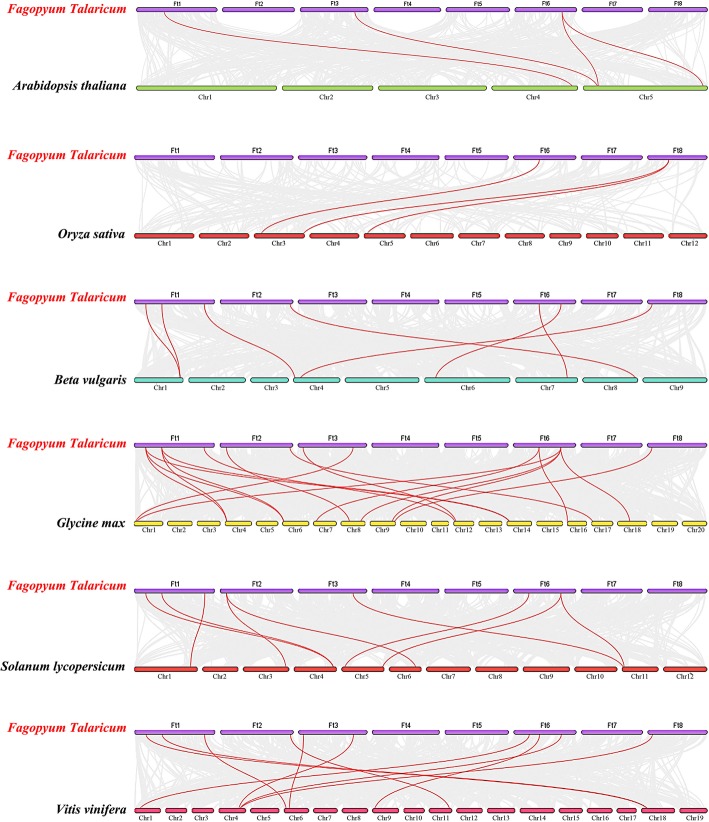
From Fig. 5a, we can see that most members of the tartary buckwheat AP2 subfamily were clustered with Beta vulgaris (5 members), followed by A. thaliana (4 members), Solanum lycopersicum (3 members), and Glycine max (2 members). A total of 10 conserved motifs were detected in the protein sequences of AP2 subfamily members in all plants (Fig. 5b). Almost all members contained Motif-1, Motif-2, Motif-4, Motif-5 and Motif-7. Additionally, AP2 members with a similar relationship in different plants had the same motif composition. Based on previous studies, we performed a syntenic analysis of AP2 genes in six dicotyledonous plants (Tartary buckwheat, A. thaliana, Beta vulgaris, Glycine max, Solanum lycopersicum and Vitis vinifera) and a monocotyledonous plant Oryza sativa to speculate on the evolutionary origin of AP2 genes. The AP2 subfamily genes in tartary buckwheat have homology to reference plants, and the most syntenic conservation was observed among Glycine max (18 orthologous gene pairs distributed on LG1, LG4 LG6, LG7, LG8, LG9, LG12, LG14, LG6L, G17 and LG18), Vitis vinifera (10 orthologous gene pairs distributed on LG1, LG4, LG6, LG9, LG11 and LG18), and Solanum lycopersicum (9 orthologous gene pairs distributed on LG1, LG3, LG4, LG5, LG6 and LG11) (Fig. 6). In the syntenic analysis of AP2 genes of tartary buckwheat and Glycine max, FtPinG0009081200.01 was found to be associated with at least three syntenic gene pairs, suggesting that FtPinG0009081200.01 might play an important role in AP2 subfamily evolution (Additional file 5: Table S3).
Fig. 5.

Phylogenetic relationships and motif compositions of AP2 proteins from six different plant species. Left panel: An unrooted phylogenetic tree constructed using Geneious R11 with the neighbor-joining method. Right panel: Distribution of conserved motifs in AP2 proteins. The differently colored boxes represent different motifs and their position in each AP2 protein sequence
Fig. 6.
Synteny analysis of AP2 genes between tartary buckwheat and six representative plant species. Gray lines in the background indicate the collinear blocks within tartary buckwheat and other plant genomes, while red lines highlight syntenic AP2 gene pairs
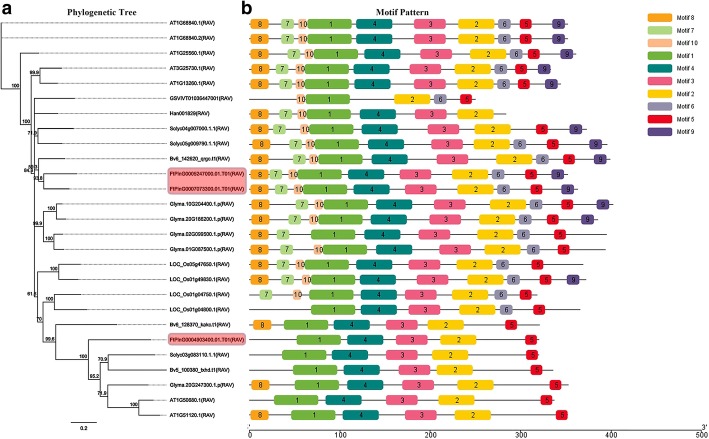
We used the same phylogenetic tree method to analyze the clustering relationship between FtRAV genes and the RAV genes of other plants. The phylogenetic tree results showed that three FtRAV genes were closely related to RAV genes in Beta vulgaris (2 members) and Solanum lycopersicum (1 member) (Fig. 7a). The protein sequences of the RAV genes also showed 10 conserved motifs, and all the members contained Motif-1, Motif-2, Motif-3, Motif-4 and Motif-5 (Fig. 7b). Moreover, the members of the same branch of the phylogenetic tree had the same motif composition.
Fig. 7.
Phylogenetic relationships and motif compositions of RAV proteins from seven different plant species. Left panel: An unrooted phylogenetic tree constructed using Geneious R11 with the neighbor-joining method. Right panel: Distribution of conserved motifs in RAV proteins. The differently colored boxes represent different motifs and their positions in each RAV protein sequence
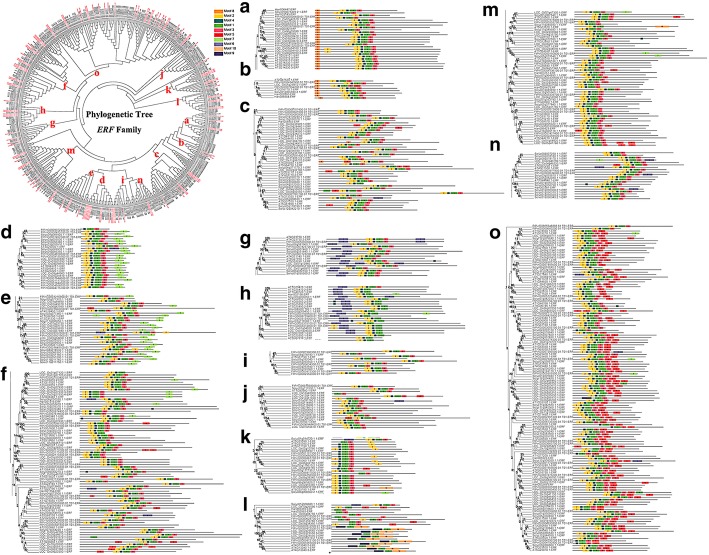
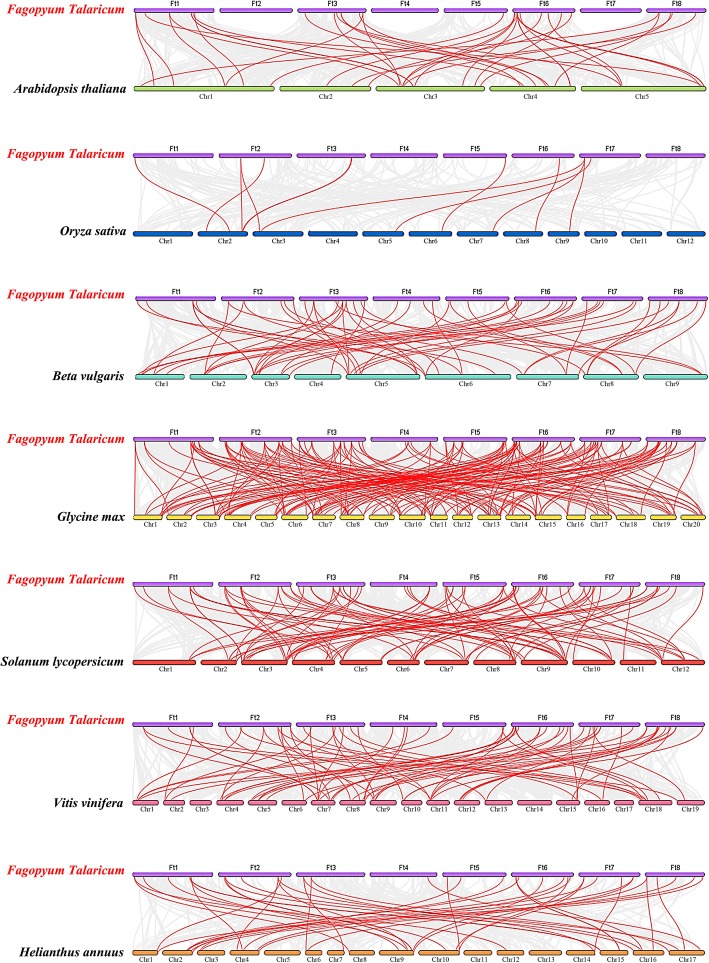
The ERF subfamily of tartary buckwheat contains many members. The phylogenetic tree constructed using the FtERF genes and ERF members from three dicotyledonous plants, A. thaliana, Helianthus annuus and Solanum lycopersicum, and a monocotyledonous plant Oryza sativa, indicated that the FtERFs proteins were divided into 15 groups (Fig. 8). We detected 10 motifs in the ERF subfamily of all plants. All the members, excluding group-h and group-l, contained Motif-1, Motif-2, Motif-3, and Motif-4, and the genes that clustered together contained similar motifs. Group-a and group-b specifically contained Motif-8, group-o specifically Motif-5, and group-g and group-h specifically Motif-6 (Fig. 8). Based on the syntenic results, the syntenic relationships between FtERF and ERF genes from other plants were very obvious, and according to the relationships, the order was Glycine max (198 orthologous gene pairs distributed throughout all LGs), Solanum lycopersicum (101 orthologous gene pairs distributed throughout all LGs), Vitis vinifera (73 orthologous gene pairs distributed throughout all LGs except the LG3, LG14, and LG17), Beta vulgaris (59 orthologous gene pairs distributed throughout all LGs), Helianthus annuus (44 orthologous gene pairs distributed throughout all LGs except LG5, LG11, and LG13), A. thaliana (37 orthologous gene pairs distributed throughout all LGs), and Oryza sativa (12 orthologous gene pairs distributed on LG2, LG3, LG5, LG6, LG7 LG8, and LG9), respectively (Fig. 9). Some FtERF genes were found to be associated with at least two pairs of homologous genes (especially between tartary buckwheat and Glycine max ERF genes), such as FtPinG0003005100.01 and FtPinG0002711700.01, which suggested that these genes might play an important role in the ERF subfamily during evolution (Additional file 5: Table S3). The syntenic analysis provided reliable evidence to support and validate the previous phylogenetic groupings and motif distribution. In general, these data indicated that the tartary buckwheat AP2/ERF gene family was highly conserved and the tartary buckwheat AP2/ERF genes were closer to the Glycine max genes than to the A. thaliana genes. The AP2/ERF genes might have evolved from the common ancestor in different plants.
Fig. 8.
Phylogenetic relationships and motif compositions of ERF proteins from five different plant species. Left panel: An unrooted phylogenetic tree constructed using Geneious R11 with the neighbor-joining method. Right panel: Distribution of conserved motifs in ERF proteins. The differently colored boxes represent different motifs and their positions in each ERF protein sequence
Fig. 9.
Synteny analysis of ERF genes between tartary buckwheat and seven representative plant species. The gray lines in the background indicate the collinear blocks within tartary buckwheat and other plant genomes, while the red lines highlight the syntenic ERF gene pairs
Expression patterns of FtAP2/ERF genes in different plant tissues
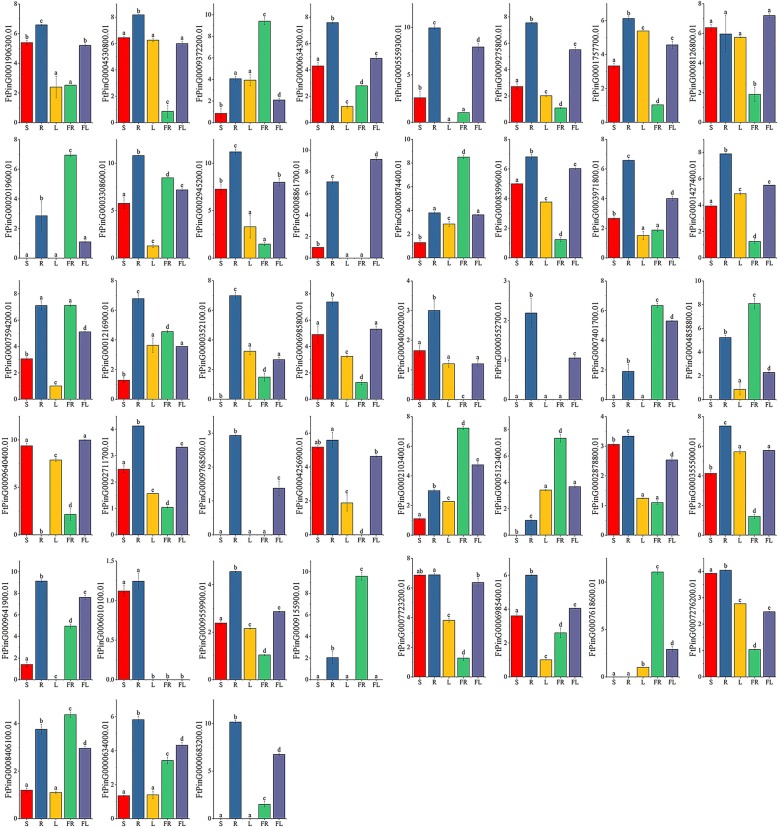
To investigate the physiological roles of FtAP2/ERF genes, qRT- PCR was performed to detect the tissue-specific expression of each AP2/ERF gene. The accumulation of transcriptional products of 15 AP2 genes, 3 RAV genes and 43 ERF genes in root, stem, leaf, flower, and fruit was evaluated. The results showed that the transcriptional abundance of FtAP2/ERF genes varied greatly in different tissues and organs, suggesting that the FtAP2/ERF genes had multiple functions in tartary buckwheat growth and development.
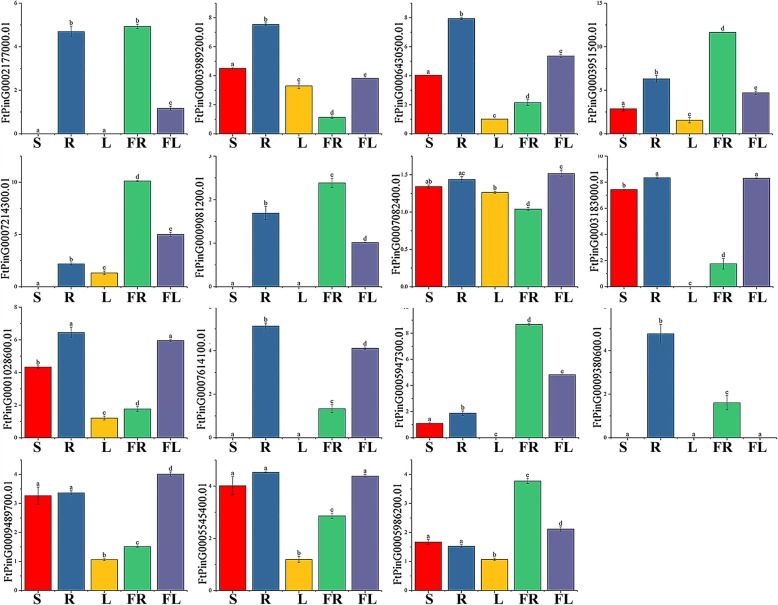
In the AP2 subfamily, eight genes (FtPinG0003989200.01/6430500.01/3951500. 01/7082400.01/ 1,028,600.01/9489700.01/5545400.01/5986200.01) were expressed in all tissues, five genes (FtPinG0002177000.01/7214300.01/9081200.01/5947300.01/5986200.01) had the highest expression level in fruit, two genes (FtPinG0007082400.01/9489700.01) had the highest expression in flowers, and only three genes (FtPinG0007214300.01/5947300.01/5986200.01) were expressed at higher levels in reproductive organs than in other tissues (Fig. 10). Simultaneously, we studied the correlation of the FtAP2 gene expression pattern in tartary buckwheat roots, stems, flowers, leaves and fruits (Additional file 6: Figure S2). Most of the FtAP2 genes were positively correlated, and the FtAP2 genes (FtPinG0006430500.01 and FtPinG0007614100.01/1028600.01; FtPinG0003951500.01 and FtPinG0009081200.01; FtPinG0007214300.01 and FtPinG0005986200.01/5947300.01; FtPinG0003183000.01 and FtPinG0005545400.01/9489700.01/7614100.01/1028600.01) that were significantly correlated were found to be positively correlated (Additional file 6: Figure S2).
Fig. 10.
Tissue-specific gene expression of 15 tartary buckwheat AP2 genes. The expression patterns of 15 tartary buckwheat AP2 genes in flower, leaf, root, stem and fruit tissues were examined by qPCR. Error bars were obtained from three measurements. Small letter(s) above the bars indicate significant differences (α = 0.05, LSD) among the treatments
The ERF gene structures in tartary buckwheat and in A. thaliana, Glycine max, Solanum lycopersicum and Helianthus annuus were analyzed by phylogenetic tree analysis (Fig. 8). The gene structure in each group was similar, indicating the performance of potentially similar functions. The functions of many ERF genes in A. thaliana have been identified, such as AT3G15210.1, which negatively regulates ethylene and abscisic acid (ABA) responses. Therefore, we selected a total of 43 genes from each group with a similar evolutionary relationship to A. thaliana ERF (AtERF) genes for tissue-specific expression analysis. Among the 43 selected ERF genes, 60.47% were expressed in all tissues, 67.44% had the highest expression level in root, eleven (FtPinG0009372200.01/2019600.01/874400.01/401700.01/4858800.01/2103400.01/5123400.01/9155900.01/7618600.01/8406100.01/7594200.01) had the highest expression in fruit, and three (FtPinG0008861700.01/ 0008126800.01/ 9640400.01) had the highest expression in flower (Fig. 11). The correlation analysis of ERF subfamily gene expression in different tissues revealed a strong correlation between the genes, and most of the genes were positively correlated (Additional file 7: Figure S3). The expression level of FtPinG0009372200.01 was highest in fruit, which was significantly positively correlated with other genes (FtPinG0009155900.01, FtPinG0004858800.01, FtPinG0000874400.01, and FtPinG0002019600.01) with a high expression level in fruit. Similarly, FtPinG0001906300.01 was significantly positively correlated with other genes (FtPinG0006985400.01, FtPinG0007723200.01, and FtPinG0002878800.01, among others) that were highly expressed in root (Additional file 7: Figure S3).
Fig. 11.
Tissue-specific gene expression of 43 tartary buckwheat ERF genes. The expression patterns of 43 tartary buckwheat ERF genes in flower, leaf, root, stem and fruit tissues were examined by qPCR. Error bars were obtained from three measurements. Small letter(s) above the bars indicate significant differences (α = 0.05, LSD) among the treatments
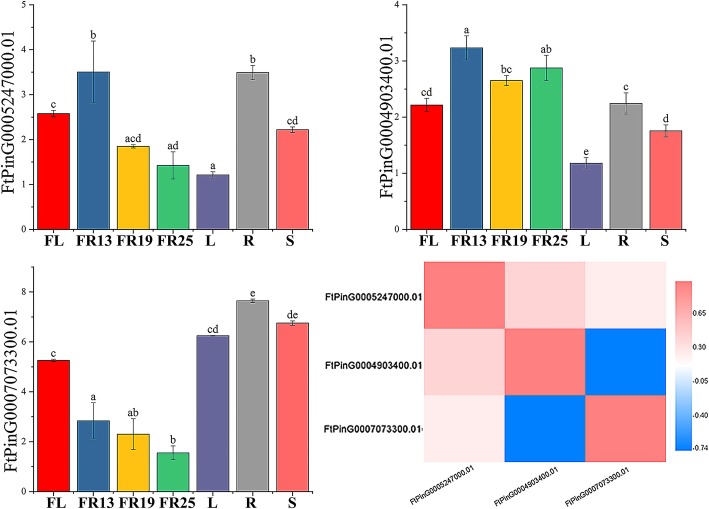
There were only three members of the RAV subfamily, among which FtPinG0005247000.01 had the highest expression level in roots and the lowest expression level in leaves, FtPinG0004903400.01 had the highest expression level in fruits and the lowest expression level in leaves, and FtPinG0007073300.01 had the highest expression level in roots and the lowest expression level in fruits (Fig. 12).
Fig. 12.
Tissue-specific gene expression and correlation between the gene expression of 3 tartary buckwheat RAV genes. The expression patterns of 3 tartary buckwheat RAV genes in flower, leaf, root, stem and fruit tissues were examined by qPCR. Error bars were obtained from three measurements. Small letter(s) above the bars indicate significant differences (α = 0.05, LSD) among the treatments. Positive number: positively correlated; negative number: negatively correlated
Differential expression of FtAP2/ERF genes during fruit development of tartary buckwheat
Ethylene is a simple but very important plant hormone. It is involved in seed germination, plant flowering, fruit maturation, organ senescence, and shedding, among other processes [40]. ERF family genes located downstream of the ethylene signaling pathway are important transcription factors that regulate the ethylene biosynthesis pathway. Therefore, we can systematically study the expression of FtAP2/ERF genes at different stages of fruit development (green fruit stage, discoloration stage and initial maturity stage) and find some genes that potentially regulate fruit maturation and development.
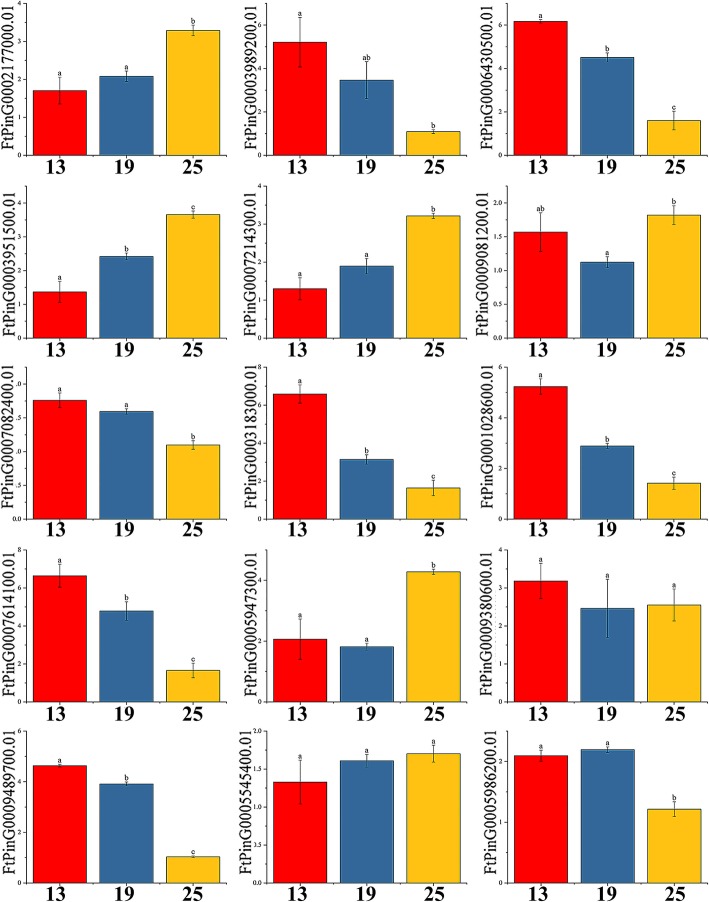
The expression patterns of FtAP2/ERF tartary buckwheat fruits at different developmental stages (green fruit stage, discoloration stage and initial maturity stage) were different. In the AP2 subfamily, all the genes were expressed in three stages. With the development of the fruit, the expression levels of eight genes (FtPinG0003989200.01/6430500.01/7082400.01/3183000.01/28600.01/761400.01/9380600.01/9489700.01) gradually decreased and those of six genes (FtPinG0002177000.01 /3951500.01 /7214300.01 /9081200.01 /5947300.01 /5545400.01) gradually increased, but only one gene (FtPinG0005986200.01) was expressed at the highest level in the discoloration stage (Fig. 13). Concurrently, we studied the correlation of AP2 gene expression patterns with tartary buckwheat fruit development and the correlation of each gene during this process. As shown in Additional file 8: Figure S4, only FtPinG0003951500.01 was significantly positively correlated with fruit development, while the FtAP2 genes (FtPinG0002177000.01 and FtPinG0007214300.01; FtPinG0003989200.01 and FtPinG0007614100.01/6430500.01; FtPinG0006430500.01 and FtPinG0007614100.01; FtPinG0007082400.01 and FtPinG0009489700.01) were found to be significantly positively correlated.
Fig. 13.
Gene expression of 15 tartary buckwheat AP2 genes during fruit development. The expression patterns of 15 tartary buckwheat AP2 genes in the fruit development stage were examined using a qPCR assay. Error bars were obtained from three measurements. Small letter(s) above the bars indicate significant differences (α = 0.05, LSD) among the treatments
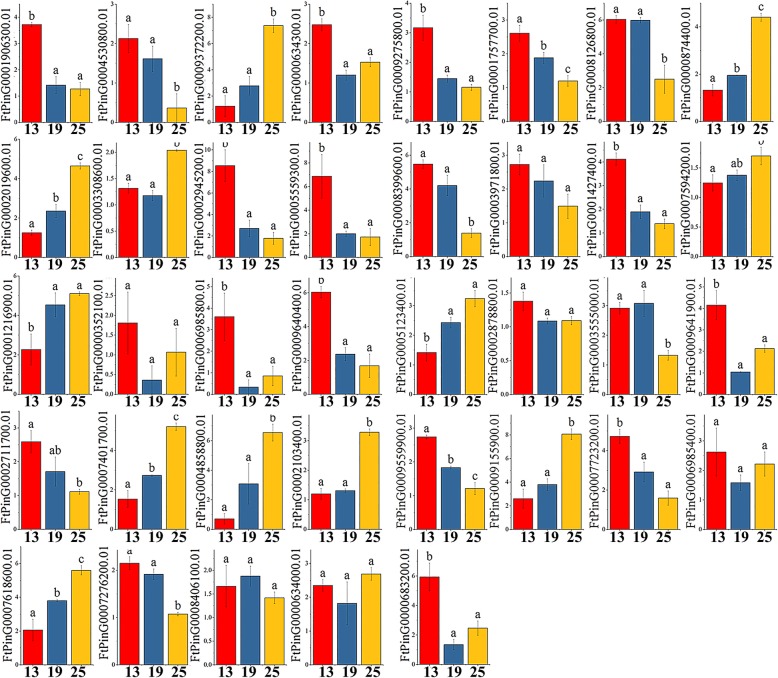
By analyzing the expression of ERF subfamily genes during three fruit developmental stages (green fruit stage, discoloration stage and initial maturity stage), we found that all the selected ERF genes were expressed in the fruit development stage. Among the eleven genes with the highest expression level in fruit, we found that only FtPinG0008406100.01 was expressed at the highest level during the discoloration stage; the expression of all the other genes gradually increased throughout the fruit development stage (Fig. 14). During fruit development, the expression level of FtPinG0008126800.01 and FtPinG0009640400.01 gradually decreased (expressed at the highest level in flowers), while those of most genes that were highly expressed in roots also decreased with fruit development (Fig. 14). Based on the correlation analysis of ERF subfamily gene expression levels during different fruit development periods and of each gene during this process, we found that FtPinG0007618600.01 and FtPinG0005123400.01 were significantly positively correlated with fruit development, while there was a significant positive correlation among FtPinG0009372200.01 and other genes (FtPinG0009155900.01, FtPinG0007594200.01 and FtPinG0000874400.01) with high expression levels in fruit (Additional file 9: Figure S5).
Fig. 14.
Gene expression of 43 tartary buckwheat ERF genes during fruit development. The expression patterns of 43 tartary buckwheat ERF genes in the fruit development stage were examined by qPCR. Error bars were obtained from three measurements. Small letter(s) above the bars indicate significant differences (α = 0.05, LSD) among the treatments
In the RAV subfamily, the expression levels of two genes (FtPinG0005247000.01 and FtPinG0007073300.01) in the three stages of fruit development (green fruit stage, discoloration stage and initial maturity stage) gradually decreased, and the expression level of only FtPinG0004903400.01 was lowest in the discoloration stage (Fig. 12).
Discussion
The AP2/ERF gene family plays an important role in various physiological processes, and it has been extensively studied in many plants, such as A. thaliana [9], Vitis vinifera [41], castor bean [42], and peach [43]. However, few studies have investigated the AP2/ERF genes in tartary buckwheat. In the current study, a search for AP2/ERF genes in the tartary buckwheat genome resulted in the identification of 134 members, including 116 ERF family members, 15 AP2 family members and 3 RAV family members. Previous studies have revealed similar numbers of AP2/ERF genes in other plants, such as Vitis vinifera with 132 AP2/ERF genes, including 109 ERF members, and peach with 130 AP2/ERF members, including 104 ERF genes. Concurrently, the genome size of the three plants was different, with 475 Mb in Vitis vinifera, 265 Mb in peach and 489 Mb in tartary buckwheat, thus showing that the number of AP2/ERF superfamily members was relatively stable and that there was no absolute correlation with genome size.
Structural analysis of the ERF subfamily showed that 79.3% of FtERF genes had no introns, while the number of introns in the AP2 subfamily genes ranged from 3 to 9 (Fig. 2b). The gene structure of AP2/ERF genes in tartary buckwheat was similar to that of AP2/ERF genes in Hordeum vulgare L [44]. The difference between the structure of AP2 subfamily and ERF subfamily genes supported a vast differentiation in the genome evolution. The domains and motifs of transcription factors are often related to protein interaction, transcriptional activity and DNA binding [45]. Motif analysis showed that most of the AP2/ERF genes of tartary buckwheat contained Motif-1, Motif-2, Motif-3, and Motif-4, which were related to the AP2 domain (Fig. 2c). Motif-7, Motif-8 and Motif-10 were specifically detected in different groups of the ERF subfamily, indicating that they play an important role in this subfamily. These results suggest that although some motifs of the AP2/ERF family genes were highly conserved, the new evolutionary motifs might perform new functions in some plants, and the functions of these new evolutionary motifs require further verification.
Duplications of individual genes, chromosomal fragments, or entire genomes have long been considered a major source of evolution, including new gene functions and expression patterns [46]. Our study showed that most duplicated FtERF genes were expressed in different tissues / organs, suggesting that these genes had specific or redundant cellular functions. Evidence for differences between duplicate genes can be inferred from the expression patterns of the FtPinG0004790900.01 and FtPinG0004790700.01 genes. FtPinG0004790900.01 was highly expressed in stem, but FtPinG0004790700.01 was not expressed (Additional file 10: Figure S6). The composition and location of their motifs are identical (Fig. 8), and therefore we speculate that the reason for their expression level differences might be due to the mutation of genes involved in the process of replication, which leads to a loss of function of FtPinG0004790700.01. In addition, functional differences may lead to differences in gene pair expression patterns. For example, the mRNA abundance of FtPinG0001644300.01 peaked in flower, but FtPinG0001644600.01 was highly expressed in root (Additional file 10: Figure S6). FtPinG0001644600.01 contains motif-7, but FtPinG0001644300.01 does not (Fig. 8); thus, we speculate that the alteration of the motifs of the two genes during replication may be one of the causes of the functional differences.
The functions of genes can be preliminarily predicted by analysis of the gene expression patterns [47]. Tissue-specific expression profiles indicated that most of the AP2 subfamily genes (53.33%) (Fig. 10), ERF subfamily genes (60.47%) (Fig. 11) and RAV subfamily genes (100%) (Fig. 12) were expressed in all tissues. However, 46.7 and 67.44% of the genes in the AP2 subfamily and ERF subfamily were expressed at higher levels in roots, and similar results have been found in other plants [32, 42]. Based on the phylogenetic tree, we found that AP2 genes (FtPinG0002177000.01, FtPinG0009081200.01, and FtPinG0005947300.01) that were highly expressed in tartary buckwheat fruit were clustered together (Fig. 1). FtPinG0002177000.01 was highly expressed not only in buckwheat fruit but also in roots (Fig. 10). Exploration of the evolutionary relationship between these AP2 genes and other AP2 genes in other plants revealed a similar evolutionary relationship of FtPinG0002177000.01 and AT5G10510.1 (AIL6) and identical motif compositions (Fig. 5). Moreover, AIL6 was identified as a gene that promotes shoot growth and floral meristem initiation in A. thaliana, and thus this provides a direction for us to further verify the functionality of FtPinG0002177000.01 [48]. Plants accumulate triacylglycerol in their seeds to provide carbon and energy for seedling growth. An interesting AP2 gene, AtWRI1 (At3g54320), was identified in A. thaliana, which was highly expressed in seeds. It can not only regulate the biosynthesis of plant oil but also promote seed germination. The FtPinG0005986200.01 was clustered with AtWRI1, and their tissue-specific expression patterns were similar. Thus, it is necessary to further validate whether FtPinG0005986200.01 can also promote seed germination. In A. thaliana, the expression level of ANT (AT1G72570.1), a member of the AP2 subfamily, was high in young tissues such as inflorescence and siliques but low in leaves and stems, which could promote the development of floral organs [49]. The expression pattern of FtPinG0005947300.01 in tartary buckwheat was similar to that of AT1G72570.1 (Fig. 10), and, as shown in Fig. 5, the evolutionary relationship of FtPinG0005947300.01 was closely to AT1G72570.1 and the motif composition in their core regions was very consistent. Therefore, we need to further verify whether FtPinG0005947300.01 possesses a function similar to AT1G72570.1 and plays an important role in regulating the growth and development of flowers and other organs.
Fruit development is divided into five stages: organogenesis, expansion, maturation, ripening, and senescence [50]. Tartary buckwheat seeds can be divided into five stages from flowering to maturation: young fruit stage (0–8 DAP), green fruit stage (8–14 DAP), discoloration stage (14–22 DAP), initial maturity stage (22–26 DAP), and mature stage (26–30 DAP), and the accumulation of plant hormones and nutrients differs in each stage [27]. Ethylene can promote fruit ripening, and ethylene signaling plays an important role in fruit development and the plant stress response [51]. The respiration rate of climacteric fruits such as tomato increases rapidly during ripening, accompanied by a rise in ethylene content [52]. In addition, the ethylene content also increases prior to veraison of nonclimacteric fruits such as grape [53]. Studies have shown that AP2 genes not only regulate the seed quality and yield by changing the number and size of embryonic cells, but also the growth and development of flower organs [54–56], while ERF genes control the final steps of ethylene signal transduction by binding to the GCC box in the promoter region of pathogen-related genes, thus affecting fruit maturation [57]. Fruit size has been shown to be related to the initial state of the embryo, while the final size of tartary buckwheat fruit is related to the division of embryonic cells. Additionally, fruit size reaches its maximum from the green fruit stage to the initial maturity stage, so the tartary buckwheat fruit size was determined during the early stage of development [27, 58]. In this study, an AP2 gene, FtPin0009489700.01, was shown to possess the high expression level in all tissues, but highest in fruits (Fig. 10). Moreover, it had the highest expression level in early fruit development (green fruit stage) (Fig. 13). Therefore, we can try to further verify the role of FtPin0009489700.01 in plant growth and development from the point of effect of FtPin0009489700.01 on fruit size in the future. The transcription factor AtERF4, which can negatively regulate ethylene and ABA responses, was isolated from A. thaliana. Phylogenetic analysis indicated a similar relationship between FtPinG0003308600.01 and AT3G15210.1 (AtERF4), and the motif composition of the genes was identical (Fig. 8). Therefore, we speculated that FtPinG0003308600.01 might also regulate the responses of ethylene and ABA. Interestingly, we observed increasing contents of ABA in the development of buckwheat fruits (discoloration stage to initial maturity stage) [27] and of FtPinG0003308600.01 in development stages of fruits (Additional file 8: Figure S4); thus, FtPinG0003308600.01 might be a positive regulator of the response of ethylene and ABA, necessitating further experimental verification. In general, the AP2/ERF family genes were considered to play an indispensable role in fruit formation and development.
Conclusions
This is the first comprehensive analysis of AP2/ERF genes in tartary buckwheat with the goal of elucidating the evolution, expression patterns and possible functions of AP2/ERF genes in tartary buckwheat. These findings provide insights for predicting the functions of AP2/ERF genes in flower and seed development, and the comprehensive analysis of the results was helpful for screening genes for further functional identification and for genetic improvement of agronomic traits of tartary buckwheat.
Additional files
Table S4. The primer sequences of qRT-PCR. (XLS 38 kb)
Table S1. List of the 134 FtAP2/ERF genes identified in this study. (XLS 258 kb)
Figure S1. Alignment of multiple FtAP2/ERF and selected AP2 domain amino acid sequences. (DOCX 4133 kb)
Table S2. Analysis and distribution of conserved motifs in tartary buckwheat AP2/ERF proteins. (XLS 41 kb)
Table S3. One-to-one orthologous relationships between tartary buckwheat and other plants. (XLS 106 kb)
Figure S2. The correlation between the gene expression of FtAP2s. Positive number: positively correlated; negative number: negatively correlated. Red numbers indicate a significant correlation at the 0.05 level. (DOCX 1124 kb)
Figure S3. The correlation between the gene expression of FtERFs. Positive number: positively correlated; negative number: negatively correlated. Red numbers indicate significant correlation at 0.05 levels. (DOCX 1348 kb)
Figure S4. The correlation between the gene expression of FtAP2s during fruit development. Positive number: positively correlated; negative number: negatively correlated. Red numbers indicate significant correlation at 0.05 levels. (DOCX 911 kb)
Figure S5. The correlation between the gene expression of FtERFs during fruit development. Positive number: positively correlated; negative number: negatively correlated. Red numbers indicate significant correlation at 0.05 levels. (DOCX 1390 kb)
Figure S6. Tissue-specific gene expression of 3 tandem duplication tartary buckwheat ERF genes. The expression patterns of 3 tandem duplication tartary buckwheat ERF genes in flower, leaf, root, stem and different stage fruit tissues were examined by qPCR. Error bars were obtained from three measurements. Small letter(s) above the bars indicate significant differences (α = 0.05, LSD) among the treatments. (DOCX 238 kb)
Acknowledgements
We thank all the colleagues in our laboratory for providing useful discussions and technical assistance. We are very grateful to the editor and reviewers for critically evaluating the manuscript and providing constructive comments for its improvement.
Funding
Funding this research was supported by the National Natural Science Foundation of China (31500289), and the National Key R&D Program of China (2018YFD1000706). Funds were used for the design of the study and collection, analysis, and interpretation of data and in writing the manuscript, as well as in the open access payment.
Availability of data and materials
The genome sequences of tartary buckwheat used for identifying the AP2/ERF genes in this study were located in the Tartary Buckwheat Genome Project (TBGP; http://www.mbkbase.org/Pinku1/). The tartary buckwheat accessions (XIQIAO; accessions number: CHUAN 2008013) materials used in the experiment were supplied by Professor Wang Anhu of Xichang University. The datasets supporting the conclusions of this article are included with in the article and its Additional files.
Abbreviations
- A. thaliana
Arabidopsis thaliana
- ABA
Abscisic acid
- AtERF
A. thaliana ERF
- CDS
Coding sequence
- DAP
Days after pollination
- ERFs
Ethylene response factors
- Ft
Fagopyrum tataricum
- LG
Linkage group
- MV
Molecular weight
- PI
Isoelectric point
- qRT-PCR
Quantitative real-time PCR
- TFs
Transcription factors
Authors’ contributions
M-YL planned and designed the research, and analyzed data. W-JS wrote the original manuscript. W-JS and Z-TM determined the expression of genes by qRT-PCR. T-RZ and LH identified FtAP2/ERF family genes and visualized their structures. QW and Z-ZT performed the evolutionary analysis of FtAP2/ERF genes and several different species. T-LB and C-LL performed FtAP2/ERF genes chromosome distribution, gene replication and synchronous analysis. GZ planted and collected plant materials. M-YL and GZ reviewed and edited the manuscript. HC supervised the research. M-YL and W-JS contributed equally. All authors read and approved the final manuscript.
Ethics approval and consent to participate
The tartary buckwheat accessions (XIQIAO) materials used in the experiment were supplied by Professor Wang Anhu of Xichang University. These plant materials are widely used all over the world. and no permits are required for the collection of plant samples. The plant materials are maintained in accordance with the institutional guidelines of the College of Life Sciences, Sichuan Agricultural University, China. This article did not contain any studies with human participants or animals, and did not involve any endangered or protected species.
Consent for publication
Not applicable.
Competing interests
The authors declare that they have no competing interests.
Publisher’s Note
Springer Nature remains neutral with regard to jurisdictional claims in published maps and institutional affiliations.
Contributor Information
Moyang Liu, Email: lmyyunxi@163.com.
Wenjun Sun, Email: sunnan82475@163.com.
Zhaotang Ma, Email: WaohUncle_Ma@163.com.
Tianrun Zheng, Email: kobezey@163.com.
Li Huang, Email: 18428385443@163.com.
Qi Wu, Email: wuqi@sicau.edu.cn.
Gang Zhao, Email: zhaogang@cdu.edu.cn.
Zizhong Tang, Email: 3530279123456789@163.com.
Tongliang Bu, Email: tlbu@163.com.
Chenglei Li, Email: lichenglei1998@163.com.
Hui Chen, Phone: (+86) 18981604486, Email: chenhui@sicau.edu.cn.
References
- 1.Kuluev B, Avalbaev A, Nurgaleeva E, Knyazev A, Nikonorov Y, Chemeris A. Role of AINTEGUMENTA- like gene NtANTL in the regulation of tobacco organ growth. J Plant Physiol. 2015;189:11–23. doi: 10.1016/j.jplph.2015.08.009. [DOI] [PubMed] [Google Scholar]
- 2.Jofuku KD, Omidyar PK, Gee Z, Okamuro JK. Control of seed mass and seed yield by the floral homeotic gene APETALA2. Proc Natl Acad Sci U S A. 2005;102(8):3117–3122. doi: 10.1073/pnas.0409893102. [DOI] [PMC free article] [PubMed] [Google Scholar]
- 3.Jofuku KD, den Boer BG, Van MM, Okamuro JK. Control of Arabidopsis flower and seed development by the homeotic gene APETALA2. Plant Cell. 1994;6(9):1211–1225. doi: 10.1105/tpc.6.9.1211. [DOI] [PMC free article] [PubMed] [Google Scholar]
- 4.Wessler SR. Homing into the origin of the AP2 DNA binding domain. Trends Plant Sci. 2005;10(2):54–56. doi: 10.1016/j.tplants.2004.12.007. [DOI] [PubMed] [Google Scholar]
- 5.Nakano T, Suzuki K, Fujimura T, Shinshi H. Genome-wide analysis of the ERF gene family in Arabidopsis and Rice. Plant Physiol. 2006;140(2):411–433. doi: 10.1104/pp.105.073783. [DOI] [PMC free article] [PubMed] [Google Scholar]
- 6.Riechmann JL, Meyerowitz EM. The AP2/EREBP family of plant transcription factors. Biol Chem. 1998;379(6):633–646. doi: 10.1515/bchm.1998.379.6.633. [DOI] [PubMed] [Google Scholar]
- 7.Zhao SP, Xu ZS, Zheng WJ, Zhao W, Wang YX, Yu TF, Chen M, Zhou YB, Min DH, Ma YZ. Genome-wide analysis of the RAV family in soybean and functional identification of GmRAV-03Involvement in salt and drought stresses and exogenous ABA treatment. Front Plant Sci. 2017;8:905–922. doi: 10.3389/fpls.2017.00905. [DOI] [PMC free article] [PubMed] [Google Scholar]
- 8.Romanel EA, Schrago CG, Couñago RM, Russo CA, Alvesferreira M. Evolution of the B3 DNA binding superfamily: new insights into REM family gene diversification. PLoS One. 2009;4(6):e5791–e5809. doi: 10.1371/journal.pone.0005791. [DOI] [PMC free article] [PubMed] [Google Scholar]
- 9.Sakuma Y, Liu Q, Dubouzet JG, Abe H, Shinozaki K, Yamaguchi-Shinozaki K. DNA-binding specificity of the ERF/AP2 domain of Arabidopsis DREBs, transcription factors involved in dehydration- and cold-inducible gene expression. Biochem Biophys Res Commun. 2002;290(3):998–1009. doi: 10.1006/bbrc.2001.6299. [DOI] [PubMed] [Google Scholar]
- 10.Kunst L, Klenz JE, Martinezzapater J, Haughn GW. AP2 gene determines the identity of Perianth organs in flowers of Arabidopsis thaliana. Plant Cell. 1989;1(12):1195–1208. doi: 10.1105/tpc.1.12.1195. [DOI] [PMC free article] [PubMed] [Google Scholar]
- 11.Elliott RC, Betzner AS, Huttner E, Oakes MP, Tucker WQ, Gerentes D, Perez P, Smyth DR. AINTEGUMENTA, an APETALA2-like gene of Arabidopsis with pleiotropic roles in ovule development and floral organ growth. Plant Cell. 1996;8(2):155–168. doi: 10.1105/tpc.8.2.155. [DOI] [PMC free article] [PubMed] [Google Scholar]
- 12.Aukerman MJ, Sakai H. Regulation of flowering time and floral organ identity by a MicroRNA and its APETALA2-like target genes. Plant Cell. 2003;15(11):2730–2741. doi: 10.1105/tpc.016238. [DOI] [PMC free article] [PubMed] [Google Scholar]
- 13.Krizek BA, Eaddy M. AINTEGUMENTA-LIKE6 regulates cellular differentiation in flowers. Plant Mol Biol. 2012;78(3):199–209. doi: 10.1007/s11103-011-9844-3. [DOI] [PubMed] [Google Scholar]
- 14.Jiang F, Guo M, Yang F, Duncan K, Jackson D, Rafalski A, Wang S, Li B. Mutations in an AP2 transcription factor-like gene affect internode length and leaf shape in maize. PLoS One. 2012;7(5):e37040–e37049. doi: 10.1371/journal.pone.0037040. [DOI] [PMC free article] [PubMed] [Google Scholar]
- 15.Li A, Yu X, Cao BB, Peng LX, Gao Y, Feng T, Li H, Ren ZY. LkAP2L2 , an AP2/ERF transcription factor gene of Larix kaempferi , with pleiotropic roles in plant branch and seed development. Russ J Genet. 2017;53(12):1335–1342. [Google Scholar]
- 16.Fits L, Memelink J. ORCA3, a jasmonate-responsive transcriptional regulator of plant primary and secondary metabolism. Science. 2000;289(5477):295–297. doi: 10.1126/science.289.5477.295. [DOI] [PubMed] [Google Scholar]
- 17.Deng B, Huang Z, Ge F, Liu D, Lu R, Chen C. An AP2/ERF family transcription factor PnERF1 raised the biosynthesis of Saponins in Panax notoginseng. J Plant Growth Regul. 2017;36(3):1–11. [Google Scholar]
- 18.Yu ZX, Li JX, Yang CQ, Hu WL, Wang LJ, Chen XY. The Jasmonate-responsive AP2/ERF transcription factors AaERF1 and AaERF2 positively regulate artemisinin biosynthesis in Artemisia annua L. Mol Plant. 2012;5(2):353–365. doi: 10.1093/mp/ssr087. [DOI] [PubMed] [Google Scholar]
- 19.Yao Y, He RJ, Xie QL, Zhao XH, Deng XM, He JB, Song L, He J, Marchant A, Chen XY. ETHYLENE RESPONSE FACTOR 74 (ERF74) plays an essential role in controlling a respiratory burst oxidase homolog D (RbohD)-dependent mechanism in response to different stresses in Arabidopsis. New Phytol. 2017;213(4):1667–1682. doi: 10.1111/nph.14278. [DOI] [PubMed] [Google Scholar]
- 20.Dubouzet JG, Sakuma Y, Ito Y, Kasuga M, Dubouzet EG, Miura S, Seki M, Shinozaki K, Yamaguchi-Shinozaki K. OsDREB genes in rice, Oryza sativa L., encode transcription activators that function in drought-, high-salt- and cold-responsive gene expression. Plant J. 2003;33(4):751–763. doi: 10.1046/j.1365-313x.2003.01661.x. [DOI] [PubMed] [Google Scholar]
- 21.Stockinger EJ, Gilmour SJ, Thomashow MF. Arabidopsis thaliana CBF1 encodes an AP2 domain-containing transcriptional activator that binds to the C-repeat/DRE, a cis-acting DNA regulatory element that stimulates transcription in response to low temperature and water deficit. Proc Natl Acad Sci U S A. 1997;94(3):1035–1040. doi: 10.1073/pnas.94.3.1035. [DOI] [PMC free article] [PubMed] [Google Scholar]
- 22.M M SM-B. Ethylene response factors: a key regulatory hub in hormone and stress signaling. Plant Physiol. 2015;169(1):32–41. doi: 10.1104/pp.15.00677. [DOI] [PMC free article] [PubMed] [Google Scholar]
- 23.Banno H, Ikeda Y, Niu QW, Chua NH. Overexpression of Arabidopsis ESR1 induces initiation of shoot regeneration. Plant Cell. 2001;13(12):2609–2618. doi: 10.1105/tpc.010234. [DOI] [PMC free article] [PubMed] [Google Scholar]
- 24.Ryun WH, Hee KJ, Junyoung K, Jeongsik K, Ung L, In-Ja S, Jin-Hong K, Hyo-Yeon L, Gil NH, Ok LP. The RAV1 transcription factor positively regulates leaf senescence inArabidopsis. J Exp Bot. 2010;61(14):3947–3957. doi: 10.1093/jxb/erq206. [DOI] [PMC free article] [PubMed] [Google Scholar]
- 25.Sohn KH, Lee SC, Jung HW, Hong JK, Hwang BK. Expression and functional roles of the pepper pathogen-induced transcription factor RAV1 in bacterial disease resistance, and drought and salt stress tolerance. Plant Mol Biol. 2006;61(6):897–915. doi: 10.1007/s11103-006-0057-0. [DOI] [PubMed] [Google Scholar]
- 26.Morishita T, Yamaguchi H, Degi K. The contribution of polyphenols to Antioxidative activity In common buckwheat and Tartary buckwheat grain. Plant Prod Sci. 2007;10(1):99–104. [Google Scholar]
- 27.Liu M, Ma Z, Zheng T, Sun W, Zhang Y, Jin W, Zhan J, Cai Y, Tang Y, Wu Q. Insights into the correlation between physiological changes in and seed development of tartary buckwheat (Fagopyrum tataricum Gaertn) BMC Genomics. 2018;19(1):648–668. doi: 10.1186/s12864-018-5036-8. [DOI] [PMC free article] [PubMed] [Google Scholar]
- 28.Liu M, Ma Z, Zheng T, Wang J, Huang L, Sun W, Zhang Y, Jin W, Zhan J, Cai Y, et al. The potential role of auxin and abscisic acid balance and FtARF2 in the final size determination of Tartary buckwheat fruit. Int J Mol Sci. 2018;19(9):2755–2774. doi: 10.3390/ijms19092755. [DOI] [PMC free article] [PubMed] [Google Scholar]
- 29.Liu M, Fu Q, Ma Z, Sun W, Huang L, Wu Q, Tang Z, Bu T, Li C, Chen H. Genome-wide investigation of the MADS gene family and dehulling genes in tartary buckwheat (Fagopyrum tataricum) Planta. 2019;1:1–18. doi: 10.1007/s00425-019-03089-3. [DOI] [PubMed] [Google Scholar]
- 30.Rashid M, Guangyuan H, Guangxiao Y, Hussain J, Xu Y. AP2/ERF transcription factor in Rice: genome-wide canvas and Syntenic relationships between monocots and eudicots. Evol Bioinformatics Online. 2012;8(4):321–355. doi: 10.4137/EBO.S9369. [DOI] [PMC free article] [PubMed] [Google Scholar]
- 31.Li H, Wang Y, Wu M, Li L, Li C, Han Z, Yuan J, Chen C, Song W, Wang C. Genome-wide identification of AP2/ERF transcription factors in cauliflower and expression profiling of the ERF family under salt and drought stresses. Front Plant Sci. 2017;8:946–960. doi: 10.3389/fpls.2017.00946. [DOI] [PMC free article] [PubMed] [Google Scholar]
- 32.Song X, Ying L, Hou X. Genome-wide analysis of the AP2/ERF transcription factor superfamily in Chinese cabbage (Brassica rapassp.Pekinensis) Mol Genet Genomics Mgg. 2013;14(1):573. doi: 10.1186/1471-2164-14-573. [DOI] [PMC free article] [PubMed] [Google Scholar]
- 33.Li X, Tao S, Wei S, Ming M, Huang X, Zhang S, Wu J. The mining and evolutionary investigation of AP2/ERF genes in pear (Pyrus) BMC Plant Biol. 2018;18(1):46–60. doi: 10.1186/s12870-018-1265-x. [DOI] [PMC free article] [PubMed] [Google Scholar]
- 34.Dossa K, Xin W, Li D, Fonceka D, Zhang Y, Wang L, Yu J, Liao B, Diouf D, Cissé N. Insight into the AP2/ERF transcription factor superfamily in sesame and expression profiling of DREB subfamily under drought stress. BMC Plant Biol. 2016;16(1):171–187. doi: 10.1186/s12870-016-0859-4. [DOI] [PMC free article] [PubMed] [Google Scholar]
- 35.Jin JH, Wang M, Zhang HX, Khan A, Wei AM, Luo DX, Gong ZH. Genome-wide identification of the AP2/ERF transcription factor family in pepper (Capsicum annuum L.) Genome. 2018;61(9):663–674. doi: 10.1139/gen-2018-0036. [DOI] [PubMed] [Google Scholar]
- 36.Liu M, Ma Z, Wang A, Zheng T, Huang L, Sun W, Zhang Y, Jin W, Zhan J, Cai Y, et al. Genome-wide investigation of the auxin response factor gene family in Tartary buckwheat (Fagopyrum tataricum) Int J Mol Sci. 2018;19(11):3526–3544. doi: 10.3390/ijms19113526. [DOI] [PMC free article] [PubMed] [Google Scholar]
- 37.Wang A, Cai G, Zhao G, Yang J, Zhou L, Hu Y. Producing race bitter buckwheat Miqiao no.1 and It's Cuhival technology. Seed. 2010;29(2):104–106. [Google Scholar]
- 38.Livak KJ, Schmittgen TD. Analysis of relative gene expression data using real-time quantitative PCR and the 2 −ΔΔ C T method. Methods-A Companion To Methods in Enzymology. 2001;25(4):402–408. doi: 10.1006/meth.2001.1262. [DOI] [PubMed] [Google Scholar]
- 39.Licausi F, Giorgi FM, Zenoni S, Osti F, Pezzotti M, Perata P. Genomic and transcriptomic analysis of the AP2/ERF superfamily in Vitis vinifera. BMC Genomics. 2010;11(1):719–734. doi: 10.1186/1471-2164-11-719. [DOI] [PMC free article] [PubMed] [Google Scholar]
- 40.Bleecker AB, Kende H. Ethylene: a gaseous signal molecule in plants. Annu Rev Cell Dev Biol. 2000;16(1):1–18. doi: 10.1146/annurev.cellbio.16.1.1. [DOI] [PubMed] [Google Scholar]
- 41.Zhuang J, Peng R-H, Cheng Z-M, Zhang J, Cai B, Zhang Z, Gao F, Zhu B, Fu X-Y, Jin X-F. Genome-wide analysis of the putative AP2/ERF family genes in Vitis vinifera. Sci Hortic. 2009;123(1):73–81. [Google Scholar]
- 42.Xu W, Li F, Ling L, Liu A. Genome-wide survey and expression profiles of the AP2/ERF family in castor bean (Ricinus communis L.) BMC Genomics. 2013;14(1):1–15. doi: 10.1186/1471-2164-14-785. [DOI] [PMC free article] [PubMed] [Google Scholar]
- 43.Zhang C, Shangguan L, Ma R, Sun X, Tao R, Guo L, Korir N, Yu M. Genome-wide analysis of the AP2/ERF superfamily in peach (Prunus persica) Genet Mol Res Gmr. 2012;11(4):4789–4810. doi: 10.4238/2012.October.17.6. [DOI] [PubMed] [Google Scholar]
- 44.Guo B, Wei Y, Xu R, Lin S, Luan H, Lv C, Zhang X, Song X, Xu R. Genome-wide analysis of APETALA2/ethylene-responsive factor (AP2/ERF) gene family in barley (Hordeum vulgareL.) PLoS One. 2016;11(9):e0161322–e0161339. doi: 10.1371/journal.pone.0161322. [DOI] [PMC free article] [PubMed] [Google Scholar]
- 45.Liu L, White MJ, MacRae TH. Transcription factors and their genes in higher plants. FEBS J. 2010;262(2):247–257. doi: 10.1046/j.1432-1327.1999.00349.x. [DOI] [PubMed] [Google Scholar]
- 46.Lynch M, Conery JS. The evolutionary fate and consequences of duplicate genes. Science. 2000;290(5494):1151–1155. doi: 10.1126/science.290.5494.1151. [DOI] [PubMed] [Google Scholar]
- 47.Peng X, Zhao Y, Li X, Wu M, Chai W, Sheng L, Wang Y, Dong Q, Jiang H, Cheng B. Genomewide identification, classification and analysis of NAC type gene family in maize. J Genet. 2015;94(3):377–390. doi: 10.1007/s12041-015-0526-9. [DOI] [PubMed] [Google Scholar]
- 48.Krizek BA. Aintegumenta and Aintegumenta-Like6 regulate auxin-mediated flower development in Arabidopsis. Bmc Res Notes. 2011;4(1):176–184. doi: 10.1186/1756-0500-4-176. [DOI] [PMC free article] [PubMed] [Google Scholar]
- 49.NoleWilson S, Tranby TL, Krizek BA. AINTEGUMENTA-like (AIL) genes are expressed in young tissues and may specify meristematic or division-competent states. Plant Mol Biol. 2005;57(5):613–628. doi: 10.1007/s11103-005-0955-6. [DOI] [PubMed] [Google Scholar]
- 50.Alba R, Giovannoni JJ. Transcriptome and selected metabolite analyses reveal multiple points of ethylene control during tomato fruit development. Plant Cell. 2005;17(11):2954–2965. doi: 10.1105/tpc.105.036053. [DOI] [PMC free article] [PubMed] [Google Scholar]
- 51.Johnson PR, Ecker JR. The ethylene gas signal transduction pathway: a molecular perspective. Annu Rev Genet. 1998;32(1):227–254. doi: 10.1146/annurev.genet.32.1.227. [DOI] [PubMed] [Google Scholar]
- 52.Burg SP, Burg EA. Role of ethylene in fruit ripening. Plant Physiol. 1962;37(2):179–189. doi: 10.1104/pp.37.2.179. [DOI] [PMC free article] [PubMed] [Google Scholar]
- 53.Chervin C, El-Kereamy A, Roustan J-P, Latché A, Lamon J, Bouzayen M. Ethylene seems required for the berry development and ripening in grape, a non-climacteric fruit. Plant Sci. 2004;167(6):1301–1305. [Google Scholar]
- 54.Y M RLF. Plant organ size control: AINTEGUMENTA regulates growth and cell numbers during organogenesis. Proc Natl Acad Sci U S A. 2000;97(2):942–947. doi: 10.1073/pnas.97.2.942. [DOI] [PMC free article] [PubMed] [Google Scholar]
- 55.Nakamura K, Harada JJ, Fischer RL, Goldberg RB. Control of seed mass by APETALA2. Proc Natl Acad Sci U S A. 2005;102(8):3123–3128. doi: 10.1073/pnas.0409858102. [DOI] [PMC free article] [PubMed] [Google Scholar]
- 56.NoleWilson S, Krizek BA. DNA binding properties of the Arabidopsis floral development protein AINTEGUMENTA. Nucleic Acids Res. 2000;28(21):4076–4082. doi: 10.1093/nar/28.21.4076. [DOI] [PMC free article] [PubMed] [Google Scholar]
- 57.Xie XL, Shen SL, Yin XR, Xu Q, Sun CD, Grierson D, Ferguson I, Chen KS. Isolation, classification and transcription profiles of the AP2/ERF transcription factor superfamily in citrus. Mol Biol Rep. 2014;41(7):4261–4271. doi: 10.1007/s11033-014-3297-0. [DOI] [PubMed] [Google Scholar]
- 58.Sundaresan V. Control of seed size in plants. Proc Natl Acad Sci U S A. 2005;102(50):17887–17888. doi: 10.1073/pnas.0509021102. [DOI] [PMC free article] [PubMed] [Google Scholar]
Associated Data
This section collects any data citations, data availability statements, or supplementary materials included in this article.
Supplementary Materials
Table S4. The primer sequences of qRT-PCR. (XLS 38 kb)
Table S1. List of the 134 FtAP2/ERF genes identified in this study. (XLS 258 kb)
Figure S1. Alignment of multiple FtAP2/ERF and selected AP2 domain amino acid sequences. (DOCX 4133 kb)
Table S2. Analysis and distribution of conserved motifs in tartary buckwheat AP2/ERF proteins. (XLS 41 kb)
Table S3. One-to-one orthologous relationships between tartary buckwheat and other plants. (XLS 106 kb)
Figure S2. The correlation between the gene expression of FtAP2s. Positive number: positively correlated; negative number: negatively correlated. Red numbers indicate a significant correlation at the 0.05 level. (DOCX 1124 kb)
Figure S3. The correlation between the gene expression of FtERFs. Positive number: positively correlated; negative number: negatively correlated. Red numbers indicate significant correlation at 0.05 levels. (DOCX 1348 kb)
Figure S4. The correlation between the gene expression of FtAP2s during fruit development. Positive number: positively correlated; negative number: negatively correlated. Red numbers indicate significant correlation at 0.05 levels. (DOCX 911 kb)
Figure S5. The correlation between the gene expression of FtERFs during fruit development. Positive number: positively correlated; negative number: negatively correlated. Red numbers indicate significant correlation at 0.05 levels. (DOCX 1390 kb)
Figure S6. Tissue-specific gene expression of 3 tandem duplication tartary buckwheat ERF genes. The expression patterns of 3 tandem duplication tartary buckwheat ERF genes in flower, leaf, root, stem and different stage fruit tissues were examined by qPCR. Error bars were obtained from three measurements. Small letter(s) above the bars indicate significant differences (α = 0.05, LSD) among the treatments. (DOCX 238 kb)
Data Availability Statement
The genome sequences of tartary buckwheat used for identifying the AP2/ERF genes in this study were located in the Tartary Buckwheat Genome Project (TBGP; http://www.mbkbase.org/Pinku1/). The tartary buckwheat accessions (XIQIAO; accessions number: CHUAN 2008013) materials used in the experiment were supplied by Professor Wang Anhu of Xichang University. The datasets supporting the conclusions of this article are included with in the article and its Additional files.


