

Abstract
The fecal Fusobacterium nucleatum has been reported as a potential noninvasive biomarker for colorectal tumor in several studies, but its exact diagnostic accuracy was ambiguous due to the wide range of sensitivity and specificity. To assess the diagnostic accuracy of fecal F. nucleatum for colorectal tumor, we searched electronic databases including PubMed, Cochrane Library, Embase, and Web of Science, without any date and language restrictions. Two reviewers independently extracted data and appraised study quality with Quality Assessment of Diagnostic Accuracy Studies. We included ten studies comprising 13 cohorts for colorectal cancer (CRC) and seven cohorts for colorectal adenoma (CRA). A total of 1450 patients and 1421 controls for CRC and 656 patients and 827 controls for CRA were included. The pooled sensitivity and specificity of fecal F. nucleatum for CRC were 71% (95% CI, 61%‐79%) and 76% (95% CI, 66%‐84%), with the area under the receiver‐operating characteristics (AUC) curve of 0.80 (95% CI, 0.76‐0.83). The pooled sensitivity and specificity of fecal F. nucleatum for CRA were 36% (95% CI, 27%‐46%) and 73% (95% CI, 65%‐79%), with an AUC of 0.60 (95% CI, 0.56‐0.65). Substantial heterogeneity among studies existed, which was partly caused by DNA extraction kits, regions of study, sample size, and demographic characteristics of participants. Fecal F. nucleatum was valuable for the diagnosis of CRC although it performed below expectation. For CRA, the specificity of fecal F. nucleatum indicated the possibility of noninvasive screening. Subgroup analyses for adenoma were incomplete due to lack of data. Heterogeneity limited the credibility of the study.
Keywords: colorectal cancer, diagnosis, feces, Fusobacterium nucleatum
1. INTRODUCTION
Colorectal cancer (CRC) is the third most common cancer in the world and ranks as one of the five most common fatal cancers worldwide.1 The high morbidity and mortality are mainly due to the fact that CRC is usually not diagnosed until it has reached an advanced stage. Both incidence and death rates of CRC declined during recent years, largely thanks to the use of screening methods.2 Several screening strategies including colonoscopy and fecal immunochemical test (FIT) are recommended by international guidelines.3, 4 However, due to economic limitations and screening process, a majority of people has not undergone colonoscopy.3 On the other hand, FIT had a large range of the sensitivity for CRC, from 25% to 100%,5 and worked weakly when detecting colorectal adenoma (CRA),6, 7, 8, 9 although it has been a widely accepted screening strategy for CRC. Moreover, some conditions such as hemorrhoids could increase the risk of false‐positive FIT results.10 Thus, more noninvasive and economic biomarkers for CRC detection are urgently needed.
Recently, increased attention has been paid to the effect of microbiome in CRC. Since Fusobacterium nucleatum (F. nucleatum) infection was reported to be prevalent in CRC tissues,11 many studies have focused on its role in the carcinogenesis and development of colorectal tumor.12 In addition, F. nucleatum was also detected significantly more in the feces of CRC patients than healthy controls,13 suggesting that fecal F. nucleatum may be helpful for noninvasive CRC screening. Fecal F. nucleatum has been reported as a potential novel biomarker for CRC, even with a higher detection rate for CRC than FIT.14, 15 Another study also reported that the diagnostic accuracy of fecal F. nucleatum for CRC was as well as that of FIT, with a better diagnostic accuracy for CRA.16 These studies were encouraging, indicating that fecal F. nucleatum would be a promising biomarker for colorectal tumor and even be comparable with FIT. However, there were also some studies producing conflicting results.17, 18, 19 The diagnostic characteristics of fecal F. nucleatum for CRC have been ambiguous, with sensitivity ranging from 45% to 100% and specificity ranging from 10% to 92%.15, 17, 18 These all have added difficulties to assess the diagnostic accuracy of fecal F. nucleatum for colorectal tumor. Therefore, we conducted a meta‐analysis to explore the diagnostic accuracy of fecal F. nucleatum for CRC or CRA.
2. METHODS
2.1. Search strategy
We did a systematic search of several electronic databases, including PubMed, Cochrane Library, Embase, and Web of Science, without any date and language restrictions, for all studies about diagnostic performance of fecal F. nucleatum for CRC or CRA. We used medical subject headings and keywords for literature retrieval. The last search was performed in June 2018. Further details of the search strategy are provided in Supplementary Method.
2.2. Selection criteria
Two reviewers independently checked titles and abstracts of all retrieved articles and determined final eligibility according to full texts. All disagreement was settled by discussion and reached consensus. Studies were included if they met the following criteria: (a) studies evaluated the diagnostic accuracy of fecal F. nucleatum for CRC or CRA; (b) studies presented sufficient data to infer a two‐by‐two diagnostic table, comprising true positives (tp), false positives (fp), false negatives (fn), and true negatives (tn). We excluded letters, reviews, conference abstracts, and duplicate publications.
2.3. Data extraction and quality assessment
The same reviewers independently extracted study data to obtain relevant information. We contacted study authors to achieve data for extraction when necessary. For studies presenting results with different cutoff values,16 different subspecies18 and different subject‐recruiting sites,15, 19 we extracted all data to get the most information of these studies. The revised Quality Assessment of Diagnostic Accuracy Studies (QADAS‐2)20 was used to score the quality of included studies, and discrepancies were resolved.
2.4. Data synthesis and analysis
We performed data synthesis and analysis with STATA 14.0 (StataCorp, College Station, Texas), using midas and metandi modules. P value was regarded as statistically significant when it was equal to or less than 0.05. We calculated the pooled sensitivity, specificity, positive‐likelihood ratio, negative‐likelihood ratio, diagnostic odds ratio (DOR), and summary receiver‐operating characteristics (SROC) curve with 95% confidence interval (CI) by using hierarchical models. Hierarchical models include the bivariate model21 and the hierarchical SROC model.22 The former directly models the sensitivity, specificity and the correlation between them. The latter defines a hierarchical SROC (HSROC) curve by modeling functions of sensitivity and specificity.
We used a Deeks’ funnel plot to test the publication bias. It tests association between log diagnostic odds ratio (lnDOR) and “effective sample size,” which is a sample function of diseased and nondiseased individuals.23 The slope coefficient and relevant P value are associated with publication bias. We explored heterogeneity among included studies because study characteristics may be related to the study size and test accuracy.23 The I‐square (I 2) was calculated to estimate the heterogeneity.24
In our analysis, we used the one with higher sensitivity for the study18 presenting results with two different subspecies; we used the combined cohort, which included discovery cohort and validation cohort, for the study16 presenting results with three cohorts (discovery cohort, validation cohort, and combined cohort) and different cutoff values.
We excluded study one by one to assess the robustness of our findings.
We performed a series of predefined subgroup analyses according to DNA extraction kits (QIGEN or not QIGEN), regions (Asia or non‐Asia), and sample size (<200 or >200). Cutoff values and internal controls were different among included studies, so we could not stratify studies by them. Furthermore, we conducted a bivariate random‐effects meta‐regression analysis to explore the sources of heterogeneity further, with the following variables: the percent of early‐stage patients in all CRC patients (<50% or >50%), the percent of patients in all participants (<50% or 50%), the percent of males in patients (<60% or >60%), and the average age of all participants.
3. RESULTS
3.1. Study selection
We retrieved 243 articles through electronic databases at first, comprising 72 articles from PubMed, six articles from Cochrane Library, 86 articles from Embase, and 79 articles from Web of Science. After removing duplicates, we screened titles and abstracts of 146 articles and excluded 116 articles. We read full text of 30 studies, and 10 studies13, 14, 15, 16, 17, 18, 19, 25, 26, 27 were eligible in the meta‐analysis in the end and six14, 16, 17, 19, 25, 26 of them also reported diagnostic results of CRA. We included 13 cohorts of CRC and seven cohorts of CRA in the end because three articles15, 19, 27 recruited two cohorts independently from different sites. The procedure of study selection is shown in Figure 1.
Figure 1.
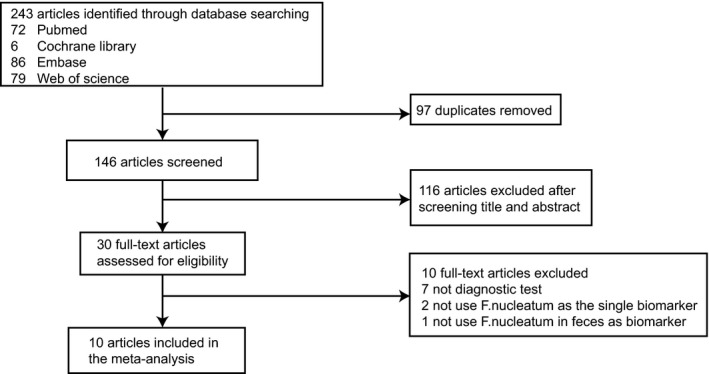
Flow diagram of study selection
3.2. Study characteristics
The main characteristics of 13 cohorts of CRC and seven cohorts of CRA are shown in Table 1.
Table 1.
Main characteristics of included studies in the meta‐analysis
| Study, year | Region | Participants, no. | Patients, no. | Standard reference | Mean age (control) | Mean age (patients) | Percent of early‐stage patientsa, % | Percent of malesb, % | DNA extraction kit |
|---|---|---|---|---|---|---|---|---|---|
| CRC | |||||||||
| Zellar et al, 201424 | France | 141 | 53 | Endoscopy | 60.49 | 66.81 | 41.51 | 53.19 | GNOME DNA Isolation Kit |
| Mira‐Pascual et al, 201532 | Spain | 16 | 7 | Colonoscopy | 52.6 | 71.14 | 71.43 | 76.47 | Commercial kits |
| Fukugaiti et al, 201519 | Brazil | 17 | 7 | Colonoscopy | 54.8 | 65.4 | NA | 76.47 | QiAamp DNA Stool Mini Kit |
| Suehiro et al, 201631 | Japan | 218 | 158 | NAc | 32 | 69 | 49.37‐52.53d | NAc | QiAamp DNA Stool Mini Kit |
| Amitay et al, 201723 | Germany | 237 | 44 | Endoscopy | NAe | NAe | 50.00‐54.55e | 42.62‐59.49e | FastDNA Spin Kit for Soil |
| Eklof et al, 201720 | Sweden | 104 | 39 | Patient recordsf | >60g | >60g | 60.53 | 52.88 | QiAamp DNA Stool Mini Kit |
| Liang et al, 201721 | Hongkong, China | 370 | 170 | Colonoscopy and histopathology | 59.3 | 67.2 | 55.49 | 47.84 | QiAamp DNA Stool Mini Kit |
| Liang et al, 201721 | China | 69 | 33 | Colonoscopy and histopathology | 53.2 | 63.4 | 42.42 | 39.13 | QiAamp DNA Stool Mini Kit |
| Wong et al, 201722 | Hongkong, China | 325 | 127 | Endoscopy and pathology | 57.83 | 66.34 | NAc | 61.85 | ZR Faecal DNA MiniPrep Kit |
| Xie et al, 201725 | China | 569 | 327 | Endoscopy and pathology | 59.49 | 63.13 | 33.33 | 57.64 | QiAamp DNA Stool Mini Kit |
| Xie et al, 201725 | China | 180 | 118 | Endoscopy and pathology | 62.58 | 64.66 | 29.97 | 61.67 | QiAamp DNA Stool Mini Kit |
| Guo et al, 201833 | China | 371 | 215 | Histopathology | 48.6 | 61.2 | NA | 50.67 | DNA Stool Mini Kit |
| Guo et al, 201833 | China | 254 | 152 | Histopathology | 51.7 | 56.4 | NA | 58.66 | DNA Stool Mini Kit |
| CRA | |||||||||
| Mira‐Pascual et al, 201532 | Spain | 17 | 8 | Colonoscopy | 52.6 | 63.27 | NA | 76.20 | Commercial kits |
| Suehiro et al, 201631 | Japan | 90 | 30 | NAc | 32 | 67.53 | 36.67 | NAc | QiAamp DNA Stool Mini Kit |
| Amitay et al, 201723 | Germany | 386 | 193 | Endoscopy | NAe | NAe | 51.30 | 56.48‐72.02e | FastDNA Spin Kit for Soil |
| Eklof et al, 201720 | Sweden | 199 | 134 | Patient recordse | >60g | >60h | 92.59 | 57.79 | QiAamp DNA Stool Mini Kit |
| Wong et al, 201722 | Hongkong, China | 363 | 165 | Endoscopy and pathology | 57.83 | 60.10 | 0 | 63.64 | ZR Faecal DNA MiniPrep Kit |
| Xie et al, 201725 | China | 344 | 102 | Endoscopy and pathology | 59.49 | NAc | NAc | NAc | QiAamp DNA Stool Mini Kit |
| Xie et al, 201725 | China | 84 | 24 | Endoscopy and pathology | 62.58 | NAc | NAc | NAc | QiAamp DNA Stool Mini Kit |
CRC, colorectal cancer; CRA, colorectal adenoma; NA, not available.
Percent of advanced CRC patients in all CRC patients.
Percent of males in all participants.
Data are not available.
The stage of five patients is not available, so we calculated the largest and smallest possible percentage of advanced patients.
Participants included in PCR analysis were less than overall study participants and in the article of Amitay et al, only overall study participants’ characteristics were given. So the mean age was not available and we calculated the largest and smallest possible percentage of advanced patients and males.
Included pathology records.
Mean age >60 y because only 10% of the control and CRC patients were aged 34‐59 y.
Mean age >60 y because only 17.2% percent of colorectal neoplasia patients were aged 34‐59 y.
Other than one25 of these studies did not mention the exclusive criteria; the other studies13, 14, 15, 16, 17, 18, 19, 26, 27 all excluded patients with conditions (such as a vegetarian diet or use of antibiotics within the recent 3 months) that may influence the intestinal microbiome or medical conditions (such as inflammatory bowel disease or a history of cancer) which were relevant to colorectal tumor. One18 of these studies grouped patients with small adenoma into the control. All of these studies were case‐control study. One25 study counted the absolute copy number of fecal F. nucleatum, while the other studies13, 14, 15, 16, 17, 18, 19, 26, 27 detected the relative abundance of it. However, studies evaluating the relative abundance of fecal F. nucleatum chose different internal controls.
We analyzed data for CRC firstly. These studies included 1450 patients and 1421 controls. Sample sizes of cohorts ranged from 16 to 569. The exact cutoff values were available in four studies14, 15, 16, 25 and different from each other.
The data available for CRA were fewer. In total, 652 patients with adenoma and 827 controls were included in the evaluation of diagnostic ability of fecal F. nucleatum for CRA. Sample sizes of cohorts varied widely, ranging from 17 to 386. The exact cutoff values were reported in three studies14, 16, 25 and also different. Three14, 17, 25 studies used the same cutoff values to diagnose adenoma as to diagnose CRC.
3.3. Quality assessment
The results of the QADAS‐2 for CRC and CRA are shown in Figure S1 and Table S1, indicating that highest risk of bias existed in “patient selection” and “index text.” The former one is because that all of the included studies were case‐control study and the percentage of colorectal tumor patients in all subjects was inconsistent with its prevalence rate. However, except for the one25 that did not mention the way of subject selection, the other studies all recruited participants consecutively or randomly. The latter one is caused by cutoff values not being determined beforehand in all studies but one.18 The highest concern about applicability came from “patient selection.” Four studies14, 15, 16, 18 included subjects with gastrointestinal symptoms such as changes of bowel movement or visible bleeding. Four studies15, 16, 17, 26 included participants aged 50 years or older. Two studies13, 19 included participants aged 40 years or above. One study included asympotomatic participants.26 One study25 did not report specific information about the inclusion and exclusion criteria of study cohort.
3.4. Assessment of publication bias and heterogeneity
The publication bias of studies for CRC and CRA is displayed in Figure S2. Both of the two funnel plots were almost symmetrical. P values of slope coefficient of the two regression lines were 0.7 and 0.67, both more than 0.1, suggesting a low likelihood of publication bias. Obvious heterogeneity existed when we calculated pooled sensitivity (I 2 = 88.45%), specificity (I 2 = 86.44%), positive DLR (I 2 = 83.57%), and negative DLR (I 2 = 85.83%) to evaluate diagnostic ability of fecal F. nucleatum for CRC. The proportion of heterogeneity likely due to threshold effect was 31%. When it comes to CRA, substantial heterogeneity also existed in pooled sensitivity (I 2 = 86.18%), specificity (I 2 = 65.79%), positive DLR (I 2 = 47.61%), and negative DLR (I 2 = 72.96%). The percent of heterogeneity owing to threshold effect was 13%. Different thresholds among studies contributed to the heterogeneity limitedly for both CRC and CRA.
3.5. Overall diagnostic accuracy
The forest plot displayed sensitivity of 71% (95% CI, 61%‐79%) and specificity of 76% (95% CI, 66%‐84%) for CRC (Figure 2). The pooled sensitivity for CRA was 36% (95% CI, 27%‐46%), much lower than that for CRC (Figure 2). And the specificity for CRA was 73% (95% CI, 65%‐79%) (Figure 2). The SROC curve yielded a moderate area under the curve (AUC) of 0.80 (95% CI, 0.76‐0.83) for CRC and a low AUC of 0.60 (95% CI, 0.56‐0.65) for CRA (Figure 3). The pooled estimates of positive DLR and negative DLR for CRC were 2.99 (95% CI, 2.13‐4.20) and 0.38 (95% CI, 0.29‐0.50), respectively (Figure S3). The same parameters for CRA were 1.3 (95% CI, 0.95‐1.78) and 0.89 (95% CI, 0.76‐1.03) (Figure S4), consistent with low sensitivity and AUC of fecal F. nucleatum for CRA.
Figure 2.
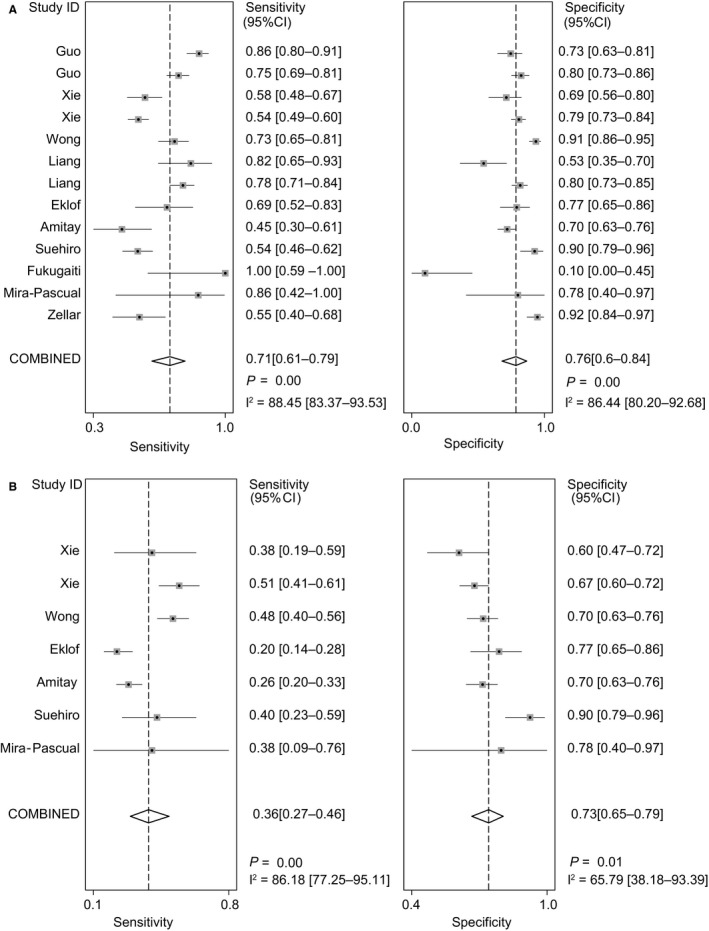
Pooled sensitivity and specificity for colorectal cancer and colorectal adenoma. Forest plots demonstrate the pooled sensitivity and specificity of fecal Fusobacterium nucleatum for A, colorectal cancer and B, colorectal adenoma. CI, confidence interval
Figure 3.
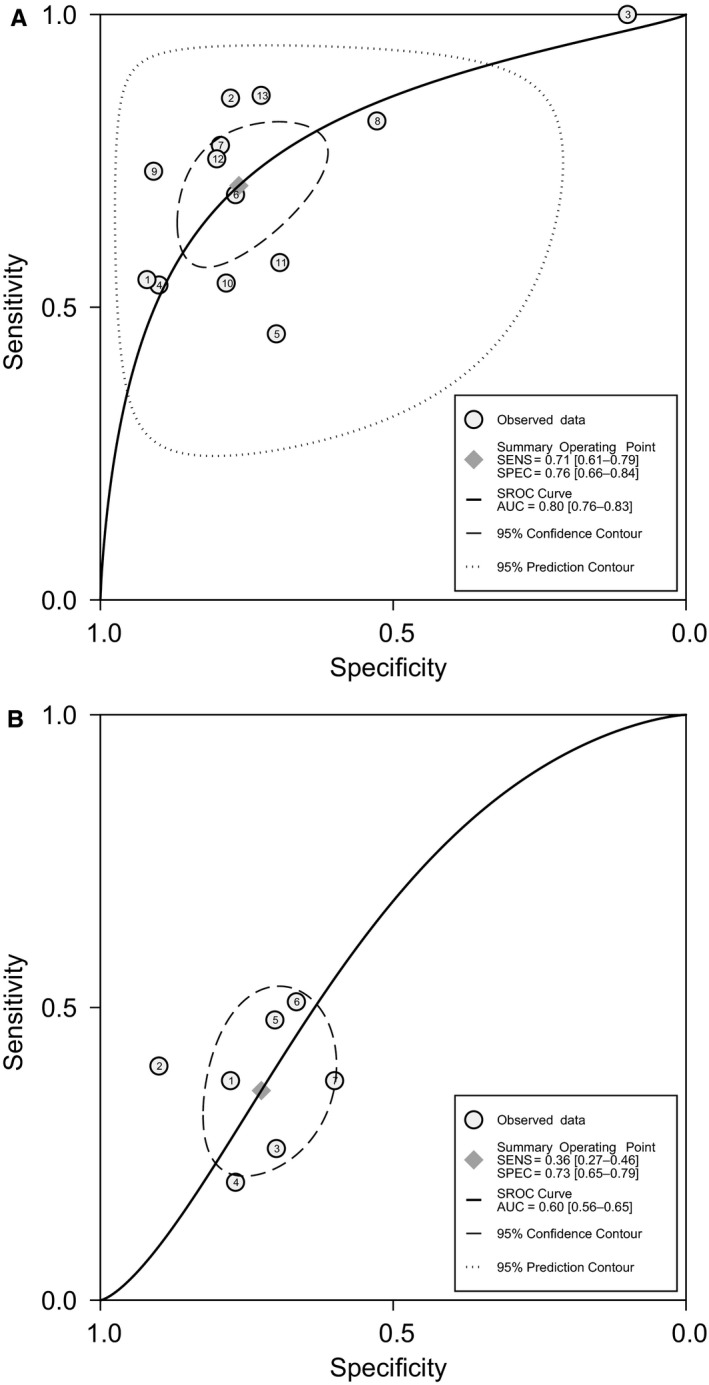
HSROC curve of sensitivity versus specificity of fecal Fusobacterium nucleatum for colorectal cancer and adenoma. HSROC curve of fecal Fusobacterium nucleatum for diagnosis of A, colorectal cancer and B, colorectal adenoma. HSROC curve, hierarchical receiver‐operating characteristics curve
3.6. Sensitivity analysis
We explored the robustness of our results by removing studies one by one. The results of sensitivity analyses are shown in Table 2.
Table 2.
Sensitivity analyses for the robustness of pooled results
| Study, year | Participants, No. | Sensitivity, % (95% CI) | Specificity, % (95% CI) | Positive DLR (95% CI) | Negative DLR (95% CI) | AUC (95% CI) |
|---|---|---|---|---|---|---|
| CRC | ||||||
| Zellar et al, 201424 | 2730 | 72 (62‐80) | 75 (64‐83) | 2.8 (2.0‐3.9) | 0.38 (0.28‐0.50) | 0.79 (0.76‐0.83) |
| Mira‐Pascual et al, 201532 | 2855 | 70 (60‐78) | 76 (65‐85) | 3.0 (2.1‐4.2) | 0.39 (0.30‐0.51) | 0.79 (0.75‐0.83) |
| Fukugaiti et al, 201519 | 2854 | 68 (60‐76) | 79 (73‐85) | 3.3 (2.5‐4.4) | 0.40 (0.31‐0.51) | 0.81 (0.77‐0.84) |
| Suehiro et al, 201631 | 2653 | NA | NA | NA | NA | NA |
| Amitay et al, 201723 | 2634 | 81 (77‐84) | 77 (66‐85) | 3.2 (2.2‐4.5) | 0.35 (0.27‐0.46) | 0.81 (0.77‐0.84) |
| Eklof et al, 201720 | 2767 | 71 (61‐80) | 76 (65‐85) | 3.0 (2.1‐4.3) | 0.38 (0.28‐0.51) | 0.80 (0.76‐0.83) |
| Liang et al, 201721 | 2501 | 70 (60‐79) | 76 (64‐85) | 2.9 (2.0‐4.2) | 0.39 (0.30‐0.52) | 0.79 (0.75‐0.82) |
| Liang et al, 201721 | 2802 | 70 (60‐78) | 78 (68‐85) | 3.2 (2.2‐4.5) | 0.39 (0.30‐0.51) | 0.80 (0.76‐0.83) |
| Wong et al, 201722 | 2546 | 71 (60‐80) | 74 (64‐83) | 2.8 (2.0‐3.8) | 0.39 (0.29‐0.52) | 0.79 (0.75‐0.82) |
| Xie et al, 201725 | 2302 | 72 (63‐80) | 76 (65‐85) | 3.0 (2.1‐4.4) | 0.36 (0.27‐0.48) | 0.80 (0.77‐0.84) |
| Xie et al, 201725 | 2691 | 72 (62‐81) | 77 (66‐85) | 3.1 (2.2‐4.5) | 0.36 (0.27‐0.48) | 0.81 (0.77‐0.84) |
| Guo et al, 201833 | 2500 | 79 (75‐82) | 76 (64‐85) | 2.9 (2.0‐4.2) | 0.39 (0.29‐0.52) | 0.79 (0.75‐0.82) |
| Guo et al, 201833 | 2617 | 68 (59‐76) | 77 (65‐85) | 2.9 (2.0‐4.3) | 0.41 (0.33‐0.53) | 0.77 (0.74‐0.81) |
| CRA | ||||||
| Mira‐Pascual et al, 201532 | 1466 | 36 (26‐47) | 72 (65‐79) | 1.3 (0.9‐1.8) | 0.89 (0.75‐1.04) | 0.60 (0.56‐0.64) |
| Suehiro et al, 201631 | 1393 | 36 (26‐47) | 69 (65‐73) | 1.2 (9‐1.5) | 0.93 (0.79‐1.08) | 0.67 (0.63‐0.71) |
| Amitay et al, 201723 | 1097 | 38 (28‐49) | 38 (28‐49) | 1.5 (1.0‐2.0) | 0.84 (0.71‐0.99) | 0.61 (0.56‐0.65) |
| Eklof et al, 201720 | 1284 | 40 (31‐49) | 72 (63‐79) | 1.4 (1.0‐2.0) | 0.84 (0.70‐1.00) | 0.58 (0.54‐0.62) |
| Wong et al, 201722 | 1120 | 33 (24‐44) | 73 (64‐81) | 1.3 (0.8‐1.9) | 0.91 (0.76‐1.08) | 0.56 (0.52‐0.61) |
| Xie et al, 201725 | 1139 | 33 (24‐43) | 74 (65‐81) | 1.3 (0.8‐1.9) | 0.90 (0.76‐1.08) | 0.56 (0.52‐0.61) |
| Xie et al, 201725 | 1399 | 35 (25‐47) | 74 (67‐0.80) | 1.4 (1.0‐1.9) | 0.87 (0.74‐1.03) | 0.63 (0.59‐0.67) |
CRC, colorectal cancer; CRA, colorectal adenoma; NA, not available.
3.7. Subgroup analysis
Table 3 summarizes all results of the subgroup analyses for diagnosis of CRC and CRA.
Table 3.
Results of subgroup analyses depending on DNA extraction kit, region, and sample size
| Characteristic | Cohorts, No. | Participants, No. | Sensitivity, % (95% CI) | I 2, % | Specificity, % (95% CI) | I 2, % | Positive DLR (95% CI) | I 2, % | Negative DLR (95% CI) | I 2, % | AUC |
|---|---|---|---|---|---|---|---|---|---|---|---|
| CRC | |||||||||||
| DNA extraction kit | |||||||||||
| QIAGEN | 7 | 1527 | 72 (56‐84) | 85.70 | 69 (50‐84) | 86.46 | 2.3 (1.5‐3.6) | 79.92 | 0.41 (0.28‐0.59) | 74.82 | 0.77 (0.73‐0.80) |
| Not QIAGEN | 6 | 1344 | 71 (58‐81) | 87.60 | 82 (73‐89) | 88.34 | 4.0 (2.5‐6.4) | 77.67 | 0.35 (0.23‐0.53) | 89.56 | 0.84 (0.81‐0.87) |
| Region | |||||||||||
| Asia | 8 | 2356 | 71 (62‐79) | 92.22 | 79 (71‐85) | 83.63 | 3.4 (2.4‐4.7) | 71.99 | 0.37 (0.27‐0.49) | 90.45 | 0.82 (0.78‐0.85) |
| Non‐Asia | 5 | 515 | 71 (44‐88) | 67.62 | 68 (37‐89) | 90.51 | 2.2 (1.1‐4.6) | 85.45 | 0.43 (0.23‐0.81) | 57.86 | 0.75 (0.71‐0.79) |
| Sample size | |||||||||||
| >200 | 7 | 2344 | 68 (57‐78) | 57.29 | 81 (75‐86) | 86.69 | 3.6 (2.6‐5.0) | 59.32 | 0.45 (0.31‐0.66) | 42.51 | 0.83 (0.79‐0.86) |
| <200 | 6 | 527 | 72 (55‐85) | 65.92 | 66 (40‐85) | 89.00 | 2.1 (1.2‐3.7) | 80.58 | 0.42 (0.28‐0.63) | 8.64 | 0.75 (0.71‐0.79) |
| Colorectal adenoma | |||||||||||
| DNA extraction kit | |||||||||||
| QIAGEN | 4 | 717 | 36 (24‐50) | 87.93 | 75 (61‐84) | 82.57 | 1.40 (0.85‐2.31) | 48.54 | 0.86 (0.69‐1.08) | 72.10 | 0.57 (0.53‐0.61) |
| Not QIAGEN | 3 | 766 | NA | NA | NA | NA | NA | NA | NA | NA | NA |
| Region | |||||||||||
| Asia | 4 | 881 | 47 (41‐53) | 0.00 | 73 (60‐83) | 80.80 | 1.72 (1.16‐2.54) | 13.38 | 0.73 (0.63‐0.85) | 16.58 | 0.52 (0.47‐0.56) |
| Not Asia | 3 | 602 | NA | NA | NA | NA | NA | NA | NA | NA | NA |
| Sample size | |||||||||||
| >100 | 4 | 1292 | 35 (23‐50) | 93.10 | 70 (66‐74) | 0 | 1.2 (0.8‐1.7) | 63.22 | 0.93 (0.77‐1.12) | 82.59 | 0.67 (0.63‐0.71) |
| <100 | 3 | 191 | NA | NA | NA | NA | NA | NA | NA | NA | NA |
CRC, colorectal cancer; DLR, diagnostic likelihood ratio; Fn, Fusobacterium nucleatum; NA, Insufficient data for pooling results.
3.8. DNA extraction kit
The pooled sensitivity of studies13, 14, 15, 19, 25 using QiAamp DNA Stool Mini Kit (QIAGEN group) to diagnose CRC was 72%, which was similar to that of studies not using QiAamp DNA Stool Mini Kit (not QIAGEN group), with a lower specificity and positive DLR compared with those of not QIAGEN group. The AUC of the QIAGEN group was lower than that of the not QIAGEN group. The heterogeneity of positive DLR and negative DLR decreased, while the heterogeneity of sensitivity and specificity kept unchanged.
For CRA, studies14, 19, 25 using QiAamp DNA Stool Mini Kit had a slightly higher specificity and positive DLR and lower negative DLR, with unchanged sensitivity, compared with overall estimates. However, the heterogeneity increased in the subgroup analyses. We did not calculate the pooled diagnostic accuracy of the other three studies16, 17, 26 not using QiAamp DNA Stool Mini Kit because of limited data.
3.9. Region
We calculated the pooled diagnostic accuracy of fecal F. nucleatum for Asian studies.15, 16, 19, 25, 27 For CRC, the pooled diagnostic accuracy of Asian studies was better than that of non‐Asian studies. But the heterogeneity of sensitivity and negative DLR in non‐Asian studies decreased significantly.
For CRA, compared with the overall pooled results, the pooled sensitivity and positive DLR of Asian16, 19, 25 studies were higher, especially the sensitivity, with the lower pooled negative DLR. Furthermore, heterogeneity of these indicators all decreased significantly except that of specificity.
3.10. Sample size
For cohorts with larger sample size15, 16, 17, 19, 25, 27 (>200), the diagnostic ability of fecal F. nucleatum for CRC was better than cohorts13, 14, 15, 18, 19, 26 with smaller sample size, with lower sensitivity. And the heterogeneity of sensitivity, positive DLR, and negative DLR all dropped sharply. For CRA, heterogeneity of specificity did not exist among cohorts with larger sample size14, 16, 17, 19 (>100) and their pooled AUC was better than the overall one.
3.11. Meta‐regression
Studies of CRA diagnosis had limited information, so we only conducted a meta‐regression for CRC. The meta‐regression showed that the average age of all participants contributed to the heterogeneity of sensitivity. Besides, the percent of early‐stage patients in all CRC patients, the percent of the males in all participants, and the average age of all participants were responsible for the overall heterogeneity (Table S2).
4. DISCUSSION
There have been many studies investigating the mechanism of F. nucleatum instigating and potentiating colorectal tumor by using tumor tissues. It has been reported that the accumulation of F. nucleatum in colorectal tumor is partly due to fusobacterial lectin Fap228 and FadA adhesin29 and that F. nucleatum can induce the carcinogenesis and development of colorectal tumor by the microRNA‐21‐mediated pathway30 or inhibition of host adaptive immunity,31, 32, 33 etc Recently, our group also found that F. nucleatum promoted chemoresistance by modulating autophagy in CRC.34 F. nucleatum was reported to be associated with the prognosis of CRC as well.35, 36 There also have been some studies exploring diagnosing colorectal tumor with F. nucleatum from tumor tissues26, 37 or feces. However, it was reported that the level of F. nucleatum in feces did not correlate with that in tumor tissues.38 Our study focused on the fecal F. nucleatum to explore its potential as a noninvasive screening method for colorectal tumor.
In our meta‐analysis, the overall pooled diagnostic accuracy of fecal F. nucleatum (AUC) was 0.80 for CRC; the pooled sensitivity and specificity of fecal F. nucleatum was 71% and 76% for CRC, indicating that fecal F. nucleatum has a certain value for the diagnosis of CRC. The pooled sensitivity (36%), specificity (73%), and AUC (0.60) for CRA were low. It is worth noting that the diagnostic performance of FIT for CRA was also poor, with sensitivity ranging from 15% to 26.3%.7, 9 What is more, it cannot be denied that FIT has many limitations, such as false‐positive results mentioned above. And FIT could not diagnose patients with nonbleeding lesions,14 which could be complemented by fecal F. nucleatum. It was reported that combining fecal F. nucleatum with FIT or other microbial markers enhanced the detection ability of FIT for both CRC and CRA.15, 16, 39 Thus, it is hopeful for F. nucleatum to be a biomarker for the noninvasive screening of colorectal tumor.
We conducted sensitivity analyses excluding studies one by one and found our results were stable, especially for CRC.
To investigate the source of heterogeneity, we did subgroup analyses and meta‐regression. The DNA extraction kits, cohort regions, sample size, average age, and the percent of early‐stage patients and the males were responsible for the high heterogeneity. The percent of heterogeneity owing to threshold effect was low.
It was reported that variations in DNA extraction protocol had a great impact on the observation of fecal microbial composition.40 It is consistent with the better diagnostic accuracy of not QIAGEN group for CRC compared with QIAGEN group. However, high heterogeneity among studies using the same DNA extraction kit still existed although it decreased comparing with the overall one. For CRA, QIAGEN group also existed high heterogeneity of sensitivity and specificity despite decreased heterogeneity of DLR. Besides the difference of DNA extraction kit, we found that methods of storing fecal samples before DNA extracting, targeted genes, primers’ sequences designed for PCR, and internal controls were different among studies as well. But we could not analyze their exact effect on heterogeneity due to limited data. Further studies are needed to explore whether these factors are responsible for heterogeneity and find the best way to utilize fecal F. nucleatum for diagnosis of colorectal tumor.
The diagnostic accuracy of fecal F. nucleatum for CRC in Asian studies was better compared with diagnostic accuracy in non‐Asian studies. And the heterogeneity also decreased to some extent. For CRA, the heterogeneity of sensitivity even dropped to zero. There was evidence suggesting that intestinal F. nucleatum could be influenced by diet.41 Other studies also reported that the change of diet could alter intestinal microbiome.42, 43 That may be associated with the different diagnostic accuracy among different regions and the decreased heterogeneity in region subgroups.
In addition, the subgroup analysis according to sample size indicated that the fecal F. nucleatum had performed better for the diagnosis of colorectal tumor in larger cohorts and sample size was an important factor for heterogeneity.
The percent of early‐stage patients and males and the average age were the source of heterogeneity as well. It was reported that copy number of fecal F. nucleatum was the highest in stage II and the lowest in stage IV.25 Another study also reported that the relative abundance of fecal F. nucleatum in CRC stages II and III was higher than stage I.39 This may explain the effect of stage composition on heterogeneity. Enrichment of fecal F. nucleatum in CRC stage II suggested that fecal F. nucleatum may play a role in detecting early‐stage CRC.
Furthermore, it is a remarkable fact that colorectal tumor is a disease due to different genetic and epigenetic alterations, such as microsatellite instability and activation of oncogenes including KRAS and BRAF. It was also reported that F. nucleatum, which was influenced by food, lifestyle, and medications, was related with clinical and molecular pathologies of colorectal tumor.16, 36 Molecular pathological epidemiology (MPE), a transdisciplinary and interdisciplinary integrative field, studies associations of an exposure with molecular or pathological features of a certain disease.44 In view of this, microbial MPE also contributes to the heterogeneity of colorectal tumor as well as our study. In addition, in the era of precision medicine, MPE has the potential to play an important role in the future.45 Thus, combining MPE research with fecal bacterial analyses, such as F. nucleatum, may advance investigations of pathogenesis of colorectal tumor, help diagnose or classify this disease, and improve the development of precision medicine for colorectal tumor.
Our study has some limitations. First, the sizes of studies and samples for CRA were small, despite the use of a comprehensive search strategy. This limited the precision of pooled results and prevented complete subgroup analyses for CRA.
All of these studies were case‐control designs, causing spectrum effects by restricting sampling of cases and controls.46 That were likely to lead to high bias and inflated estimates of results. And some included studies had small sample size and did not conform to the principles of diagnostic tests such as blind control.47 All above did harm to the validity of results in these studies.
What is more, there were no unified detecting methods and threshold because assessing the diagnostic accuracy of fecal F. nucleatum just emerged over the past few years. The sensitivity and specificity were determined by the threshold of AUC curve. To some extent, the sensitivity and specificity are mutually dependent, where lowering the threshold to increase sensitivity will decrease specificity and vice versa. Most of the included studies defined their own threshold by their ROC curve and obtained different cutoff values. In terms of this, sensitivity or specificity in these studies was not parallel. For these reasons, further studies with rigorous design and randomized clinical trials are needed to define the best cutoff value for the diagnosis of colorectal tumor with fecal F. nucleatum and assess its performance.
In conclusion, fecal F. nucleatum is promising for the noninvasive diagnosis of colorectal tumor. It is a potential complementary method of FIT, especially for CRA. Given the results of subgroup analyses and meta‐regression, further studies should be performed to determine standard F. nucleatum detecting methods and diagnostic threshold to reduce heterogeneity and enhance clinical effectiveness of fecal F. nucleatum.
CONFLICT OF INTEREST
None declared.
Supporting information
ACKNOWLEDGMENTS
This work was supported by grants from the National Natural Science Foundation of China No. 31371273, 81874159; The Program for Professor of Special Appointment (2015 Youth Eastern Scholar No. QD2015003) at Shanghai Institutions of Higher Learning; Shanghai Municipal Education Com‐ mission‐Gaofeng Clinical Medicine Grant Support (No. 20161309); and Chenxing Project of Shanghai Jiao‐Tong University to H. Chen.
Zhang X, Zhu X, Cao Y, Fang J‐Y, Hong J, Chen H. Fecal Fusobacterium nucleatum for the diagnosis of colorectal tumor: A systematic review and meta‐analysis. Cancer Med. 2019;8:480–491. 10.1002/cam4.1850
Funding information
The National Natural Science Foundation of China No.31371273, 81874159; The Program for Professor of Special Appointment (2015 Youth Eastern Scholar No. QD2015003) at Shanghai Institutions of Higher Learning; Shanghai Municipal Education Com‐ mission‐Gaofeng Clinical Medicine Grant Support (No. 20161309); and Chenxing Project of Shanghai Jiao‐Tong University to H. Chen.
Contributor Information
Jing‐Yuan Fang, Email: jingyuanfang@sjtu.edu.cn.
Jie Hong, Email: jiehong97@sjtu.edu.cn.
Haoyan Chen, Email: haoyanchen@sjtu.edu.cn.
REFERENCES
- 1. Ferlay J, Soerjomataram I, Dikshit R, et al. Cancer incidence and mortality worldwide: sources, methods and major patterns in GLOBOCAN 2012. Int J Cancer. 2015;136(5):E359–E386. [DOI] [PubMed] [Google Scholar]
- 2. Edwards BK, Ward E, Kohler BA, et al. Annual report to the nation on the status of cancer, 1975–2006, featuring colorectal cancer trends and impact of interventions (risk factors, screening, and treatment) to reduce future rates. Cancer. 2010;116(3):544‐573. [DOI] [PMC free article] [PubMed] [Google Scholar]
- 3. Rex DK, Johnson DA, Anderson JC, Schoenfeld PS, Burke CA, Inadomi JM. American College of Gastroenterology Guidelines for Colorectal Cancer Screening 2008. Am J Gastroenterol. 2009;104:739. [DOI] [PubMed] [Google Scholar]
- 4. Sung J, Ng SC, Chan F, et al. An updated Asia Pacific Consensus Recommendations on colorectal cancer screening. Gut. 2015;64(1):121‐132. [DOI] [PubMed] [Google Scholar]
- 5. Lee JK, Liles EG, Bent S, Levin TR, Corley DA. Accuracy of fecal immunochemical tests for colorectal cancer: systematic review and meta‐analysis. Ann Intern Med. 2014;160(3):171‐181. [DOI] [PMC free article] [PubMed] [Google Scholar]
- 6. Hundt S, Haug U, Brenner H. Comparative evaluation of immunochemical fecal occult blood tests for colorectal adenoma detection. Ann Intern Med. 2009;150(3):162‐169. [DOI] [PubMed] [Google Scholar]
- 7. Shapiro JA, Bobo JK, Church TR, et al. A comparison of fecal immunochemical and high‐sensitivity guaiac tests for colorectal cancer screening. Am J Gastroenterol. 2017;112:1728‐1735. [DOI] [PMC free article] [PubMed] [Google Scholar]
- 8. Cubiella J, Castro I, Hernandez V, et al. Diagnostic accuracy of fecal immunochemical test in average‐ and familial‐risk colorectal cancer screening. United Eur Gastroenterol J. 2014;2(6):522‐529. [DOI] [PMC free article] [PubMed] [Google Scholar]
- 9. Cubiella J, Castro I, Hernandez V, et al. Characteristics of adenomas detected by fecal immunochemical test in colorectal cancer screening. Cancer Epidemiol Biomarkers Prev. 2014;23(9):1884‐1892. [DOI] [PubMed] [Google Scholar]
- 10. van Turenhout ST , Oort FA , Terhaar sive Droste JS , et al. Hemorrhoids detected at colonoscopy: an infrequent cause of false‐positive fecal immunochemical test results. Gastrointest Endosc. 2012;76(1):136‐143. [DOI] [PubMed] [Google Scholar]
- 11. Castellarin M, Warren RL, Freeman JD, et al. Fusobacterium nucleatum infection is prevalent in human colorectal carcinoma. Genome Res. 2012;22(2):299‐306. [DOI] [PMC free article] [PubMed] [Google Scholar]
- 12. Holt RA, Cochrane K. Tumor potentiating mechanisms of Fusobacterium nucleatum, a multifaceted microbe. Gastroenterology. 2017;152(4):694‐696. [DOI] [PubMed] [Google Scholar]
- 13. Fukugaiti MH, Ignacio A, Fernandes MR, Ribeiro U, Nakano V, Avila‐Campos MJ. High occurrence of Fusobacterium nucleatum and Clostridium difficile in the intestinal microbiota of colorectal carcinoma patients. Brazilian J Microbiol. 2015;46(4):1135‐1140. [DOI] [PMC free article] [PubMed] [Google Scholar]
- 14. Eklöf V, Löfgren‐Burström A, Zingmark C, et al. Cancer‐associated fecal microbial markers in colorectal cancer detection. Int J Cancer. 2017;141(12):2528‐2536. [DOI] [PMC free article] [PubMed] [Google Scholar]
- 15. Liang Q, Chiu J, Chen Y, et al. Fecal bacteria act as novel biomarkers for noninvasive diagnosis of colorectal cancer. Clin Cancer Res. 2017;23(8):2061‐2070. [DOI] [PubMed] [Google Scholar]
- 16. Wong SH, Kwong T, Chow T‐C, et al. Quantitation of faecal Fusobacterium improves faecal immunochemical test in detecting advanced colorectal neoplasia. Gut. 2017;66(8):1441‐1448. [DOI] [PMC free article] [PubMed] [Google Scholar]
- 17. Amitay EL, Werner S, Vital M, et al. Fusobacterium and colorectal cancer: causal factor or passenger? Results from a large colorectal cancer screening study. Carcinogenesis. 2017;38(8):781‐788. [DOI] [PubMed] [Google Scholar]
- 18. Zeller G, Tap J, Voigt AY, et al. Potential of fecal microbiota for early‐stage detection of colorectal cancer. Mol Syst Biol. 2014;10(11):766. [DOI] [PMC free article] [PubMed] [Google Scholar]
- 19. Xie Y‐H, Gao Q‐Y, Cai G‐X, et al. Fecal clostridium symbiosum for noninvasive detection of early and advanced colorectal cancer: test and validation studies. EBioMedicine. 2017;25:32‐40. [DOI] [PMC free article] [PubMed] [Google Scholar]
- 20. Whiting PF, Rutjes AW, Westwood ME, et al. Quadas‐2: a revised tool for the quality assessment of diagnostic accuracy studies. Ann Intern Med. 2011;155(8):529‐536. [DOI] [PubMed] [Google Scholar]
- 21. Reitsma JB, Glas AS, Rutjes A, Scholten R, Bossuyt PM, Zwinderman AH. Bivariate analysis of sensitivity and specificity produces informative summary measures in diagnostic reviews. J Clin Epidemiol. 2005;58(10):982‐990. [DOI] [PubMed] [Google Scholar]
- 22. Rutter CM, Gatsonis CA. A hierarchical regression approach to meta‐analysis of diagnostic test accuracy evaluations. Stat Med. 2001;20(19):2865‐2884. [DOI] [PubMed] [Google Scholar]
- 23. Deeks JJ, Macaskill P, Irwig L. The performance of tests of publication bias and other sample size effects in systematic reviews of diagnostic test accuracy was assessed. J Clin Epidemiol. 2005;58(9):882‐893. [DOI] [PubMed] [Google Scholar]
- 24. Higgins J, Thompson SG, Deeks JJ, Altman DG. Measuring inconsistency in meta‐analyses. BMJ Br Med J. 2003;327(7414):557‐560. [DOI] [PMC free article] [PubMed] [Google Scholar]
- 25. Suehiro Y, Sakai K, Nishioka M, et al. Highly sensitive stool DNA testing of Fusobacterium nucleatum as a marker for detection of colorectal tumours in a Japanese population. Ann Clin Biochem. 2016;54(1):86‐91. [DOI] [PubMed] [Google Scholar]
- 26. Mira‐Pascual L, Cabrera‐Rubio R, Ocon S, et al. Microbial mucosal colonic shifts associated with the development of colorectal cancer reveal the presence of different bacterial and archaeal biomarkers. J Gastroenterol. 2015;50(2):167‐179. [DOI] [PubMed] [Google Scholar]
- 27. Guo S, Li L, Xu B et al. A simple and novel fecal biomarker for colorectal cancer: ratio of Fusobacterium nucleatum to probiotics populations, based on their antagonistic effect. Clin Chem. 2018;64(9):1327‐1337. [DOI] [PubMed] [Google Scholar]
- 28. Abed J, Emgård J, Zamir G, et al. Fap2 mediates Fusobacterium nucleatum colorectal adenocarcinoma enrichment by binding to tumor‐expressed Gal‐GalNAc. Cell Host Microbe. 2016;20(2):215‐225. [DOI] [PMC free article] [PubMed] [Google Scholar]
- 29. Rubinstein MR, Wang X, Liu W, Hao Y, Cai G, Han YW. Fusobacterium nucleatum promotes colorectal carcinogenesis by modulating E‐cadherin/β‐catenin signaling via its FadA adhesin. Cell Host Microbe. 2013;14(2):195‐206. [DOI] [PMC free article] [PubMed] [Google Scholar]
- 30. Yang Y, Weng W, Peng J, et al. Fusobacterium nucleatum increases proliferation of colorectal cancer cells and tumor development in mice by activating toll‐like receptor 4 signaling to nuclear factor‐κB, and up‐regulating expression of MicroRNA‐21. Gastroenterology. 2017;152(4):851‐866.e24. [DOI] [PMC free article] [PubMed] [Google Scholar]
- 31. Gur C, Ibrahim Y, Isaacson B, et al. Binding of the Fap2 protein of Fusobacterium nucleatum to human inhibitory receptor TIGIT protects tumors from immune cell attack. Immunity. 2015;42(2):344‐355. [DOI] [PMC free article] [PubMed] [Google Scholar]
- 32. Mima K, Sukawa Y, Nishihara R, et al. Fusobacterium nucleatum and T‐cells in Colorectal Carcinoma. JAMA Oncol. 2015;1(5):653‐661. [DOI] [PMC free article] [PubMed] [Google Scholar]
- 33. Kostic AD, Chun E, Robertson L, et al. Fusobacterium nucleatum potentiates intestinal tumorigenesis and modulates the tumor‐immune microenvironment. Cell Host Microbe. 2013;14(2):207‐215. [DOI] [PMC free article] [PubMed] [Google Scholar]
- 34. Yu T, Guo F, Yu Y, et al. Fusobacterium nucleatum promotes chemoresistance to colorectal cancer by modulating autophagy. Cell. 2017;170(3):548‐563.e16. [DOI] [PMC free article] [PubMed] [Google Scholar]
- 35. Yamaoka Y, Suehiro Y, Hashimoto S, et al. Fusobacterium nucleatum as a prognostic marker of colorectal cancer in a Japanese population. J Gastroenterol. 2018;53(4):517‐524. [DOI] [PubMed] [Google Scholar]
- 36. Mima K, Nishihara R, Qian ZR, et al. Fusobacterium nucleatum in colorectal carcinoma tissue and patient prognosis. Gut. 2016;65(12):1973‐1980. [DOI] [PMC free article] [PubMed] [Google Scholar]
- 37. Yu J, Chen Y, Fu X, et al. Invasive Fusobacterium nucleatum may play a role in the carcinogenesis of proximal colon cancer through the serrated neoplasia pathway. Int J Cancer. 2016;139(6):1318‐1326. [DOI] [PubMed] [Google Scholar]
- 38. Flanagan L, Schmid J, Ebert M, et al. Fusobacterium nucleatum associates with stages of colorectal neoplasia development, colorectal cancer and disease outcome. Eur J Clin Microbiol Infect Dis. 2014;33(8):1381‐1390. [DOI] [PubMed] [Google Scholar]
- 39. Yu J, Feng Q, Wong SH, et al. Metagenomic analysis of faecal microbiome as a tool towards targeted non‐invasive biomarkers for colorectal cancer. Gut. 2017;66(1):70‐78. [DOI] [PubMed] [Google Scholar]
- 40. Costea PI, Zeller G, Sunagawa S, et al. Towards standards for human fecal sample processing in metagenomic studies. Nat Biotechnol. 2017;35:1069. [DOI] [PubMed] [Google Scholar]
- 41. O’Keefe S, Li JV, Lahti L, et al. Fat, fiber and cancer risk in African Americans and Rural Africans. Nat Commun. 2015;6:6342. [DOI] [PMC free article] [PubMed] [Google Scholar]
- 42. Sonnenburg ED, Smits SA, Tikhonov M, Higginbottom SK, Wingreen NS, Sonnenburg JL. Diet‐induced extinction in the gut microbiota compounds over generations. Nature. 2016;529(7585):212‐215. [DOI] [PMC free article] [PubMed] [Google Scholar]
- 43. Cotillard A, Kennedy SP, Kong LC, et al. Dietary intervention impact on gut microbial gene richness. Nature. 2013;500:585. [DOI] [PubMed] [Google Scholar]
- 44. Ogino S, Chan AT, Fuchs CS, Giovannucci E. Molecular pathologic epidemiology of colorectal neoplasia: an emerging transdisciplinary and interdisciplinary field. Gut. 2011;60(3):397‐411. [DOI] [PMC free article] [PubMed] [Google Scholar]
- 45. Ogino S, Nishihara R, VanderWeele TJ, et al. The role of molecular pathological epidemiology in the study of neoplastic and non‐neoplastic diseases in the era of precision medicine. Epidemiology. 2016;27(4):602‐611. [DOI] [PMC free article] [PubMed] [Google Scholar]
- 46. Rutjes A, Reitsma JB, Vandenbroucke JP, Glas AS. Bossuyt PMM. Case–control and two‐gate designs in diagnostic accuracy studies. Clin Chem. 2005;51(8):1335‐1341. [DOI] [PubMed] [Google Scholar]
- 47. Sox HC. The evaluation of diagnostic tests: principles, problems, and new developments. Annu Rev Med. 1996;47(1):463‐471. [DOI] [PubMed] [Google Scholar]
Associated Data
This section collects any data citations, data availability statements, or supplementary materials included in this article.
Supplementary Materials