Abstract
Tumors may include a high proportion of immune modulatory cells and molecules that restrain the anti-cancer response. Activation of T cells to eliminate cancer cells within the immune-suppressive tumor microenvironment remains a challenge. We have shown that C57BL/6J peritoneal cell culture models features of macrophage-dense tumors as TCR ligation fails to activate T cells unless IFNγ is neutralized or iNOS is inhibited. We tested other forms of T cell activation and found phytohemagglutinin (PHA) distinctive in the ability to markedly expand CD8 T cells in this model. IFNγ or iNOS inhibition was not necessary for this response. PHA triggered less IFNγ production and inhibitory PD-L1 expression than TCR ligation. Macrophages and CD44hi T cells bound PHA. Spleen T cell responses to PHA were markedly enhanced by the addition of peritoneal cells revealing that macrophages enhance T cell expansion. That PHA increases CD8 T cell responses within macrophage-dense culture suggests this mitogen might enhance anti-tumor immunity.
Keywords: Macrophage, Phytohemagglutinin, Suppression, T cell
Introduction
There is growing understanding that the immune system not only controls tumor growth, but also facilitates cancer development within tumor microenvironments (TMEs)1–2. Both malignant cells and atypical ratios of white blood cell (WBC) subpopulations comprise the TME3. In certain tumor types, a considerable fraction of WBCs are macrophages (Mϕs) that can block productive, anti-tumor immunity4. In organized lymphoid tissue, such as the lymph nodes (LN) or the spleen (SP), Mϕs are a minor population of cells apportioned within the evolved architecture of each particular organ. This cellular distribution ensures normal lymphocyte biology and subset collaboration that maintains homeostasis5. Within TMEs, however, this cooperative response is lost to immune suppression fostered by aberrant cellular composition (e.g., increased Mϕs, Tregs), regulatory receptor-ligand interactions (e.g., PD-1/PD-L1), and anti-inflammatory cytokine production (e.g., TGFβ1, IL10)6,7. There is considerable interest in therapeutic approaches to subvert this suppression, particularly strategies that can increase the number and effectiveness of cytotoxic T cells in the TME8.
We model several features of the TME by the culture of peritoneal cavity (PerC) cells. Distinct from organized lymphoid tissue, the peritoneum harbors an immune cell composition marked by a large fraction of CD11bhi F4/80+ Mϕs, as well as activated (CD44hi) T and B cell subsets9. The increased proportional representation of Mϕs is essential for the immune suppression observed in PerC cell culture9–12. Following TCR ligation, PerC T cells produce IFNγ, which triggers Mϕ iNOS expression9–11. Inhibition of iNOS by NG-monomethyl-L-arginine (1-MA) revealed that amino acid catabolism is responsible for reduced T cell expansion10,13. Conventional sources of lymphocytes, i.e., murine SP cells or human peripheral blood, lack these key features of TMEs14,15.
In our search for forms of T cell activation that might circumvent Mϕ suppression, we found the mitogen phytohemagglutinin (PHA) particularly effective in this capacity10. A lectin extract from the red kidney bean (Phaseolus vulgaris) with potent mitogenic and cell agglutinating properties, PHA consistently stimulated PerC T cell proliferation16. Particularly exciting was the marked expansion of CD8+ T cells. Neither IFNγ neutralization nor iNOS inhibition were required for this response. Compared to TCR ligation, PHA stimulation led to less IFNγ production and lower inhibitory PD-L1 expression by Mϕs. These data encourage evaluation of PHA as a CD8 T cell agonist to promote anti-tumor immunity.
Materials and Methods
Mice
Two-to-four month old male and female mice, bred and maintained at Rider University, were handled in accord with NIH, Animal Welfare Act, and Rider University IACUC guidelines. Breeding pairs of C57BL/6J and IFNγR−/− (B6.129S7Ifngr/J) mice were obtained from the Jackson Laboratory, Bar Harbor, ME.
Preparation of cell suspensions, cell culture, and cytokine ELISA
Spleen (SP) cell suspensions were obtained by gentle disruption of the organ between the frosted ends of sterile glass slides. Red blood cells were removed from SP cell preparations by hypertonic lysis followed by washing with Hanks Balanced Salt Solution (HBSS) (Life Technologies, Grand Island, NY). Peritoneal cavity (PerC) cells were obtained by flushing the peritoneum with 10 mls of warm (37°C) HBSS supplemented with 2% fetal bovine serum (FBS) (Hyclone, Logan, UT). Viable cell counts were determined by Trypan blue exclusion. For proliferation assays, dilutions of cells (3.0 – 4.0 × 10⁶/ml) in RPMI 1640 culture media (Life Technologies) supplemented with 10% FBS (< 0.3 EU or < 0.06 ng /ml of endotoxin), 0.1 mM nonessential amino acids, 100 U/ml penicillin, 100 μg/ml streptomycin, 50 μg/ml gentamicin, 2 mM L-glutamine, 2 × 10⁻⁵ M 2-ME, and 10 mM HEPES, were plated in 96-well “V”- or flat-bottom microtiter plates (Corning Costar, Fisher Scientific, Pittsburgh, PA) and incubated in a humidified atmosphere of 5% CO2 at 37 °C for 48 hrs. CFSE experiments plated cells at 4 × 10⁶/ml in 48 well, flat-bottom plates. Endotoxin testing was done per manufacturer’s (Pierce LAL Chromogenic Endotoxin Quantitation Kit) instructions. For anti-CD3 stimulation soluble anti-CD3ε mAb (clone 145–2C11; < 0.001 ng/ug endotoxin) (eBioscience, San Diego, CA) was added at 1.0 μg/ml. To inhibit arginine catabolism, the inducible nitric oxide synthase (iNOS) inhibitor NG-monomethyl-L-arginine (1-MA; CalBiochem) was added10. Neutralizing anti-mouse mAb for IFNγ (clone XMG1.2), IL-10 (clone JES5–16E3), IL-4 (clone 11B11), IL-2 (clone JES6–1A12), IFNAR1 (clone MAR1–5A3), and PD-L1 (clone MIH5), were added at 7.5 μg/ml (eBioscience, all MAbs < 0.001 ng/ug endotoxin). All neutralizing mAbs were added at culture initiation. Phytohemagglutinin (Sigma-Aldrich) was added at 2–16 μg/ml. Optimal concentrations of all reagents were determined in titration experiments. After 44 hours, 1 μCi of [3H] thymidine (Moravek Inc., Brea, CA) was added to each well. Four hours later the plates were frozen and then thawed for harvesting onto filter paper mats using a semi-automated cell harvester (Skatron Instruments, Richmond, VA). Radioactivity was measured by liquid scintillation spectrometry. For each experiment 5 wells were established for each test group. IFNγ production in tissue culture supernatants was measured by sandwich cytokine ELISA as specified by the manufacturer (Thermo Fisher).
Immunofluorescence staining and flow cytometric analyses
For carboxyfluorescein succinimidyl ester (CFSE)-based proliferation assays cells were labeled with the CellTrace CFSE Cell Proliferation Kit as described by the manufacturer (Thermo Fisher) prior to culture. For cell surface staining, ex vivo or cultured PerC and SP cell suspensions were first treated with a “blocktail” of rat anti-mouse CD16/32 MAb (Fc Block, eBioscience) and 2% normal rat serum (Jackson ImmunoResearch, West Grove, PA). Cell suspensions were then stained using titered amounts of FITC-, PerCP-Cy5.5-, or PE-labeled rat anti-mouse CD8, CD4, CD44, PD-L1, CD11b, CD45R/B220, and/or F4/80 mAbs (eBioscience). Isotype- and fluorochrome-matched, nonspecific mAb controls were employed to establish analysis gates. To identify PHA-binding cells, biotinylated PHA (b-PHA) was added at 0.2 − 10.0 μg/ml (Vector Labs, Burlingame, CA) concurrent with FITC- and PerCP-Cy5.5-labeled leucocyte subset-specific mAbs. After incubation and washing, Streptavidin-PE (StrAv-PE; R&D Systems, Minneapolis, MN) was added. Intracellular IFNγ staining was conducted as described by the manufacturer (eBioscience, San Diego, CA). Isotype-matched control mAbs were used to monitor nonspecific binding. The percentage of lymphocytes or myeloid cells expressing these markers were determined via multiparameter flow cytometric analyses on a FACSCalibur™ flow cytometer (Becton Dickinson Immunocytometry Systems, San Jose, CA) by FSC/SSC gating of the lymphoid or myeloid population using CellQuest software. All experiments were done a minimum of 3 times, the majority more than 5 times.
Statistical analyses, stimulation index (SI), mean fluorescent intensity (MFI) index
Lymphocyte proliferative responses are presented as the average CPM (counts per minute) ± SEM (standard error of the mean). Data sets were compared using the Student’s t-test with p-values below 0.05 considered statistically significant: * = p < 0.05, ** = p < 0.005, *** = p < 0.0005 relative to control. The stimulation index (SI) is defined as the average CPM for the treatment (e.g., anti-CD3) divided by the average CPM for the appropriate control response (complete media {CM} alone). Indices that fall within the 0.8 – 1.2 range were not considered statistically significant. The Mean Fluorescence Intensity (MFI) index is defined as the average MFI for the treatment group (cultured, stimulated) divided by the average MFI for the appropriate control (ex vivo, unstimulated).
Results
Unlike TCR ligation, PHA stimulates T cells in a suppressive, Mϕ-dense environment
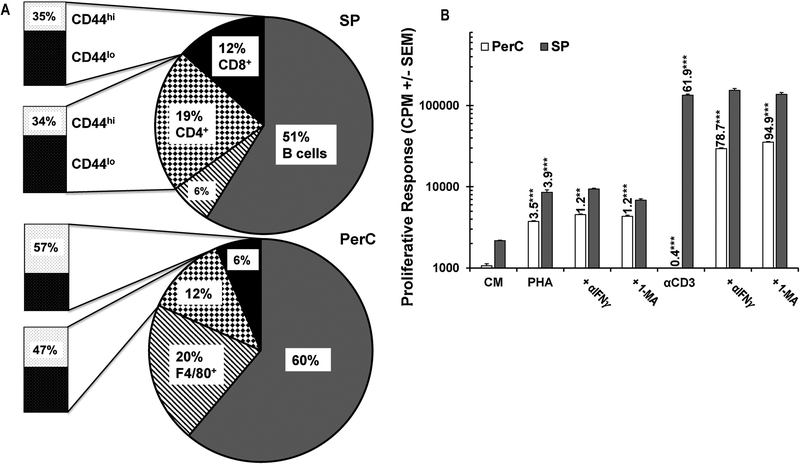
Due to the increased fraction of Mϕs in the PerC, culture of these cells can serve as an in vitro model of Mϕ-rich TMEs (Fig. 1A). Although PerC cell preparations have fewer T cells than organized lymphoid tissue, they have a significant portion of T cells with the CD44hi effector/memory phenotype (TE/M) found in “hot” tumors (Fig. 1A)9,17. PerC T cells respond poorly to TCR/CD3 ligation (αCD3) unless IFNγ, a trigger for iNOS expression, is neutralized or iNOS is inhibited by NG-monomethyl-L-arginine (1-MA) (Fig. 1B)10. Testing other forms of T cell activation (ConA, Staphylococcal enterotoxin B, not shown10), we found that only PHA could stimulate PerC T cell proliferation without requiring IFNγ neutralization or iNOS inhibition to break suppression (Fig. 1B)10,18. The greatest PHA response was consistently lower than that of the liberated αCD3 response, indicating that PHA is a less potent stimulator than that found following TCR ligation.
Fig. 1.
Panel A: Lymphoid composition of spleen (SP) and peritoneal cavity (PerC) cells. Mɸs defined by F4/80 and B cells by CD45R expression. Data are averages from 8–10 analyses of 8–16 wk old C57BL/6J mice. Panel B: PerC T cells respond to PHA stimulation without IFNγ neutralization or iNOS inhibition (1-MA). CM = complete media (unstimulated control). Numbers above histograms represent stimulation indices (SI) as described in Methods. Asterisks indicate significant differences in the experimental vs control conditions.
PHA stimulates CD8+ T cell proliferation in Mϕ-dense culture
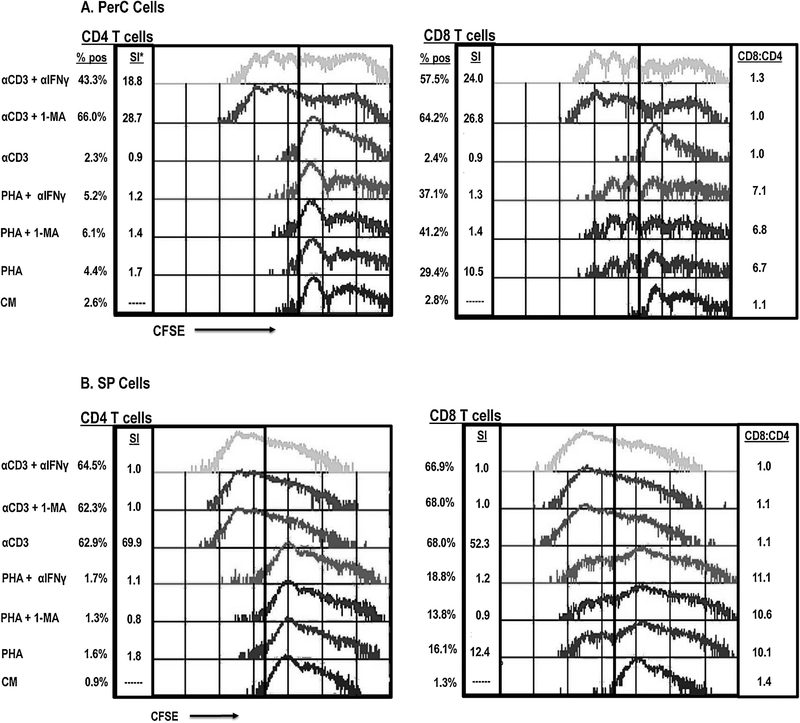
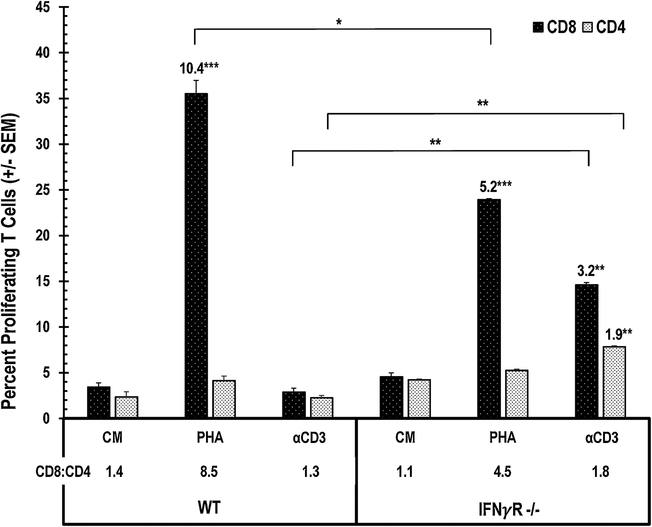
To determine which cells were responding to PHA, CFSE-based flow cytometry was conducted. Unlike TCR ligation, PHA stimulation resulted in proliferation of both PerC CD4+ and CD8+ T cells (Fig. 2A). Intriguingly, the CD8+ T cell response was much greater than that of the CD4 T cell response (> 10.5-fold expansion for CD8+ T cells vs 1.7-fold for CD4+ T cells; CD8:CD4 = 6.7). IFNγ neutralization or iNOS inhibition restored the response to TCR ligation (> 18-fold response), and both CD4 and CD8 T cells proliferated (CD8:CD4 = 1.0 for 1-MA treatment, 1.3 for αIFNγ). In contrast, these treatments only modestly enhanced the PHA response (< 1.5-fold) and had relatively little impact on the CD8:CD4 ratio. However, the PHA response was IFNγ dependent as both the stimulation index (WT = 10.4, IFNγR−/− = 5.2) and the CD8:CD4 ratio were reduced with IFNγR−/− PerC cells (WT = 8.5, IFNγR−/− = 4.5) (Fig. 3). As seen for PerC cells, the spleen (SP) cell response to PHA also favored CD8 T proliferation (CD8:CD4 = 10.1); however, the response to TCR ligation was not suppressed, and selective CD8 T cell expansion did not occur (Fig. 2B). These data show that PHA promotes CD8 T cell expansion under conditions that suppress the response to TCR ligation.
Fig. 2.
PHA stimulates SP and PerC CD8 T cell proliferation. Panel A: PHA, but not TCR ligation stimulates PerC T cell proliferation. PerC T cells stimulated by TCR ligation require IFNγ neutralization or iNOS inhibition to respond. Panel B: SP T cells respond better to TCR ligation than PHA stimulation. CFSE-labeled PerC or SP cells, cultured with PHA or αCD3 +/− 1-MA or αIFNγ, were resolved into CD4+ and CD8+ T cell subsets by flow cytometry. *SI = stimulation index as described in methods. CD8:CD4 represents % CD8+ cells / A% CD4+ cells. Data shown are representative of 8–10 experiments.
Fig. 3.
Optimal PHA-induced CD8 T cell expansion is IFNγ- dependent. WT or IFNγR−/− PerC cells were CFSE-labeled, cultured with PHA or αCD3 and resolved into CD4+ and CD8+ T cell subsets. SI indicated above histograms, adjacent asterisks indicate significant differences in experimental vs control conditions. Data representative of 3 experiments.
PHA increases the number of IFNγ+ CD8+ T cells
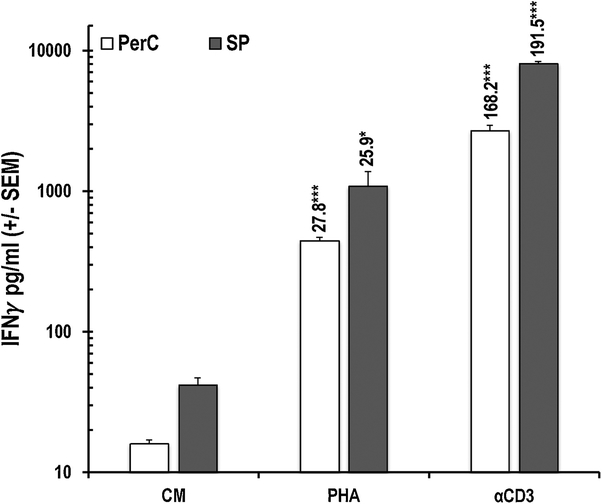
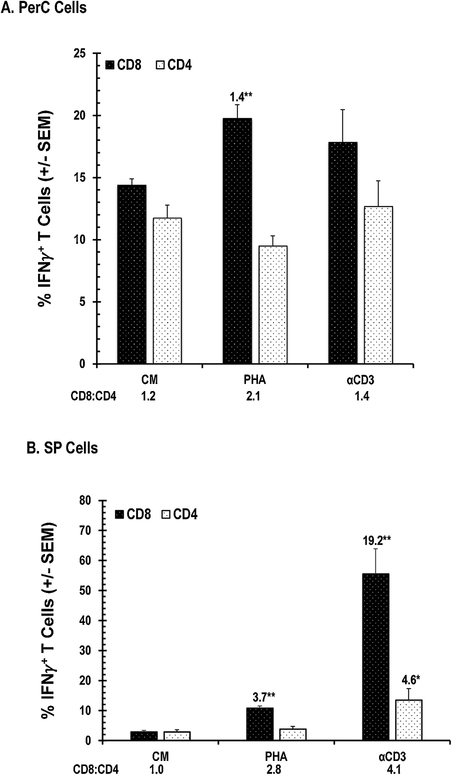
Produced by both CD4+ and CD8+ T cells, IFNγ is essential for promoting cellular immunity19. We measured IFNγ production by PerC and SP cells by ELISA and determined the frequency of IFNγ+ cells in these cultures by flow cytometry. Consistent with their lower T cell composition (Fig. 1A), PerC cells produced less IFNγ than SP cells when treated with either PHA or αCD3 (30–40% of SP cell values, Fig. 4). PHA increased IFNγ production by both SP and PerC cells (> 25-fold), but the response to TCR ligation was much greater (> 150-fold). Consistent with having more CD44hi TE/M cells (Fig 1A), intracellular cytokine staining revealed that PerC cell culture had more “spontaneous” IFNγ+ CD8+ and CD4+ T cells than the SP cell culture (CM values, Fig. 5A vs 5B). PHA increased the percentage of CD8+ IFNγ+ cells in PerC cell culture, generating a higher CD8:CD4 ratio than that following TCR ligation (Fig. 5A). Although both forms of stimulation increased the CD8:CD4 ratio, PHA triggered a smaller fraction of IFNγ+ cells within each of the SP CD8 and CD4 T cell pools (Fig. 5B). These data illustrate that, in addition to expanding CD8 T cells under Mϕ-dense conditions, PHA increases the number of IFNγ+ cells within this important subset that is essential for cellular immunity.
Fig. 4.
PHA triggers less IFNγ production. Unstimulated (CM) and stimulated (γCD3, PHA) PerC or SP cell culture supernatants (SNs) were tested for IFNγ production. Numbers above histograms indicate SI. Average values from 6 experiments.
Fig. 5.
PHA increases IFNγ+ T cells. Panel A, PerC T cells. Panel B, SP T cells. SI above histograms with asterisks to indicate significance. Data representative of 4 experiments.
PHA triggers less PerC Mϕ PD-L1 expression than TCR ligation
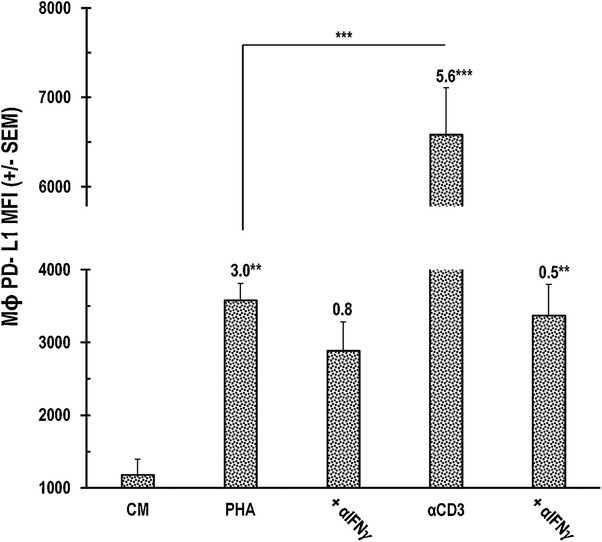
Although IFNγ is essential for promoting cellular immunity, this cytokine also restrains T cell expansion by promoting APCs and tumor cells to express PD-L1, an immune-suppressive ligand for the PD-1 receptor expressed by activated T cells (Figs. 1,2)19. Mϕs are particularly sensitive to this cytokine as they rapidly and markedly upregulate PD-L1 expression in vitro20. However, compared to TCR ligation, PHA stimulation resulted in considerably less PD-L1 expression (~50%, Fig. 6). IFNγ neutralization significantly reduced the PD-L1 increase observed following TCR ligation, but had less impact on the PHA response. Neutralization of other cytokines associated with PD-L1 upregulation (IL4, Type 1 IFN]) did not impact the PHA response (data not shown). These results suggest that PHA could serve as a potent supplement to checkpoint therapy21.
Fig. 6.
Less PD-L1 expression by PerC Mɸs with PHA treatment. Numbers are SI with asterisks to indicate significance. Data representative of 7 experiments.
PHA binds CD44hi effector/memory T cells and macrophages
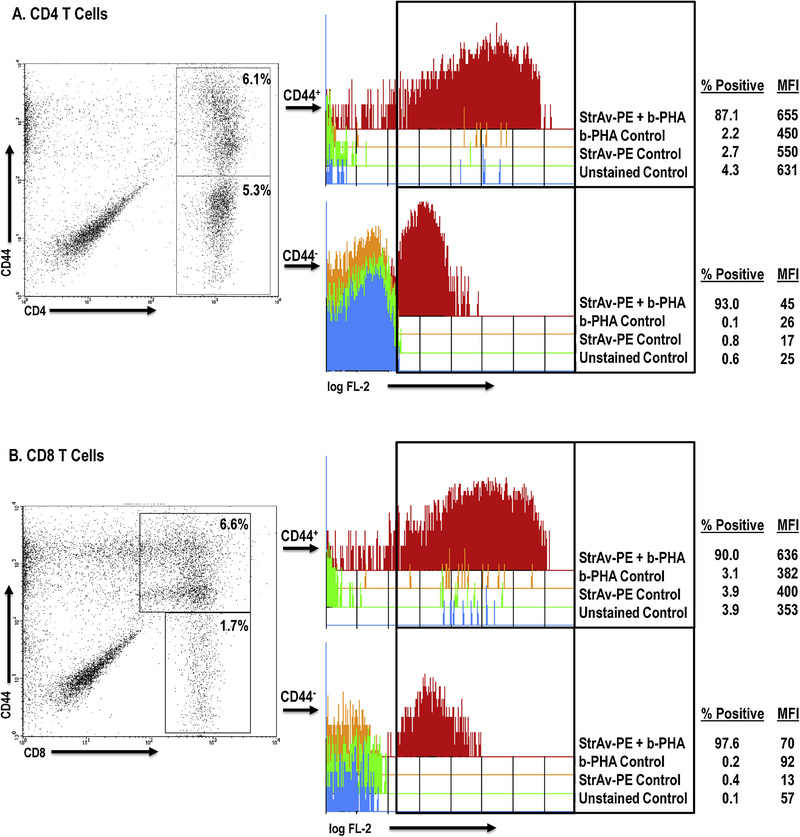
PHA has been shown to bind glycoprotein motifs found on the TCR and CD2 of T cells, and to ligate TLRs-2/6, −4, and −5 on monocytes, Mϕs, and dendritic cells, APCs essential for T cells to respond to this mitogen22–27. Since these prior studies focused on PHA binding to cells from organized lymphoid tissue and cell lines, we assessed PHA binding to PerC cells by flow cytometry. FSC/SSC analysis revealed that the addition of a standard culture concentration of PHA (2.5 μg/ml) led to the formation of cellular aggregates, particularly reducing the proportion of Mϕs (by 42%) and lymphocytes (by 63%) within their gates, to form aggregates that increased by more than 2-fold the percent representation of cells outside of these gates. (Fig. 7). Reducing the PHA concentration 10-fold (0.3 μg/ml) revealed that lymphocytes were still forming aggregates, whereas Mϕs were closer to the untreated control. Staining for CD4 and CD8 T cell subsets resolved on the basis of CD44 expression revealed that PHA bound most T cells, particularly those expressing high levels of CD44 (~10-fold higher MFI; Fig. 8). Compared to CD4+ T cells, CD44hi cells represent a greater fraction of the PerC CD8+ T cell pool (47% versus 57%, n = 15; Fig. 1A). Furthermore, all F4/80+ Mϕs bound PHA (Fig. 9). These results illustrate that PHA enhances CD8+ T cell activation within Mϕ-dense environments and might do so by increasing APC-T cell interaction.
Fig. 7.
PHA agglutinates WBCs. FSC/SSC gating for myeloid (R1) and lymphoid cells (R2) and doublets (R3). Ungated data represent that fraction of cells outside of the R1–3 gates. Data shown are representative of 6 experiments.
Fig. 8.
PHA binds CD44hi T cells. PerC cells, stained for CD4/8, CD44, and b-PHA were gated on CD4 (Panel A) or CD8 (Panel B) versus CD44. MFI = Mean Fluorescence Intensity. Data representative of 3 experiments.
Fig. 9.
PHA binds PerC Mɸs. PerC cells, stained for F4/80 and b-PHA were gated as shown. Single parameter histogram depicts StrAv-PE/b-PHA binding. Data representative of 3 experiments.
Co-culture of PerC and SP cells reveals synergistic effect of PHA
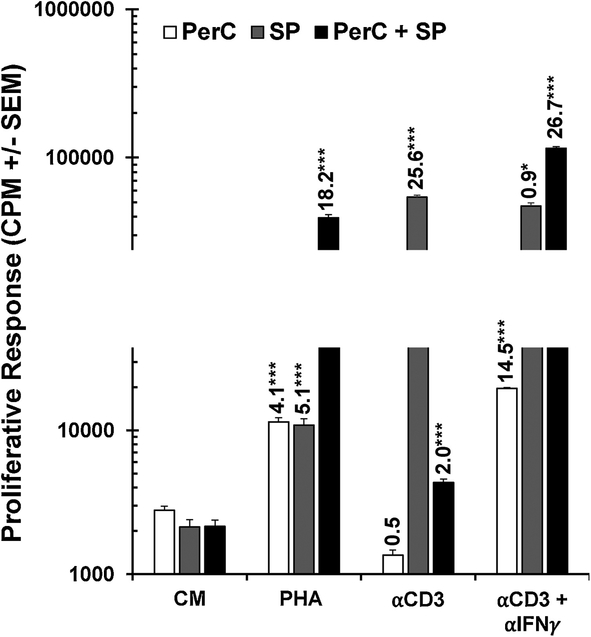
The APC requirement for PHA to achieve peak T cell activation invited speculation that the modest SP cell response to PHA could be enhanced by the addition of APCs. We tested this premise by co-culture of SP with PerC cells and observed a synergistic proliferative response to PHA stimulation, but suppression with TCR ligation (Fig. 9). While the response to PHA was two-fold greater than the sum of the individual SP and PerC cell responses, the αCD3 response for co-culture was one tenth the response of SP cells cultured alone. IFNγ neutralization recovered the αCD3 response, reinforcing the role of this cytokine in driving suppression in Mϕ-dense culture. These results illustrate how PHA enhances APC- T cell interaction under conditions where TCR ligation promotes suppression.
Discussion
The results reported here demonstrate that PHA is a superior T cell activator in cultures with a high Mϕ composition. PerC Mϕs inhibited T-cell activation triggered by TCR (αCD3) ligation unless iNOS was blocked or IFNγ was neutralized. In contrast, PHA stimulated PerC T cell proliferation without IFNγ or iNOS inhibition. PHA bound to Mϕs and T cells, particularly CD44hi TE/M cells, and generated marked expansion of CD8+ T cells. PHA also induced less inhibitory PD-L1 expression by Mϕs. These results suggest that PHA might serve in strategies designed to enhance anti-tumor immunity.
PHA has a long history of in vitro use as a polyclonal T cell activator and generator of cytokine-rich (IL-2) supernatants28–30. It has also been tested as a treatment to expand autologous T cells in vitro for subsequent infusion into cancer patients31–33. In a study focused upon melanoma treatment, direct tumor injection of in vitro, PHA-activated autologous lymphocytes led to a 93% response rate, which was statistically significant relative to treatment with the non-activated control32. In a phase I trial monitoring sarcoma patients with considerable tumor burden, large numbers of activated T cells could be safely generated and transfused, and evidence of their migration into tumors was attained, however, no clinical benefit was observed33.
Cells of the immune system express distinct glycoprotein signatures that resolve them into functionally distinct subsets34,35. PHA has been shown to bind specific glycoprotein motifs on the TCR and CD2 of T cells, and to ligate TLRs-2/6, −4, and −5 on monocytes22–27. In this report, we show that PHA preferentially binds cells expressing high levels of CD44, a receptor for hyaluronic acid, collagens and other cellular matrix molecules (Fig.7). Post-translational glycosylation of CD44 impacts cellular activation, effector function, and recirculation/homing. CD44 was originally designated phagocytic glycoprotein-1 (Pgp-1) due to high expression by Mϕs relative to spleen cells36,37. Subsequent work found that TE/M are CD44hi and that the greatest expression of Pgp-1 was by peritoneal exudate, alloreactive, Lyt-2+ (CD8+) T cells38. Cell surface carbohydrate modification is a phenotypic hallmark of CD8+ TE/M cells including tumor-infiltrating lymphocytes (TILs)39–41. High CD8/CD4 T cell ratios in tumors are a positive prognostic factor42,43. Intriguingly, CD44 is also expressed by cancer stem cells and is a key tumor promoter in transformed cells lacking functional p5344. CD44 neutralization augments T cell activation triggered by TCR ligation, but is not necessary for an optimal PHA response45. In toto, these studies suggest that “hot” TMEs, i.e., those comprised of Mϕs, an inflammatory T cell infiltrate, and CD44hi cancer cells, likely have a “sugar code” that could provide multiple targets for PHA binding and potent activation of anti-tumor CD8+ T cells2,4,6,7,9,17,46.
Complete expression of CTL effector function requires IFNα. However, this cytokine can also trigger Mϕ suppression of T cell expansion via both iNOS and PD-L19–11,13 (Figs. 1–3,6,10). This dual role for IFNγ has been noted in cancer and represents a significant clinical challenge19,47. Compared with TCR ligation, PHA generates less IFNγ production and less PD-L1 expression - factors that favor T cell activation under Mϕ-dense conditions. Notably, this was despite PerC T cells having greater percentages of both CD4+ and CD8+ CD44hi IFNγ-producing T cells48,49. Considering the Th1 polarization of the C57BL/6 strain of mice studied herein, it is significant to note that PHA also promoted BALB/c (Th2-prone) PerC T cell activation (data not shown)50.
Fig. 10.
PHA synergizes T cell activation with PerC + SP co-culture. PerC and SP cells were cultured alone or together with PHA or ⍺CD3 +/− αIFNγ. SI and statistical significance indicated over histograms. Data representative of 4 experiments.
Early studies of PHA demonstrated the absolute requirement for APCs to promote T cell activation and that increasing cell density optimized responses25,51,52. However, this response appears to be costimulation independent as CTLA-4-Ig, which blocked responses to TCR ligation and ConA, did not impact the PHA response53. Still, studies have shown that large numbers of activated (thioglycollate-elicited) Mϕs can suppress the PHA response52. Thus, strategies that debulk tumors in conjunction with checkpoint blockade are likely to optimize therapeutic efficacy54–56. Perhaps PHA can activate the “exhausted” T cells found in advanced tumors57. Incorporating PHA as a “glyco-conjugate” partnered with an anti-CTLA-4, -PD-1, or -PD-L1 MAb might be a strategy to optimize activation of a polyclonal anti-tumor CTL response.
Acknowledgements
This research was supported by the NIH AREA program (R15 AI 060356–01, R15 CA 136901–01). We are grateful to Antonia Conti, Barri Deptula, and Tolga Guven for their assistance with mouse husbandry.
Abbreviations:
- APC
antigen presenting cell
- b-PHA
biotinylated-PHA
- CM
complete media
- iNOS
inducible nitric oxide synthase
- Mϕ
macrophage
- PerC
peritoneal cavity
- PHA
phytohemagglutinin
- SI
stimulation index
- SP
spleen
- 1-MA
NG-monomethyl-L-arginine
- StrAv-PE
phycoerythrin-conjugated streptavidin
- TCR
T cell receptor
- TE/M
effector/memory T cells
- TME
tumor microenvironment
Footnotes
Publisher's Disclaimer: This is a PDF file of an unedited manuscript that has been accepted for publication. As a service to our customers we are providing this early version of the manuscript. The manuscript will undergo copyediting, typesetting, and review of the resulting proof before it is published in its final citable form. Please note that during the production process errors may be discovered which could affect the content, and all legal disclaimers that apply to the journal pertain.
Disclosures
The authors have no competing financial interests.
References
- 1.Renner K, Singer K, Koehl G, Geissler E, Peter K, Siska P, Kreutz M. Metabolic hallmarks of tumor and immune cells in the tumor microenvironment. Front Immunol 2017; 8:1–11. [DOI] [PMC free article] [PubMed] [Google Scholar]
- 2.Gajewski T, Schreiber H, Fu Y-X. Innate and adaptive immune cells in the tumor microenvironment. Nat Immunol 2013; 14:1014–22. [DOI] [PMC free article] [PubMed] [Google Scholar]
- 3.Wang M, Zhao J, Zhang L, Wei F, Lian Y, Wu Y, et al. Role of the tumor microenvironment in tumorigenesis. J Cancer 2017; 8:761–73. [DOI] [PMC free article] [PubMed] [Google Scholar]
- 4.Gurusamy D, Clever D, Eli R, Restifo N. Novel “elements” of immune suppression within the tumor microenvironment. Cancer Immunol Res 2017; 5:426–33. [DOI] [PMC free article] [PubMed] [Google Scholar]
- 5.Turk J The organization of lymphoid tissue in relation to function. Lymph 1977; 10:46–53. [PubMed] [Google Scholar]
- 6.Kelly P, Davison R, Bliss E, McGee J. Macrophages in human breast disease: a quantitative immunohistochemical study. Br J Cancer 1988; 57:174–7. [DOI] [PMC free article] [PubMed] [Google Scholar]
- 7.Gooden M, de Bock G, Leffers N, Daemen T, Nijman H. The prognostic influence of tumour–infiltrating lymphocytes in cancer: a systematic review with meta-analysis. Br J Cancer 2011; 105:93–103. [DOI] [PMC free article] [PubMed] [Google Scholar]
- 8.He J, Hu Y, Hu M, Li B. Development of PD-1/PD-L1 pathway in tumor immune microenvironment and treatment for non-small cell lung cancer. Sci Rep 2015; 5:1–9. [DOI] [PMC free article] [PubMed] [Google Scholar]
- 9.Composto G, Gonzalez D, Bucknum A, Silberman D, Taylor J, Kozlowski M, et al. Peritoneal T lymphocyte regulation by macrophages, Immunobiol 2011; 216:256–64. [DOI] [PMC free article] [PubMed] [Google Scholar]
- 10.Matlack R, Yeh K, Rosini L, Gonzalez D, Taylor J, Silberman D, et al. Peritoneal macrophages suppress T-cell activation by amino acid catabolism. Immunology 2006; 117:386–95. [DOI] [PMC free article] [PubMed] [Google Scholar]
- 11.Silberman D, Bucknum A, Bartlett T, Composto G, Kozlowski M, Walker A, et al. CD28 ligation increases macrophage suppression of T-cell proliferation. Cell Mol Immunol 2012; 9:341–9. [DOI] [PMC free article] [PubMed] [Google Scholar]
- 12.Goldman N, Valiuskyte K, Londregan J, Swider A, Somerville J, Riggs J. Macrophage regulation of B cell proliferation. Cell Immunol 2017; 314:54–62. [DOI] [PMC free article] [PubMed] [Google Scholar]
- 13.Rath M, Muller I, Kropf P, Closs E, Munder M. Metabolism via arginase or nitric oxide synthase: Two competing arginine pathways in macrophages. Front Immunol 2014; 5:1–10. [DOI] [PMC free article] [PubMed] [Google Scholar]
- 14.Bronte V, Pittet M. The spleen in local and systemic regulation of immunity. Immunity 2013; 39:806–18. [DOI] [PMC free article] [PubMed] [Google Scholar]
- 15.Sen P, Kemppainen E, Oresic M. Perspectives on systems modeling of human peripheral blood mononuclear cells. Front Mol Biosci 2018, 4:1–11. [DOI] [PMC free article] [PubMed] [Google Scholar]
- 16.Sharon N, Lis H. History of lectins: from hemagglutinins to biological recognition molecules, Glycobiology 2004; 14:53R–62R. [DOI] [PubMed] [Google Scholar]
- 17.Lanitis E, Dangaj D, Irving M, Coukos G. Mechanisms regulating T-cell infiltrating and activity in solid tumors. Ann Oncol 2017; 28(suppl_12):xii18–xii32. [DOI] [PubMed] [Google Scholar]
- 18.Goldman N, Lomakova Y, Londregan J, Somerville J, Riggs J. High macrophage PD-L1 expansion not responsible for T cell suppression, Cell Immunol 2017; 324:50–8. [DOI] [PMC free article] [PubMed] [Google Scholar]
- 19.Mandai M, Hamanishi J, Abiko K, Matsumura N, Baba T, Konishi I. Dual faces of IFNγ in cancer progression: a role of PD-L1 induction in the determination of pro- and anti-tumor immunity. Clin Cancer Res 2016; 22:2329–34. [DOI] [PubMed] [Google Scholar]
- 20.Sanmamed M, Chen L. Inducible expression of B7-H1 (PD-L1) and its selective role in tumor site immune modulation. Cancer J 2014; 20:256–61. [DOI] [PMC free article] [PubMed] [Google Scholar]
- 21.Marin-Acevedo J, Dholaria B, Soyano A, Knutson K, Chumsri S, Lou Y. Next generation of immune checkpoint therapy in cancer: new developments and challenges. J Hematol Oncol 2018; 11:1–20. [DOI] [PMC free article] [PubMed] [Google Scholar]
- 22.Chilson O, Boylston A, Crumpton M. Phaseolus vulgaris phytohaemagglutinin (PHA) binds to the human T lymphocyte antigen receptor. EMBO J 1984; 3:3239–45. [DOI] [PMC free article] [PubMed] [Google Scholar]
- 23.O’Flynn K, Krensky A, Beverley P, Burakoff S, Linch D. Phytohaemagglutinin activation of T cells through the sheep red blood cell receptor. Nature 1985; 313:1–2. [DOI] [PubMed] [Google Scholar]
- 24.Unitt J, Hornigold D. Plant lectins are novel Toll-like receptor agonists, Biochem Pharmacol 2011; 81:1324–8. [DOI] [PubMed] [Google Scholar]
- 25.Lipsky P, Ellner J, Rosenthal A. Phytohemagglutinin-induced proliferation of guinea-pig thymus-derived lymphocytes. I. Accessory cell dependence. J Immunol 1976; 116:868–75. [PubMed] [Google Scholar]
- 26.Byrne J, Butler J, Cooper M. Differential activation requirements for virgin and memory T cells. J Immunol 1988; 141:3249–57. [PubMed] [Google Scholar]
- 27.Ricci-Azevedo R, Roque-Barreira M, Gay N. Targeting and recognition of toll-like receptors by plant and pathogen lectins. Front Immunol 2017; 8:1820. doi: 10.3389/fimmu.2017.01820. eCollection 2017. [DOI] [PMC free article] [PubMed] [Google Scholar]
- 28.Nowell P Phytohemagglutinin: an initiator of mitosis in culture of animal and human leukocytes. Cancer Res 1960; 20:462–6. [PubMed] [Google Scholar]
- 29.Janossy G, Greaves M. Lymphocyte activation: I. Response of T and B lymphocytes to phytomitogens. Clin Exp Immunol 1971; 9:483–98. [PMC free article] [PubMed] [Google Scholar]
- 30.Morgan D, Ruscetti F, Gallo R. Selective in vitro growth of T lymphocytes from normal human bone marrow, Science 1976; 193:1007–8. [DOI] [PubMed] [Google Scholar]
- 31.Cheema A, Hersh E. Local tumor immunotherapy with in vitro activated autochthonous lymphocytes. Cancer. 1972; 29:982–6. [DOI] [PubMed] [Google Scholar]
- 32.Frenster J, Rogoway W. In-vitro activation and reinfusion of autologous human lymphocytes. Lancet 1970; 2:979–80. [DOI] [PubMed] [Google Scholar]
- 33.Mazumder A, Eberlein T, Grimm E, Wilson D, Keenan A, Aamodt R, Rosenberg S. Phase 1 study of the adoptive immunotherapy of human cancer with lectin activated autologous mononuclear cells. Cancer 1984; 53:896–905. [DOI] [PubMed] [Google Scholar]
- 34.Lemaire S, Derappe C, Michalski J, Aubery M, Neel D. Expression of beta 1–6-branched N-linked oligosaccharides is associated with activation in human T4 and T8 cell populations. J Biol Chem 1994; 18:8069–74. [PubMed] [Google Scholar]
- 35.Rodriguez E, Schetters S, van Kooyk Y. The tumor glyco-code as a novel immune checkpoint for immunotherapy. Nat Rev Immunol 2018; 18:204–11. [DOI] [PubMed] [Google Scholar]
- 36.Colombatti A, Hughes E, Taylor B, August J. Gene for a major cell surface glycoprotein of mouse macrophages and other phagocytic cells is on chromosome 2. Proc Natl Acad Sci, USA. 1982; 79:1926–9. [DOI] [PMC free article] [PubMed] [Google Scholar]
- 37.Hughes E, Colombatti A, August J. Murine cell surface glycoproteins. Purification of the polymorphic Pgp-1 antigen and analysis of its expression on macrophages and other myeloid cells. J Biol Chem 1983; 258:1014–21. [PubMed] [Google Scholar]
- 38.Budd R, Cerottini J, Horvath C, Bron C, Pedrazzi T, Howe R, MacDonald H. Distinction of virgin and memory T lymphocytes. Stable acquisition of the Pgp-1 glycoprotein concomitant with antigenic stimulation. J Immunol 1987; 138:3120–9. [PubMed] [Google Scholar]
- 39.Salmi M, Grenman R, Grenman S, Nordman S, Jalkanen E. Tumor endothelium selectively supports binding of IL-2-propagated tumor-infiltrating lymphocytes J Immunol 1995; 154:6002–12. [PubMed] [Google Scholar]
- 40.Galvan M, Murali-Krishna K, Ming L, Baum L, Ahmed R. Alterations in cell surface carbohydrates on T cells from virally infected mice can distinguish effector/memory CD8+ T cells from naïve cells. J Immunol 1998; 161:641–8. [PubMed] [Google Scholar]
- 41.Harrington L, Galvan M, Baum L, Altman J, Ahmed R. Differentiating between memory and effector CD8 T cells by altered expression of cell surface O-glycans. J Exp Med 2000; 191:1241–6. [DOI] [PMC free article] [PubMed] [Google Scholar]
- 42.Hadrup S, Donia M, Straten P. Effector CD4 and CD8 T cells and their role in the tumor microenvironment. Cancer Microenviron 2013; 6:123–33. [DOI] [PMC free article] [PubMed] [Google Scholar]
- 43.Djenidi F, Adam J, Goubar A, Durgeau A, Meurice G, de Montpreville V, et al. CD8+CD103+ tumor-infiltrating lymphocytes are tumor-specific tissue-resident memory T cells and a prognostic factor for survival in lung cancer patients. J Immunol 2015; 194:3475–86. [DOI] [PubMed] [Google Scholar]
- 44.Godar S, Ince T, Bell G, Feldser D, Donaher J, Bergh J, et al. Growth-inhibitory and tumor-suppressive functions of p53 depend on its repression of CD44. Cell 2008; 134:62–73. [DOI] [PMC free article] [PubMed] [Google Scholar]
- 45.Denning S, Le P, Singer K, Haynes B. Antibodies against the CD44 p80, lymphocyte homing receptor molecule augment human peripheral blood T cell activation. J Immunol 1990; 144:7–15. [PubMed] [Google Scholar]
- 46.Brooks S Lectin Histochemistry: Historical Perspectives, State of the Art, and the Future. Methods Mol Biol 2017; 1560:93–107. [DOI] [PubMed] [Google Scholar]
- 47.Zaidi M, Merlino G. The two faces of interferon-γ in cancer, Clin Cancer Res 2011. 17:6118–24. [DOI] [PMC free article] [PubMed] [Google Scholar]
- 48.Kambayashi T, Assarsson E, Lukacher A, Ljunggren H-G, Jensen P. Memory CD8+ T cells provide an early source of IFN-γ. J Immunol 2003; 170:2399–408. [DOI] [PubMed] [Google Scholar]
- 49.Moon H, Park C, Lee J, Shin S, Lee J, Kho I, et al. Early development in the peritoneal cavity of CD49dhigh Th1 memory phenotype CD4+ T cells with enhanced B cell helper activity. J Immunol 2015; 195:564–75. [DOI] [PubMed] [Google Scholar]
- 50.Mosmann T, Coffman R. TH1 and TH2 cells: different patterns of lymphokine secretion lead to differential functional properties. Ann Rev Immunol 1989; 7:145–73. [DOI] [PubMed] [Google Scholar]
- 51.Ceuppens J, Baroja M, Van Damme J, Billiau A. Human T cell activation with phytohemagglutinin. The function of IL-6 as an accessory signal. J Immunol 1988; 141:3868–74. [PubMed] [Google Scholar]
- 52.Folch H, Yoshinaga M, Waksman B. Regulation of lymphocyte responses in vitro. III. Inhibition by adherent cells of the T-lymphocyte response to phytohemagglutinin. J Immunol 1973; 110:835–9. [PubMed] [Google Scholar]
- 53.Yeh K, Silberman D, Gonzalez D, Riggs J. Complementary suppression of T cell activation by peritoneal macrophages and CTLA-4-Ig. Immunobiology 2007; 212;1–10. [DOI] [PubMed] [Google Scholar]
- 54.Noy R, Pollard J. Tumor-associated macrophages: from mechanisms to therapy. Immunity 2014; 41:49–61. [DOI] [PMC free article] [PubMed] [Google Scholar]
- 55.Topalian S, Taube J, Anders R, Pardoll D. Mechanism-driven biomarkers to guide immune checkpoint blockade in cancer therapy, Nat Rev Cancer 2016; 16:275–87. [DOI] [PMC free article] [PubMed] [Google Scholar]
- 56.Pardoll D The blockade of immune checkpoints in cancer immunotherapy. Nat Rev Cancer 2012; 12:252–64. [DOI] [PMC free article] [PubMed] [Google Scholar]
- 57.Thommen D, Schumacher T. T cell dysfunction in cancer. Cancer Cell 2018; 33:547–62. [DOI] [PMC free article] [PubMed] [Google Scholar]


