Abstract
Purpose
To investigate the combination of mammography radiomics and quantitative three-compartment breast (3CB) image analysis of dual-energy mammography to limit unnecessary benign breast biopsies.
Materials and Methods
For this prospective study, dual-energy craniocaudal and mediolateral oblique mammograms were obtained immediately before biopsy in 109 women (mean age, 51 years; range, 31–85 years) with Breast Imaging Reporting and Data System category 4 or 5 breast masses (35 invasive cancers, 74 benign) from 2013 through 2017. The three quantitative compartments of water, lipid, and protein thickness at each pixel were calculated from the attenuation at high and low energy by using a within-image phantom. Masses were automatically segmented and features were extracted from the low-energy mammograms and the quantitative compartment images. Tenfold cross-validations using a linear discriminant classifier with predefined feature signatures helped differentiate between malignant and benign masses by means of (a) water-lipid-protein composition images alone, (b) mammography radiomics alone, and (c) a combined image analysis of both. Positive predictive value of biopsy performed (PPV3) at maximum sensitivity was the primary performance metric, and results were compared with those for conventional diagnostic digital mammography.
Results
The PPV3 for conventional diagnostic digital mammography in our data set was 32.1% (35 of 109; 95% confidence interval [CI]: 23.9%, 41.3%), with a sensitivity of 100%. In comparison, combined mammography radiomics plus quantitative 3CB image analysis had PPV3 of 49% (34 of 70; 95% CI: 36.5%, 58.9%; P < .001), with a sensitivity of 97% (34 of 35; 95% CI: 90.3%, 100%; P < .001) and 35.8% (39 of 109) fewer total biopsies (P < .001).
Conclusion
Quantitative three-compartment breast image analysis of breast masses combined with mammography radiomics has the potential to reduce unnecessary breast biopsies.
© RSNA, 2018
Summary
When combined with mammography radiomics, the water-lipid-protein breast tissue composition measured with quantitative three-compartment breast image analysis may reduce unnecessary biopsies of benign breast masses and result in a higher positive predictive value of biopsy performed.
Implications for Patient Care
■ Three-compartment (water, lipid, and protein) breast imaging with noncontrast dual-energy mammography is readily implemented with existing digital mammography or tomosynthesis equipment and results in a 10% higher mean glandular dose of an average screening mammogram.
■ Quantitative three-compartment breast (3CB) image analysis before breast biopsy provides predictive information about the malignant potential of breast lesions that cannot be obtained by visual interpretation of mammography alone.
■ The combination of quantitative 3CB image analysis and mammography radiomics may reduce unnecessary biopsies of benign breast masses and result in a higher positive predictive value of biopsy performed in breast masses deemed suspicious by the breast radiologist.
Introduction
Studies have shown that up to 60% of women screened with mammography over 10 years have at least one abnormal result, even though no breast cancer is present. Hence, reducing false-positive mammograms and false-positive biopsies could substantially lower the cost of screening (1–6). A promising approach to improve clinical decision support is radiomics. Although computer-aided detection has been part of the routine clinical assessment of screening mammograms in the United States, computer-aided diagnosis has been an area of active research for quite some time (7) but, to date, has not been approved by the U.S. Food and Drug Administration for mammography. Radiomics is an extension of computer-aided diagnosis and refers to the comprehensive quantification of tumor phenotypes by extracting a large number of quantitative image features (8) for data mining and precision medicine. In recent years, investigators have shown success using radiomics for breast cancer, extracting a variety of clinically relevant features, merging them into signatures, and estimating the probability of malignancy of identified lesions (9–11). In addition, radiomics has been used to assess the risk of future breast cancer (12) and predict breast cancer prognosis (13,14). Observer studies have shown some improvement in radiologists’ performances in diagnostic tasks when a computer aid is used (7,15,16).
There is a strong biologic basis as to why the microscopic features of a tumor produce macroscopically distinct compositions amenable to measurement. First, invasive cancer is highly angiogenic. Weind et al (17) compared the central to peripheral microvasculature of invasive tumors and fibroadenomas and found that vasculature differed substantially among normal tissue, fibroadenomas, and different grades of invasive ductal carcinoma. Second, Cerussi et al (18) found a 20% reduction in lipid and 50% elevation in water in invasive breast cancer versus normal breast tissue and a strong positive correlation (R = 0.98) between the macroscopic water concentration and the Scarff-Bloom-Richardson score (a histologic grading scale ranging from 3 to 9 that accounts for tubule formation, nuclear pleomorphism, and mitosis counts [19]). Third, invasive cancers have been found to have significantly lower x-ray attenuation than fibroadenomas, suggesting a distinctly different composition between cancerous and benign masses. The kinetic blood flow differences due to differential vascularization of cancerous and benign tissues have been used to improve the diagnostic accuracy of gadolinium-enhanced MRI and mammographic methods, such as contrast material–enhanced digital mammography (20,21) and contrast-enhanced breast tomosynthesis (22,23). But MRI is expensive and contrast agents are invasive and potentially toxic. Three-compartment breast (3CB) imaging is a dual-energy mammography technique that does not require a contrast agent, is easily implemented with minimal changes in workflow of digital mammography (or breast tomosynthesis) equipment, and results in only a 10% higher dose over standard mammographic views (24). Three-compartment breast imaging yields quantitative and reproducible pixel-by-pixel estimates of water, lipid, and protein thicknesses throughout the breast (24).
The aim of this study was to investigate the potential of mammography radiomics (lesion texture, size, shape, and morphologic characteristics), in vivo measurement of the biologic tissue composition derived from 3CB imaging with dual-energy mammography, and the two measures combined to avoid unnecessary benign biopsies. Hence, we were interested in decreasing the number of false-positive biopsy results and at the same time not missing invasive cancers that should undergo biopsy.
Materials and Methods
This prospective diagnostic 3CB imaging clinical study was approved by the institutional review board and followed Health Insurance Portability and Accountability Act–compliant protocols. All study participants provided written informed consent.
Study Participants
Women were recruited consecutively for participation in our study, and the inclusion criterion was presentation with Breast Imaging Reporting and Data System (BI-RADS) category 4 or 5 findings on the basis of diagnostic mammography (25). Exclusion criteria were previous biopsy in the same quadrant of the affected breast or systemic hormone therapy or chemotherapy. From 2013 through 2017, women with BI-RADS category 4 or 5 findings were identified after undergoing diagnostic mammography and approached for enrollment in our study immediately before breast biopsy at two clinical sites (University of California, San Francisco, San Francisco, Calif, and H. Lee Moffitt Cancer Center, Tampa, Fla). After providing written informed consent, study participants underwent unilateral dual-energy mammography of the affected breast with use of digital mammography equipment (Selenia; Hologic, Marlborough, Mass) to derive breast composition (24). The most common reason to decline study participation was the additional radiation exposure resulting from the need for additional views of the affected breast in addition to the previous clinical diagnostic views. However, the mammography equipment used in our prospective 3CB imaging study is approved by the U.S. Food and Drug Administration and, in future practice, 3CB imaging could replace conventional diagnostic digital mammography because low-energy mammography is performed under “standard” settings, eliminating the need for extra views.
Computational Methods
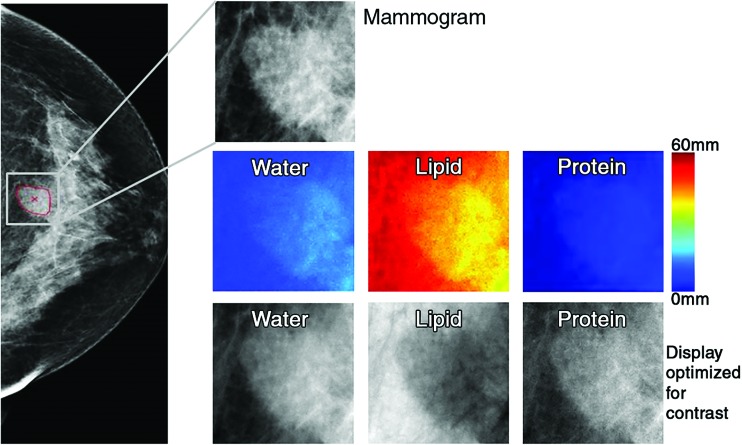
Radiomic analysis was performed by using the low-energy mammograms (equivalent to mammograms acquired with conventional clinical settings) obtained in the “for processing” mode (craniocaudal and mediolateral oblique diagnostic images of 0.07-mm resolution). The corresponding quantitative breast tissue composition images, that is, the 3CB thickness maps of water, lipid, and protein, were derived from the dual-energy mammograms from the attenuation at both high and low energy in combination with an in-image phantom of known modeled compartment thickness combinations (0.14-mm resolution) (Fig 1; Appendix E1 [online]). The high-energy mammograms were used only to derive the 3CB thickness maps and were not otherwise analyzed.
Figure 1:
Images in 71-year-old woman with 1.6-cm invasive ductal carcinoma (Breast Imaging Reporting and Data System category 5, with category C breast density). Low-energy mammogram and corresponding regions of interest for mammogram (top) and breast tissue composition images (bottom two rows).
Only in-house–developed software was used. The classification task of interest was the differentiation between malignant and benign breast masses. The mammography radiomics method required the approximate lesion center of the mass on a mammogram as determined from the lesion outline drawn by an expert radiologist. Each lesion was then automatically segmented (26), and lesion image features were extracted from the mammograms by using the computer segmentations (Appendix E2 [online]). For quantitative 3CB image analysis, features were extracted from the corresponding water, lipid, and protein composition images, again by using the computer segmentations (Appendix E1 [online]).
In our analyses, we used predefined lesion signatures, that is, predefined feature combinations, directly obtained from prior work on different data sets for both mammography radiomics (27) and quantitative 3CB (27,28). For mammography radiomics, a five-feature signature was used: the lesion size, average gray value, contrast, and two features describing a combination of mass shape and margin, which was derived in previous work from 432 biopsy-proven mass lesions imaged with a Senographe 2000D system (GE Medical Systems, Milwaukee, Wis) (27). For quantitative 3CB, a four-feature signature was derived from feature selection within pilot study data (no overlap with the current data set) of 45 breast lesions (including 27 masses, five of which were cancerous) (28,29). Because 3CB thickness maps are quantitative, “simple” quantitative 3CB features, such as mean and median of the water-lipid-protein compartment thicknesses within each mass and its surrounding parenchyma, were extracted (Appendix E1 [online]). Features selected from the pilot study data and used herein were the median water thickness within a mass, the median water thickness within the surrounding parenchyma, the ratio of the median water thicknesses of a mass and the surrounding parenchyma, and the skewness of the lipid thickness within a mass (quantifying the asymmetry of the lipid thickness distribution). For the combined mammography radiomics plus quantitative 3CB analysis, the radiomics and quantitative 3CB signatures were combined into a predefined nine-feature signature (five features from mammography radiomics and four from quantitative 3CB) (Appendix E3 [online]). Given the modest size of the data set, we (a) performed 10-fold cross-validation for classifier training and testing, (b) used a “simple” but robust classifier (linear discriminant analysis), and (c) used predefined mass feature signatures as explained earlier, that is, no feature selection was performed. In the 10-fold cross-validations, within each fold, 90% of the data (extracted tumor features) served as training and 10% as testing. In each of the 10 training or testing folds, the classifier was trained by using the training data, which were then applied to the left-out test fold. Partitioning of the data set for cross-validation was performed "by lesion": All images (craniocaudal, mediolateral oblique, and corresponding water, lipid, and protein thickness images when applicable) pertaining to a given lesion were either all part of a training fold or all part of a testing fold to avoid training the classifier on some images of a given lesion and then testing it on different images of that same lesion.
Note that 10-fold cross-validation does not result in a single model (classifier weights), even when predefined feature signatures are used, but rather results in 10 models (one for each training fold). If models obtained from the different training folds are similar, one can derive a “final” model from these 10 models (Appendix E3 [online]) and the cross-validation is expected to give a realistic impression of the classification performance of the final model in an independent test setting (if larger data sets were available).
Performance was evaluated “by lesion,” and estimated image-based probabilities of malignancy for images (craniocaudal, mediolateral oblique views for mammography radiomics and corresponding water, lipid, and protein images for quantitative 3CB) of the same lesion were averaged.
Statistical Analysis
Classification performance was assessed for the radiologists’ diagnoses based on conventional diagnostic digital mammography as part of the regular clinical assessment and for all three proposed approaches: quantitative 3CB analysis alone, mammography radiomics alone, and combined radiomics plus quantitative 3CB analysis. The primary performance metric was positive predictive value of biopsy performed (PPV3) at maximum sensitivity. To attain maximum sensitivity, the “optimal” threshold for the decision variable (estimated probability of malignancy) was determined within the classifier training and testing cross-validation. For each training fold, the threshold value for the estimated probability of malignancy resulting in 100% sensitivity for that training fold was determined and subsequently applied to the corresponding “unseen” test fold. Note that this does not guarantee 100% sensitivity for the test folds. The corresponding PPV3 was then calculated per the BI-RADS manual (25) along with the adjunct performance metrics of obtained sensitivity, specificity, and negative predictive value.
Receiver operating characteristic analysis was used to assess overall classification performance for the task of differentiating between breast cancers and benign breast masses, and receiver operating characteristic curves, as well as areas under the receiver operating characteristic curves (AUCs), were estimated by using the proper binormal model (30) (available at metz-roc.uchicago.edu). Note that receiver operating characteristic analysis could not be performed for conventional diagnostic digital mammography because probabilities of malignancy were not routinely provided in the clinical work-up.
All statistical analyses were performed in Matlab (version R2018a; MathWorks, Natick, Mass). Bootstrapping (1000 bootstrap samples) was used to calculate 95% confidence intervals (CIs) of the performance metrics. The statistical significance of differences in performance was determined from the bootstrap samples through 95% CIs and the associated P values for these differences. The PPV3 of conventional diagnostic digital mammography and our analyses were compared in ascending order (three comparisons). AUCs were compared in a similar fashion (two comparisons). P values were corrected for multiple comparisons by using the Holm-Bonferroni method (31). A corrected P < .05 was considered to indicate a statistically significant difference in performance.
Results
Study Participants
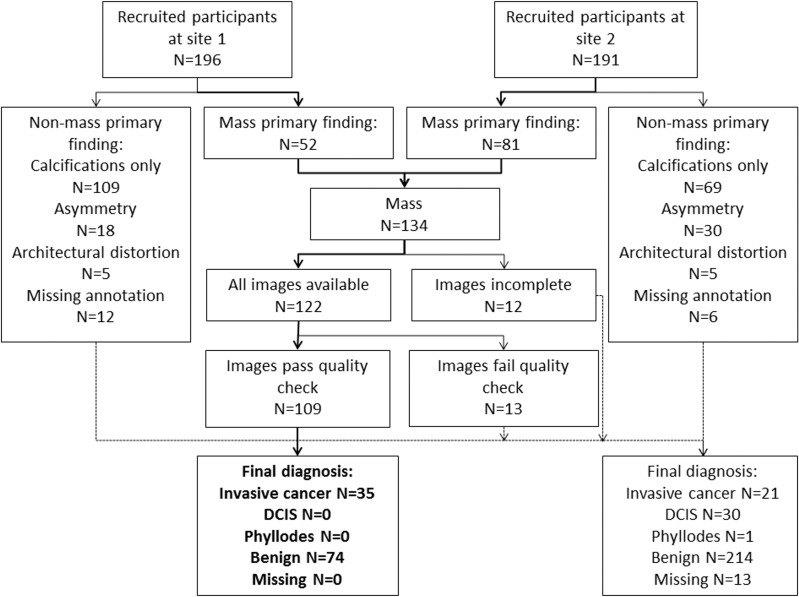
At the time of this analysis, 387 women with BI-RADS category 4 or 5 findings had enrolled in our 3CB imaging study. Only women with masses were included because the radiomics method used was developed for segmentation and classification of breast masses (27). A total of 122 women had a mass as the primary finding, and a total of 109 of these women (mean age, 51 years; age range, 31–85 years) had mammograms, 3CB images, radiologist delineations, and pathologic “truth” from biopsy (Table 1, Fig 2). In 11 women, microcalcifications were present as a secondary finding (six malignant and five benign findings), and these were included in our analysis. All malignant masses were invasive cancer (Table 2).
Table 1:
Description of the 109 Women with Breast Masses Imaged with the Three-Compartment Breast Protocol for Our Current Study
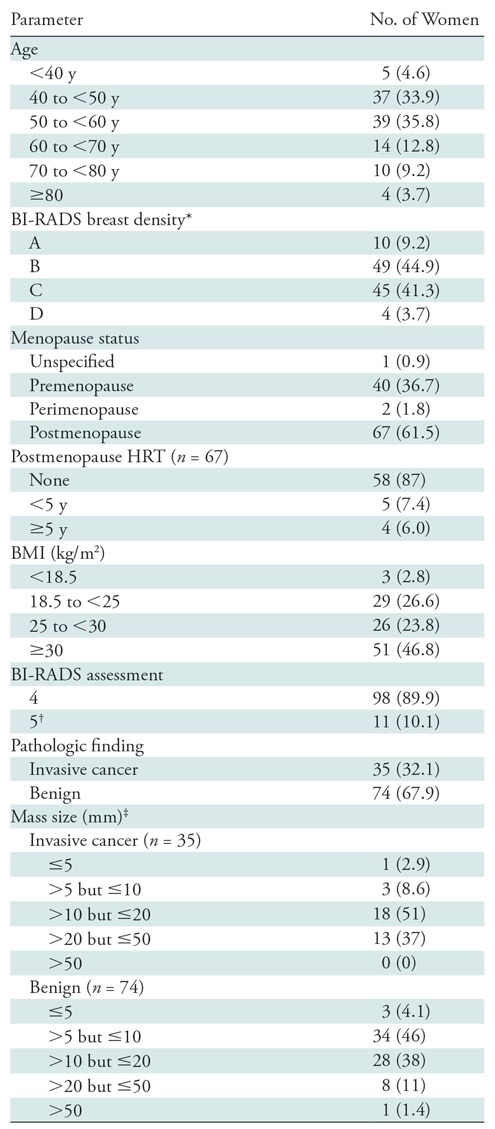
Note.—Numbers in parentheses are percentages. BI-RADS = Breast Imaging Reporting and Data System, BMI = body mass index, HRT = hormone replacement therapy.
*BI-RADS breast density is as follows: A = fatty, B = scattered fibroglandular tissue, C = heterogeneously dense, D = extremely dense.
†All BI-RADS category 5 masses were invasive cancers.
‡The maximum linear size was determined from radiologist-drawn lesion outlines; radiologist-drawn outlines were not used in the radiomics and quantitative three-compartment breast methods.
Figure 2:
Flowchart of study participant enrollment. DCIS = ductal carcinoma in situ; site 1 = University of California, San Francisco, San Francisco, Calif; site 2 = H. Lee Moffitt Cancer Center, Tampa, Fla.
Table 2:
Subtype and Hormone Receptor Status of Invasive Cancers
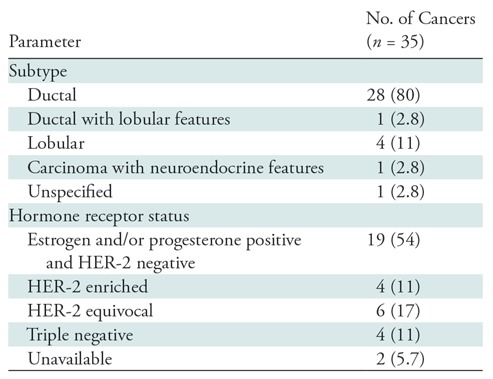
Note.—Numbers in parentheses are percentages. HER-2 = human epidermal growth factor receptor 2.
Performance Evaluation and Statistical Analysis
The derived classification models were stable, and quantitative 3CB analysis and mammography radiomics demonstrated an additive benefit in the estimation of the probabilities of malignancy (Appendix E4 [online]). The quantitative 3CB analysis demonstrated a higher PPV3, that is, it suggested nine fewer unnecessary benign biopsies (nine of 74) than conventional diagnostic digital mammography (P < .001) but also erroneously eliminated biopsy of one cancer (one of 35) (P < .001) (Table 2; Figs 3, 4).
Figure 3:
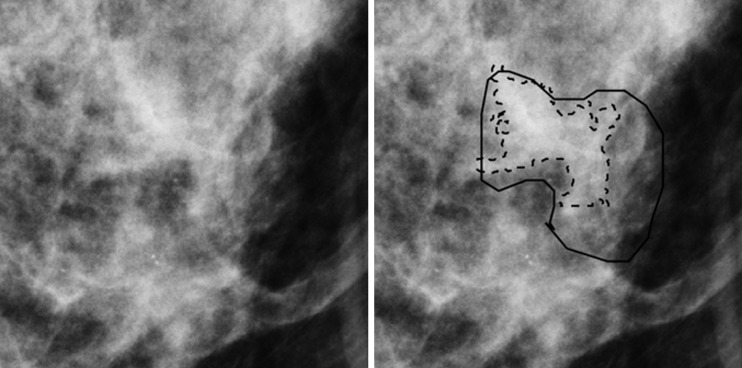
Region of interest from digital mammography depicts invasive cancer misclassified with mammography radiomics. Images in 50-year-old woman with invasive cancer (Breast Imaging Reporting and Data System category 4, with category C breast density) without (left) and with (right) radiologist and computer delineations (solid and dashed lines, respectively).
Figure 4:
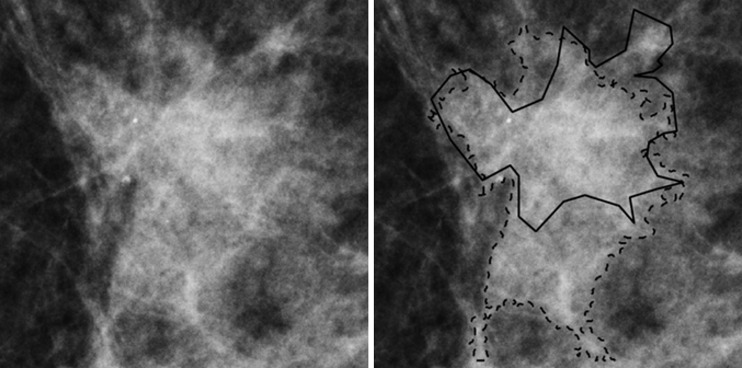
Region of interest from digital mammography depicts invasive cancer misclassified with quantitative three-compartment breast (3CB) analysis and combined mammography radiomics plus quantitative 3CB analysis. Images in 53-year-old woman with invasive cancer (Breast Imaging Reporting and Data System category 4, with category C breast density) without (left) and with (right) radiologist and computer delineations (solid and dashed lines, respectively).
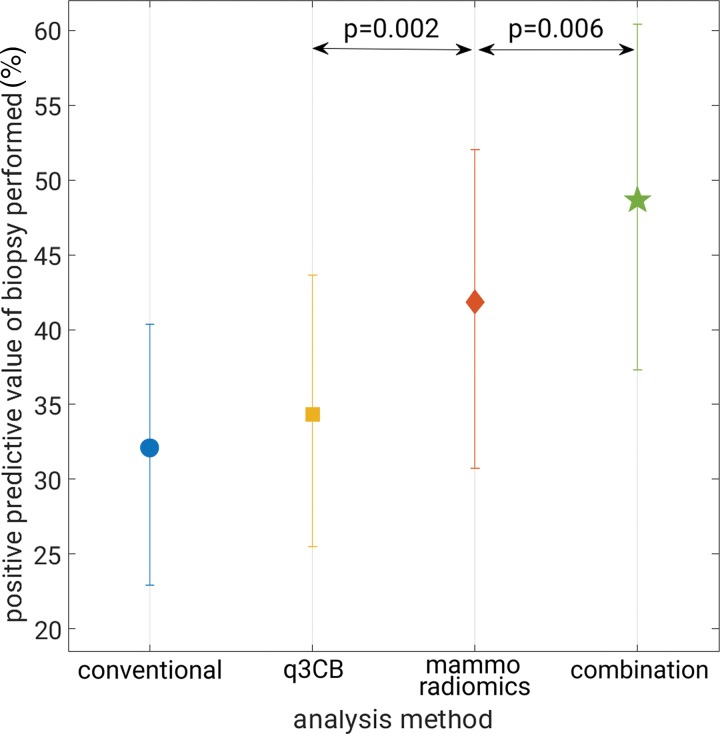
Both mammography radiomics and the combined approach avoided more benign biopsies (28 of 74 [P < .001] and 38 of 74 [P < .001] fewer benign biopsies than conventional diagnostic digital mammography, respectively), but also on average misclassified one cancer (one of 35) (P < .001) (Figs 3, 4). One invasive cancer was misclassified with mammography radiomics. A different cancer was misclassified with quantitative 3CB analysis and the combined analysis (Figs 3, 4). These misclassified cancers were both BI-RADS category 4. Overall, the combined approach suggested 35.8% (39 of 109) fewer total biopsies than did conventional diagnostic digital mammography, at the cost of a 2.9% (one of 35) reduction in sensitivity (P < .001). The improvements in PPV3 for mammography radiomics versus quantitative 3CB analysis (34 of 82 vs 34 of 99, respectively; P = .002) and the combined approach versus mammography radiomics (34 of 70 vs 34 of 82; P = .006) were statistically significant (Table 3, Fig 5).
Table 3:
Performance Metrics Corresponding to the Maximum Attained Sensitivity

Note.—Data are from 109 masses, 35 of which were invasive breast cancers. Numbers in parentheses are raw data, and numbers in brackets are 95% confidence intervals. NPV = negative predictive value, PPV3 = positive predictive value of biopsy performed, q3CB = quantitative three-compartment breast image analysis.
Figure 5:
Graph shows positive predictive value of biopsy performed at maximum attained sensitivity. Error bars represent 95% confidence intervals. combination = combined quantitative three-compartment breast (q3CB) analysis and mammography radiomics analysis, conventional = conventional diagnostic digital mammography, mammo = mammography.
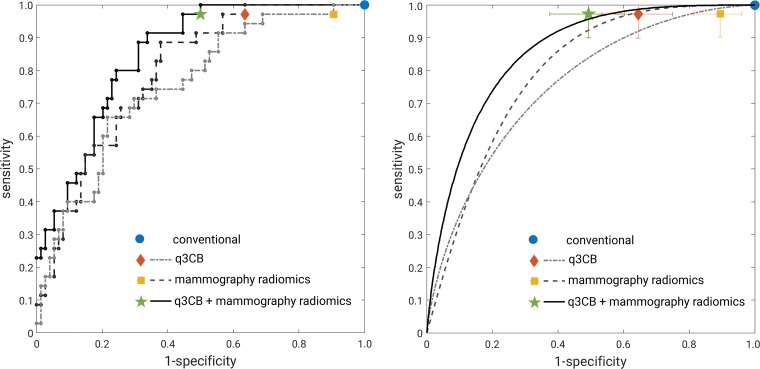
At receiver operating characteristic evaluation, the AUCs for the task of differentiating between malignant and benign masses were 0.76 (95% CI: 0.66, 0.85), 0.80 (95% CI: 0.72, 0.88), and 0.86 (95% CI: 0.78, 0.92), for quantitative 3CB analysis, mammography radiomics, and the combined approach, respectively (Fig 6). Although the improvement in AUC for mammography radiomics relative to quantitative 3CB failed to reach statistical significance (P = .55), the combined analysis outperformed mammography radiomics at a statistically significant level (P = .04).
Figure 6:
Receiver operating characteristic analysis. Left, “raw staircase” receiver operating characteristic curves with operating points (no error bars for clarity) and, right, receiver operating characteristic curves fitted with the proper binormal model (30) with operating points. Error bars represent 95% confidence intervals. q3CB = quantitative three-compartment breast analysis.
Discussion
In the classification for malignancy of mammographic BI-RADS category 4 and 5 breast masses, we obtained, with use of in-house–developed mammography radiomics and quantitative 3CB methods, a PPV3 of 49% (34 of 70) and an AUC of 0.86 (95% CI: 0.78, 0.92) for the combined mammography radiomics plus quantitative 3CB analysis. Our study demonstrated synergy between mammography radiomics and quantitative 3CB analyses, with P values corrected for multiple comparisons of less than .05 when comparing the PPV3 for the combined approach to that for mammography radiomics and to conventional diagnostic digital mammography. This suggests that the water-lipid-protein breast tissue composition measured with 3CB imaging yielded biomarkers that cannot be gleaned from traditional mammographic techniques. One should note that both mammography radiomics and quantitative 3CB analysis can be performed in real time.
Because 3CB imaging to date has been used only in the diagnostic rather than screening setting, all breast masses included in our study were BI-RADS category 4 or 5 findings, that is, they all underwent biopsy. Both mammography radiomics and combined radiomics plus quantitative 3CB analyses would have resulted in substantially higher PPV3 values than the actual value for this data set, albeit at the cost of, on average, missing one of the 35 cancers. This loss in sensitivity resulted from the determination of the threshold value for the estimated probability of malignancy within each training fold of the classifier training and testing protocol (and applying the threshold obtained for a given training fold to the corresponding unseen test fold). In contrast, a posteriori selection of a single threshold value for the entire set would have given the illusion of operating at no loss in sensitivity (100% sensitivity) but would have been incorrect because then one would effectively have used the pathologic truth for the entire data set twice: first to determine the optimal threshold resulting in 100% sensitivity and then to calculate PPV3 at that threshold. The sensitivity of the combined approach of 97% (95% CI: 90.3%, 100%) at a specificity of 51% (95% CI: 39.9%, 60.1%) in our diagnostic study was comparable to the 98% sensitivity observed in a breast cancer radiomics study (11) and does not seem unreasonable compared with results reported in a large retrospective reading study in which 26 radiologists assessing screening mammograms obtained a sensitivity of 89% (95% CI: 86%, 92%) at 51% specificity in the detection and diagnosis of mammographic breast masses in 7000 cases with 1137 cancers (32).
Our study had some limitations. First, we used in-house–developed methods both for 3CB image acquisition and mammography radiomics. Even though these methods have been described in previous publications (24,26–28), this may hamper reproduction of our results. Second, our data set size is modest despite being accumulated over 4 years of active participant recruitment. Moreover, even though this study served as a validation of predetermined mass feature signatures, the data set was not used as a true independent test set. The latter was not possible given that the mammography radiomics signature was defined by using mammograms obtained with different equipment (27), hence requiring recalibration of the classifier because mammography radiomics generally depends on the imaging equipment and protocols used during acquisition. Moreover, even though 3CB imaging yields quantitative and reproducible breast composition maps, the pilot study data set for the quantitative 3CB analysis was too small to serve as a training set (28). Conversely, we conducted our analyses taking utmost care to minimize the risk of overfitting. The performances obtained by using predefined mass feature signatures were similar to those observed in the published pilot study (28) in which leave-one-case-out analyses yielded AUCs of 0.72 (standard error, 0.07) for quantitative 3CB analysis, 0.81 (standard error, 0.07) for mammography radiomics, and 0.86 (standard error, 0.04) for a merged approach. Note that while our current quantitative 3CB mass signature did not contain any features pertaining to protein content, these features may be important for classification of other lesion types or for classification of cancer subtypes.
Future work will expand the analysis to include all suspicious lesions being considered for biopsy rather than only the subset of mammographic masses and will include a multireader, multicase radiologist reading study focusing on whether mammography radiomics and quantitative 3CB analysis have potential to reduce unnecessary benign biopsies and improve specificity. It should be noted that while quantitative 3CB analysis on its own did not perform as well as mammography radiomics, 3CB imaging provides both mammograms and 3CB composition maps. Because 3CB imaging can be performed with conventional mammography or breast tomosynthesis equipment with minimal changes in workflow and minor modifications, and with only a 10% higher dose (24), the potential exists for wide application of 3CB imaging in diagnostic breast imaging and perhaps also in screening. Our study showed that more investigation into the application of 3CB imaging is warranted, and we have initiated a research study incorporating 3CB imaging into breast tomosynthesis.
APPENDIX
SUPPLEMENTAL FIGURES
Acknowledgments
Acknowledgments
The authors thank Shane Spencer, BS, and Thomas Wolfgruber, PhD, for their help collecting patient demographics.
Supported by the National Institutes of Health (R01 CA166945 and UO1 CA195564) and the California Breast Cancer Research Program (18IB-0042).
Current address: Department of Women’s Imaging, St. Joseph’s Women’s Hospital, Tampa, Fla
Current address: University of Hawaii Cancer Center, University of Hawaii at Manoa, Honolulu, Hawaii
Disclosures of Conflicts of Interest: K.D. Activities related to the present article: disclosed no relevant relationships. Activities not related to the present article: receives royalties from Hologic. Other relationships: disclosed no relevant relationships. M.L.G. Activities related to the present article: disclosed no relevant relationships. Activities not related to the present article: is a stockholder in R2/Hologic; is a co-founder and equity holder in Quantitative Insights; receives royalties from Hologic, GE Medical Systems, MEDIAN Technologies, Riverain Medical, Mitsubishi, and Toshiba; has stock/stock options; receives money for patents issued and licensed; institution is a licensee on a patent. Other relationships: disclosed no relevant relationships. B.N.J. disclosed no relevant relationships. K.K. disclosed no relevant relationships. H.G. disclosed no relevant relationships. J.S.D. disclosed no relevant relationships. B.N. disclosed no relevant relationships. B.F. disclosed no relevant relationships. S.M. disclosed no relevant relationships. J.A. disclosed no relevant relationships. L.K. disclosed no relevant relationships. J.S. disclosed no relevant relationships.
Abbreviations:
- AUC
- area under the receiver operating characteristic curve
- CI
- confidence interval
- PPV3
- positive predictive value of biopsy performed
- 3CB
- three-compartment breast
References
- 1.Kerlikowske K, Zhu W, Hubbard RA, et al. Outcomes of screening mammography by frequency, breast density, and postmenopausal hormone therapy. JAMA Intern Med 2013;173(9):807–816. [DOI] [PMC free article] [PubMed] [Google Scholar]
- 2.Kerlikowske K, Hubbard R, Tosteson AN. Higher mammography screening costs without appreciable clinical benefit: the case of digital mammography. J Natl Cancer Inst 2014;106(8):dju191. [DOI] [PubMed] [Google Scholar]
- 3.Hubbard RA, Kerlikowske K, Flowers CI, Yankaskas BC, Zhu W, Miglioretti DL. Cumulative probability of false-positive recall or biopsy recommendation after 10 years of screening mammography: a cohort study. Ann Intern Med 2011;155(8):481–492. [DOI] [PMC free article] [PubMed] [Google Scholar]
- 4.Ong MS, Mandl KD. National expenditure for false-positive mammograms and breast cancer overdiagnoses estimated at $4 billion a year. Health Aff (Millwood) 2015;34(4):576–583. [DOI] [PubMed] [Google Scholar]
- 5.Winch CJ, Sherman KA, Boyages J. Toward the breast screening balance sheet: cumulative risk of false positives for annual versus biennial mammograms commencing at age 40 or 50. Breast Cancer Res Treat 2015;149(1):211–221. [DOI] [PubMed] [Google Scholar]
- 6.Stout NK, Lee SJ, Schechter CB, et al. Benefits, harms, and costs for breast cancer screening after US implementation of digital mammography. J Natl Cancer Inst 2014;106(6):dju092. [DOI] [PMC free article] [PubMed] [Google Scholar]
- 7.Huo Z, Giger ML, Vyborny CJ, Metz CE. Breast cancer: effectiveness of computer-aided diagnosis observer study with independent database of mammograms. Radiology 2002;224(2):560–568. [DOI] [PubMed] [Google Scholar]
- 8.Gillies RJ, Kinahan PE, Hricak H. Radiomics: images are more than pictures, they are data. Radiology 2016;278(2):563–577. [DOI] [PMC free article] [PubMed] [Google Scholar]
- 9.Valdora F, Houssami N, Rossi F, Calabrese M, Tagliafico AS. Rapid review: radiomics and breast cancer. Breast Cancer Res Treat 2018;169(2):217–229. [DOI] [PubMed] [Google Scholar]
- 10.Weaver O, Leung JWT. Biomarkers and imaging of breast cancer. AJR Am J Roentgenol 2018;210(2):271–278. [DOI] [PubMed] [Google Scholar]
- 11.Bickelhaupt S, Paech D, Kickingereder P, et al. Prediction of malignancy by a radiomic signature from contrast agent-free diffusion MRI in suspicious breast lesions found on screening mammography. J Magn Reson Imaging 2017;46(2):604–616. [DOI] [PubMed] [Google Scholar]
- 12.Mendel KR, Li H, Lan L, et al. Quantitative texture analysis: robustness of radiomics across two digital mammography manufacturers’ systems. J Med Imaging (Bellingham) 2018;5(1):011002. [DOI] [PMC free article] [PubMed] [Google Scholar]
- 13.Li H, Zhu Y, Burnside ES, et al. MR imaging radiomics signatures for predicting the risk of breast cancer recurrence as given by research versions of MammaPrint, Oncotype DX, and PAM50 gene assays. Radiology 2016;281(2):382–391. [DOI] [PMC free article] [PubMed] [Google Scholar]
- 14.Li H, Zhu Y, Burnside ES, et al. Quantitative MRI radiomics in the prediction of molecular classifications of breast cancer subtypes in the TCGA/TCIA data set. NPJ Breast Cancer 2016;2(1):16012. [DOI] [PMC free article] [PubMed] [Google Scholar]
- 15.Tan T, Platel B, Twellmann T, et al. Evaluation of the effect of computer-aided classification of benign and malignant lesions on reader performance in automated three-dimensional breast ultrasound. Acad Radiol 2013;20(11):1381–1388. [DOI] [PubMed] [Google Scholar]
- 16.Shimauchi A, Giger ML, Bhooshan N, et al. Evaluation of clinical breast MR imaging performed with prototype computer-aided diagnosis breast MR imaging workstation: reader study. Radiology 2011;258(3):696–704. [DOI] [PubMed] [Google Scholar]
- 17.Weind KL, Maier CF, Rutt BK, Moussa M. Invasive carcinomas and fibroadenomas of the breast: comparison of microvessel distributions—implications for imaging modalities. Radiology 1998;208(2):477–483. [DOI] [PubMed] [Google Scholar]
- 18.Cerussi A, Shah N, Hsiang D, Durkin A, Butler J, Tromberg BJ. In vivo absorption, scattering, and physiologic properties of 58 malignant breast tumors determined by broadband diffuse optical spectroscopy. J Biomed Opt 2006;11(4):044005. [DOI] [PubMed] [Google Scholar]
- 19.Le Doussal V, Tubiana-Hulin M, Friedman S, Hacene K, Spyratos F, Brunet M. Prognostic value of histologic grade nuclear components of Scarff-Bloom-Richardson (SBR): an improved score modification based on a multivariate analysis of 1262 invasive ductal breast carcinomas. Cancer 1989;64(9):1914–1921. [DOI] [PubMed] [Google Scholar]
- 20.Covington MF, Pizzitola VJ, Lorans R, et al. The future of contrast-enhanced mammography. AJR Am J Roentgenol 2018;210(2):292–300. [DOI] [PubMed] [Google Scholar]
- 21.Diekmann F, Freyer M, Diekmann S, et al. Evaluation of contrast-enhanced digital mammography. Eur J Radiol 2011;78(1):112–121. [DOI] [PubMed] [Google Scholar]
- 22.Chou CP, Lewin J, Pan HB. Contrast-enhanced tomosynthesis: the best of both worlds or more of the same? Eur J Radiol 2016;85(2):509. [DOI] [PubMed] [Google Scholar]
- 23.Samei E, Saunders RS. Dual-energy contrast-enhanced breast tomosynthesis: optimization of beam quality for dose and image quality. Phys Med Biol 2011;56(19):6359–6378. [DOI] [PMC free article] [PubMed] [Google Scholar]
- 24.Laidevant AD, Malkov S, Flowers CI, Kerlikowske K, Shepherd JA. Compositional breast imaging using a dual-energy mammography protocol. Med Phys 2010;37(1):164–174. [DOI] [PMC free article] [PubMed] [Google Scholar]
- 25.Sickles EA, D’Orsi CJ, Bassett LW. ACR BI-RADS mammography. In: ACR BI-RADS Atlas, Breast Imaging Reporting and Data System. 5th ed. Reston, Va: American College of Radiology, 2013. [Google Scholar]
- 26.Yuan Y, Giger ML, Li H, Suzuki K, Sennett C. A dual-stage method for lesion segmentation on digital mammograms. Med Phys 2007;34(11):4180–4193. [DOI] [PubMed] [Google Scholar]
- 27.Yuan Y, Giger ML, Li H, Bhooshan N, Sennett CA. Multimodality computer-aided breast cancer diagnosis with FFDM and DCE-MRI. Acad Radiol 2010;17(9):1158–1167. [DOI] [PMC free article] [PubMed] [Google Scholar]
- 28.Drukker K, Duewer F, Giger ML, et al. Mammographic quantitative image analysis and biologic image composition for breast lesion characterization and classification. Med Phys 2014;41(3):031915. [DOI] [PMC free article] [PubMed] [Google Scholar]
- 29.Glantz SA. Primer of biostatistics. 5th ed. New York, NY: McGraw-Hill, Medical Publishing Division, 2002. [Google Scholar]
- 30.Pesce LL, Metz CE. Reliable and computationally efficient maximum-likelihood estimation of “proper” binormal ROC curves. Acad Radiol 2007;14(7):814–829. [DOI] [PMC free article] [PubMed] [Google Scholar]
- 31.Holm S. A simple sequentially rejective multiple test procedure. Scand J Stat 1979;6(2):65–70. [Google Scholar]
- 32.Gilbert FJ, Tucker L, Gillan MG, et al. Accuracy of digital breast tomosynthesis for depicting breast cancer subgroups in a UK retrospective reading study (TOMMY Trial). Radiology 2015;277(3):697–706. [DOI] [PubMed] [Google Scholar]
Associated Data
This section collects any data citations, data availability statements, or supplementary materials included in this article.


