Abstract
Biomaterial properties that modulate T cell activation, growth, and differentiation are of significant interest in the field of cellular immunotherapy manufacturing. In this work, we present a new platform technology that allows for the modulation of various activation particle design parameters important for polyclonal T cell activation. We successfully create artificial antigen presenting cells (aAPCs) using supported lipid bilayers on various cell-templated silica microparticles with defined membrane fluidity and stimulating antibody density. We use this panel of aAPCs to probe the importance of activation particle shape, size, membrane fluidity, and stimulation antibody density on T cell outgrowth and differentiation. All aAPC formulations were able to stimulate T cell growth, and preferentially promoted CD8+ T cell growth over CD4+ T cell growth when compared to commercially available pendant antibody-conjugated particles. T cells cultured with HeLa and red blood cell templated aAPCs had a less differentiated and less exhausted phenotype than those cultured with spherical aAPCs with matched membrane coatings when cultured for 14 days. These results support continued exploration of silica supported lipid bilayers as an artificial antigen presenting cell platform.
Keywords: T cells, activation, artificial antigen presenting cells, supported lipid bilayers
Graphical Abstract
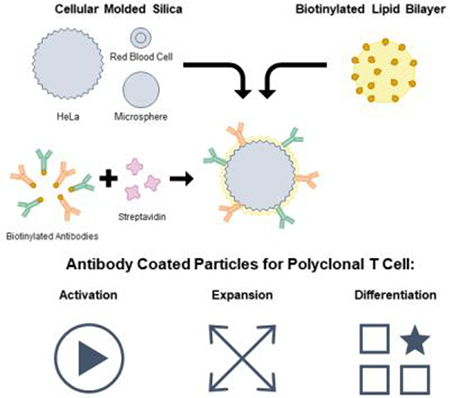
Silica microparticles templated from monodisperse human cells were used to create supported lipid bilayers displaying T cell activating antibodies with varying size, shape, membrane fluidity, and antibody loading density. These particles promote polyclonal human T cell expansion and demonstrate that antibody density and particle shape impact T cell differentiation during expansion.
1. Introduction
In the native immune system, T cells are activated by antigen presenting cells (APCs) to elicit an adaptive immune response towards an antigen. This process requires multiple binding events, and mechanotransduction through the TCR to trigger T cell activation.[1] Synthetic ex vivo platforms for activation of T cells have been widely studied and developed both for basic biology understanding of T cell activation, as well as for clinical use in expanding patient T cells for various cellular therapies.[2–7] Typically, signals 1 and 2 (TCR & costimulatory receptor binding) are delivered on a solid substrate called an artificial APC (aAPC) with signal 3 provided by soluble cytokines either encapsulated in the aAPC or added to the culture medium. More recently, mesopourous silica scaffolds have been loaded with cytokines and coated with lipid membranes to result in paracrine cytokine release from the activating substrate.[7]
When activated in vivo, T cells form a micro-scale interaction structure with APCs called the immune synapse.[8] Quiescent TCRs reside in 15–30 nm nano-clusters, but begin to form larger clusters upon activation that reach a micron in diameter.[9] Not surprisingly, studies have shown that signaling molecules attached to planar lipid membranes with high fluidity activate T cells better than membranes with low fluidity due to the improved ability to facilitate receptor clustering.[10]
Size, shape, rigidity, and antigen density of the scaffold have independently been shown to impact T cell activation.[11–14] Particles with a higher aspect ratio, larger diameter, and made with softer material have all been shown to improve T cell activation and proliferation.[5,15,16] However, the relative importance of these different aAPC design parameters has not been evaluated in a comprehensive platform. This is of special interest in the context of the manufacturing of chimeric antigen receptor (CAR) T cell therapies, as T cell growth, differentiation, and function are all important parameters to control for successful in vivo anti-tumor efficacy.[17]
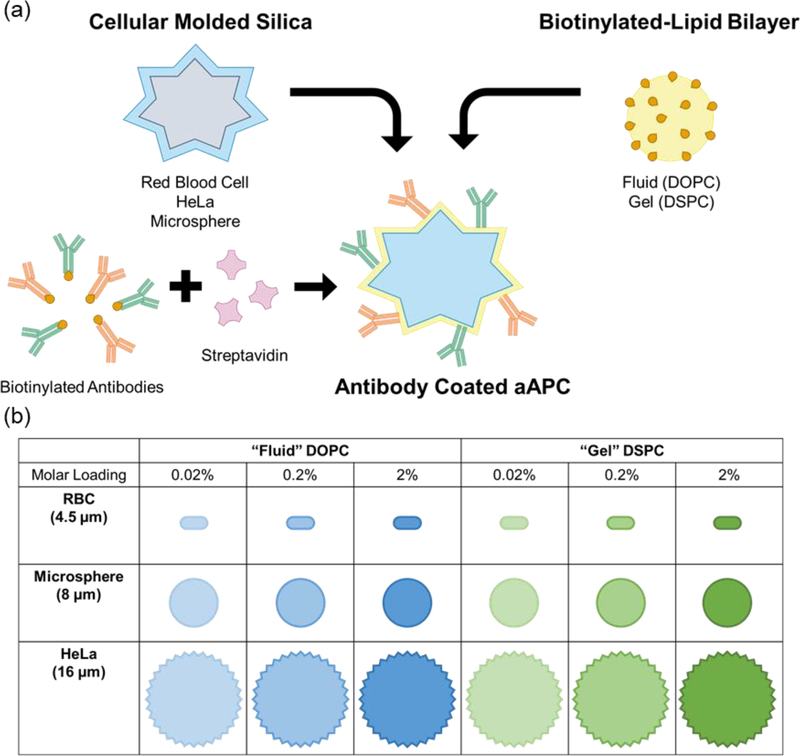
Supported lipid bilayers on cell-templated silica scaffolds is a flexible platform that allows individual control of many of these parameters including particle size & shape, membrane fluidity, and antigen density (Figure 1). Particle size and shape can be controlled by templating silica microparticles off of various cell suspensions that faithfully capture cell size, surface roughness, and morphology.[18,19] Membrane fluidity can be controlled by using lipids with transition temperatures (Tm) above and below physiological temperature (37 °C) in the composition of the supported lipid bilayer.[20,21]
Figure 1.
Platform technology for cell-templated supported lipid bilayer activation particles. (a) Schematic of aAPC synthesis and design parameters. (b) 18 particle formulations used in T cell outgrowth and differentiation studies.
In this work, we develop an artificial antigen presenting cell (aAPC) T cell activation platform to evaluate the influence of particle shape and size, membrane fluidity, and antigen density on T cell outgrowth, and differentiation (Figure 1 a). We successfully assemble and characterize a panel of 18 aAPCs (Figure 1 b) and demonstrate their ability to induce polyclonal T cell proliferation. We then use this panel of particles to probe other important parameters for T cell manufacturing: ratio of CD4+ vs CD8+ T cell growth, and T cell differentiation state.
2. Results and Discussion
2.1. Cell-templated supported lipid bilayer platform for T cell activation
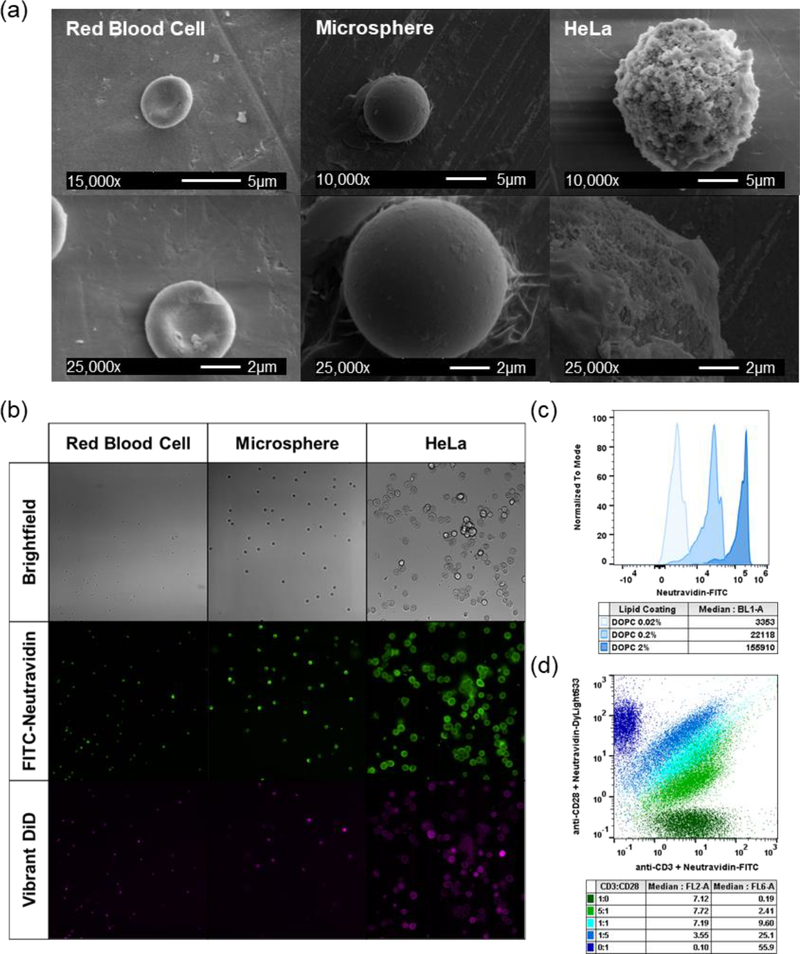
We formulated aAPCs with varying physical properties (size, shape, and surface roughness), membrane fluidity, and anti-CD3/anti-CD28 densities using silica microparticles coated with a lipid bilayer following methods developed previously by Brinker and coworkers.[20,22] Roughness and shape variations were attained using silica microparticles templated from HeLa cells or human red blood cells. These microparticles were successfully synthesized using dilute silicic acid solutions and retained the expected cell morphology and size after calcination to remove the biological template (Figure 2 a). Commercially available smooth spherical silica microspheres were also used; in total we formulated particles that cover a range of sizes (average diameter from 4.5 to 16 μm), sphericities (red blood cells ≈ 0.63 to microspheres ≈ 1), and surface textures.[23] Biotinylated lipid bilayers were fused on to the particle surfaces from small unilamellar vesicles (SUVs) (Table S2), a method previously reported to create supported lipid bilayers on solid and mesoporous silica microspheres.[24,25]
Figure 2.
Activation particle characterization. (a) Scanning electron microscope (SEM) images of red blood cell, microsphere, and HeLa silica microparticles. (b) Fluorescent and brightfield microscope images of activation particles at 20× magnification. (c) Biotin loading on activation particles quantified by FITC-neutravidin and flow cytometry. (d) Ratiometric loading of anti-CD3ε and anti-CD28 antibodies with fluorescently labeled neutravidin and flow cytometry.
We formulated lipid bilayers with two different lipid compositions and three different biotin loading ratios (0.02, 0.2, and 2% molar loading) to control membrane fluidity and antigen density (Table S1). The lipid DOPC has a melting temperature below 37 °C (Tm= −17 °C) and is in a fluid-like state at physiological temperatures, whereas DSPC has a melting temperature above 37 °C (Tm= 55 °C) and is in a gel-like state at physiological temperatures. Previous studies have demonstrated that more fluid lipid membranes exhibit improved ligand clustering capabilities, important for early immune synapse formation.[10,26] Fluorescent microscopy images of lipid-fused microparticles stained with neutravidin-FITC and Vibrant DiD membrane dye show that all three particle shapes were successfully coated with lipids and biotin is well-dispersed throughout the particle surface (Figure 2 b). Quantitative flow cytometry experiments confirm that the molar loading of biotin into the SUVs correlates to fluorescent intensity of neutravidin-FITC labeling, and that two different antibodies can be loaded at defined stoichiometric ratios (Figure 2 c & d). Biotinylated human anti-CD3 and anti-CD28 antibodies were loaded on to particles using biotin-avidin chemistry for polyclonal T cell activation.
We performed an initial proof-of-concept study using microsphere supported lipid bilayers to confirm that these particles could activate primary human T cells. Cells were co-cultured with particles for 72-hours and assessed for cytokine production and expression of the activation marker 4–1BB (Figure S4). Uncoated microspheres and lipid-coated microspheres with no activating antibody did not elicit T cell activation or cytokine production, suggesting that the activating antibodies are the only stimulation cues in the platform. All particle formulations induced a Th1 response in T cells as expected from polyclonal T cell expansion, characterized by the expression of IFN-γ, IL-2, and TNF-α.[27] An antibody dose-dependence was observed for both 4–1BB expression and cytokine production, which was more pronounced in the DSPC lipid coated particles than the DOPC coated particles. Previous single-cell reports have found that lower membrane fluidity slows down initial T cell receptor clustering kinetics, which may contribute to these population-wide activation results.[10] Commercially available Human T-Activator CD3/CD28 bead (Dynabead) activated T cells had the highest 4–1BB expression and cytokine production, suggesting a rapid and robust activation. To investigate if these differences in early activation translate to differences in longer-term T cell expansion and in vitro differentiation, we performed 14-day outgrowth studies using all 18 aAPC formulations.
2.2. High antibody loading on fluid lipid bilayers promotes T cell expansion
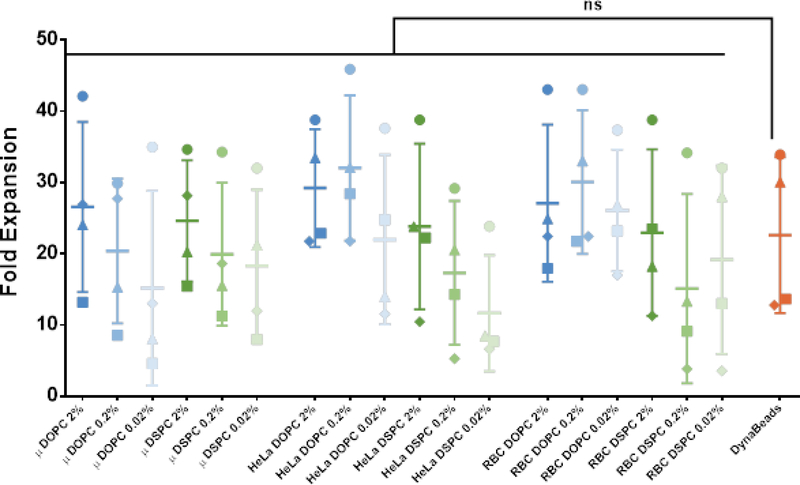
All 18 aAPC formulations were tested in a 14-day polyclonal outgrowth study of healthy donor primary human T cells seeded at a 1:1 CD4+:CD8+ ratio. Due in part to the large donor-to-donor variability (p<0.0001 for donor-to-donor residual variation), there was no significant difference in fold expansion over 14 days between the individual aAPC treatment groups and DynaBead activated T cells (Figure 3). We then analyzed the isolated effects of antibody loading density, membrane fluidity, and particle shape on fold expansion. There was a significant increase in fold expansion with increasing antibody loading density (p<0.0001, repeated measures one-way ANOVA with post-test for linear trend) and increasing membrane fluidity (p<0.0001, paired t-test), however there was not a significant impact of particle shape on T cell expansion (p=0.34, repeated measures one-way ANOVA). These results suggest that both antibody density and membrane fluidity are important design parameters that modulate polyclonal T cell expansion.
Figure 3.
14-day T cell outgrowth. Fold expansion of T cells co-cultured with panel of aAPCs for 14 days. Data represented as mean ± SD (n = 4 biological replicates; paired one-way ANOVA with Dunnett’s multiple comparisons test, ns = not significant, P = 0.0648).
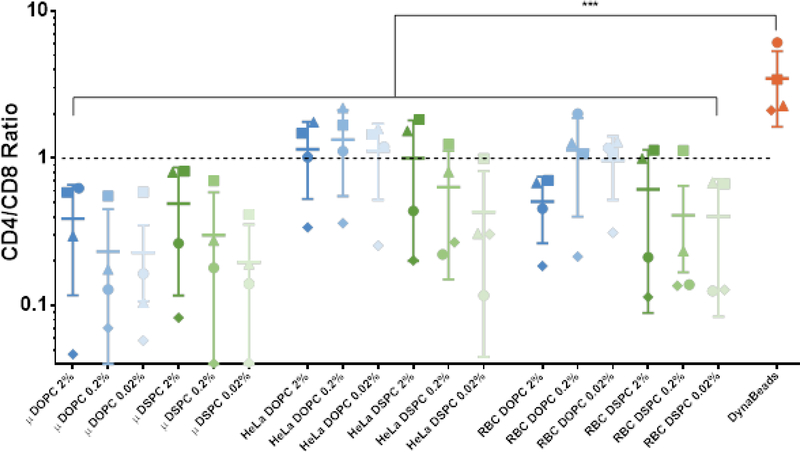
The outgrowth of CD4+ versus CD8+ T cells was monitored by flow cytometry staining on days 9 and 14 of T cell culture. On day 9, the 0.02% molar antibody loaded DSPC coated HeLa and red blood cell particle activated T cells had significantly reduced CD4+ to CD8+ ratio compared to DynaBeads control (Figure S5). By day 14, all the lipid-coated particle treatment groups had a reduced CD4+ to CD8+ ratio compared to DynaBeads control, and many promoted equal growth of CD4+ and CD8+ T cells (Figure 4). Similarly to T cell outgrowth, we also analyzed the isolated effects of antibody loading density, membrane fluidity, and particle shape on fold expansion. Antibody density did not statistically impact CD4+ to CD8+ T cell ratio during outgrowth. The DOPC lipid coated particles promoted a more equal expansion of CD4+ and CD8+ T cells (p=0.0035, paired t-test), as did the non-spherical HeLa (p<0.0001) and red blood cell (p<0.01) templated particles. Analyzing the 14-day fold-expansion and CD4+ to CD8+ ratio together, we found that all particle groups did promote expansion of both CD4+ and CD8+ T cells, with the exception of one donor that had a 10–20% contraction of CD4+ T cells in three treatment groups (microsphere DSPC 0.02% loading, red blood cell DSPC 0.2%, and red blood cell DSPC 0.02%).
Figure 4.
Ratio of CD4+ to CD8+ T cells after 14-day outgrowth. Data represented as mean ± SD (n = 4 biological replicates; paired one-way ANOVA with Dunnett’s multiple comparisons test, *** P < 0.001).
The ability to control the outgrowth of specific subsets of T cells is of interest in CAR T cell manufacturing. Previous studies have shown that CAR T cell products of defined CD4+:CD8+ T cell ratios have better in vivo anti-tumor function.[28] Currently, CD4+ and CD8+ T cells must be expanded separately and then combined in a 1:1 ratio prior to infusion, doubling the amount of consumables and machinery required for manufacturing.[29] An activation platform that could maintain a nearly 1:1 ratio while culturing CD4+ and CD8+ T cells together could generate a large cost savings to CAR T cell manufacturing without compromising product quality and predictability. HeLa and red blood cell templated particles fused with 0.2% and 0.02% molar antibody loaded DOPC membranes show the most consistent equal expansion of CD4+ and CD8+ T cells. While the aAPC parameters that control CD4+:CD8+ are not fully understood, these results are consistent with similar supported lipid bilayer systems that promoted CD8+ T cell expansion at lower antibody loading densities.[7] This may be because more CD4+ T cells express CD28 and are preferentially expanded by aAPCs with a higher density of CD28 on the surface.[30] Additional studies with patient-derived T cells would be required to confirm that these specific aAPCs promote equal CD4+ and CD8+ outgrowth even from patient samples, which often have a very different T cell population than healthy subjects.[28]
2.3. Fluid lipid membranes on non-spherical support reduces T cell differentiation in culture
In addition to CD4+:CD8+ T cell ratio, T cell differentiation and exhaustion are important parameters that impact in vivo anti-tumor function. Animal studies using CAR T cells generated from different T cell subsets show that naïve (CD45RA+/CD62L+) and central memory (CD45RA−/CD62L+) T cells have better in vivo efficacy than CAR T cells generated from effector memory (CD45RA−/CD62L−) T cells.[28] While PD-1 is often used as an indicator of T cell exhaustion and inhibit T cell-mediated tumor killing, it is also an early and sustained marker of T cell activation during polyclonal T cell expansion.[31–33] We included CCR7 in the staining panel but chose to focus on CD45RA and CD62L for statistical analysis due to prior work in CAR T cell differentiation that focused on these markers (Figure S9 & S10).
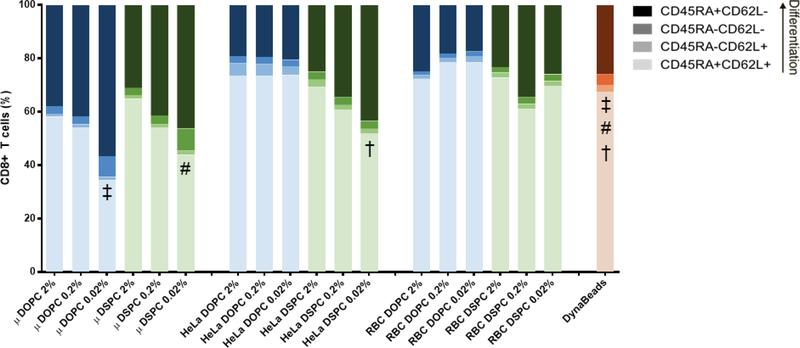
We were interested to see if any of our aAPC design parameters promoted a larger population of less-differentiated, activated, cells at the end of polyclonal expansion. To test this, we stained T cells from the outgrowth studies with antibodies for surface markers of T cell differentiation and activation after 12 days of polyclonal expansion. There were no statistical differences in the percent of least-differentiated (CD45RA+/CD62L+) CD4+ T cells between the individual aAPC treatment groups and DynaBead activated T cells (Figure S6). None of the aAPC treatments resulted in a larger population of less differentiated CD8+ T cells compared to DynaBeads, but three aAPC formulations promoted a more differentiated phenotype compared to Dynabeads (Figure 5). There was also no statistical difference in PD-1 expression, a marker of activation in T cell expansion cultures, between the aAPC treatment groups and DynaBeads for either CD4+ or CD8+ T cells (Figure S7 & Figure S8).
Figure 5.
Differentiation state of CD8+ T cells after 12-day outgrowth. Data represented as mean, SD omitted for legibility (n = 3 biological replicates; two-way repeated measures ANOVA with Bonferroni’s multiple comparisons test). Matching symbols indicate statistical significance between least-differentiated subpopulations of treatments compared to DynaBeads: ‡ = μSpheres DOPC 0.02% vs. DynaBeads (P < 0.0001); # = μSpheres DSPC 0.02% vs. DynaBeads (P < 0.0001); † = HeLa DSPC 0.02% vs. DynaBeads (P < 0.05).
Within the various aAPC designs, multiple design parameters emerged as important for T cell differentiation and activation. For both CD4+ and CD8+ T cells, higher antibody density resulted in a larger less-differentiated population (p<0.01, paired one-way ANOVA). Non-spherical particles also increased the size of the less-differentiated T cell population, with red blood cell and HeLa templated particles resulting in a larger population than microsphere templated particle groups. A significant difference in differentiation state between lipid coatings (DOPC vs. DSPC) was only observed for CD8+ T cells, with the DSPC coated particles promoting a larger less-differentiated population than the DOPC counterparts (p=0.037, paired t-test). PD-1 expression was increased on CD4+ T cells cultured with spherical aAPCs (p<0.0001, paired one-way ANOVA), and was increased on CD8+ T cells cultured with DSPC coated aAPCs (p<0.01). The statistical significance of each aAPC design parameter to each T cell assay output is summarized in Table S6.
Taken altogether, these proof of principle results indicate that higher antibody loading density, more fluid lipid membrane, and non-spherical particle supports promote even and robust polyclonal T cell outgrowth while minimizing T cell differentiation. These results are in agreement with previous work on aAPC design parameters and T cell synapse formation and polyclonal T cell expansion.[5,10]
3. Conclusion
Understanding how biomaterial design parameters translate to functional performance is important for the design of next-generation artificial antigen presenting cells for T cell therapy manufacturing. Specifically, in the field of CAR T cell therapies, there is interest in aAPCs that promote polyclonal expansion of T cells while maintaining a less-differentiated phenotype.
In this work, we develop a platform technology for evaluating aAPC design parameters. We successfully synthesized a library of 18 aAPC membrane-coated particles that vary in particle shape and size, membrane fluidity, and activating antibody density. These particles can induce polyclonal T cell activation and proliferation, and promote CD8+ T cell outgrowth compared to commercially available DynaBeads. Many of the aAPC particles with more fluid membranes (DOPC) on non-spherical supports (HeLa or red blood cell particle) promoted equal expansion of CD4+ and CD8+ T cells while maintaining a less-differentiated T cell phenotype.
This platform technology allowed us to make some general observations about aAPC design parameters and how they contribute to T cell growth and differentiation. From a 14-day outgrowth study we observed that increased activating antibody density and membrane fluidity are more important than particle shape in promoting greater T cell expansion. Non-spherical particle shapes templated from Hela or red blood cells coated with a more fluid DOPC lipid membrane balanced the CD4+ to CD8+ ratio during outgrowth. Higher activating antibody density on non-spherical supports limited the differentiation of T cells compared to low antibody density and spherical particle aAPCs.
An important thing to note is that these relationships are true for this proof of principle set of culture conditions including cell density, media composition, cytokine supplement, and plate geometry. Like we observed with donor-to-donor variability in these studies, other variables likely play an important role in T cell expansion and differentiation when optimizing an aAPC system for a specific application. Additional healthy donor and patient donor replicates would be needed to confirm the trends observed in these studies. These experiments do support further application of this cell-templated silica microparticles with supported lipid bilayers platform technology.
In the future, this facile supported lipid bilayer technology platform could be expanded to evaluate a wider range of design parameters and applications including nano-sized particles, magnetic particles, and antigen-specific T cell expansion.
4. Experimental Section
4.1. Materials
Lipids (DOPC, DSPC, cholesterol, 18:1 PEG-2000 PE, 18:0 PEG-2000 PE, and DSPE-PEG(2000) Biotin) were purchased from Avanti Polar Lipids in chloroform. Silica microspheres (6.0–8.0 μm diameter) were purchased from Spherotech.
4.2. Silicified cell synthesis and characterization
Silicified cells were prepared as described previously.[18,19] Briefly, cultured HeLa cells and red blood cells from healthy donors were fixed in 4% formaldehyde in phosphate buffered saline for 16–24 hours, rinsed in phosphate buffered saline (PBS) and 0.9% saline solution, and reacted in 0.1 M TMOS in 0.9% saline and 1.0 mM HCl (pH 3) and incubated at 37 °C for 16–24 hours. The organic templates were removed by calcination in air at 550 to 600 °C for 3–4 hours. For imaging, calcined particles were sputter-coated with gold/palladium to a thickness of ~10 nm, and imaged with an FEI XL830 dual beam focused ion beam/scanning electron microscope.
4.3. Small unilamellar vesicle (SUV) formation, synthesis, and characterization
Lipid-chloroform suspensions (cholesterol, DSPE-PEG(2000)-biotin, either 18:1 PEG-2000 PE or 18:0 PEG-2000 PE, and either DOPC or DSPC) were mixed at defined compositions (Table S1). Chloroform was removed by evaporation in a vacuum desiccator overnight. Dry lipid films were hydrated by addition of PBS to a concentration of 4 mg/mL. Monodisperse suspensions of SUVs were then generated from the hydrated lipid films via sonication (Branson 2800 bath sonicator). DOPC lipid films were sonicated for approximately 15 minutes in a room temperature water bath, while DSPC lipid films were sonicated for 45–60 minutes in a warm water bath. Biotinylated SUV suspensions were stored at 4 °C.
Liposomes were diluted to a final concentration of 10 μg/mL in Nanopure H2O and dynamic light scattering (DLS) measurements were made on a Zetasizer Nano ZS (Malvern Instruments) (Table S2).
4.4. Supported lipid bilayer synthesis and characterization
Dry silica RBC and HeLa microparticles were suspended in methanol and dried by SpeedVac for weighing, then subsequently mixed with the SUV suspensions at a 1:1 mass ratio. Spherical microspheres (Spherotec) were directly mixed with the SUV suspensions at a 1:1 mass ratio and fused at room temperature for 1 hour with intermittent mixing by inversion. Excess lipids were removed by centrifugation and PBS washes (500×g for 5 minutes).
Supported lipid bilayers were characterized by fluorescent microscopy and flow cytometry. Lipid fusion was confirmed by staining with Vibrant DiD Cell-Labeling Solution (ThermoFisher) and FITC-labeled neutravidin (ThermoFisher) which was subsequently visualized by fluorescent microscopy on a Nikon Eclipse Ti inverted microscope. To quantify biotin content, supported lipid bilayers were labeled with FITC-neutravidin and the resulting fluorescence was measured on an Attune NxT Flow Cytometer (ThermoFisher).
4.5. Antibody attachment and characterization
Biotinylated human anti-CD3ε (clone: OKT3) and anti-CD28 (clone: CD28.2) antibodies (Biolegend) were conjugated to the biotinylated supported lipid bilayers via a neutravidin linker at a 1:5 anti-CD3ε-to-anti-CD28 molar ratio.[3] Briefly, each biotinylated antibody was mixed with neutravidin at a 1:1 molar ratio in separate reactions, and allowed to bind at 4 °C for 10 minutes. Neutravidin-linked antibodies were combined, briefly mixed, and then added to lipid-coated particles diluted in PBS resulting in a 41.5 nM reaction of total antibodies (6.92 nM anti-CD3ε and 34.63 nM anti-CD28). Binding occurred for 30 minutes at 4 °C. Unbound antibodies were removed by centrifugation (500×g for 5 minutes) and PBS washes. Antibody-loaded aAPCs were stored at 4 °C up to 1–2 weeks before use in T cell activation experiments. Antibody conjugation was characterized by flow cytometry and total protein quantification. Relative loading of anti-CD3ε and anti-CD28 was assessed by loading into microsphere-supported lipid bilayers, but anti-CD3ε was conjugated via a FITC-labeled neutravidin and anti-CD28 was conjugated via a DyLight 633-labeled neutravidin. The relative fluorescence of the two different neutravidin linkers was measured on an Attune NxT Flow Cytometer as the anti-CD3ε-to-anti-CD28 molar ratio was varied (0:1, 1:5, 1:1, 5:1, and 1:0).
4.6. T cell isolation and culture
Leukapheresis products were obtained from health donors (Bloodworks Northwest). Primary CD4+ and CD8+ T cells were isolated serially using the CliniMACS System (Miltenyi) and cryopreserved for later use in activation studies. Cells were cultured in RPMI 1640 (Corning) supplemented with 10% fetal bovine serum (FBS) (ThermoFisher), recombinant human IL-2 (50 U/mL), and recombinant human IL-15 (0.5 U/mL) (Miltenyi). Cells were maintained in a 37 °C and 5% CO2 humidified incubator.
4.7. Cell activation and analysis
CD4+ and CD8+ T cells from 4 independent donors were thawed, mixed at a 1:1 ratio, and rested for 3–4 hours in basal media (RPMI supplemented with 10% FBS) before activation. 3 × 10⁵ cells were seeded in a U-bottom 96-well plate at a density of 1.5 × 10⁶ cells/mL. Supported lipid bilayer formulations (aAPCs) and CD3/CD28 Human T Activator Beads (DynaBeads, Gibco) were suspended in complete T cell medium and cocultured with T cells at defined aAPC-to-cell ratios based on equivalent particle surface area of 65 ± 15 μm2/cell (1:3 microsphere-to-cell, 1:10 HeLa-to-cell, 1:1 RBC-to-cell, and 1:1 DynaBead-to-cell). For outgrowth experiments, media was exchanged for fresh cytokine-supplemented medium every 3 days following activation. On days 6, 9, 12, and 14 post-activation, all aAPC-stimulated cells were counted by hemocytometer. Cells were passaged into larger culture vessels once reaching densities > 1.25 × 10⁶/mL.
4.8. Intracellular cytokine staining (ICCS)
T cells were treated with Protein Inhibitor Cocktail (ThermoFisher) for 4 hours to block cytokine release prior to staining 3 days post-activation. Positive controls were also treated with Cell Stimulation Cocktail containing phorbol myristate acetate (PMA) and Ionomyocin (ThermoFisher) for 1 hour prior to protein transport inhibition. Surface staining was performed, followed by permeabilization during fixation with Cytofix/Cytoperm solution (BD Biosciences). Permeabilized cells were then stained for intracellular markers and analyzed on a BD LSR Fortessa (Table S3). Data analysis was performed using FlowJo software (FlowJo, LLC), with serial or boolean gating (Figure S1).
4.9. Surface marker flow cytometry analysis
On days 9 and 14 post-activation, samples of each treatment were stained for CD4 and CD8 expression and analyzed on an Attune NxT flow cytometer (ThermoFisher) (Table S4). On day 12 post-activation, samples of each treatment from 3 independent donors were stained with a differentiation panel (Table S5) and analyzed on a BD LSR Fortessa. Data analysis was performed using FlowJo software (FlowJo, LLC), with serial or boolean gating (Figure S2 & Figure S3).
4.10. Statistical analysis
Results are presented as mean ± standard deviation (SD) with sample size for each experiment noted in the corresponding figure caption. All statistical analysis was performed in GraphPad Prism software (Graph Pad Software). Analysis of variance (ANOVA) was used for statistical analysis, with paired hypothesis testing to account for donor-to-donor variability when comparing to DynaBeads control. One-way ANOVA with Dunnett’s multiple comparisons posthoc analysis was performed in the analysis of fold expansion, CD4-to-CD8 ratios, and PD-1 expression. Two-way ANOVA with Bonferonni’s multiple comparisons was performed in the analysis of T cell differentiation. Paired t-tests, repeated measures one-way ANOVA with Tukey’s multiple comparisons, and repeated measures one-way ANOVA with post test for linear trend were respectively performed to compare the design parameters of lipid coating, particle shape, and antibody loading density.
Supplementary Material
Acknowledgements
Part of this work was conducted at the Molecular Analysis Facility, a National Nanotechnology Coordinated Infrastructure site at the University of Washington which is supported in part by the National Science Foundation [ECC-1542101], the University of Washington, the Molecular Engineering & Sciences Institute, and the Clean Energy Institute. This work was supported by the National Institutes of Health [1R01CA177272, 2R01NS064404]. This work was supported by a National Science Foundation Graduate Research Fellowship to B.R.O [DGE-1256082] and a Washington Research Foundation Fellowship to C.R.P.
Supporting Information
Supporting Information is available from the Wiley Online Library or from the author.
Contributor Information
Dr. Brynn R. Olden, Department of Bioengineering and Molecular Engineering and Sciences Institute, University of Washington, Seattle, WA 98195, USA, spun@u.washington.edu
Caleb R. Perez, Department of Bioengineering and Molecular Engineering and Sciences Institute, University of Washington, Seattle, WA 98195, USA, spun@u.washington.edu
Dr. Ashley L. Wilson, Ben Towne Center for Childhood Cancer Research, Seattle Children’s Research Institute, Seattle, WA 98101, USA
Ian I. Cardle, Department of Bioengineering and Molecular Engineering and Sciences Institute, University of Washington, Seattle, WA 98195, USA, spun@u.washington.edu Ben Towne Center for Childhood Cancer Research, Seattle Children’s Research Institute, Seattle, WA 98101, USA.
Dr. Yu-Shen Lin, Department of Bioengineering and Molecular Engineering and Sciences Institute, University of Washington, Seattle, WA 98195, USA, spun@u.washington.edu
Dr. Bryan Kaehr, Advanced Materials Laboratory, Sandia National Laboratories, Albuquerque, NM 87185, USA
Dr. Joshua A. Gustafson, Ben Towne Center for Childhood Cancer Research, Seattle Children’s Research Institute, Seattle, WA 98101, USA
Prof. Michael C. Jensen, Ben Towne Center for Childhood Cancer Research, Seattle Children’s Research Institute, Seattle, WA 98101, USA
Prof. Suzie H. Pun, Department of Bioengineering and Molecular Engineering and Sciences Institute, University of Washington, Seattle, WA 98195, USA, spun@u.washington.edu
References
- [1].Malissen B, Bongrand P, Annu. Rev. Immunol 2015, 33, 539. [DOI] [PubMed] [Google Scholar]
- [2].Bashour KT, Gondarenko A, Chen H, Shen K, Liu X, Huse M, Hone JC, Kam LC, Proc. Natl. Acad. Sci. U. S. A 2014, 111, 2241. [DOI] [PMC free article] [PubMed] [Google Scholar]
- [3].Trickett A, Kwan YL, Immunol J Methods 2003, DOI 10.1016/S0022-1759(03)00010-3. [DOI] [PubMed] [Google Scholar]
- [4].Steenblock ER, Fahmy TM, Mol. Ther. 2008, 16, 765. [DOI] [PubMed] [Google Scholar]
- [5].Sunshine JC, Perica K, Schneck JP, Green JJ, Biomaterials 2014, 35, 269. [DOI] [PMC free article] [PubMed] [Google Scholar]
- [6].Meyer RA, Sunshine JC, Perica K, Kosmides AK, Aje K, Schneck JP, Green JJ, Small 2015, 11, 1519. [DOI] [PMC free article] [PubMed] [Google Scholar]
- [7].Cheung AS, Zhang DKY, Koshy ST, Mooney DJ, Nat. Biotechnol 2018, 36, 160. [DOI] [PMC free article] [PubMed] [Google Scholar]
- [8].Martín-Cófreces NB, Baixauli F, Sánchez-Madrid F, Trends Cell Biol. 2014, 24, 61. [DOI] [PMC free article] [PubMed] [Google Scholar]
- [9].Hu YS, Cang H, Lillemeier BF, Proc. Natl. Acad. Sci 2016, 113, 7201. [DOI] [PMC free article] [PubMed] [Google Scholar]
- [10].Hsu CJ, Hsieh WT, Waldman A, Clarke F, Huseby ES, Burkhardt JK, Baumgart T, PLoS One 2012, 7, e32398. [DOI] [PMC free article] [PubMed] [Google Scholar]
- [11].Perica K, Kosmides AK, Schneck JP, Biochim. Biophys. Acta - Mol. Cell Res 2015, 1853, 781. [DOI] [PMC free article] [PubMed] [Google Scholar]
- [12].Shen K, Thomas VK, Dustin ML, Kam LC, Proc. Natl. Acad. Sci 2008, 105, 7791. [DOI] [PMC free article] [PubMed] [Google Scholar]
- [13].Delcassian D, Depoil D, Rudnicka D, Liu M, Davis DM, Dustin ML, Dunlop IE, Nano Lett. 2013, 13, 5608. [DOI] [PMC free article] [PubMed] [Google Scholar]
- [14].Matic J, Deeg J, Scheffold A, Goldstein I, Spatz JP, Nano Lett. 2013, 13, 5090. [DOI] [PMC free article] [PubMed] [Google Scholar]
- [15].Mescher MF, J Immunol 1992, 149, 2402. [PubMed] [Google Scholar]
- [16].O’Connor RS, Hao X, Shen K, Bashour K, Akimova T, Hancock WW, Kam LC, Milone MC, Immunol J 2012, 189, 1330. [DOI] [PMC free article] [PubMed]
- [17].Berger C, Jensen MC, Lansdorp PM, Gough M, Elliott C, Riddell SR, J. Clin. Invest 2008, 118, 294. [DOI] [PMC free article] [PubMed] [Google Scholar]
- [18].Kaehr B, Townson JL, Kalinich RM, Awad YH, Swartzentruber BS, Dunphy DR, Jeffrey Brinker C, Brinker CJ, Proc. Natl. Acad. Sci. U. S. A 2012, 109, 17336. [DOI] [PMC free article] [PubMed] [Google Scholar]
- [19].Meyer KC, Coker EN, Bolintineanu DS, Kaehr B, J. Am. Chem. Soc 2014, 136, 13138. [DOI] [PubMed] [Google Scholar]
- [20].Ashley CE, Carnes EC, Phillips GK, Padilla D, Durfee PN, Brown PA, Hanna TN, Liu J, Phillips B, Carter MB, et al. , Nat. Mater 2011, 10, 389. [DOI] [PMC free article] [PubMed] [Google Scholar]
- [21].Liu J, Jiang X, Ashley C, Brinker CJ, J. Am. Chem. Soc 2009, DOI 10.1021/ja902039y. [DOI] [PMC free article] [PubMed] [Google Scholar]
- [22].Durfee PN, Lin YS, Dunphy DR, Muniz AJ, Butler KS, Humphrey KR, Lokke AJ, Agola JO, Chou SS, Chen IM, et al. , ACS Nano 2016, 10, 8325. [DOI] [PubMed] [Google Scholar]
- [23].Park H, Lee S, Ji M, Kim K, Son Y, Jang S, Park Y, Sci. Rep 2016, 6, 1. [DOI] [PMC free article] [PubMed] [Google Scholar]
- [24].Bayerl TM, Bloom M, Biophys. J 1990, 58, 357. [DOI] [PMC free article] [PubMed] [Google Scholar]
- [25].Buranda T, Huang J, V Ramarao G, Ista LK, Larson RS, Ward TL, Sklar LA, Lopez GP, Langmuir 2003, 19, 1654. [Google Scholar]
- [26].Ashley CE, Carnes EC, Phillips GK, Padilla D, Durfee PN, Brown PA, Hanna TN, Liu J, Phillips B, Carter MB, et al. , n.d., DOI 10.1038/nmat2992. [DOI]
- [27].Raphael I, Nalawade S, Eagar TN, Forsthuber TG, Cytokine 2015, 74, 5. [DOI] [PMC free article] [PubMed] [Google Scholar]
- [28].Sommermeyer D, Hudecek M, Kosasih PL, Gogishvili T, Maloney DG, Turtle CJ, Riddell SR, Leukemia 2016, 30, 492. [DOI] [PMC free article] [PubMed] [Google Scholar]
- [29].Turtle CJ, Hanafi L, Berger C, Gooley TA, Cherian S, Hudecek M, Sommermeyer D, Melville K, Pender B, Budiarto TM, et al. , J Clin Invest 2016, 1, 1. [DOI] [PMC free article] [PubMed] [Google Scholar]
- [30].Ye Q, Loisiou M, Levine BL, Suhoski MM, Riley JL, June CH, Coukos G, Powell DJ, J. Transl. Med 2011, 9, 1. [DOI] [PMC free article] [PubMed] [Google Scholar]
- [31].Chong EA, Melenhorst JJ, Lacey SF, Ambrose DE, Gonzalez V, Levine BL, June CH, Schuster SJ, Blood 2017, 129, 1039. [DOI] [PMC free article] [PubMed] [Google Scholar]
- [32].Yoon DH, Osborn MJ, Tolar J, Kim CJ, Int. J. Mol. Sci 2018, 19, DOI 10.3390/ijms19020340. [DOI] [PMC free article] [PubMed] [Google Scholar]
- [33].Keir ME, Butte MJ, Freeman GJ, Sharpe AH, Annu. Rev. Immunol 2008, 26, 677. [DOI] [PMC free article] [PubMed] [Google Scholar]
Associated Data
This section collects any data citations, data availability statements, or supplementary materials included in this article.


