Hepatosplenic T–cell lymphoma (HSTL) is a malignancy with an unfavorable outcome mainly affecting young adults. To discover genes showing altered DNA-methylation in HSTL we performed array-based DNA methylation profiling of HSTL cells from 11 patients and compared the findings to those obtained from purified non-neoplastic ab-positive and gd-positive T cells. The procedure identified 1,339 hypermethylated and 2,774 hypomethylated CpG-loci in HSTL compared to controls. DNA methylation changes in HSTL were enriched for regulatory elements, like enhancers. Considering the top 100 differentially-methylated CpGs from various subset comparisons, we identified eight consistently hypermethylated genes (BCL11B, CD5, CXCR6, GIMAP7, LTA, SEPT9, UBAC2, UXS1) and four consistently hypomethylated genes (ADARB1, NFIC, NR1H3, ST3GAL3) in HSTL.
Hypermethylation of CpGs around transcription start sites was shown by immunohistochemistry to be associated with lack of protein expression in HSTL, not only of the diagnostic marker CD5 but also of CXCR6, which in contrast was expressed by normal splenic lymphocytes. Thus, our findings provide novel insights into epigenetic changes in HSTL which might become relevant for understanding its pathogenesis or as biomarkers.
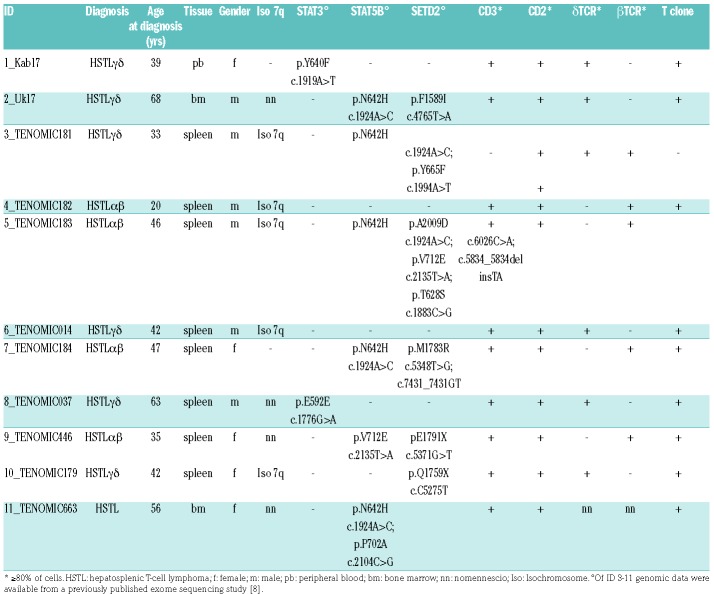
HSTL is a rare but highly aggressive lymphoid neoplasm associated with a median overall survival barely exceeding one year1 and which typically presents with cytopenias. Immunosuppression or prolonged antigenic stimulation is frequent.1,2,3 Characteristic pathological features include intrasinusal/sinusoidal infiltration by neoplastic T cells in the spleen, liver and bone marrow.4 Although HSTL commonly arises from the γδ T-cell subset, cases with a TCR−αβ phenotype have been described.5,6 Cytogenetically, HSTL is associated with isochromosome 7q and trisomy 8.7 Recent studies have identified activating STAT5B and STAT3 mutations in γδ HSTL as well as inactivating mutations in SETD2.8,9 In addition, gene expression profiling has discriminated HSTL from other T-cell lymphomas and discovered candidate pathways involved in its pathogenesis.10 However, the molecular events driving the pathogenesis of this dis mal entity are not yet fully understood. To further characterize the molecular basis of HSTL, we analysed the DNA methylome of HSTL by array-based DNA methylation profiling and compared it to that of benign γδ and αβ T cells. HSTL samples from the spleen, bone marrow or blood of eleven patients were analyzed. Patients were selected by availability of appropriate tumour material and consent. Patient characteristics are summarized in Table 1. Six tumours were classified as γδ HSTL and four as αβ HSTL; in one case the subtype could not be unambiguously determined.
Table 1.
Clinical characteristics of the HSTL patients.
We included MACS-sorted CD8, CD4 (TCR αβ) and TCR γδ T cells from buffy coats of four healthy blood donors (males, mean age 37 yrs) as controls. The study was approved by the institutional review board of the Christian-Albrecht-University (ID: D405/10). Nine cases were obtained from the Tenomic database, which is approved by the ethical committee CPP-Ile-de-France-IX-08-009. The genomic data of these patients (ID 3-11) were available from a previously published exomesequencing study.8 In two patients (ID 1, 2) SETD2 was analysed by means of a custom Ion AmpliSeq DNA panel (see supplement). For all patients, exons of the genes STAT3 and STAT5B containing hot-spot mutations were amplified from genomic DNA by polymerase chain reaction and Sanger sequenced, in addition to the exome data (Online Supplementary Table S1, Online Supplementary Methods).
For microarray-based DNA methylation profiling, bisulfite conversion was performed using the EZ-DNA Methylation Kit® (Zymo Research Corporation, Irvine, CA, USA) followed by DNA methylation analysis with the Infinium HumanMethylation450 BeadChip (Illumina, San Diego, CA, USA). The dataset is available from Gene Expression Omnibus (GEO accession: GSE110081).
The analysed CpGs were mapped to the chromatin states determined in CD4 naïve and CD8 naïve cells by the BLUEPRINT/IHEC Project (see Online Supplementary Methods). These T-cell populations were selected as they are the T-cell subsets with available chromatin segmentations in BLUEPRINT most closely related the maturation stage of HSTL cells. Immunohistochemistry was performed on deparaffinised tissue sections from five reactive (normal) spleen samples and on ten of the current series of eleven HSTL patients (six on full sections, four on tissue micro-array sections). For details of methods and data analyses see Supplemental Method file.
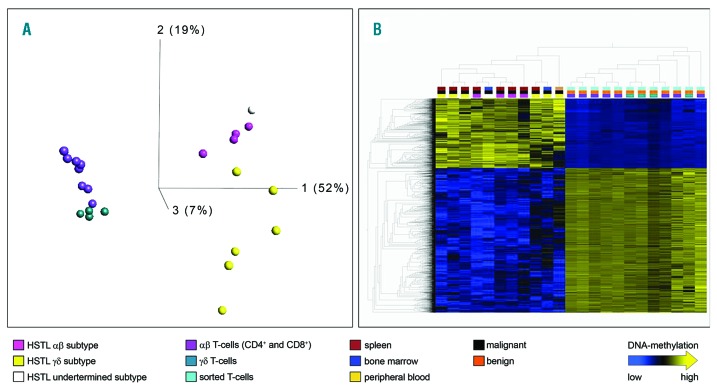
We analysed the DNA methylation of HSTL tumours from 11 patients (Table 1) in comparison to 12 samples of non-neoplastic T-cells i.e., sorted CD4+αβ, CD8+αβ and γδ T-cells from each of four healthy donors. After quality control, all 23 hybridizations and a total of 450,959 CpG loci were included in the analyses. Unsupervised analysis of all cases and controls based on the 5,376 CpG loci with the highest variance (σ/σmax>= 0.5) clearly segregated the dataset into HSTL and benign T-cells (Figure 1A). Whereas in this principle component analysis (PCA) component 1 predominantly separated neoplastic from non-neoplastic samples, components 2 and 3 also separated, though to a lower extent, the αβ from the γδ cells both in the normal and neoplastic compartments. The HSTL patient with undetermined subtype (marked in white) clustered with the αβ HSTL. These results suggest that methylation analysis is able to differentiate αβ and γδ HSTL.
Figure 1.
Genome-wide methylation signature of HSTL compared to normal T-cell subtypes. Unsupervised principal component analysis (PCA) of HSTL samples and benign controls of the TCRαβ and TCRγδ subtypes (HSTL αβ = pink; HSTLγδ = yellow; HSTL undetermined = white; non-neoplastic γδ T cells = turquoise; αβ T-cells (CD4 and CD8) = violet). Using σ/σmax= 0.5, 5,376 of 450,959 differentially methylated CpG loci are visualized. (B) Heatmap and hierarchical cluster analysis resulting from a t-test using FDR< 1*10−5; 4,113 of 450,959 differentially methylated CpG loci are visualized in columns. The upper row points to the different subtypes of entity and material. X/Y chromosomes and rs-tags are excluded. Linkage: weighted average.
We first aimed at identifying HSTL changes as a whole. A supervised analysis (using the t-test) of the 11 HSTL as compared to the 12 benign T-cell samples revealed 4,113 CpG loci to be significantly differentially methylated at an FDR (false discovery rate) of 1*10−5 (Figure 1B, Online Supplementary Table S2). Of these 4,113 differentially methylated CpG loci, 1,339 were hypermethylated and 2,774 hypomethylated in HSTL as compared to controls. CpH loci were not differentially methylated in any of the analyses. Gene ontology (GO) analysis of the genes linked to the between HSTL and the benign T cells differentially methylated CpG loci revealed enrichment for terms like “anatomical structure morphogenesis”, “positive regulation of biological process”, “system development regulation of multicellular organismal process”, “positive regulation of transcription from RNA polymerase II promoter” (Online Supplementary Table S3). These terms are known to be enriched also in comparisons between other neoplasms and controls.11,12 To characterize which genomic regulatory elements show HSTL specific changes in methylation, we compared the differentially methylated loci between HSTL and the benign T-cells with the chromatin segmentation data of CD4 and CD8+ T cells (see Online Supplementary Material for details), CpGs hypermethylated in HSTL as compared to the non-neoplastic controls showed a highly significant enrichment at repressed promoters (Rpro) in CD4 (P= 1.55*10−54) and CD8 (P= 4*10−52) cells (Online Supplementary Figure S1). These hypermethylated differentially methylated regions (DMRs) enriched in Rpro co-localize with 49 known genes including HOXA6, HOXD3, HOXD4, HOXD9, MSX1, PITX1, SOX11 and FOXD3 (Online Supplementary Table S4). There was no significant enrichment of STAT5 binding sites in the DMRs in HSTL (see Online Supplemental Methods file).
Moreover, hyper- and hypomethylated DMRs in the tumor samples are also enriched in regulatory elements (RegE), i.e., enhancers (Online Supplementary Figure S1). In addition, hypomethylated regions were enriched for transcribed regions (TranR).
Since PCA revealed DNA methylation differences in samples with distinct TCR subtypes (i.e., αβ and γδ), we further performed supervised analyses according to the TCR receptor status. Supervised analysis of the 4 αβ HSTL compared to 8 benign αβ T cells revealed 2,165 significantly differentially methylated CpGs at an FDR of 1*10−5, whereas supervised analysis of the 6 γδ HSTL compared to 4 benign γδ T cells revealed 5,896 CpG loci differentially methylated at an FDR of 0.05 (Online Supplementary Figures S2A and S2B, Online Supplementary Tables S5 to S8).
In order to identify those genes which are consistently associated with the pathogenesis of HSTL independently of the TCR phenotype we overlapped the top 100 genes most significantly differentially hypermethylated (αβ subtype: represented by 149 CpGs, 31 of the 100 genes with more than one affected CpG, γδ subtype: represent ed by 170 CpGs, 30 of the 100 genes with more than one affected CpG) and the 100 most significantly differentially hypomethylated genes (αβ subtype: represented by 115 CpGs, 12 of the 100 genes with more than one CpG, γδ subtype: represented by 134 CpGs, 19 of the 100 genes with more than one CpG) between HSTL and benign T-cells in both αβ and γδ subtypes.
The 12 genes overlapping in these top 100 lists of both subtypes showed between 2 and 18 affected CpGs highly significant differentially methylated (q values between 4.6*10−14 and 1.1*10−6). The difference in methylation calculated as the difference between the average mean of the beta values ranged from 0.38 to 0.77. Of these genes, eight genes were hypermethylated (BCL11B, CD5, CXCR6, GIMAP7, LTA, SEPT9, UBAC2, UXS1) and four genes hypomethylated (ADARB1, NFIC, NR1H3, ST3GAL3) in the lymphomas (Online Supplementary Table S9).
Moreover, the hypermethylated genes LTA, CD5, CXCR6, GIMAP7, BCL11B and SEPT9 are in part known to be relevant in T-cell leukaemia/lymphoma pathobiology (Online Supplementary Table S10). These genes are all hypermethylated at active promoter (Apro) or RegE sites mainly around the transcription start sites (TSS) in HSTL (Table 2). Hypermethylation of CpGs in HSTL around TSS was further shown to be associated with lack of protein expression in HSTL by immunohistochemistry for CD5 and CXCR6.
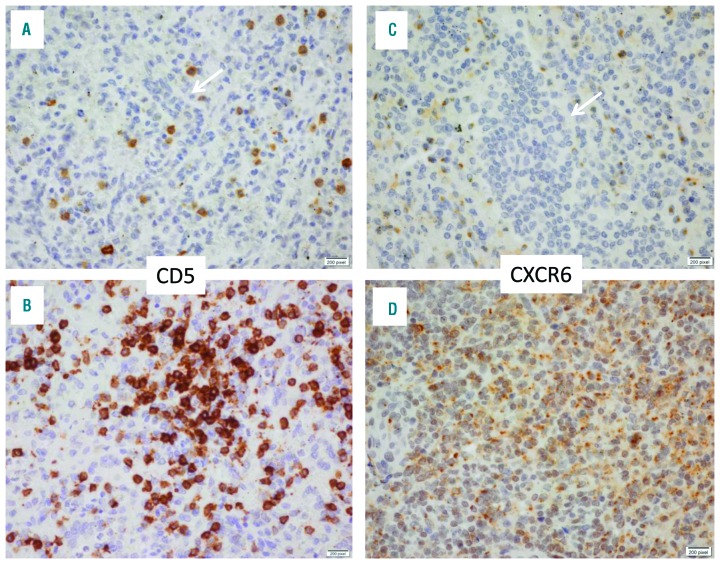
Among these hypermethylated genes we confirmed by immunohistochemistry the characteristic lack of CD5 expression in neoplastic HSTL cells and showed that HSTL neoplastic cells also do not significantly express CXCR6 in all 10 tested HSTL cases in contrast to normal splenic cells (Figure 2).
Figure 2.
Expression of CD5 and CXCR6 in HSTL and in reactive (normal) spleen. Immunohistochemical analysis shows lack of expression by HSTL tumor cells infiltrating the splenic red pulp sinuses of CD5 (A) (arrow) or of CXCR6 (B); whereas lymphocytes in a normal reactive spleen specimen were CD5-positive (C) and CXR6-positive (D). To note, a few scattered reactive lymphocytes acting as internal positive controls are CD5-positive and CXCR6-postive in HSTL (panels A and B). Immunoperoxidase, Original magnification X400.
The lack of CD5 expression is not exclusive to HSTL and is frequently found in other T-cell lymphoma entities.13 Future studies on other T-cell lymphoma entities might shed further light into whether the expression of CD5 in the various T-cell lymphomas is regulated by lymphoma-type associated epigenetic modifications.
The findings of this study provide novel insights into epigenetic changes in HSTL which might become relevant for its pathogenesis or as biomarkers.
Supplementary Material
Acknowledgments
We thank Lorena Valles, Claudia Becher, Dorit Schuster, Gabi Riesen and Sandra Ussat for their excellent technical assistance..
Footnotes
Funding: this work was funded by the European Union’s Seventh Framework Program through the Blueprint Consortium (grant agreement 282510). MJSDs work was supported by the Leicester Experimental Cancer Medicine Centre (C325/A15575 Cancer Research UK/UK Department of Health). PG’s work was supported by a grant from the Fondation pour la Recherche Médicale, grant number “DEQ20160334875”. RS’ work was supported by the DFG in the framework of the SFB1074.
Information on authorship, contributions, and financial & other disclosures was provided by the authors and is available with the online version of this article at www.haematologica.org.
References
- 1.Belhadj K, Reyes F, Farcet JP, et al. Hepatosplenic gammadelta T-cell lymphoma is a rare clinicopathologic entity with poor outcome: report on a series of 21 patients. Blood. 2003;102(13):4261–4269. [DOI] [PubMed] [Google Scholar]
- 2.Cooke CB, Krenacs L, Stetler-Stevenson M, et al. Hepatosplenic T-cell lymphoma: a distinct clinicopathologic entity of cytotoxic gamma delta T-cell origin. Blood. 1996;88(11):4265–4274. [PubMed] [Google Scholar]
- 3.Swerdlow SH, Campo E, Harris NL, et al. eds. World Health Organization classification of tumours of haematopoietic and lymphoid tissues. IARC: Lyon, France; 2008. [Google Scholar]
- 4.Farcet JP, Gaulard P, Marolleau JP, et al. Hepatosplenic T-cell lymphoma: sinusal/sinusoidal localization of malignant cells expressing the T-cell receptor gamma delta. Blood. 1990;75(11):2213–2219. [PubMed] [Google Scholar]
- 5.Suarez F, Wlodarska I, Rigal-Huguet F, et al. Hepatosplenic αβ T-cell lymphoma: an unusual case with clinical, histologic and cytogenetic features of γδ hepatosplenic T-cell lymphoma. Am J Surg Pathol. 2000;24(7):1027–1032. [DOI] [PubMed] [Google Scholar]
- 6.Macon WR, Levy NB, Kurtin PJ, et al. Hepatosplenic alpha beta T-cell lymphomas: a report of 14 cases and comparison with hepatosplenic gamma delta T-cell lymphomas. Am J Surg Pathol. 2001;25(3):285–296. [DOI] [PubMed] [Google Scholar]
- 7.Jonveaux P, Daniel MT, Martel V, et al. Isochromosome 7q and trisomy 8 are consistent primary, non-random chromosomal abnormalities associated with hepatosplenic T gamma/delta lymphoma. Leukemia. 1996;10(9):1453–1455. [PubMed] [Google Scholar]
- 8.McKinney M, Moffitt AB, Gaulard P, et al. The Genetic Basis of Hepatosplenic T-cell Lymphoma. Cancer Discov. 2017;7(4):369–379. [DOI] [PMC free article] [PubMed] [Google Scholar]
- 9.Nicolae A, Xi L, Pittaluga S, et al. Frequent STAT5B mutations in gammadelta hepatosplenic T-cell lymphomas. Leukemia. 2014;28(11):2244–2248. [DOI] [PMC free article] [PubMed] [Google Scholar]
- 10.Travert M, Huang Y, de Leval L, et al. Molecular features of hepatosplenic T-cell lymphoma unravels potential novel therapeutic targets. Blood. 2012;119(24):5795–5806. [DOI] [PMC free article] [PubMed] [Google Scholar]
- 11.Martin-Subero JI, Ammerpohl O, Bibikova M, et al. A comprehensive microarray-based DNA methylation study of 367 hematological neoplasms. PLoS One. 2009;4(9):e6986. [DOI] [PMC free article] [PubMed] [Google Scholar]
- 12.Martin-Subero JI, Kreuz M, Bibikova M, et al. New insights into the biology and origin of mature aggressive B-cell lymphomas by combined epigenomic, genomic, and transcriptional profiling. Blood. 2009;113(6):2488–2497. [DOI] [PubMed] [Google Scholar]
- 13.Kanai T, Seki S, Jenks JA, et al. Identification of STAT5A and STAT5B target genes in human T cells. PLoS One. 2014;9(1):e86790. [DOI] [PMC free article] [PubMed] [Google Scholar]
Associated Data
This section collects any data citations, data availability statements, or supplementary materials included in this article.


