

Abstract
The objective of this meta-analysis was to investigate the effects of plant-derived polyunsaturated fatty acids (PUFAs) on glucose metabolism and insulin resistance. Scopus and PubMed databases were searched until January 2018. Eligible studies were randomized controlled feeding trials that investigated the effects of a diet high in plant-derived PUFA as compared with saturated fatty acids (SFA) or carbohydrates and measured markers of glucose metabolism and insulin resistance as outcomes. Data from 13 relevant studies (19 comparisons of plant-derived PUFA with control) were retrieved. Plant-derived PUFA did not significantly affect fasting glucose (−0.01 mmol/L (95 % CI − 0.06 to 0.03 mmol/L)), but lowered fasting insulin by 2.6 pmol/L (−4.9 to −0.2 pmol/L) and homeostatic model assessment-insulin resistance (HOMA-IR) by 0.12 units (-0.23 to − 0.01 units). In dose–response analyses, a 5% increase in energy (En%) from PUFA significantly reduced insulin by 5.8 pmol/L (95% CI −10.2 to −1.3 pmol/L), but not glucose (change −0.07, 95% CI −0.17 to 0.04 mmol/L) and HOMA-IR (change − 0.24, 95% CI −0.56 to 0.07 units). In subgroup analyses, studies with higher PUFA dose (upper tertiles) reduced insulin (-6.7, –10.5 to −2.9 pmol/L) and HOMA-IR (-0.28, –0.45 to −0.12 units), but not glucose (−0.09, 95% CI −0.18 to 0.01 mmol/L), as compared with an isocaloric control. Subgroup analyses showed no differences in effects between SFA and carbohydrates as replacement nutrients (p interaction ≥0.05). Evidence from randomized controlled trials indicated that plant-derived PUFA as an isocaloric replacement for SFA or carbohydrates probably reduces fasting insulin and HOMA-IR in populations without diabetes.
Keywords: glucose metabolism, meta-analysis, dietary fat, insulin resistance, Linoleic acid
Introduction
The rapidly increasing global burden of type 2 diabetes is partially the result of poor dietary and lifestyle habits.1 Evidence-based lifestyle modification programmes to lower the risk for diabetes involve dietary changes, including reductions in saturated fatty acid (SFA) intake and increases in dietary fibre intake.2 3 In an energy-balanced diet, reductions in SFA intake should be compensated for by other energy yielding nutrients. For patients with diabetes, dietary guidelines often recommend increasing the intake of foods rich in monounsaturated fatty acids (MUFA) and sometimes the intake of polyunsaturated fatty acids (PUFA).4 Guidelines for general populations recommend to replace SFA with unsaturated fat, in particular PUFA.5 These recommendations are based on beneficial effects of PUFA on low-density-lipoprotein (LDL) cholesterol6 and relations with lower risk of cardiovascular endpoints.7 8 In Western Europe, about three-quarters of PUFA comes from plant-derived sources (eg, fats and oils, nuts and grains),9 predominantly as linoleic acid (LA, omega-6) and some alpha-linoleic acid (ALA, omega-3). About 20% of PUFA comes from non-marine animal sources (dairy, meat and eggs),9 as LA, some ALA and some arachidonic acid (AA, omega-6), and less than 5% is from fish,9 in the form of eicosapentaenoic acid and docosahexaenoic acid (long-chain omega-3). Omega-6 as well as omega-3 PUFAs are recommended in dietary guidelines for prevention of cardiovascular diseases.5
Earlier meta-analyses suggested no relation between marine sources of omega-3 PUFA and diabetes risk.10 11 However, recent studies suggest that plant-derived omega-6 PUFA likely have a protective effect on diabetes risk. For example, population-based observational studies have shown that the replacement of dietary SFA with total PUFA predicted a reduction in the risk of diabetes.12 13 In addition, two recent pooling studies of 17 and 20 population-based individual cohorts found that circulating levels of LA were consistently related to lower diabetes risk.14 15 Additionally, a dose–response meta-regression analysis of randomized controlled trials (RCTs) reported that isocaloric replacement of SFA by total PUFA in the diet improved glycemia, hemoglobin A1c (HbA1c), insulin resistance, and insulin secretion capacity.16 This meta-regression analysis of data from 102 RCTs included all available studies in which any macronutrient was isocalorically exchanged, including RCTs on marine PUFAs and RCTs that were not primarily designed to compare PUFA with SFA or carbohydrates. A limitation of this approach is that results of individual studies for PUFA are potentially overruled or influenced by differences in other macronutrients, such as MUFA or protein. A meta-analysis of RCTs that were primarily designed to compare plant-derived PUFA with SFA or carbohydrates has to our knowledge not yet been performed.
The objective of this meta-analysis was to investigate the effects of plant-derived PUFAs on glucose metabolism and insulin resistance. We performed a systematic review and meta-analysis of randomized controlled feeding trials that were specifically designed to compare the effects of diets high in plant-derived PUFA with isocaloric diets high in SFA or carbohydrates and that reported markers of glucose metabolism and insulin resistance as outcomes. We also assessed effects of the dose of dietary PUFA and of the nutrients that replaced PUFA (SFA or carbohydrates).
Methods
Preferred Reporting Items for Systematic Reviews and Meta-Analyses (PRISMA) statement guidelines were followed for reporting the systematic review and meta-analysis. The methods of this meta-analysis were defined and published in the International Prospective Register of Systematic Reviews (PROSPERO) before commencing the study.17
Data sources and searches
Potentially relevant publications were retrieved by a systematic search in Scopus and PubMed through 15 January 2018 (online supplementary material 1). In addition, we screened all references in two earlier meta-analyses,6 16 and we screened studies registered in PROSPERO.
bmjdrc-2018-000585supp001.docx (239.4KB, docx)
Study selection
A team of three researchers (MA, WAMB, AJW) performed the screening and selection of publications in duplicate. Titles and abstracts were screened and publications were selected if they met the following inclusion criteria: (1) a randomised human trial; (2) a plant-derived PUFA intervention arm (including total plant-derived PUFA, omega-6 PUFA, LA, ALA; (3) an isocaloric control arm with SFA, carbohydrate, or combination of SFA and carbohydrate; (4) an adult or elderly study population (≥18 years), excluding pregnant women, and patients with conditions acutely affecting metabolism (such as post-bariatric surgery patients, patients with cancer, patients with acute post-myocardial infarction); (5) a duration of 14 days or more to see a possible effect of dietary change; (6) controlled provision of whole diets or fatty acid-rich foods (dietary advice studies were excluded); (7) markers of glucose metabolism and insulin sensitivity as outcome measures and (8) no multiple interventions in one study arm, such as supplementation of other nutrients, weight loss, medication change, or exercise.
In case of disagreement between researchers in the first screening on title and abstract, the paper was included in the second full-text screening step. Disagreements between researchers in the duplicate full text screening were resolved by joint consultation and discussion of the paper.
Data extraction and quality assessment
The following data were extracted from the included publications: (1) publication characteristics (reference details, year of publication, country, funding source); (2) study characteristics (parallel or crossover, sample size, study duration); (3) baseline participant characteristics (diabetes status, mean age, mean body mass index (BMI)); (4) intervention characteristics (PUFA dose, PUFA source, replacement nutrient, replacement nutrient source, macronutrient composition, level of feeding control); (5) outcome variables: fasting glucose, fasting insulin, and HOMA-IR (primary outcomes); HbA1c, post-challenge measures of glucose metabolism and markers of insulin sensitivity (clamps, intravenous glucose tolerance test) (secondary outcomes); (6) indicators of compliance to the study protocol (body weight, and changes in medication use) and (7) risk of bias was assessed for each included study through identification and extraction of relevant information on study design and conduct as described by the Cochrane handbook for systematic reviews of interventions.18 The following areas were included for assessment, each being assigned a low, high or unclear risk of bias: random sequence generation, allocation concealment, blinding of participants and personnel, incomplete outcome data, selective reporting, and other sources of bias.
Secondary outcomes were only included in the meta-analysis in case of low heterogeneity and relevant number of included studies (two or more). For all outcome variables, data on mean reported values and its variances at baseline and at the end of the intervention were extracted. All data extractions were double checked by a second researcher, and inconsistencies or cases of doubt were resolved by discussion. Any essential information that was not reported was obtained by direct contact with the authors19 20 or retrieved from other publications about the same trial.21–23
Data synthesis and analysis
For each comparison, PUFA dose was calculated as the difference in amount of plant-derived PUFA intake between the intervention and control diet. Fasting glucose data expressed in mg/dL were converted into mmol/L by dividing by 18. Fasting insulin data expressed in mU/L or µIU/mL were converted into pmol/L by multiplying by 6. Data for HOMA-IR ((fasting insulin in µU/ml×fasting glucose mmol/l)/22.5 24 were corrected when other formulas were applied.
For each comparison, the mean and SE of absolute differences between intervention and control diets and differences relative to control were calculated for glucose, insulin, HOMA-IR and body weight, according to the methods previously described in detail.25 In brief, for parallel studies, absolute and relative differences were calculated based on average concentrations and variance measures at baseline and at the end of intervention of treatment and control groups. For crossover studies, absolute and relative changes were calculated based on concentrations at the end of intervention of treatment and control periods.25 If control-adjusted changes and SEs were reported in the papers, these were used. Data expressed as median (minimum, maximum) values were transformed to means and SD using the method of Wan et al.26 To derive SE from 95% CI or from an effect estimate and p value, equations were used as described by the Cochrane handbook for systematic reviews of interventions.18 Data reported in graphs were extracted using the Microsoft Excel TM Image-to-data Add-In(tushar-mehta.com). We accounted for within-trial correlated data by reducing the weight of each shared study arm.18 For example, when one PUFA study arm contributed to two comparisons (eg, PUFA vs SFA and PUFA vs carbohydrates), the weights of the comparisons were reduced by dividing the sample size of the PUFA study arm by two.
For each outcome variable, a pooled weighted net effect (expressed as summary estimate and 95% CI) was calculated using fixed and random effects models and the inverse of the within-study variance (1/SE2) as weighing factor. Forest plots were made to visualize the effects.
Funnel plots were created to visualize possible heterogeneity (in case effect sizes are outside the confidence limits) and publication bias (in case of asymmetry). Heterogeneity was further assessed using Cochranes’s Q test (p<0.1 indicates significant heterogeneity) and quantified by I2, which indicates the percentage of variability in effect estimate that is due to heterogeneity rather than sampling error. Publication bias was further evaluated by Egger’s weighted regression test of the normalized effect estimates as a function of its precision, in which the absence of publication bias is reflected by an intercept close to 0 (p≥0.05). To formally rate the certainty of the evidence, we applied the Grading of Recommendations Assessment, Development and Evaluation (GRADE) approach that takes into consideration study limitations (risk of bias), inconsistency of results, indirectness of evidence, imprecision, and publication bias.18
Dose–response relationships between increasing PUFA intake (while decreasing SFA or carbohydrates) and outcome variables were calculated when 10 or more comparisons were available using a meta-regression model that included the amount of PUFA as a continuous variable and weighing the studies by the inverse of their within-study variances (1/SE2).
In prespecified subgroup analyses, we investigated the influence of the type of replacement nutrient (predominantly SFA or predominantly carbohydrates), difference in PUFA dose (in tertiles, 3 groups with an equal number of comparisons), intervention duration (2–4 weeks or >4 weeks), PUFA type (predominantly omega-3 or predominantly omega-6), and health status (diabetes or no diabetes). Post-hoc subgroup analyses were performed for study design (crossover or parallel), industry funding (none or partly/full), level of control over food intake (partial or full), study outcome (primary or not primary), risk of bias (no unclear risk, 1 unclear risk or ≥2 unclear risk), and SFA source (dairy or plant derived). Subgroup analyses were performed if two or more comparisons were included per subgroup.
Results were considered statistically significant if p<0.05 based on two-sided testing. All statistical analyses were performed using SAS V.9.4.
Results
Study characteristics and quality
The systematic search yielded 4698 potentially relevant papers and additional hand-searching added 208 publications. After the selection procedure, 13 publications fulfilled the inclusion criteria (figure 1).
Figure 1.
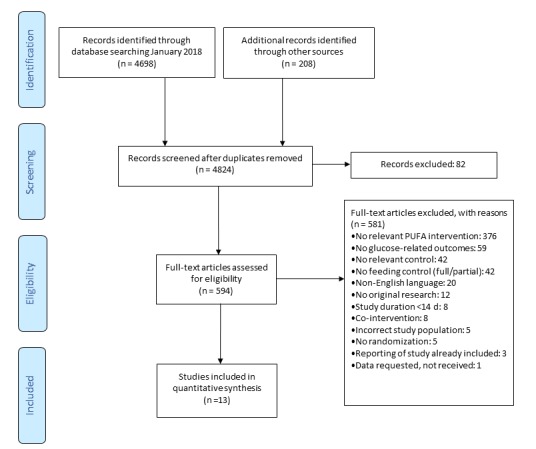
Flow chart of study selection. PUFA, polyunsaturated fatty acid.
The 13 publications comprised 19 comparisons of plant-derived PUFA with control, with a total of 576 participants (table 1). Age ranged from 23 to 64 years and BMI from 20.5 to 33.5 kg/m2. All included study populations were apparently non-diabetic, except for one study, in which 15% of subjects had type 2 diabetes.27 Study duration ranged from 3 to 16 weeks and PUFA dose ranged from 2.6% to 13.0% of energy (En%). In one comparison, the primary PUFA type was omega-3 PUFA (ALA), and in the other 18 comparisons this was omega-6 PUFA (LA). In three comparisons, the primary replacement nutrient was carbohydrates, and in 16 comparisons this was SFA (online supplementary table 1). Within studies, all subjects received identical instructions to maintain habitual physical activity, body weight and medication use. In eight comparisons, body weight change during the intervention was reported; the pooled average change during the intervention was +0.05 kg (95% CI −0.29 to 0.39 kg, p value 0.77) in PUFA versus control.
Table 1.
Characteristics of studies included in the meta-analysis
| Study | Reference | Study design | Description intervention versus control* | Intervention (n) | Control (n) | Level of feeding control† | PUFA dose (En%) | Diabetes | Age (SD) (years) | BMI (SD | Duration (weeks) | Industry funding‡ |
| Bhathena e t al, 1989, 1§ | 21 39 | Parallel | PUFA-SFA (low fat) | 16 | 15 | Full | 2.6 | No | 28 (5) | 22.8 | 16 | No |
| Bhathena e t al, 1989, 2§ | Parallel | PUFA-SFA (high fat) | 16 | 15 | Full | 5.0 | No | 28 (5) | 22.8 | 16 | No | |
| Bjermo e t al, 2012 | 27 | Parallel | PUFA-SFA | 32 | 29 | Partial | 9.5 | No | 57 (10) | 30.8 (3.8) | 10 | No |
| Brassard e t al, 2017, 1 | 40 | Crossover¶ | PUFA-SFA (cheese) | 77 | Full | 6.7 | No | 39 (14) | 30.8 (6.1) | 4 | Full | |
| Brassard e t al, 2017, 2 | Crossover | PUFA-SFA (butter) | 77 | Full | 6.7 | No | 39 (14) | 30.8 (6.1) | 4 | Full | ||
| Brassard e t al, 2017, 3 | Crossover | PUFA-Carbohydrate | 76 | Full | 6.7 | No | 39 (14) | 30.8 (6.1) | 4 | Full | ||
| Gillingham e t al, 2011 | 41 | Crossover | Omega-3 PUFA-SFA | 36 | Full | 5.8 | No | 48 (12) | 28.6 (4.6) | 4 | Full | |
| Karupaiah e t al, 2016 | 42 | Crossover | PUFA-SFA | 34 | Full | 5.2 | No | 23 (7) | 25.1 (4.7) | 4 | Full | |
| Keogh e t al, 2005, 1 | 43 | Crossover¶ | PUFA-Carbohydrate | 40 | Partial | 12.0 | No | 56 (11) | 27.3 (5.1) | 3 | ||
| Keogh e t al, 2005, 2 | Crossover | PUFA-SFA | 40 | Partial | 11.0 | No | 56 (11) | 27.3 (5.1) | 3 | |||
| Kriketos et al, 2001 | 28 | Parallel | PUFA-SFA | 17 | 19 | Full | 6.3 | No | 47 (9) | 33.5 (3.4) | 10 | No |
| Lichtenstein et al, 2003, 1 | 44 | Crossover¶ | PUFA (oil)-SFA | 36 | Full | 10.1 | No | 63 (6) | 27.4 (3) | 5 | No | |
| Lichtenstein e t al, 2003, 2 | Crossover | PUFA (margarine)-SFA | 36 | Full | 11.1 | No | 63 (6) | 27.4 (3) | 5 | No | ||
| Rosqvist et al, 2014 | 31 | Parallel | PUFA-SFA | 18 | 19 | Partial | 8.4 | No | 27 (4) | 20.5 (2.3) | 7 | No |
| Schwab et al, 1997** | 19 | Crossover | PUFA-SFA | 9 | Partial | 13.0 | No | 23 (1) | 21.1 (2) | 3 | No | |
| St-Onge et al, 2007, 1** | 20 | Crossover¶ | PUFA-Carbohydrate | 33 | Full | 4.5 | No | 44 (3) | 29.4 (0.9) | 3.6 | Partial | |
| St-Onge et al, 2007, 2** | Crossover | PUFA-SFA | 33 | Full | 3.9 | No | 44 (3) | 29.4 (0.9) | 3.6 | Partial | ||
| Vafeiadou et al, 2015§ | 22 45 | Parallel | PUFA-SFA | 66 | 65 | Partial | 7.5 | No | 44 (8) | 26.7 (4) | 16 | Partial |
| Vega-Lopez e t al, 2006§ | 23 46 | Crossover | PUFA-SFA | 15 | Full | 9.0 | No | 64 (6) | 26 (2.4) | 5 | No |
*PUFA refers to omega-6 PUFA, unless otherwise stated.
†Level of feeding control is defined as: full, providing whole diets; or partial, providing selected (fatty acid rich) foods.
‡Industry funding is defined as: full, industry providing full funding; partial, industry providing part of funding; or no, no industry funding.
§Data not reported in the paper were obtained from other publications about the same trial.
¶n corrected for within trial correlation (see the Methods section).
**Data not reported in the paper were obtained from the authors.
En%, percentage of daily energy; n, number; PUFA, poly-unsaturated fatty acids; SFA, saturated fatty acids.
The primary outcome variables, fasting glucose, fasting insulin and HOMA-IR, were reported in 15, 17 and 11 comparisons, respectively (online supplementary table 2). The secondary outcome measure, HbA1c, was not reported in the included studies; measures from oral glucose tolerance test were reported in one study;27 and measures from intravenous glucose tolerance test in two studies.19 28 Because of differences in reported procedures and outcome measure, these secondary outcomes were not included in the present quantitative meta-analysis.
Overall, the studies were determined to have a low risk of bias. Bias assessments for each study can be found in the online supplementary figure 1. Inspection of funnel plots and quantitative tests indicated no heterogeneity and no publication bias (online supplementary figure 2) and applying the GRADE approach to rate the certainty of the evidence resulted in moderate confidence in the effect estimate (online supplementary table 3).
Overall effects of plant-derived PUFA
Forest plots of the absolute changes in fasting glucose, fasting insulin and HOMA-IR estimated by fixed and random effects models are shown in figure 2. Plant-derived PUFA intake did not significantly affect glucose concentrations as compared with an isocaloric control. The average absolute change in glucose was −0.01 mmol/L, (95% CI −0.06 to 0.03 mmol/L, p=0.59) and the average relative change was −0.05% (95%CI −0.75 to 0.65%, p=0.89). Plant-derived PUFA intake significantly decreased insulin concentrations by −2.6 pmol/L (95% CI −4.9 to −0.2 pmol/L, p=0.030) or −2.8% (95%CI −6.0 to 0.3%, p=0.079), and HOMA-IR by −0.12 units (95% CI −0.22 to −0.01 units, p=0.031) or −4.4% (95% CI −8.5 to −0.43%, p=0.030).
Figure 2.
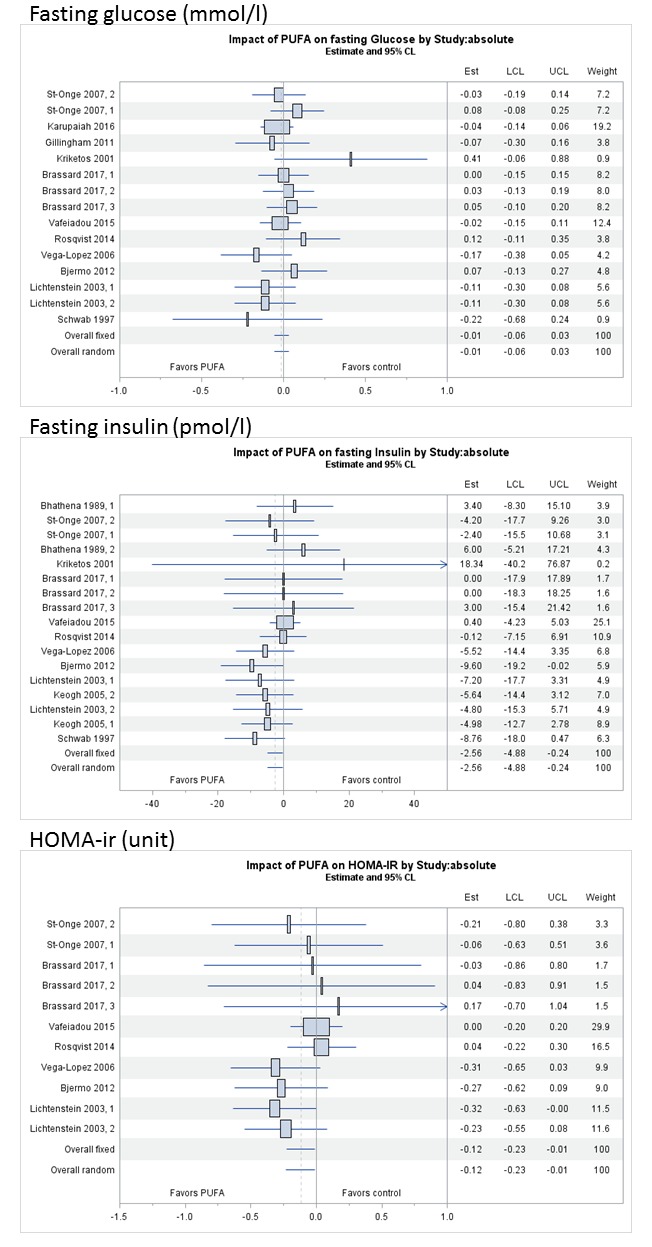
Forest plots of comparing a diet high in plant-derived PUFA with saturated fatty acids or carbohydrates on absolute changes in fasting glucose (mmol/L), fasting insulin (pmol/L) and HOMA-IR (unit), ordered by PUFA dose (low to high from top to bottom). Pooled estimates are based on fixed and random effects models. HOMA-IR, homeostatic model assessment-insulin resistance; PUFA, poly-unsaturated fatty acids.
Effects of PUFA dose and replacement nutrient
Results of dose–response meta regression and subgroup analyses of absolute changes in fasting glucose, fasting insulin and HOMA-IR are presented in table 2 and of relative changes in the online supplementary table 4. In dose–response meta-regression analyses, changes per 5 En% increase in PUFA were −0.07 mmol/L (95% CI −0.17 to 0.04 mmol/L, p=0.23) for fasting glucose, −5.8 pmol/L (95% CI −10.2 to −1.3 pmol/L, p=0.011) for fasting insulin, and −0.24 units (95% CI −0.56 to 0.07 units, p=0.132) for HOMA-IR (table 2, online supplementary figure 3). Adjusting these analyses for baseline concentrations of the outcome variables or intervention duration did not materially affect the results. Analyses according to tertiles of plant-derived PUFA dose showed that studies in the upper tertile of PUFA intake (≥9 En%) reported larger reductions in fasting insulin (change −6.7 pmol/L, 95% CI −10.5 to −2.9 pmol/L) and HOMA-IR (change −0.28 units, 95% CI −0.45 to −0.12 units) as compared with an isocaloric control (p value for interaction between dose categories was <0.05).
Table 2.
Results of the analyses of comparing a diet high in plant-derived PUFA with SFA or carbohydrates, on absolute changes in fasting glucose, insulin and HOMA-IR, based on fixed effects models
| Study characteristic | Stratification variable | Glucose | Change versus control, mmol/L (95% CI) | P value* | Insulin | Change versus control, pmol/L (95% CI) | P value* | HOMA-IR | Change versus control, units (95% CI) | P value* |
| Comparisons (n) | Comparisons (n) | Comparisons (n) | ||||||||
| Overall | 15 | −0.01 (−0.06 to 0.03) | 0.585 | 17 | −2.6 (−4.9 to −0.2) | 0.030 | 11 | −0.12 (−0.23 to −0.01) | 0.031 | |
| Replacement nutrient | SFA | 13 | −0.03 (−0.07 to 0.02) | 0.141 | 14 | −2.4 (−4.9 to 0.1) | 0.763 | 9 | −0.13 (−0.24 to −0.01) | 0.584 |
| Carbohydrates | 2 | 0.07 (−0.05 to 0.18) | 3 | −3.5 (−9.7 to 2.8) | 2 | 0.01 (−0.47 to 0.49) | ||||
| Dose–response, continuous | Per 5%En | 15 | −0.07 (−0.17 to 0.04) | 0.233 | 17 | −5.8 (−10.2 to −1.3) | 0.011 | 11 | −0.24 (−0.56 to 0.07) | 0.132 |
| PUFA dose | Tertile 1† | 5 | −0.01 (−0.08 to 0.06) | 0.203 | 5 | 1.5 (−4.6 to 7.6) | 0.020 | 2 | −0.13 (−0.54 to 0.28) | 0.031 |
| Tertile 2 | 5 | 0.02 (−0.05 to 0.09) | 6 | −0.5 (−3.9 to 2.8) | 5 | 0.02 (−0.13 to 0.17) | ||||
| Tertile 3 | 5 | −0.09 (−0.18 to 0.01) | 6 | −6.7 (−10.5 to −2.9) | 4 | −0.28 (−0.45 to −0.12) | ||||
| PUFA type | Omega-6 PUFA | 14 | −0.01 (−0.06 to 0.04) | 17 | 11 | |||||
| Omega-3 PUFA | 1 | 0 | 0 | |||||||
| Intervention duration | ≤4 weeks | 8 | 0.00 (−0.06 to 0.05) | 0.593 | 8 | −4.6 (−8.7 to −0.6) | 0.214 | 5 | −0.05 (−0.37 to 0.26) | 0.657 |
| >4 weeks | 7 | −0.03 (−0.10 to 0.04) | 9 | −1.5 (−4.4 to 1.3) | 6 | −0.13 (−0.25 to −0.01) | ||||
| Design | Crossover | 11 | −0.03 (−0.08 to 0.02) | 0.211 | 11 | −5.0 (−8.3 to −1.7) | 0.038 | 8 | −0.23 (−0.39 to −0.07) | 0.078 |
| Parallel | 4 | 0.04 (−0.05 to 0.14) | 6 | −0.1 (−3.4 to 3.2) | 3 | −0.03 (−0.18 to 0.11) | ||||
| Industry funding | No | 7 | −0.04 (−0.13 to 0.05) | 0.489 | 9 | −3.5 (−6.8 to −0.1) | 0.200 | 5 | −0.19 (−0.33 to −0.05) | 0.115 |
| Partial/full | 8 | 0.00 (−0.05 to 0.05) | 6 | −0.1 (−4.0 to 3.7) | 6 | −0.02 (−0.18 to 0.15) | ||||
| Control over food intake | Partial | 4 | 0.01 (−0.08 to 0.11) | 0.526 | 6 | −3.0 (−6.0 to 0.0) | 0.667 | 3 | −0.03 (−0.18 to 0.11) | 0.078 |
| Full | 11 | −0.02 (−0.07 to 0.03) | 11 | −1.9 (−5.8 to 2.0) | 8 | −0.23 (−0.39 to −0.07) | ||||
| Study outcome | Primary | 1 | 3 | −1.1 (−7.2 to 5.0) | 0.609 | 0 | ||||
| Not primary | 14 | −0.01 (−0.05 to 0.03) | 14 | −2.8 (−5.4 to −0.3) | 11 | |||||
| Risk of bias | 0 unclear risk | 5 | −0.05 (−0.13 to 0.02) | 0.199 | 5 | −1.7 (−4.9 to 1.5) | 0.698 | 5 | −0.11 (−0.23 to 0.01) | 0.658 |
| 1 unclear risk | 8 | 0.00 (−0.06 to 0.05) | 6 | −4.1 (−9.7 to 1.5) | 5 | −0.06 (−0.37; to 0.26) | ||||
| ≥2 unclear risk | 2 | 0.12 (−0.06 to 0.31) | 6 | −3.3 (−7.5 to 1.0) | 1 | |||||
| SFA source | Dairy | 9 | −0.02 (−0.08 to 0.04) | 0.954 | 9 | −3.7 (−6.9 to −0.4) | 0.314 | 6 | −0.14 (−0.28 to 0.00) | 0.909 |
| Plant | 3 | −0.04 (−0.12 to 0.05) | 2 | −2.2 (−8.0to 3.5) | 2 | −0.09 (−0.31 to 0.12) | ||||
| Unspecified | 1 | 3 | 2.4 (−4.7 to 9.4) | 1 |
*For subgroups, p value <0.05 indicates a significant difference in pooled effect sizes between subgroups; for continuous data, p value <0.05 indicates asignificant linear effect.
†Tertiles of PUFA difference per outcome: glucose, t1: ≤6.3; t2: 6.3≤8.4; t3: >8.4; insulin, t1: ≤6.3; t2: 6.3≤9.0; t3: >9.0; HOMA-IR, t1: ≤4.5; t2: 4.5≤8.4; t3: >8.4 En%.
En%, percentage of daily energy; HOMA-IR, homeostatic model assessment-insulin resistance; n, number; PUFA, poly-unsaturated fatty acids; SFA, saturated fatty acids.
Subgroup analyses indicated no differences between SFA and carbohydrates as replacement nutrients for changes in glucose, insulin and in HOMA-IR (p value for interaction >0.05) (table 2).
Effects of other study characteristics
An other factor that may have influenced PUFA effects was study design. Crossover studies reported reductions in fasting insulin (p value for interaction effect between groups <0.05), whereas parallel studies did not. Subgroup analyses by risk of bias (no unclear risk, 1 unclear risk or ≥2 unclear risk), SFA source (dairy or plant), intervention duration (≤4 weeks or >4 weeks), study funding source (partial/full or no industry funding), control over food intake (full or partial), or study objective (glucose, insulin, HOMA-IR as primary outcome or not) did not reveal significant heterogeneity (table 2).
Discussion
In the present meta-analysis of 13 randomised controlled feeding trials, we found that plant-derived PUFA as isocaloric replacement for SFA or carbohydrates reduced fasting insulin and HOMA-IR. In subgroup analyses of studies with the highest PUFA dose, effects on fasting insulin and HOMA-IR were larger.
In an earlier meta-analysis, Imamura et al 16 found that isocalorically replacing SFA with PUFA lowered fasting glucose and HOMA-IR, but did not lower fasting insulin. This seems at odds with our results, but an important difference in methodology is that the analysis of Imamura et al also included RCTs that were not designed to investigate a replacement of SFA or carbohydrates with PUFA. Instead, Imamura et al modelled the available data on macronutrient exchanges from a large set of trials on fasting glucose (N=99) and insulin (N=90). In this approach also trials with marginal differences in PUFA intake, for example those designed to compare effects of carbohydrates with protein, contributed to the estimated effects of PUFA. Our meta-analysis did not include such trials, as it was designed to specifically study differences between PUFA and SFA or carbohydrates; thus we did not need statistical adjustments for differences between treatments in MUFA, protein, or dietary fibre. An advantage of the approach of Imamura is that it was based on more data, but it may be that estimates from studies with small differences in PUFA dose were more attenuated than those from studies with large differences in PUFA intake, as suggested by our data. This is also supported by an analysis of Imamura of a subset of 29 trials that specifically aimed to achieve major variation in PUFA. In this analysis, when replacing 5 %En from SFA with PUFA lowered fasting glucose by 0.07 mmol/L instead of the 0.04 mmol/L in their overall estimates. This is well in line with our continuous analysis in which glucose was lowered by 0.07 mmol/L when replacing 5 %En SFA with PUFA. In the same subgroup analysis of Imamura, fasting insulin was 1.2 pmol/L lower when replacing 5 %En SFA with PUFA, instead of 0.05 pmol/L in their overall estimate. However, this was not statistically significant, and still less than the lowering of 5.8 pmol/L when replacing 5 %En SFA with PUFA in our continuous analysis.
Our analysis only included non-diabetic populations, as no trials in patients with diabetes were identified that met our inclusion criteria. The results of the meta-analysis of Imamura et al suggested that effects of PUFA are stronger in a subset of trials with patients with diabetes. This could be the result of higher baseline glucose and insulin levels in diabetes, providing more room for improvement, but data from well-controlled trials designed to study PUFA are apparently lacking for this population.
Our findings are in line with earlier cohort studies using dietary intake data12 13 and biomarker data,14 15 and together suggest a protective effect of total PUFA or omega-6 PUFA on diabetes risk in non-diabetic populations. A potential mechanism that may explain the effects of PUFA on glucose and insulin metabolism is that a higher proportion of PUFA in cell membranes is linked to changes in membrane fluidity, ion permeability, enzyme activity and insulin receptors, which may favorably affect insulin sensitivity.29 30 Alternatively, replacement of dietary SFA with PUFA may result in a lower accumulation of liver fat,31 which is a major determinant of diabetes risk.32
It should be noted that the trials in our analysis provided limited data on the impact of the nutrient replacing plant-derived PUFA. Most trials compared PUFA with SFA, while few studies compared PUFA with carbohydrates. In post-hoc analyses, we did not observe differences between dairy or plant-derived SFA, as was suggested by earlier cohort studies.33 It remains plausible that the type of SFA (eg, stearic or palmitic acid) may influence metabolic effects,6 and also carbohydrates from refined sources or added sugars may have different effects than carbohydrates from whole grains.34 In addition, all interventions in the meta-analysis supplemented plant-derived oils, in which PUFA generally is a mixture of omega-6 and omega-3, and never solely omega-6 and omega-3. Only one trial in our analysis studied effects of primarily plant-derived omega-3 PUFA (ALA), on markers of glucose metabolism and insulin sensitivity; thus, potential differences between omega-3 and omega-6 plant-derived PUFAs could not be studied.
A major limitation of the current study is that data were lacking to provide estimates of effects on insulin sensitivity by gold-standard techniques or on insulin or glucose metabolism after a meal challenge, which may be more informative for metabolic status and predicting diabetes risk. Also, the evidence was considered indirect according to the GRADE approach, as a majority of the individual studies were not primarily designed to investigate effects on fasting glucose, insulin, and HOMA-IR. And, most individual studies did not report statistically significant effects on these endpoints. Also, the relatively low number of studies limits the validity and interpretation of our subgroup analyses. The strength of our analysis is that it included only high-quality randomised controlled feeding trials, in participants with stable physical activity, body weight and medication use throughout the trials. The confidence in the effects estimate according to the GRADE approach was moderate (3 out of 4 stars), and our findings are consistent with earlier meta-analyses of RCTs and observational studies.
The effects observed in this analysis are modest, but may be relevant from a public health perspective, in particular for reducing the risk of developing diabetes on population scale. Differences in fasting glucose of 0.5 mmol/L (~5 times higher than found in the trials with higher PUFA intake in our meta-analysis) are associated with a 10% increased risk of coronary heart disease35 and a two to threefold increased risk of type 2 diabetes.36 37 Fasting insulin and HOMA-IR are related to diabetes risk, per 0.5 unit difference in HOMA-IR (~4 times the current observations), risk for diabetes increases with 20%–80%.36 38
In conclusion, this meta-analysis of randomised controlled trials on increasing intake of plant-derived PUFA indicated that PUFA as an isocaloric replacement for SFA or carbohydrates probably reduces fasting insulin and HOMA-IR in populations without diabetes. Sufficiently powered studies should further establish effects of PUFA on insulin sensitivity, also in populations with diabetes.
Acknowledgments
We acknowledge the following individuals for provision of additional information: Dr Marie-Pierre St-Onge at Columbia University Medical Center, New York, USA; Professor Ursula Schwab at Department of Clinical Nutrition, Institute of Public Health and Clinical Nutrition, University of Eastern Finland, Kuopio, Finland. We would like to thank Dr Rouyanne Ras and Dr Harry Hiemstra for their contribution to the methodology of the study and the data analysis.
Footnotes
Contributors: AJW, WAMB, MA conceived the study. AJW, WAMB, PLZ, JMG, IAB, MA designed the study. AJW analyzed the data and drafted the manuscript. All authors contributed to the writing of the manuscript, agree with the manuscript’s results, conclusions and final version of the manuscript. All authors have read and confirm that they meet ICMJE criteria for authorship.
Funding: The authors have not declared a specific grant for this research from any funding agency in the public, commercial or not-for-profit sectors.
Competing interests: The authors of this manuscript have the following competing interests: AJW, WAMB, PLZ, MA are employed by Unilever, Vlaardingen, the Netherlands. Unilever markets food products made of vegetable oils such as dressings. Unilever has divested its spreads business, which is since July 2, 2018 operating under the name Upfield™. JMG received research funding from Unilever for studies on fatty acids and cardiovascular disease. IAB supervises a student whose project is partly funded by Unilever.
Patient consent for publication: Not required.
Provenance and peer review: Not commissioned; externally peer reviewed.
Data sharing statement: Data are provided in supplemental files. No additional data are available.
References
- 1. International Diabetes Federation IDF diabetes atlas. 8th edn Brussels, Belgium, 2017. [Google Scholar]
- 2. Schellenberg ES, Dryden DM, Vandermeer B, et al. Lifestyle interventions for patients with and at risk for type 2 diabetes: a systematic review and meta-analysis. Ann Intern Med 2013;159:543–51. 10.7326/0003-4819-159-8-201310150-00007 [DOI] [PubMed] [Google Scholar]
- 3. Franz MJ, Powers MA, Leontos C, et al. The evidence for medical nutrition therapy for type 1 and type 2 diabetes in adults. J Am Diet Assoc 2010;110:1852–89. 10.1016/j.jada.2010.09.014 [DOI] [PubMed] [Google Scholar]
- 4. Ley SH, Hamdy O, Mohan V, et al. Prevention and management of type 2 diabetes: dietary components and nutritional strategies. The Lancet 2014;383:1999–2007. 10.1016/S0140-6736(14)60613-9 [DOI] [PMC free article] [PubMed] [Google Scholar]
- 5. FAO/WHO Fats and fatty acids in human nutrition. Report of an expert consultation. Geneva, 2010. [PubMed] [Google Scholar]
- 6. Mensink RP. Effects of saturated fatty acids on serum lipids and lipoproteins: a systematic review and regression analysis : World Health Organization. Geneva, Switzerland: WHO Document Production Services, 2016. [Google Scholar]
- 7. Hooper L, Martin N, Abdelhamid A. Reduction in saturated fat intake for cardiovascular disease. Cochrane Database Syst Rev 2015;10:CD011737. [DOI] [PubMed] [Google Scholar]
- 8. Jakobsen MU, O'Reilly EJ, Heitmann BL, et al. Major types of dietary fat and risk of coronary heart disease: a pooled analysis of 11 cohort studies. Am J Clin Nutr 2009;89:1425–32. 10.3945/ajcn.2008.27124 [DOI] [PMC free article] [PubMed] [Google Scholar]
- 9. Hulshof KF, van Erp-Baart MA, Anttolainen M, et al. Intake of fatty acids in Western Europe with emphasis on trans fatty acids: the TRANSFAIR study. Eur J Clin Nutr 1999;53:143–57. 10.1038/sj.ejcn.1600692 [DOI] [PubMed] [Google Scholar]
- 10. Hartweg J, Perera R, Montori V. Omega-3 polyunsaturated fatty acids (PUFA) for type 2 diabetes mellitus. Cochrane Database Syst Rev 2008;1:CD003205. [DOI] [PMC free article] [PubMed] [Google Scholar]
- 11. Wu JH, Micha R, Imamura F, et al. Omega-3 fatty acids and incident type 2 diabetes: a systematic review and meta-analysis. Br J Nutr 2012;107 S214–27. 10.1017/S0007114512001602 [DOI] [PMC free article] [PubMed] [Google Scholar]
- 12. Meyer KA, Kushi LH, Jacobs DR, et al. Dietary fat and incidence of type 2 diabetes in older Iowa women. Diabetes Care 2001;24:1528–35. 10.2337/diacare.24.9.1528 [DOI] [PubMed] [Google Scholar]
- 13. Salmerón J, Hu FB, Manson JE, et al. Dietary fat intake and risk of type 2 diabetes in women. Am J Clin Nutr 2001;73:1019–26. 10.1093/ajcn/73.6.1019 [DOI] [PubMed] [Google Scholar]
- 14. Forouhi NG, Imamura F, Sharp SJ, et al. Association of plasma phospholipid n-3 and n-6 polyunsaturated fatty acids with type 2 diabetes: the EPIC-InterAct case-cohort study. PLoS Med 2016;13:e1002094 10.1371/journal.pmed.1002094 [DOI] [PMC free article] [PubMed] [Google Scholar]
- 15. Wu JHY, Marklund M, Imamura F, et al. Omega-6 fatty acid biomarkers and incident type 2 diabetes: pooled analysis of individual-level data for 39 740 adults from 20 prospective cohort studies. Lancet Diabetes Endocrinol 2017;5:965–74. 10.1016/S2213-8587(17)30307-8 [DOI] [PMC free article] [PubMed] [Google Scholar]
- 16. Imamura F, Micha R, Wu JH, et al. Effects of saturated fat, polyunsaturated fat, monounsaturated fat, and carbohydrate on glucose-insulin homeostasis: a systematic review and meta-analysis of randomised controlled feeding trials. PLoS Med 2016;13:e1002087 10.1371/journal.pmed.1002087 [DOI] [PMC free article] [PubMed] [Google Scholar]
- 17. Wanders AJ, Blom WA, Alssema M, 2017. Plant based polyunsaturated fatty acids (PUFA) and markers of glucose and insulin metabolism: a meta-analysis of randomized controlled feeding trials. prospero 2017 CRD42017071923. Available: http://www.crd.york.ac.uk/PROSPERO/display_record.php?ID=CRD42017071923 [DOI] [PMC free article] [PubMed]
- 18. Higgins JPT, Green S, Cochrane handbook for systematic reviews of interventions version 5.1.0 [updated March 2011]. The Cochrane Collaboration, 2011. [Google Scholar]
- 19. Schwab US, Karhapaa P, Sarkkinen ES. Metabolic effects of diets rich in saturated and omega-6 polyunsaturated fatty acids in healthy young females. Diabetes Nutrition Metabolism 1997;10:35–8. [Google Scholar]
- 20. St-Onge MP, Newcomer BR, Buchthal S, et al. Intramyocellular lipid content is lower with a low-fat diet than with high-fat diets, but that may not be relevant for health. Am J Clin Nutr 2007;86:1316–22. 10.1093/ajcn/86.5.1316 [DOI] [PubMed] [Google Scholar]
- 21. Bhathena SJ, Berlin E, Judd J, et al. Hormones regulating lipid and carbohydrate metabolism in premenopausal women: modulation by dietary lipids. Am J Clin Nutr 1989;49:752–7. 10.1093/ajcn/49.5.752 [DOI] [PubMed] [Google Scholar]
- 22. Vafeiadou K, Weech M, Altowaijri H, et al. Replacement of saturated with unsaturated fats had no impact on vascular function but beneficial effects on lipid biomarkers, E-selectin, and blood pressure: results from the randomized, controlled dietary intervention and vascular function (DIVAS) study. Am J Clin Nutr 2015;102:40–8. 10.3945/ajcn.114.097089 [DOI] [PubMed] [Google Scholar]
- 23. Vega-López S, Ausman LM, Jalbert SM, et al. Palm and partially hydrogenated soybean oils adversely alter lipoprotein profiles compared with soybean and canola oils in moderately hyperlipidemic subjects. Am J Clin Nutr 2006;84:54–62. 10.1093/ajcn/84.1.54 [DOI] [PubMed] [Google Scholar]
- 24. Matthews DR, Hosker JP, Rudenski AS, et al. Homeostasis model assessment: insulin resistance and beta-cell function from fasting plasma glucose and insulin concentrations in man. Diabetologia 1985;28:412–9. 10.1007/BF00280883 [DOI] [PubMed] [Google Scholar]
- 25. Ras RT, Hiemstra H, Lin Y, et al. Consumption of plant sterol-enriched foods and effects on plasma plant sterol concentrations--a meta-analysis of randomized controlled studies. Atherosclerosis 2013;230:336–46. 10.1016/j.atherosclerosis.2013.08.012 [DOI] [PubMed] [Google Scholar]
- 26. Wan X, Wang W, Liu J, et al. Estimating the sample mean and standard deviation from the sample size, median, range and/or interquartile range. BMC Med Res Methodol 2014;14:135 10.1186/1471-2288-14-135 [DOI] [PMC free article] [PubMed] [Google Scholar]
- 27. Bjermo H, Iggman D, Kullberg J, et al. Effects of n-6 PUFAs compared with SFAs on liver fat, lipoproteins, and inflammation in abdominal obesity: a randomized controlled trial. Am J Clin Nutr 2012;95:1003–12. 10.3945/ajcn.111.030114 [DOI] [PubMed] [Google Scholar]
- 28. Kriketos AD, Robertson RM, Sharp TA, et al. Role of weight loss and polyunsaturated fatty acids in improving metabolic fitness in moderately obese, moderately hypertensive subjects. J Hypertens 2001;19:1745–54. 10.1097/00004872-200110000-00007 [DOI] [PubMed] [Google Scholar]
- 29. Ginsberg BH, Brown TJ, Simon I, et al. Effect of the membrane lipid environment on the properties of insulin receptors. Diabetes 1981;30:773–80. 10.2337/diab.30.9.773 [DOI] [PubMed] [Google Scholar]
- 30. Risérus U, Willett WC, Hu FB. Dietary fats and prevention of type 2 diabetes. Prog Lipid Res 2009;48:44–51. 10.1016/j.plipres.2008.10.002 [DOI] [PMC free article] [PubMed] [Google Scholar]
- 31. Rosqvist F, Iggman D, Kullberg J, et al. Overfeeding polyunsaturated and saturated fat causes distinct effects on liver and visceral fat accumulation in humans. Diabetes 2014;63:2356–68. 10.2337/db13-1622 [DOI] [PubMed] [Google Scholar]
- 32. Ballestri S, Zona S, Targher G, et al. Nonalcoholic fatty liver disease is associated with an almost twofold increased risk of incident type 2 diabetes and metabolic syndrome. Evidence from a systematic review and meta-analysis. J Gastroenterol Hepatol 2016;31:936–44. 10.1111/jgh.13264 [DOI] [PubMed] [Google Scholar]
- 33. de Oliveira Otto MC, Mozaffarian D, Kromhout D, et al. Dietary intake of saturated fat by food source and incident cardiovascular disease: the multi-ethnic study of atherosclerosis. Am J Clin Nutr 2012;96:397–404. 10.3945/ajcn.112.037770 [DOI] [PMC free article] [PubMed] [Google Scholar]
- 34. Li Y, Hruby A, Bernstein AM, et al. Saturated Fats Compared With Unsaturated Fats and Sources of Carbohydrates in Relation to Risk of Coronary Heart Disease: A Prospective Cohort Study. J Am Coll Cardiol 2015;66:1538–48. 10.1016/j.jacc.2015.07.055 [DOI] [PMC free article] [PubMed] [Google Scholar]
- 35. Emerging Risk Factors Collaboration, Sarwar N, Gao P, et al. Diabetes mellitus, fasting blood glucose concentration, and risk of vascular disease: a collaborative meta-analysis of 102 prospective studies. Lancet 2010;375:2215–22. 10.1016/S0140-6736(10)60484-9 [DOI] [PMC free article] [PubMed] [Google Scholar]
- 36. Ruijgrok C, Dekker JM, Beulens JW, et al. Size and shape of the associations of glucose, HbA1c, insulin and HOMA-IR with incident type 2 diabetes: the Hoorn Study. Diabetologia 2018;61:93–100. 10.1007/s00125-017-4452-7 [DOI] [PMC free article] [PubMed] [Google Scholar]
- 37. Soulimane S, Simon D, Shaw JE, et al. Comparing incident diabetes as defined by fasting plasma glucose or by HbA(1c). The AusDiab, Inter99 and DESIR studies. Diabet Med 2011;28:1311–8. 10.1111/j.1464-5491.2011.03403.x [DOI] [PubMed] [Google Scholar]
- 38. Welsh P, Preiss D, Lloyd SM, et al. Contrasting associations of insulin resistance with diabetes, cardiovascular disease and all-cause mortality in the elderly: prosper long-term follow-up. Diabetologia 2014;57:2513–20. 10.1007/s00125-014-3383-9 [DOI] [PubMed] [Google Scholar]
- 39. Jones DY, Judd JT, Taylor PR, et al. Influence of caloric contribution and saturation of dietary fat on plasma lipids in premenopausal women. Am J Clin Nutr 1987;45:1451–6. 10.1093/ajcn/45.6.1451 [DOI] [PubMed] [Google Scholar]
- 40. Brassard D, Tessier-Grenier M, Allaire J, et al. Comparison of the impact of SFAs from cheese and butter on cardiometabolic risk factors: a randomized controlled trial. Am J Clin Nutr 2017;105:800–9. 10.3945/ajcn.116.150300 [DOI] [PubMed] [Google Scholar]
- 41. Gillingham LG, Gustafson JA, Han SY, et al. High-oleic rapeseed (canola) and flaxseed oils modulate serum lipids and inflammatory biomarkers in hypercholesterolaemic subjects. Br J Nutr 2011;105:417–27. 10.1017/S0007114510003697 [DOI] [PubMed] [Google Scholar]
- 42. Karupaiah T, Chuah KA, Chinna K, et al. Comparing effects of soybean oil- and palm olein-based mayonnaise consumption on the plasma lipid and lipoprotein profiles in human subjects: a double-blind randomized controlled trial with cross-over design. Lipids Health Dis 2016;15:131 10.1186/s12944-016-0301-9 [DOI] [PMC free article] [PubMed] [Google Scholar]
- 43. Keogh JB, Grieger JA, Noakes M, et al. Flow-mediated dilatation is impaired by a High–Saturated fat diet but not by a high-carbohydrate diet. Arterioscler Thromb Vasc Biol 2005;25:1274–9. 10.1161/01.ATV.0000163185.28245.a1 [DOI] [PubMed] [Google Scholar]
- 44. Lichtenstein AH, Erkkilä AT, Lamarche B, et al. Influence of hydrogenated fat and butter on CVD risk factors: remnant-like particles, glucose and insulin, blood pressure and C-reactive protein. Atherosclerosis 2003;171:97–107. 10.1016/j.atherosclerosis.2003.07.005 [DOI] [PubMed] [Google Scholar]
- 45. Weech M, Vafeiadou K, Hasaj M, et al. Development of a food-exchange model to replace saturated fat with MUFAs and n-6 PUFAs in adults at moderate cardiovascular risk. J Nutr 2014;144:846–55. 10.3945/jn.114.190645 [DOI] [PubMed] [Google Scholar]
- 46. Lichtenstein AH, Ausman LM, Jalbert SM, et al. Effects of different forms of dietary hydrogenated fats on serum lipoprotein cholesterol levels. N Engl J Med 1999;340:1933–40. 10.1056/NEJM199906243402501 [DOI] [PubMed] [Google Scholar]
Associated Data
This section collects any data citations, data availability statements, or supplementary materials included in this article.
Supplementary Materials
bmjdrc-2018-000585supp001.docx (239.4KB, docx)