

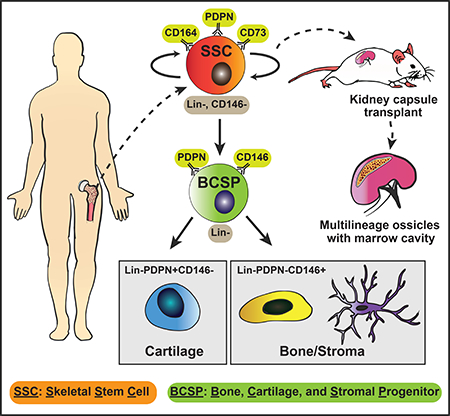
Summary
Stem cell regulation and hierarchical organization of human skeletal progenitors remain largely unexplored. Here, we report the isolation of a self-renewing and multipotent human skeletal stem cell (hSSC) that generates progenitors of bone, cartilage, and stroma, but not fat. Self-renewing and multipotent hSSCs are present in fetal and adult bones and can also be derived from BMP2-treated human adipose stroma (B-HAS) and induced pluripotent stem cells (iPSCs). Gene expression analysis of individual hSSCs reveals overall similarity between hSSCs obtained from different sources and partially explains skewed differentiation towards cartilage in fetal and iPSC-derived hSSCs. hSSCs undergo local expansion in response to acute skeletal injury. In addition, hSSC-derived stroma can maintain human hematopoietic stem cells (hHSCs) in serum-free culture conditions. Finally, we combine gene expression and epigenetic data of mouse skeletal stem cells (mSSCs) and hSSCs to identify evolutionarily conserved and divergent pathways driving SSC-mediated skeletogenesis.
In Brief
Identification of a human skeletal stem cell reveals conserved and species-specific pathways in skeletal development and response to injury and will guide future regenerative approaches.
Graphicla Abstract:
Introduction
The human skeleton is a composite of diverse tissue types including bone, cartilage, fat, fibroblasts, nerves, blood vessels, and hematopoietic cells. Each tissue type in the skeleton is generated and maintained by the precise regulation of distinct stem cells that possess the ability to replenish themselves and give rise to multiple, nonoverlapping cell-lineages. Among the most well-characterized stem cells in the skeleton is the hematopoietic stem cell (HSC), marked by a combination of cell-surface proteins and defined by its functional ability to form colonies in vitro and serially reconstitute long-term hematopoiesis in conditioned hosts (Baum et al., 1992; Spangrude et al., 1988). Similarly, a significant amount of effort has been devoted towards identifying the cellular origins of the non-hematopoietic lineages in skeletal tissue, such as bone, cartilage, vascular endothelium, and stroma (Chan et al., 2015a; Marecic et al., 2015; Mendez-Ferrer et al., 2010; Worthley et al., 2015; Zhou et al., 2014). However, the absence of reliable cell-surface markers, tissue dissociation protocols, and functional stemness assays has hampered the discovery of putative stem cells in the human skeleton.
Early efforts to isolate non-hematopoietic stem cells in the bone relied on the ability of bone marrow cells to adhere to plastic plates. However, these cultures of “mesenchymal stem cells” contain heterogeneous mixtures of cells with indeterminate potencies and promiscuous contribution to many overlapping lineages, such as bone, cartilage, fat, muscle, fibroblast, endothelial cells, and stroma. Likely, these cells represent a population comprised of multiple types of distinct stem cells rather than a uniform purified skeletal stem cell (SSC). Identification of several specific cell-surface proteins has improved the enrichment for skeletogenic activity in mesenchymal cultures (Lv et al., 2014). THY1 (CD90), ENG (CD105), NT5E (CD73), and CD44 broadly label bone marrow stromal cells with variable colony-formation ability and differentiation to osteo-, chondro-, and adipo-lineages (Lange et al., 2005). NGFR (CD271) and MCAM (CD146) additionally select for cells with higher colony-formation ability and multilineage differentiation (Quirici et al., 2002; Sorrentino et al., 2008). CD146+ cells can also recreate a hematopoiesis-supportive human ossicle in a mouse (Sacchetti et al., 2007). Similarly, STRO-1 and STRO-3 are expressed in cells capable of supporting human hematopoietic stem cells for an extended time in the presence of serum (Bensidhoum et al., 2004; Simmons and Torok-Storb, 1991). Still, cells expressing these markers are heterogeneous in their function, and the true nature of a functional human skeletal stem cell (hSSC) hierarchy in the bone marrow is missing.
Our and others’ evidence from lineage-tracing and clonal analysis in mice supports the existence of mouse SSCs (mSSCs) that exclusively give rise to bone, cartilage, and stroma, but not fat, muscle, fibroblasts, or hematopoietic tissue (Chan et al., 2015a; Marecic et al., 2015; Worthley et al., 2015). We hypothesized that similar SSCs may exist in humans. In this study, we report the isolation of a human SSC (hSSC) capable of self-renewal and multilineage differentiation to bone, cartilage, and stroma. We demonstrate that these cells can be isolated from various human tissue sources and quantify their response to fracture. Cross-species comparison of hSSCs with our mSSCs additionally provides insights into convergent and divergent skeletal evolution.
Results
Single-cell transcriptome analysis of growth plate and diaphysis reveals markers for hSSC isolation
As described above, our findings in mice (Chan et al., 2015a; Marecic et al., 2015) suggested that similar types of lineally related skeletal stem and progenitor cells may also be prospectively isolated by fluorescence-activated cell sorting (FACS) from human skeletal tissue. We reported a high frequency of clonal mSSC-derived cell expansion in the growth plate of the mouse bone by lineage-tracing using Actin-CreER x Rainbow mice (Chan et al., 2015a). Therefore, we performed single-cell RNA-sequencing (scRNA-seq) of the growth plate and diaphysis of a 17-week human fetal femur to identify individual cells with the greatest homology in terms of gene expression to the mSSC and the mouse bone, cartilage, stromal progenitor (mBCSP), which is immediately downstream of the mSSCs in the differentiation hierarchy (Figure 1, Figure 4 right panel) (Chan et al., 2013; Chan et al., 2015a; Fleming et al., 2015). We first microdissected the fetal bone into seven regions based on morphological differences exhibited by the cells in each region after Movat’s pentachrome (MP) staining (Figure 1A, B) and intravital staining with Hoechst and Calcein-AM (Figure 1C). These regions consisted of the two halves of the proliferative zone (P1 and P2), two halves of the pre-hypertrophic zone (p-H1 and p-H2), two halves of the hypertrophic zone (H1 and H2), and the single diaphyseal zone (D) (Figure 1C). We then mechanically and enzymatically dissociated these tissue regions separately into single-cell suspensions and sorted non-hematopoietic CD45-CD235- cells from each region into 96-well plates for scRNA-seq using Smart-seq2 (Figure 1D–E) (Picelli et al., 2014). To query our scRNA-seq data and identify rare cells with stem cell-like mRNA expression, we used the Gene Expression Commons (GEXC) (Seita et al., 2012) to search for genes specifically expressed in mSSCs and mBCSPs (Chan et al., 2015a), but not their downstream progeny, and created a gene set of 76 mSSC/mBCSP-specific genes and their human orthologs (Supplemental Table 1). We then calculated the percentage of transcriptionally active human orthologs to mSSC/mBCSP-specific genes for each sequenced single cell in each region. In contrast to all other regions of the bone, the cells within the second half of the pre-hypertrophic zone (p-H2) and the first half of the hypertrophic zone of the growth plate (H1) showed significantly higher expression of human orthologs to mSSC/mBCSP-specific genes (Figure 1F; Supplemental Figure 1A). A comparative analysis of the most variable cell-surface proteins across the different regions, particularly those that were significantly enriched or depleted within the hypertrophic zone (H1) of the growth plate compared to the diaphysis (D), unveiled a list of candidate markers that could provide a basis for antibody-mediated isolation of human growth plate cells by FACS (Supplemental Figure 1B).
Figure 1. Single-cell analysis of skeletal growth plate zones.

A) A representative cross-section of a femur from an adult (8–12 weeks-old) Actin-CreER X Rainbow mouse showing sites of clonal skeletogenesis in the growth plate (left). Scale: 500 μm. Homologous regions are shown in cross-section of a femoral head from a 17-week-old human fetus stained with Movat’s pentachrome (MP) (right). Scale: 2 mm.
B) Longitudinal cross-section of a femurhead from a 17-week-old human fetus stained with MP (left) alongside a magnified view of the growth plate (middle); yellow: bone, blue: cartilage, purple: marrow. Diagram of morphologically distinct zones in the growth plate of 17-week-old human fetal bone; P: proliferative zone, p-H: pre-hypertrophic zone, H: hypertrophic zone, D: diaphyseal zone (right). Scale: 100 μm.
C) Whole tissue stain of a viable 17-week-old human fetal femur with Hoechst and Calcein-AM intravital dyes (top; scale: 5 mm) revealing morphologically distinct regions (bottom; scale: 500 μm) corresponding to the six growth plate zones (P1, P2, p-H1, p-H2, H1, and H2) and the diaphyseal zone (D).
D) Experimental strategy for identifying human SSCs using scRNA-seq and a database of conserved SSC-specific genes.
E) Heatmap of most variable genes detected by scRNA-seq analysis of cells isolated from dissected human growth plate zones as shown in C.
F) Bar chart showing percent of human orthologs to mSSC/mBCSP-specific genes expressed in human CD45-CD235a- single cells for each zone described in C. Red trendline shows percent enrichment. Statistical significance for zones with highest enrichment for human orthologs to mSSC/BCSP-specific genes was calculated by one-way ANOVA with post-hoc Tukey HSD test with proliferative 1 (P1) as reference at an α-level of 0.01 (left). **p-value<0.005, ****p-value<0.0005; ns: not significant. Average transcripts per million (TPM) for five surface markers identified by scRNA-seq-enrichment-screen followed by empirical testing by FACS: PDPN, CD146 (MCAM), CD73 (NT5E), CD164, and THY1 (right). n=4.
Figure 4. Osteogenic hSSCs are locally amplified in response to skeletal injury.

A) Injured (n=10) and uninjured (n=3) human bone-specimens were obtained and hSSCs were isolated. Uninjured age group: 16–30 years-old (yo); injured age groups: young: 20–40 yo (n=3), middle-aged: 41–70 yo (n=3), and aged: 71–90 yo (n=4) (left-right). Cells were isolated by FACS (top left and right), plated, differentiated, and stained using Alizarin Red. Brightfield and corresponding Alizarin Red stained images are shown in bottom left and bottom right panels, respectively. Scale: 100 μm.
B) Postnatal day 5 NSG mouse pup host (top left). Phalanx of 18-week-old human fetus (top right). Human fetal phalanges from 18-week-old fetuses were transplanted subcutaneously under the dorsum of day 5 NSG mouse pups. Fractures were introduced at 4 weeks post-transplantation (middle left and right panels) within the engrafted human phalanx (PP: proximal phalanx, MP: middle phalanx, DP: distal phalanx; defect indicated by black circle in MP region). After a further 2 weeks post-injury the phalanges were explanted for analysis (n=12). For both uninjured and injured samples, explants were digested, hSSC were purified by FACS, plated, differentiated for 2 weeks, and then stained using Alizarin Red (bottom).
C) Comparison of uninjured (left) and injured (right) human xenografts. Each panel shows the corresponding FACS plots with gating strategy to isolate hBCSPs and hSSCs (top). Purified hBCSPs and hSSCs were plated, differentiated for 2 weeks, and stained using Alizarin Red (bottom). Scale: 100 μm.
D) Bar chart showing the effect of injury on the hSSC populations in both the primary human samples (top) (uninjured, n=3; injured, n=10) and the human xenograft model (n=12) (bottom).
<0.05, **p<0.01.
Through flow-cytometric analysis of those candidate cell-surface markers against which antibodies were available, we identified a panel including PTPRC (CD45), GYPA (CD235a), TEK (TIE2), PECAM1 (CD31), PDPN, MCAM (CD146), NT5E (CD73), CD164, and THY1 (CD90) that separate growth plate zone cells into distinct subpopulations (Supplemental Figure 1C). Immunofluorescent (IF) staining against PDPN, CD146, CD73, and CD164 confirmed heterogeneity in the expression of these markers among the cells within the growth plate and the diaphysis. PDPN was primarily expressed in the growth plate and hypertrophic zone (pH2, H1/H2), while CD146 was mainly expressed in the diaphyseal zone (D) (Supplemental Figure 1D, middle panel). In addition, a PDPN+CD146+ cell population was also present in the growth plate (p-H2, H1/H2) (Supplemental Figure 1D, middle panel). CD73 and CD164 were both enriched in the growth plate (p-H2, H1/H2) and further divided cells from this region into subpopulations based on the presence or absence of these two cell-surface markers (Supplemental Figure 1D, right panel). Revisiting the scRNA-seq data, we found that PDPN, NT5E, and CD164 transcripts were enriched and MCAM transcripts were depleted in the p-H2/H1 zones of the growth plate—a region with high homology to the mSSC/mBCSP in terms of mRNA expression. This contrasted with the regions that showed low homology to the mSSC/mBCSP, such as the diaphysis (D) (Figure 1F; Supplemental Figure 1E-F). Moreover, by grouping cells based on expression of specific genes, we observed that PDPN+MCAM-NT5E+CD164+ single cells were enriched in the growth plate (p-H2, H1/H2), depleted in the diaphysis (D), and comprised a larger percentage of the cells that showed high degree of homology to mSSC/mBCSP (Supplemental Figure 1E). Consistent with these findings, the p-H2 and H1 zones of the growth plate had a high frequency of non-hematopoietic (CD45-CD235a-), non-endothelial (TIE2-CD31-) PDPN+CD146-CD73+CD164+ cells compared to other zones by flow cytometry (Supplemental Figure 1C). Therefore, we hypothesized that PDPN+CD146-CD73+CD164+ cells in the bone are likely enriched in hSSCs.
Prospective isolation and characterization of PDPN+CD146-CD73+CD164+ hSSCs
To assess the intrinsic skeletogenic potential of distinct human fetal growth plate cell-subsets in vivo, we used FACS to isolate seven distinct non-endothelial, non-hematopoietic cell populations based on their differential surface expression of PDPN, CD146, CD73, CD164, and THY1 and transplanted each population individually under the renal capsule of 8–12-week-old NOD scid gamma (NSG) immunodeficient mice (Figure 2A–E, Supplemental Figure 2) as described earlier (Chan et al., 2015a). The xenografts in the transplanted kidneys were explanted and sectioned for MP staining after 4 weeks of development. The staining revealed whether the transplanted cell-subset was unipotent (capable of forming only bone or only cartilage) or multipotent (capable of forming bone, cartilage and stroma). Two of the seven cell-subsets were multipotent and capable of endochondral (bone and cartilage) ossification—a PDPN+CD146-CD73+CD164+ and a PDPN+CD146lo population (Figure 2C-c–d, 2E; Supplemental Figure 2). The rest of the five cell-subsets were unipotent and could be divided into two categories: 1) two osteogenic subsets, a PDPN-CD146+THY1hi and a PDPN-CD146+THY1lo population—hereafter collectively referred to as the human osteoprogenitor (hOP) (Figure 2C-a–b, 2E), and 2) three chondrogenic subsets, a PDPN+CD146-CD73-CD164+, a PDPN+CD146-CD73+CD164-, and a PDPN+CD146-CD73-CD164- population—hereafter collectively referred to as the human chondroprogenitors (hCPs) (Figure 2C-e–g, 2E). Immunostaining with human nuclear antigen confirmed that human skeletal progenitor-derived ossicles in the renal capsule were indeed of human origin (Figure 2D; Supplemental Figure 2B). We next measured the ability of these distinct populations to form colonies in vitro. Out of the two multipotent subsets (see above), the PDPN+CD146-CD73+CD164+ subset gave rise to a higher frequency of colony forming units (CFUs). We next asked whether the different cell-subsets were capable of in vitro self-renewal by testing their ability to serially generate CFUs. Strikingly, the multipotent PDPN+CD146-CD73+CD164+ cell subset was capable of CFU formation after secondary and tertiary serial transfer indicating self-renewal capacity (Figure 2F, G). In addition, colonies derived from the PDPN+CD146-CD73+CD164+ cell subset were composed of cells of both cartilage and bone lineages as shown by positive immunostaining for cartilage (Collagen type II) and osteoblast markers (Osteocalcin) (Figure 2H). On the contrary, CD146+ cells, which are commonly associated with mesenchymal stem cells (Lv et al., 2014; Sacchetti et al., 2007), displayed reduced colony size and frequency compared to PDPN+CD146-CD73+CD164+ cells as observed by light microscopy and flow cytometry (Supplemental Figure 2F-G).
Figure 2. Prospective isolation of PDPN+CD146-CD73+CD164+ hSSCs.

A) Experimental strategy for isolation and in vivo functional characterization of hSSCs and progenitors by transplantation beneath the renal capsules of immunodeficient NSG mice. n=12.
B) Gating scheme for the isolation of distinct skeletal populations based on the varying expression of CD45, CD235, TIE2, CD31, PDPN, CD146, CD73, and CD164 using FACS.
C) MP stain of explanted human skeletal progenitor-derived grafts one month after subcapsular transplant into NSG mice; yellow: bone, blue: cartilage, purple: marrow. Stained cross-sections of the grafts that were derived from (a) PDPN-CD146+THY1+, (b) PDPN-CD146+THY1-, (c) PDPN+CD146-CD73+CD164+, (d) PDPN+CD146lo, (e) PDPN+CD146-CD73-CD164-, (f) PDPN+CD146-CD73-CD164+, and (g) PDPN+CD146-CD73+CD164- cells, respectively. Scale: 200 μm.
D) Images showing immunohistochemical (IHC) staining for human nuclear antigen in (i) adjacent tissue cross-section as seen in C-a, and (ii) adjacent tissue cross-section as seen in C-c. Scale: 200 μm.
E) Quantification of skeletal fates derived from populations C-a–f by morphometric analysis of histological specimens.
F) Representative FACS plots of primary colonies derived from a single PDPN+CD146-CD73+CD164+ cell (top), and secondary and tertiary colonies derived from a re-isolated single PDPN+CD146-CD73+CD164+ cell from the primary colony (bottom).
G) Phase contrast images showing primary, secondary, and tertiary PDPN+CD146CD73+CD164+ colonies. Scale: 100 μm.
H) IHC staining for nuclei with DAPI and cartilage and bone with anti-Collagen II (COL2), and anti-Osteocalcin (OSC) antibodies, respectively, in secondary colonies derived from a single, primary PDPN+CD146-CD73+CD164+ cell. Scale: 100 μm; n=3.
To demonstrate self-renewing ability and multipotency in an in vivo serial transplantation setting, we labeled the purified PDPN+CD146-CD73+CD164+ cells from the fetal growth plate with DiD lipophilic dye and transplanted >1.5 million labeled cells under the renal capsule. The ossicles were explanted 2 weeks later, and cells were isolated after mild digest (Supplemental Figure 2A). The PDPN+CD146-CD73+CD164+ cells had undergone multiple cycles of division as evidenced by log-fold reduced DiD-label on flow cytometry (Supplemental Figure 2B). We then sorted DiDlo cells from the primary graft for an in vitro serial colony formation assay and a serial transplantation assay under the renal capsule of a secondary NSG mouse as above (Supplemental Figure 2A). Sorted DiDlo cells from the primary graft were capable of at least two rounds of successive (tertiary) colony formation and exhibited similar morphology and distribution of hSSCs and lineage cells as control hSSCs that were freshly sorted from fetal growth plates (Supplemental Figure 2C). Secondary renal capsule grafts were explanted 4 weeks after transplant, grossly examined by imaging, and stained with MP. The secondary ossicle was comparable to the ossicle generated after primary transplant (Supplemental Figure 2D) and revealed regions of Alcian blue-labeled cartilage and Saffron yellow-labeled bone by MP staining (Supplemental Figure 2E). Therefore, the combined in vitro and in vivo results showing serial colony formation and serial reconstitution of multilineage grafts, respectively, supports the identity of PDPN+CD146-CD73+CD164+ fetal growth plate cells as self-renewing, multipotent skeletal stem cells—hereafter referred to as putative hSSCs.
Determination of human skeletal lineage hierarchy
To determine whether individual chondrogenic, osteogenic, and the multipotent skeletogenic populations are lineally related or whether they each represent independent, self-renewing stem and progenitor fractions, we evaluated the capacity of the seven flow-sorted skeletal populations (see above) to differentiate into other subsets in vitro and in vivo. We cultured each of the purified cell populations in serum-rich base media. At weekly intervals, adherent cells were lifted from the culture dish by collagenase digestion and then analyzed by FACS (Figure 3A). We found that only the putative hSSC fraction (PDPN+CD146-CD73+CD164+) had the capacity to give rise to all other fractions—PDPN+CD146lo, PDPN-CD146+, and PDPN+CD146-CD73+/−CD164+/− subsets (Figure 3B). Alizarin Red S staining showed that these putative-hSSC-derived cells comprised distinct osteogenic and non-osteogenic cells (Figure 3C). We also measured the adipogenic differentiation potential of the sorted putative hSSCs by either subjecting them to in vitro differentiation or by analyzing the ossicles formed after transplanting them in RFP-mice and did not observe any evidence of adipogenesis by either fetal or adult bone marrow-derived cell subsets (Supplemental Figure 3).
Figure 3. Determination of hSSC lineage hierarchy.

A) Experimental strategy for in vitro characterization of lineage progression of putative hSSCs (PDPN+CD146-CD73+CD164+) and other human skeletal progenitor subsets. n=5.
B) Representative FACS plots showing differentiation of cultured PDPN+CD146-CD73+CD164+hSSCs into lineage-restricted subsets from day 0, 7, and 14.
C) Alizarin Red S staining of individual human skeletal progenitor subsets to measure osteogenicity [ i) hSSC: human skeletal stem cell; ii) hBCSP: human bone, cartilage, and stromal progenitor cell; iii) hOP: human osteogenic progenitor; iv) hCP: human chondrogenic progenitor]. Scale: 200 μm.
D) Experimental strategy for in vivo determination of hSSC lineage potential (top). Freshly isolated hSSCs were transplanted under the renal capsules of NSG mice, explanted after 4 weeks of development, dissociated to single-cell suspension and analyzed. FACS plot showing different skeletal populations within the dissociated primary graft including hSSC (blue box), hBCSP, hOP, and hCP all derived from originally transplanted fetal hSSC (bottom).
E) Experimental strategy for random red-green-blue (RFP, EGFP, CFP) lentiviral labeling and in vivo clonal expansion of the labeled hSSCs (left). MP-stained sections of kidney grafts derived from the labeled-hSSCs 4 weeks after transplantation (middle). Fluorescent images of the adjacent sections of the same grafts showing clonal expansion of single color skeletal cells derived from a single-color-labeled hSSC (right). Individual EGFP and RFP labeled clones are shown. Scale: 100 μm.
F) Lineage map of hSSC and downstream skeletal progenitors. h-pre-BCSP: pre-bone, cartilage and stromal progenitor cell.
To validate our in vitro results, we transplanted 100,000 freshly isolated putative hSSCs under the renal capsule of immunodeficient NSG mice. We isolated the grafts 4 weeks after transplant and analyzed the cell suspension derived from the graft by FACS. As seen in vitro, the putative hSSCs gave rise to the other skeletal subsets after transplant (Figure 3D). To demonstrate in situ clonal contribution to multiple skeletal lineages, we labeled the putative hSSCs randomly with multiple distinct fluorescent proteins (RFP, EGFP, and CFP) using lentiviral transduction prior to transplant under the mouse renal capsule (Weber et al., 2011). We found that clonally marked putative hSSCs generated both cartilage and bone staining regions in the subcapsular ossicles (Figure 3E; Supplemental Figure 2E). Collectively, these data show that the putative hSSC fraction (PDPN+CD146-CD73+CD164+) is enriched in hSSCs that are capable of lineal generation of chondrogenic and osteogenic subsets and are at the top of the skeletogenic differentiation tree (Figure 3F).
hSSCs are locally amplified in response to skeletal injury
Stem cells determine the regenerative potential of adult tissues by constantly replenishing cells that have been damaged by aging, injury, or disease. As we observed earlier in mice (Marecic et al., 2015), hSSCs are significantly amplified in soft-callus fracture specimens when compared to their frequency in uninjured limb skeletal tissues that were obtained from patients undergoing bone graft procedures (Figure 4A, D upper panel; Supplemental Table 2). It is possible that variability among patients could confound analysis of fracture specimens obtained from different patients. Therefore, we established a new human bone xenograft mouse model to evaluate the effects of skeletal injury in human limb bones in a more controlled setting. We transplanted carefully dissected human fetal phalangeal grafts with intact periosteum obtained from 18-week fetuses into 5-day-old immunodeficient NSG mice (Figure 4B). The human fetal phalanges efficiently engraft and develop into growing bones on the flank of a mouse (Figure 4B). The phalangeal grafts grew much larger in size than recipient host mouse limbs. Moreover, we found that localized injury induced by unicortical fractures on the xenografted phalangeal bones resulted in significant localized expansion of hSSCs relative to unfractured areas in the same bone (Figure 4C–D, lower panel). Therefore, consistent with the fracture-induced expansion of mSSCs in mice (Marecic et al., 2015), the injury-induced hSSC (PDPN+146-CD73+CD164+) expansion in clinical specimens and in xenografts represents a regenerative response to skeletal injury.
hSSCs generate hematopoiesis-supportive stroma
As observed with mSSCs (Chan et al., 2009; Chan et al., 2013), the hSSCs transplanted under the renal capsule generate ossicles with a marrow cavity, indicating that they may give rise to skeletal lineage-derived, hematopoiesis-supportive stroma in addition to bone and cartilage. To determine whether hSSCs and hSSC-derived subsets can functionally maintain hHSCs, we established monolayer cultures with 100,000 purified hSSCs (PDPN+CD146-CD73+CD164+), hBCSPs (PDPN+CD146+), or hOPs (PDPN-CD146+THY1+/−) freshly isolated from 17–19-week-old fetal limbs. After cultures reached confluency, 5,000 Lin-CD34+CD38-THY1loCD45RA-cord blood hHSCs (Baum et al., 1992) were co-cultured with hSSCs, hBCSPs, hOPs, or no stroma in serum-free conditions supplemented with stem cell factor (SCF) and thrombopoietin (TPO). After 14 days of co-culture, the cells were lifted with EDTA and transplanted into recipient immunodeficient NSG mice that were conditioned using sublethal irradiation as shown earlier (Reinisch et al., 2015). Freshly isolated cord-blood hHSCs were also transplanted as a positive control. Eight weeks after transplant, bone marrow aspirates were collected from recipient mice and analyzed for the presence of human hematopoietic reconstitution (Supplemental Figure 4A). While there was little engraftment from transplants of hHSCs cultured without stroma, all hHSCs co-cultured with skeletal progenitor populations gave rise to some levels of engraftment. hHSCS co-cultured with hBCSPs generated the highest level of multilineage myeloid and lymphoid engraftment (Supplemental Figure 4B–C). We found that hSSCs and hSSC-derived subsets, express a variety of potential hematopoiesis-supportive cytokines with matching cognate receptors expressed on hHSCs and downstream hematopoietic progenitors, including ANGPT1, CSF1, SDF, IL27, IL7, and SCF (Supplemental Figure 4D-G). Consistently, we also found that hHSCs express a variety of factors that could have a potential role in supporting the hSSC lineage, including BMP2, BMP8A, DHH, FGF3, WNT1, and WNT8 (Supplemental Figure 4F-i), supporting a model of stem-cell crosstalk within the bone marrow.
PDPN+CD146-CD73+CD164+ expression identifies hSSCs from other skeletal tissue sources
We had observed in mice that mSSCs in fetal, newborn, and adults have similar surface marker profiles (Chan et al., 2015a), suggesting that hSSCs may also be present in a variety of different skeletal tissues and may be isolated by the same set of surface markers. Indeed, we found that cells isolated from freshly resected adult human femoral head specimens also contain significant populations of non-hematopoietic, non-endothelial (CD45-CD235-TIE2-CD31-) cells with distinct patterns of staining for PDPN, CD146, CD73, and CD164 (Figure 5A-i). As in fetal tissues, adult PDPN+CD146-CD73+CD164+ cells readily differentiate into osteoblasts and cartilage in vitro (Figure 5A-ii) and form skeletogenic ossicles when transplanted under the renal capsule or subcutaneously in vivo (Figure 5A-iii–v, 7D). We could also isolate hSSCs from bone marrow aspirates, although the percent of skeletal lineage cells, including hSSCs, was contingent on the presence of bone spicules in the sample (data not shown). PDPN+CD146-CD73+CD164+ expression also enriches for hSSCs formed by skeletal induction of human monocyte-derived iPSCs (Karp et al., 2006) (Figure 5B-i). Cultured iPSC-derived hSSCs form monolayers of mineralizing osteoblasts and micromasses of chondrocytes (Figure 5B-ii). In addition, subcapsular transplants of these cells form multilineage ossicles containing marrow cavity in vivo (Figure 5B-iii–v, 7D). We previously observed that high concentrations of BMP2 triggers skeletal reprogramming of adipose stromal cells in mice (Chan et al., 2015a; Lo et al., 2012). Therefore, we tested whether subcutaneous injection of human adipose stroma with high levels of recombinant BMP2 in matrigel can give rise to heterotopic ossicles enriched for PDPN+CD146-CD73+CD164+ hSSCs (Figure 5C-i). We observed that while PDPN+CD146-CD73+CD164+ hSSCs are not present in freshly isolated human adipose stroma (HAS) (Figure 5C-ii left), the BMP2-treated human adipose stroma (B-HAS) form vascularized heterotopic ossicles that harbor PDPN+CD146-CD73+CD164+ hSSCs and downstream PDPN-CD146+ hOPs (Figure 5C-ii middle, C-iii, 5D). In contrast, when VEGF signaling is antagonized by co-delivery of excess soluble VEGF-receptor during BMP2-induced ossification, bone formation is repressed in favor of chondrogenesis as PDPN+CD146-CD73-CD164+ hCPs increase in frequency in the induced ossicles that lack blood vessels (Figure 5C-ii right, C-iv, 5D).
Figure 5. PDPN+146-CD73+CD164+ expression identifies hSSC from other tissue sources.

A) Isolation of hSSCs from adult human femoral tissue.
(i) Experimental strategy (right) and representative FACS plots (left) showing gating scheme for isolation of hSSCs from adult human femurhead tissue (n=6).
(ii) Alcian blue stain showing cartilage tissue in a cross-section of micro-mass generated by adult hSSCs after differentiation in vitro (left). Scale: 500 μm. Alizarin Red stain showing bone tissue (osteoblasts) generated by adult hSSCs after differentiation in vitro (right). Scale: 100 μm.
(iii) Image of ossicle formed 4 weeks after transplant of 100,000 hSSCs isolated in A-(i) under the renal capsule of NSG mice. Scale: 2 mm.
(iv) MP stain of a cross-section of the ossicle shown in A-(iii). Scale: 500 μm.
(v) IHC staining of a cross-section of the ossicle shown in A-(iii) for nuclei with DAPI and cartilage, and bone with anti-Collagen II (COL2), and anti-Osteocalcin (OSC) antibodies, respectively. Scale: 100 μm; n=6.
B) Isolation of hSSCs after skeletal induction of human monocyte-derived iPSCs.
(i) Experimental strategy (right) and representative FACS plots (left) showing gating strategy for the isolation of hSSCs 2 weeks after skeletal induction of the iPSCs.
(ii) Alcian blue stain showing cartilage in a cross-section of micro-mass generated 2 weeks after differentiation of iPSC-derived hSSCs in vitro (left). Scale: 500 μm. Alizarin Red S stain showing bone (osteoblasts) generated 2 weeks after differentiation of iPSC-derived hSSCs in vitro (right). Scale: 100 μm.
(iii) Image of an ossicle formed 4 weeks after transplant of 100,000 hSSCs purified from skeletal induced iPSC cultures and then transplanted under the renal capsule of NSG mice. Scale: 2 mm.
(iv) MP stain of a cross-section of the ossicle shown in B-(iii). Scale: 200 μm.
(v) IHC stained image of a cross-section of the ossicle in B-(iii) for nuclei with DAPI and cartilage, and bone with anti-Collagen II (COL2), and anti-Osteocalcin (OSC) antibodies, respectively. Scale: 100 μm; n=6.
C) Isolation of hSSCs from BMP2-treated human adipose stroma (B-HAS).
(i) Experimental strategy for human adipose stroma (HAS) induction with either BMP2 alone or with co-delivery of BMP2 and sVEGFR.
(ii) FACS analysis of HAS (left), HAS-derived ossicle after induction with BMP2 (middle), and HAS-derived cartilage after induction with BMP2 and sVEGFR (right).
(iii) Image of a vascularized ossicle generated 4 weeks after subcutaneous transplantation of HAS treated with BMP2 in NSG mice (left). Scale: 2 mm. MP stain of a cross-section of the same ossicle (right). Scale: 200 μm.
(iv) Image of cartilage mass formation lacking vascularization generated 4 weeks after subcutaneous transplantation of HAS treated with BMP2 and sVEGFR in NSG mice (left). Scale: 2 mm. MP stain of a cross-section of the same subcutaneous cartilaginous mass (right). Scale: 200 μm; n=6.
D) Bar chart showing quantification of percent contribution by the different skeletal fates to total graft mass for grafts derived from fetal hSSCs, adult hSSCs, skeletal-induced-iPSC, B-HAS, or BMP2+sVEGFR-treated HAS after morphometric analysis.
Figure 7. Convergent and divergent skeletal regulatory programs between mouse and human SSCs.

A) Renal capsule transplant of e14.5 mouse bones at day 0 (top left) and 10-week human fetal bones at day 0 (bottom left) in NSG mice. Images highlighting the resulting difference in size between the mouse (top middle) and human (bottom middle) bones after 2 months of growth in vivo. Scale: 5 mm; n=3. Pixels corresponding to the bone tissue in the images were measured and normalized to their respective pixel-counts at day 0 to calculate growth ratios, which are represented as bar chart (right). *p<0.05.
B) Brightfield image of CFUs (red dashed line) that were formed after 2 weeks of culture of either e14.5 fetal mSSCs (top) or 10-week fetal hSSCs (bottom) highlighting the difference in their sizes. Scale: 1 mm. Bar chart showing the average number of cells per hSSC-derived and mSSC-derived colonies (right). Error bars: standard deviation; **p<0.01; n=5.
C) Table listing shared and unshared representative genes and their expression trends (↑=upregulated, ↓=downregulated) between mouse and human focusing specifically on major signaling pathways and gene ontology (GO) gene set for bone development based on comparative microarray analysis of mSSCs (e17.5) and hSSCs (19-week) using the GEXC (n=3).
D) UCSC genome browser track showing the ATAC-seq signal at the SOST locus in 18-week fetal hSSCs (top). Regions within four ATAC-seq peaks that contain RUNX-binding motifs are magnified. Mammalian conservation track from UCSC genome browser is shown for human, rhesus, mouse, dog, and elephant. RUNX2-binding motif (forward or reverse) found at each site is also shown (middle). Genome browser track showing ATAC-seq signal at the mouse Sost locus in e17.5 fetal mSSCs (bottom).
Single-cell transcriptomic comparison of fetal-, adult-, B-HAS-, and iPSC-derived hSSCs
We observed differences in the skeletogenic potential of hSSCs isolated from fetal, adult, B-HAS, and iPSC tissues (Figure 5D). For example, fetal and iPSC-derived SSCs have a higher tendency to form cartilage than adult SSCs. To investigate these phenotypic differences between the various sources of hSSCs, we compared single hSSCs from fetal, adult, B-HAS, and iPSC-derived tissues using scRNA-seq (Figure 6A). Principal component analysis (PCA) of 42 fetal, 36 adult, 77 B-HAS-derived, and 41 iPSC-derived hSSCs demonstrates that hSSCs isolated from different sources cluster together (Figure 6B). However, the second principal component (PC2) separates a few iPSC-derived hSSCs from this cluster as outliers. The gene loadings that most contribute to PC2 include important early skeletogenic factors such as SPARC, COL1A1, SFRP2, LUM, and FOS (Figure 6B)—suggesting that the outliers may comprise hSSC precursors or poorly differentiated cells during skeletal induction of iPSCs. To specifically study single hSSCs from a skeletal and developmental perspective, we curated a set of signaling pathways and bone development genes from the GEXC and the Molecular Signatures Database (Supplemental Table 3) (Liberzon et al., 2015; Seita et al., 2012). Using these 296 genes, we performed supervised hierarchical clustering of 196 single hSSCs and identified ten gene clusters (Figure 6C; 1–10). Five clusters demonstrate transcriptional similarity in expression of key skeletogenic genes, including SPARC, COL1A1, ITGB1BP1, and RHOA (Figure 6C; 1–4, 9). Four clusters recapitulate the phenotypic similarity of adult to B-HAS-derived hSSCs, and fetal to iPSC-derived hSSCs based on key genes such as OSR2, SPG20, FOS, and WLS (Figure 6C; 5, 6, 8, 10). The last cluster captures transcriptional differences in expression levels between primary isolates and in vitro derived hSSCs based on genes such as TCF7L2, FST, and CHRDL1 (Figure 6C; 7). To assess the degree of similarity between individual hSSCs and groups of hSSCs, we calculated the Pearson correlation coefficients for each pair of single and groups of hSCCs (Figure 6D, E). When analyzed separately, we found that adult hSSCs were more heterogenous compared to fetal, B-HAS-derived, or iPSC-derived hSSCs. The greater degree of heterogeneity among adult hSSCs may be a result of diverse specialization within the stem cell pool with age (Figure 6D). Upon aggregating cells within each group, we found that fetal hSSCs most closely correlated with iPSC-derived hSSCs and B-HAS-derived hSSCs most closely correlated with adult hSSCs. When we removed the iPSC-derived hSSCs from the comparison, we found that fetal hSSCs correlated more with adult hSSCs than with B-HAS-derived hSSCs (Figure 6E). The correlation data (Figure 6E) is largely consistent with our functional data (Figure 5D) except for B-HAS-and iPSC-derived hSSCs, both of which are functionally similar with respect to their differentiation potential but are less similar by single-cell mRNA expression.
Figure 6. Comparative scRNA-seq analysis of hSSCs derived from different sources.

A) Experimental strategy for scRNA-seq of fetal (blue), adult (brown), B-HAS-derived (yellow), and iPSC-derived (green) hSSCs.
B) Unsupervised PCA of single hSSCs based on their expressed transcriptomes across principal component (PC) 1 and 2. Top gene loading contributors to the PC2 are listed along with the general direction of their eigenvectors. Colors of dots correspond to hSSC-source as in A.
C) Heatmap showing gene expression (log2(TPM+1)) of known genes involved in canonical signaling and/or bone development pathways (Supplemental Table 3) in single fetal (n=42), adult (n=36), B-HAS-derived (n=77), and iPSC-derived hSSCs (n=41). The heatmap is grouped into 10 clusters obtained based on the expression patterns of the selected genes using Ward’s method.
D) Pearson correlation matrix showing similarities between single fetal, adult, B-HAS-derived, and iPSC-derived hSSCs based on gene expression values as in B. Scale shows color gradient for R2 value from 0 to 1.
E) Pearson correlation matrix with numerical coefficients showing degree of similarity between aggregate fetal, adult, B-HAS-derived, and iPSC-derived hSSC populations. Mean log2(TPM+1) was calculated separately for each group by calculating the sum of the log2(TPM+1) values for each gene in B and dividing the sum by the total number of cells in each group.
Convergent and divergent skeletal regulatory programs between mouse and human SSCs
Humans and mice diversified from a common ancestor nearly 100 million years ago (Nei and Glazko, 2002). While many aspects of their physiology are similar, mouse and humans also differ in several ways related to their skeletal systems. We observe that sub-renally transplanted human fetal bones grow dramatically larger after 2 months of growth compared to their mouse counterparts (Figure 7A). In addition, hSSCs produce up to 100-fold larger CFUs compared to mSSCs (Figure 7B). These results suggest some aspects of skeletal size control are cell intrinsic and could reflect differences in genetic and epigenetic regulation at the level of individual SSCs.
To address this, we purified human and mouse fetal SSCs at similar developmental stages (e17.5 mouse and 19-week-old human fetal bones) for a comparative gene expression analysis by microarray. We normalized expression values using the GEXC (Seita et al., 2012) that assigns a threshold value to each probeset using StepMiner (Sahoo et al., 2007) and calculates a percentile value between −100% and +100% for each available gene, allowing us to compare mouse and human gene expression on a normalized, continuous scale. Focusing specifically on signaling pathways and genes associated with bone development (Supplemental Table 3), a pairwise comparison between fetal e17.5 mSSC and 19-week fetal hSSC revealed that over 66.5% of transcription within the selected signaling pathways and bone development genes are expressed in both mSSCs and hSSCs. We analyzed the genes that constitute the WNT, BMP, Hedgehog, FGF, and Notch pathways as well as additional genes that constitute the gene ontology (GO) gene set for bone development. As expected, a few active genes in mSSCs were turned off in hSSCs, while other genes that were not expressed in mSSCs were found to be active in hSSCs (Figure 7C, Supplemental Figure 5). Notable among divergent genes are key members of the WNT signaling pathways, SOST, CXXC4, and DNAJB6, all of which have been implicated earlier in human bone development but are not expressed in mSSCs (Figure 7C) (Kojima et al., 2009; Menezes et al., 2012; Moester et al., 2010). Among the genes that are expressed by both mouse and human SSCs, we found some well-known master transcriptional regulators of skeletogenesis, including RUNX2, SOX9 (Figure 7C)—in addition to some lesser known transcription factors (TFs) such as OSR2 and TWIST1 (Supplemental Table 3).
To better understand epigenetic regulation of skeletal development, we performed ATAC-seq on mouse and human SSCs isolated from bones at similar developmental stages (18-week-old human fetal bone and e17.5 mouse fetal bone) as above to identify sites of accessible chromatin. This analysis revealed various open chromatin-sites comprising active promoters as well as gene-distal enhancers that are conserved between mouse and human (Supplemental Figure 6). To drill-down to the species-specific epigenetic differences, we focused our analysis on genes that are expressed in the hSSC but not in the mSSC (see above). For these gene-loci, we found that in human (but not always in mouse), the accessible open chromatin sites were enriched in TF-binding-motifs recognized by the core SSC-specific-TFs that are conserved between human and mouse in terms of their expression. For example, even though RUNX2 is expressed in both human and mouse (Figure 7C), the predicted RUNX2 binding-sites are enriched in the open chromatin landscape of human SOST but not mouse Sost locus and therefore, SOST is expressed only in hSSCs but not mSSCs (Figure 7D). The same is true for another human-specific gene, DNAJB6 (Supplemental Figure 6I). Interestingly, overexpression of either human SOST or DNAJB6—both of which are inhibitors of WNT signaling—by lentiviral transduction in mSSCs led to significantly larger subrenal ossicle formation relative to GFP virus control (Supplemental Figure 7A–E). This is also consistent with the delayed osteogenesis in SOST or DNAJB6 transduced mSSC-derived ossicles—as exemplified by the reduced bone staining (yellow) and enhanced cartilage staining (blue) of cross-sections of the ossicles harvested 16-days after transplant (Supplemental Figure 7C-iv lower panel, 7D-iv lower panel). These data suggest that functional genes that are expressed in a species-specific manner may be a result of divergent evolution of epigenetic regulation.
Genome-wide association studies (GWAS) have identified several non-coding genomic polymorphisms that are associated with skeletal traits in humans such as bone mineral density and height (Chan et al., 2015b; Estrada et al., 2012). We analyzed 56 such single nucleotide polymorphisms (SNPs) that are strongly associated with variation in bone mineral density in humans and found that one of the SNPs changes the predicted RUNX binding site within the SOST locus (Figure 7D) while another was within the accessible non-coding regions surrounding the WNT4 promoter (Supplemental Figure 6J). These observations further exemplify the key role played by the SSC-specific genes both during development and homeostasis.
Discussion
Our data support a developmental hierarchy of skeletal progenitors in humans organized by cells with differential expression of PDPN, CD146, CD73, and CD164. We find that a purified population of PDPN+CD146-CD73+CD164+ cells serially generate CFUs from single cells in vitro and multilineage ossicles containing bone, cartilage, and stroma upon subrenal transplantation in mouse. Notably, these stem cells do not differentiate into adipocytes, suggesting that adipocytes may be replenished by other sources of resident bone marrow stem cells. Instead, hSSCs lineally transition into an early bone, cartilage, and stroma progenitor (hBCSP), which then give rise to osteoprogenitors (hOPs) and chondroprogenitors (hCPs) prior to terminally differentiating into bone, cartilage, and stroma.
hSSCs from different skeletal sources are similar yet distinct
We show that hSSCs and their downstream progeny can also be isolated from skeletally-differentiated iPSCs and B-HAS. When compared to fetal and adult hSSCs, we observe that there is variation in the proportion of cartilage and bone in the ossicles from different hSSC sources, which correlates to gene expression differences between individual hSSCs as quantified by scRNA-seq. The gene sets that segregate different hSSC populations provide molecular landmarks for modifying skeletogenic conditions to endow B-HAS- or iPSC-derived hSSCs with enhanced self-renewal or increased chondrogenic and/or osteogenic activity.
A molecular glimpse of skeletal speciation
Finally, we compared mouse and human SSCs to gain insight into the evolutionary basis of stem cell-mediated skeletogenesis. We found that when equally sized human and mouse fetal bones were transplanted in mice, the human fetal bones far outgrew their mouse counterparts. Similarly, after equal time in culture, CFUs from hSSCs had over 100-fold more cells than CFUs from mSSCs. These initial observations along with molecular comparisons of SSCs from mouse and humans using microarray, and ATAC-seq analysis led us to suspect that there are intrinsic mechanisms that regulate skeletogenesis and that molecular comparison of mouse and human SSCs could explain divergences in skeletal phenotype.
Overexpression of two genes (SOST and DNAJB6) in mSSCs that are expressed in hSSCs but not mSSCs, lead to significantly larger mSSC-derived ossicles, suggesting that SOST and DNAJB6 expression in hSSCs may be important for skeletal size control at the stem cell level. This was unexpected as SOST is a known negative regulator of WNT signaling and bone formation in osteoblasts (Compton and Lee, 2014). We hypothesize that expression of SOST by hSSC could be important for extending hSSC activity during fetal development, perhaps by delaying premature WNT-dependent osteoblast differentiation and/or osteoblast-mediated feedback signaling.
Our analysis also revealed differential expression of various genes involved in the synthesis of connective proteins (Supplemental Table 4, 5), such as types of collagen that could underscore differences in biomechanical properties between mouse and human skeletal tissues. With the identification of the SSC in both mouse and human, and the delineation of their downstream skeletal lineages, we provide a cell atlas to enable a series of new investigations into the genetic and molecular determinants of skeletal formation and development. Moreover, given the tremendous medical burden imposed by degenerative, neoplastic, post-traumatic and post-surgical skeletal disorders, we believe that identifying the hSSC and elucidating its lineage map will enable the molecular diagnosis and treatment of skeletal diseases (Beyth et al., 2011). Using this approach, we recently showed that even complex skeletal pathologies that arise from systemic diseases like diabetes can be precisely diagnosed and remedied by comparing the molecular phenotype of normal and diseased SSCs (Tevlin et al., 2017). Therefore, we anticipate that further characterization of the hSSC, and the ontogeny of hSSC-derived skeletal progenitors as described here will facilitate the development of patient-specific approaches to diagnosing and reversing diverse types of skeletal disorders.
STAR METHODS
CONTACT FOR REAGENT AND RESOURCE SHARING
Further information and requests for resources and reagents should be directed to, and will be fulfilled by, the Lead Contact, C.K.F.C.: chazchan@stanford.edu
EXPERIMENTAL MODEL AND SUBJECT DETAILS
Mice
BA mice (C57BL/Ka-Thy1.1-CD45.1), purchased from the Jackson laboratories (Mouse strain datasheet JAX:000406), and used for isolation of mouse SSC and skeletal progenitors for gene expression and ATAC-sequencing experiments as described below. NSG (NOD.Cg-Prkdcscid Il2rgtm1Wjl/SzJ, JAX: 005557) immunodeficient mouse strains were used to establishing the human xenograft model and as recipients for either subcutaneous or renal capsule transplantation of human skeletal and hematopoietic stem and progenitor cells. RFP (B6.Cg-Tg(CAG-mRFP1)1F1Hadj/J, JAX: 005884) mice were used for hSSC and HAS/B-HAS transplantation to assess adipogenic potential in vivo. All mice were male and 8–12-weeks-old unless otherwise stated in the results section. Animals were maintained at Stanford University animal core facility in accordance with Stanford and National Institutes of Health guidelines.
We do not have any information regarding the sex of fetal or cord blood specimens utilized during this study. The gestation ages of fetal specimens are listed in Supplemental Table 2 and described in the respective results sections. Human adipose stroma (HAS) were obtained from female patients ranging from 30–50 years old for both in vitro and in vivo adipogenesis experiments as well as skeletal induction and scRNA-seq experiments. Adult hSSCs, and corresponding lineage populations, were obtained from femoral head bone marrow from a 58-year old male, a 71-year old female, and a 58-year-old female donor. Age and sex of donors that contributed fractured bone specimens is listed in Supplemental Table 2. The IPSC line, SCVI 113, used in this study was derived from peripheral blood monocytes of a 51-year-old male. We do not have age or sex information regarding primary cells used in the chondrogenic differentiation studies.
Fetal and adult human samples
Fourteen human fetal samples were obtained from Stemexpress (Folsom, CA) and shipped overnight. Samples ranged in age from 10 to 20 weeks of gestation with no restrictions on race or gender. Fetal sample procurement and handling was in accordance with the guidelines set by the Institutional Review Board (IRB-35711). 22 adult femoral heads (58–74 years old), 3 uninjured human bones (16–30 years old), and 10 fractured long bone specimens (20–90 years old) were obtained from Stanford Hospital in accordance with guidelines set by the Institutional Review Board (IRB-35711). On this IRB, informed consent was not required as samples were considered biological waste. No restrictions were made regarding the race, gender, or age of the specimen’s donor. Following excision, all femoral head specimens were placed on ice, and skeletal stem and progenitor cells were isolated from the bone marrow cavity and articular cartilage, as described below. Adipose stromal cells were harvested from lipoaspirate human tissue (n=5) from female donors, 30–50 years old. Informed consent was obtained in all cases, and samples were obtained from Stanford Hospital in accordance with guidelines set by the Institutional Review Board (IRB-25954). Human core-blood samples were obtained according to the Administrative Panel on Human Subjects Research Institutional Review Board (IRB)-approved protocols (Stanford IRB no. 18329, no. 6453, and no. 5637) with informed consent. Cord blood was collected with written informed consent from the mother, which was obtained before delivery of full-term pregnancies at the Lucile Packard Children’s Hospital, according to IRB-approved protocols (Stanford IRB no. 5637) or purchased from the New York Blood Center (NYBC). All cord-blood samples were processed within 24 h after delivery and used fresh.
Cell lines
Human monocyte derived induced Pluripotent Stem Cell (iPSC) line, SCVI 113, was a kind gift from the laboratory of Joseph C. Wu (joewu@stanford.edu). Donor was male 51-year-old.
Bacteria and Virus strains
Lentivirus expressing GFP, RFP, and CFP were subcloned in the Weissman laboratory from pLL3.7 deposited in Addgene (https://www.addgene.org/11795/). Validated lentiviral expression plasmids containing cDNA expression cassettes for SOST (Cat#Mm11378) and DNAJB6 (Cat#Mm21356) were acquired from Genecopeia.
METHOD DETAILS
Human Fetal and Adult Bone dissociation
Human fetal long bones were separated, gently denuded of soft tissue with paper towels, and dissected for the growth plate and its constitutive zones. The distinct areas of the growth plate were distinguished based on differences in the size and shape of the chondrocytes and osteoblasts that are representative of each growth plate zones. These differences can be visualized in fixed tissue by histology with Movat Pentachrome (Saffron [Sigma-Aldrich, Cat#S8381–5G], Acid Red 73 [Sigma-Aldrich, cat#49823–25MG], Alcian Blue 8GX [Sigma-Aldrich, Cat#A3157–25G], Acid Fuchsin [Sigma-Aldrich, Cat#F8129–25G], Phosphotungstic Acid [Sigma-Aldrich, Cat#P4006], Hematoxylin [Sigma-Aldrich, Cat#MHS32–1L]) or in living tissue by vital dye staining with Calcein-AM (Invitrogen, Cat#C1430) and Hoechst (Thermo Fisher Scientific™, Cat# 62249) (Figure 1B–C). The proliferative zone (P) is identified by the relatively small size of the chondrocytes, the pre-hypertrophic zone chondrocytes (p-H) are medium-sized, and the hypertrophic chondrocytes (H) are among some of the largest chondrogenic cells in the growth plate. Finally, the diaphyseal region (D) includes trabecular bone and marrow. For scRNA-seq analysis, we further split each of the chondrocyte zones (P, p-H, and H) into equivalently sized halves (1 & 2)—thus, a total of 7 distinct regions were used for analysis including the diaphyseal zone.
From adult human femoral head specimens, the articular cartilage was dissected out with scalpels and the bone marrow was scraped out with a spatula from the marrow cavity. The marrow and the cartilage tissue were then minced separately with razor blades, resuspended in 3000 U/mL type II collagenase (Sigma-Aldrich, Cat#C6885) digestion buffer supplemented with 100 U/mL DNase I (Worthington, Cat#NC9199796) and incubated at 37 °C for 40 minutes under constant agitation. The supernatant was filtered through a 70 μm nylon mesh and quenched with staining media (2% fetal bovine serum (FBS), in phosphate-buffered saline (PBS), GIBCO, Cat#C14190500BT). Digestion was repeated twice more prior to centrifugation at 200g at 4 °C followed by resuspension in staining media.
Fluorescence-activated cell sorting (FACS)
Human skeletal cells were separated from red blood cells (RBCs) and bone dust by density gradient separation using 1:1 Histopaque of density 1.119 g/mL (Sigma-Aldrich, Cat#11191). The buffy coat was collected, washed with staining media, and the resulting cell suspension was depleted of CD45+ cells by magnetic-activated cell sorting (MACS) (Miltenyi, Cat#130–045-801). Cells were blocked with mouse IgG and stained with fluorochrome-conjugated antibodies against CD45 (BioLegend, Cat#304029-BL), CD235a (BioLegend, Cat#306612-BL), CD31 (Thermo Fisher Scientific™, Cat#13–0319-82), CD202b (Tie-2) (BioLegend, Cat#334204), CD146 (BioLegend, Cat#342010), PDPN (Thermo Fisher Scientific™, Cat#17–9381-42), CD90 (THY1; BioLegend, Cat#328110), CD164 (BioLegend, Cat#324808), and CD73 (BioLegend, Cat#344016). Flow cytometry was performed on FACS Aria II (BD Biosciences). Gating schemes were established with fluorescence-minus-one (FMO: staining with all fluorophores except one) controls and negative propidium iodide (PI) (Sigma-Aldrich, Cat#P4170) staining (1 μg/ml) was used as a measure for cell viability.
In vivo transplantation of cells
SSCs or other skeletal cells were purified using FACS and resuspended in 2 μL of Matrigel (Corning, Cat#CB40234A) and then injected subcutaneously or underneath the renal capsule of 8–12-week-old immunodeficient NSG mice. Injected cells developed into a graft after 4 weeks. The grafts were surgically removed for analysis. For serial transplantation, SSCs from the graft were isolated by FACS, labeled with DiD lipophilic dye-AF647 (Cat#V22887), and >1.5 million cells were transplanted under the renal capsule of 8–12-week-old NSG mice. Ossicles were explanted 2 weeks later for analysis.
In vivo transplantation of whole bones
Fresh 10-week-old human fetal and e14.5 mouse fetal femurs were transplanted underneath the renal capsule of 8–12-week-old anesthetized immunodeficient NSG mice. Bones were incubated for 2 months prior to surgical excision and analysis of graft.
Human xenograft Model
Ten 18-week-old fetal phalanges (proximal, middle and distal phalanges) were transplanted subcutaneously into postnatal day 5 NSG mouse pups. The pups reached skeletal maturity at 4 weeks and the xenograft was opened. Unicortical fractures were performed using a drill as shown in Figure 4B. The fractures were allowed to heal for 2 weeks and then harvested and dissociated as described above. Cells were analyzed by FACS and underwent osteogenic differentiation and Alizarin Red staining (Sigma-Aldrich, Cat#A5533) to assess osteogenic potential.
Immunofluorescence
Immunofluorescence (IF) on cryopreserved ectopic bone specimens were performed using M.O.M. immunodetection kit (Vector Laboratories, Cat#BMK-2202) according to manufacturer’s instructions. Briefly, specimens were treated with a blocking reagent 5–2% donkey (Sigma-Aldrich Cat#D9663) or goat serum (Thermo Fisher Scientific™, Cat#G9023) supplemented with 1% Bovine Serum Albumin (BSA; Sigma-Aldrich, Cat#A9647) in Tris Buffered Saline (TBS, Sigma-Aldrich, Cat#T5912), then probed with monoclonal primary antibody at 4 °C overnight. Primary antibodies: CD164 (Sigma-Aldrich, Cat#HPA010636), Perilipin A (Chemicon, Cat#AB10200), Adiponectin (Invitrogen, Cat#MA1–054), Human Nuclear Antigen (Abcam, Cat#ab191181), Collagen II (Abcam, Cat#ab34712), Osteocalcin (Abcam, Cat#ab13418). Specimens were next washed with PBS, probed with secondary antibodies conjugated to Alexafluor-488 (AF488; Invitrogen, Cat#A11006) or AF647 (Invitrogen, Cat#A21236) as needed. Specimens were incubated with 1 ug/ml of DAPI (Biolegend, Cat#422801) for 10 mins and then washed twice. The specimens were then mounted with a coverslip using Fluoromount-G (Invitrogen, Cat#00–4958-02), and imaged with a Leica DMI6000B inverted microscope system.
IF on tissue-cultured cell specimens were performed similarly to cryopreserved specimens. Briefly, cultured cells in 6-well to 96-well culture plates were washed with PBS and fixed in 2% paraformaldehyde (PFA, Electron Microscopy Sciences, Cat#15710) at 4°C overnight. Specimens were treated with a blocking reagent (see above), then probed with monoclonal antibody at 4°C overnight. Next, specimens were washed with PBS, probed with secondary antibodies conjugated to Alexafluor-488 (AF488; Invitrogen, Cat#A11006) or AF647 (Invitrogen, Cat#A21236) as needed, washed, immersed in PBS, and imaged with a Leica DMI6000B inverted microscope system (LAS X software, Leica Microsystems). Monoclonal antibodies: human Collagen II (Abcam, Cat#ab34712), Osteocalcin (Abcam, Cat#ab13418), AF-conjugated secondary antibodies (AF455; Molecular Probes Cat#A11034, and AF647; Molecular Probes, Cat#A31573).
In vivo skeletal-induction with local factors
Adipose stromal cells were harvested from lipoaspirate human tissue, collagenase (Type II) digested, and then depleted of CD45-expressing cells by magnetic separation using anti-human CD45 microbeads (Miltenyi, Cat#130–045-801). 10 million CD45- lipoaspirate cells were then resuspended in 50 μL of Matrigel containing 10 μg rhBMP2 (recombinant human BMP2; R&D Systems, Cat#355-BM/CF). The cell solution was then injected subcutaneously into the inguinal fat pads of 8–12-week-old adult NSG immunodeficient mice. One month after transplant, grafts were harvested for histological or FACS analysis as described.
Human adipose stromal cells were harvested and transplanted as above. Local induction with 10 ug rhBMP2 (recombinant human BMP2; R&D Systems, Cat#355-BM/CF) alone or rhBMP2 with rhVEGFR1 (recombinant human VEGFR1; R&D Systems, Cat#321-FL/CF) at a ratio of 3:50 μg allowed for osteo and chondro-induction, respectively. The recombinant proteins were mixed directly with the matrigel and the cell suspension.
Single Cell RNA sequencing (scRNA-seq)
Single cell capture and RNA extraction
Cells were dissociated into a single cell suspension and prepared for FACS as described under Human Fetal and Adult Bone dissociation and Fluorescence-activated cell sorting (FACS) above. Single cells were sorted into 96-well plates of lysis buffer (1 U/μL RNase inhibitor (Clontech, Cat#2313B), 0.1% Triton (Thermo Fisher Scientific™, Cat#85111), 2.5 mM dNTP (Invitrogen, Cat#10297–018), and 2.5 μM oligo dT30VN (IDT, special order) in nuclease-free water (Thermo Fisher Scientific™, Cat#10977023)) as described (Picelli et al., 2014), centrifuged at maximum speed for 30 sec at 4 oC, snap frozen on dry ice, and then stored at −80 °C. ERCC (External RNA Controls Consortium) ExFold RNA Spike-In Mixes (Invitrogen, Cat#4456739)) was added at 1:600,000 dilution to each lysis reaction to be processed in parallel to cellular mRNA.
Whole-transcriptome amplification, library preparation, and sequencing
Single cell cDNA libraries were constructed using the Smart-seq2 protocol (Picelli et al., 2014) with minor modifications. Briefly, cDNA from single cell RNA was generated by oligo-dT primed reverse transcription with MMLV SMARTScribe reverse transcriptase (Clontech, Cat#639538) and a locked template-switching oligonucleotide (TSO; Exiqon, special order). This was followed by 25 cycles of PCR amplification, which was the optimal number of cycles determined to obtain cDNA concentration of at least 0.05–0.32 ng/μL from each human skeletal lineage cell, using KAPA HiFi hotStart ReadyMix (Kapa Biosystems, Cat#KK2602) and ISPCR primers (IDT; IDT, special order). Amplified cDNA was then purified using 0.6× volume Agencourt AMPure XP beads (BEECKMAN COULTER, Cat#A63882) to remove oligos smaller than 500 base pairs (bp). The resulting cDNA concentration and size distribution for each well was determined on a capillary electrophoresis-based fragment analyzer (Advanced Analytical). Based on this analysis, the cDNA concentration was then normalized to a desirable concentration range of 0.05–0.32 ng/μL by diluting the amplified cDNA from each well. The cDNA was tagmented, uniquely barcoded, and PCR enriched using the Nextera XT DNA Library Prep kit (Illumina, Cat#FC-131–1096). Libraries were then pooled and purified to remove fragments smaller than ~400 bp using 0.6× volume Agencourt AMPure XP beads. Pooled libraries were quantified by Bioanalyzer (Agilent), using High Sensitivity DNA analysis kit, and fluorometrically, using Qubit dsDNA HS Assay kits and a Qubit 2.0 Fluorometer (Invitrogen), and the final concentration was adjusted to 2 nM. The pooled libraries were then sequenced on NextSeq 500** (Illumina) to obtain 2×151 bp paired-end reads at a depth of 1–4.5 × 10⁶ reads/cell.
**Pooled libraries were initially sequenced on HiSeq 4000 (Illumina); however, due to presence of significant amount of index-switching (Sinha et al., 2017) in our data, library pools were rerun on the NextSeq 500.
Transcriptional Expression Profiling by microarray
mRNA isolation and microarray
We performed microarray analyses on highly-purified, double-sorted populations of e17.5 mouse and 19-week human SSCs. 10–30,000 cells were directly sorted into 1 mL TRIzol LS (Invitrogen, Cat#10296028). RNA was isolated with RNeasy Micro Kit (Qiagen, Cat#74004) as per manufacturer’s instructions. RNA was twice amplified with an Arcturus™ RiboAmp™ PLUS Kit (Applied Biosystems™, Cat#KIT0521). Amplified cRNA was streptavidin-labeled, fragmented, and hybridized to Affymetrix arrays 430–2.0 (for mouse genome; Applied Biosystems™, Cat#900495), and HG-U133+ (for human genome; Applied Biosystems™, Cat#901569). Arrays were scanned with a Gene Chip Scanner 3000 (Affymetrix) running GCOS 1.1.1 software.
Histology
Dissected specimens were fixed in 2% PFA at 4 oC overnight. Specimens were decalcified in 400 mM Ethylenediaminetetraacetic acid (EDTA; Invitrogen, Cat#15573–038) in PBS (pH 7.2) at 4 °C for 2 weeks with a change of EDTA once at 1 week. The specimens were then dehydrated in 30% sucrose at 4 °C overnight. Specimens were embedded in Optimal Cutting Temperature compound (OCT) and sectioned at 5 μm. Representative sections were stained with freshly prepared Hematoxylin (Sigma-Aldrich, Cat#MHS32–1L) and Eosin (Eosin Y; Thermo Fisher Scientific™ Shandon™, Cat#6766009), Movat pentachrome, or Alizarin Red (Sigma-Aldrich, Cat#A5533) stains depending on the individual experiment. For zone demarcation in the growth plate and diaphysis, live bones were bissected along the longitudinal axis of the bone and stained directly with Hoechst (Thermo Fisher Scientific™, Cat#62249) and Calcein-AM (Invitrogen, Cat#C1430) intravital dyes as per standard protocols.
Cell culture
Skeletal progenitors were cultured in MEM-alpha medium with 10% human platelet-derived lysate (Stem Cell Technologies, Cat#06960), 1% Penicillin-Streptomycin solution (Pen-Strep; Thermo Fisher Scientific™, Cat#15140–122) in an incubator maintained at 37 °C with 5% CO2. Culture vessels were first coated with 0.1% Gelatin (Millipore, Cat#ES-006-B). Cultured cells were lifted for analysis or passaging by incubating with 3000 U/mL type II collagenase in M199 (Sigma-Aldrich, #C6885).
For human colony forming assays, single cells were sorted into each well of a 96-well plate and cultured for 2 weeks. At this time, specimens were examined under a phase microscopy and a cloning ring was used for quantification. The cells were subsequently lifted for staining and analysis by FACS.
Adipogenic Differentiation
Populations of hSSC, hBCSP, hCP and hOP were prospectively isolated using FACS. Cells were seeded at a predetermined uniform density depending on typical cell yield from the specimen. The cell populations were subjected to adipogenic differentiation as described earlier (Ge et al., 2016). Briefly, cells cultured in proliferation media (DMEM/F12 (Thermo Fisher Scientific™, Cat#11320–033), 20% FBS, 1% Pen-Strep) for a couple of passages. After expansion, the cells were plated to confluency and changed to induction media (DMEM/F12, 10% FBS, 1% Pen-Strep, 1 μM dexamethasone (MP Biomedicals, Cat#194561), 58 μg/mL insulin (Human Insulin Recombinant Protein; Invitrogen, Cat#RP-10908), 0.5 mM 3-isobutyl-1-methylxanthine (IBMX; Sigma-Aldrich, Cat#I7018), 200 μM indomethacin (Sigma-Aldrich, Cat#57413), and fed with fresh induction media every third day. Cells were then stained with Oil Red O (Sigma-Aldrich, Cat#O0625) to assess adipogenic potential after 1 week of differentiation.
Osteogenic Differentiation
Populations isolated by FACS were seeded and grown in vitro until 100% confluency, at which point the cell populations underwent osteogenic differentiation. Cells were fed with fresh osteogenic differentiation media (ODM) (MEM-alpha medium [Thermo Fisher, Scientific™, Cat#12561–056], 10% FBS, 1% Pen-Strep, 100 nM dexamethasone, 10 mM sodium β-glycerophosphate [Sigma-Aldrich, Cat#G9891], 2.5 mM ascorbic acid 2-phosphate [Sigma-Aldrich, Cat#A8960]) every 3 days for 10 days. Cells were then stained with Alizarin Red (Sigma-Aldrich, Cat#A5533) to assess osteogenic potential.
Chondrogenic differentiation
Cells were cultured as a micro-mass and differentiated using StemPro chondrogenesis differentiation kit (Thermo Fisher Scientific™, Cat#A1007101). Cells were resuspended at a cell-density of 1.6×10⁷ cells/mL. A 5 μL droplet of the cell suspension was seeded under high humidity conditions in a 24-well plate for 2 hours. After 2 hours, warmed chondrogenic differentiation media was added to the culture vessel. The growing micro-mass was fed with fresh chondrogenesis media every other day in a 37 °C incubator with 5% CO2. At day 14 the micro mass was fixed, sectioned, and stained with Alcian blue (Sigma-Aldrich, Cat#A5268).
hSSC differentiation from induced pluripotent stem cell (iPSC)
Human iPSCs were plated onto Geltrex (Gibco, Cat#A1569601)-coated dishes in Essential 8 Medium (Gibco, Cat#A1007101) and cultured in an incubator maintained at 37 °C with 5% CO2. iPSCs were fed daily with fresh media and maintained at ≤80% confluency. Cells were passaged 1:10 using 0.05 mM EDTA. To induce bone formation, iPSCs were differentiated when they reached 80% confluency by switching the cells over to ODM composed of MEM-alpha medium supplemented with 100 nM of dexamethasone, 10 mM β-Glycerophosphate, 2.5 mM ascorbic acid 2-phosphate, and 50 ng/mL of rhBMP2. Differentiating cells were fed with fresh ODM every other day and harvested on week 2 for FACS analysis.
HSC-stromal co-culture and transplant
To establish stromal monolayers for hHSC co-culture experiments, human stromal subsets, hSSCs, hBCSPs, and hOPs, were isolated by FACS and cultured as described under Fluorescence-activated cell sorting (FACS) and Cell Culture above. Human HSCs were enriched from freshly processed cord-blood samples by magnetic separation using CD34 microbeads (Miltenyi Biotec, Cat#130–056-701), according to the manufacturer’s instructions. CD34+CD38-Lin-HSPC subpopulations (purity >95%) were isolated for co-culture with SSC-derived stromal populations. CD34+CD38-Lin-HSPC were sorted using a previously established panel that included anti-human lineage markers [CD2 (Cat#555328), CD3 (Cat#555341), CD4 (Cat#555348), CD7 (Cat#555362), CD8 (Cat#555368), CD11b (Cat#555389), CD14 (Cat#562692), CD16 (Cat#555408), CD19 (Cat#555414), CD20 (Cat#561761), CD56 (Cat#555517), all PE-Cy5; all dilution 1:50], CD235a(GPA)-PE-Cy5 (dilution 1:100; BD Biosciences, Cat#559944). Additionally, the following antibodies were used: CD38-PE-Cy7 (dilution 1:50; Cat#33579), CD90-FITC (dilution 1:25; Cat#555595), CD123-PE (dilution 1:10, Cat#554529), CD34-APC (dilution 1:25; Cat#659123)—all from BD Biosciences, CD10-APC-Cy7 (dilution 1:10; Cat#312212), and CD45RA-BV605 (dilution 1:20; Cat#304133)—both from Biolegend. Live cells assessed by negative staining for propidium-iodide (PI, Sigma-Aldrich, Cat#P4170; final concentration: 1 μg/ml) were double sorted. 5000 Lin-CD34+CD38-THY1loCD45RA- human cord blood HSCs were then co-cultured with or without confluent human stromal subsets for 14 days in Stemline serum-free hematopoietic stem cell expansion media (Sigma-Aldrich, Cat#S0192) supplemented with 10 ng/mL human recombinant stem cell factor (Peprotech, Cat#300–07), 5 ng/mL human recombinant thrombopoietin (Peprotech, Cat#300–18), 20 ng/mL human basic fibroblast growth factor (R&D Systems, Cat#P09038), and 25 ng/mL human insulin growth factor (R&D Systems, Cat#P05019). After 14-day co-culture, hHSCs were retro-orbitally injected into 6–8-week-old immunodeficient NSG mice conditioned using sub-lethal irradiation (250 rad in single dose) as described earlier (Reinisch et al., 2015). 8 weeks after transplant, bone marrow aspirates were obtained from recipient mice and analyzed by FACS for expression of human hematopoietic markers, HLA-ABC (pan-human; BioLegend, Cat#311404), hCD45 (pan-hematopoietic; BioLegend, Cat#103258), hCD19 (B lymphoid cells; BioLegend, Cat#302226), and hCD33 (myeloid cells; BioLegend, Cat#366626).
Lentiviral transduction of mSSCs
Fetal mSSCs were resuspended in MEM-alpha medium with 15% Fetal Calf Serum (FCS) and transduced individually with lentivirus carrying GFP, RFP, CFP, GFP/SOST, or GFP/DNAJB6 cDNA expression-cassettes. 48 hours after transduction, cells were sorted for GFP expression and transplanted as described above.
ATAC-seq
Cells for ATAC-seq were sorted as described above. The Fast-ATAC version of the ATAC-seq protocol was performed as described (Corces et al., 2016). Briefly, 10,000 cells per replicate (2 replicates per cell type) were resuspended in transposase reaction mixture (25 μL of 2X Tagmentation DNA Buffer [TD buffer; Illumina, Cat#FC-121–1030], 2.5 μL Tn5 enzyme [Illumina, Cat#FC-121–1030], 0.5 μL 1% digitonin [Promega Cat#G9441], and 22 μL water), incubated for 30 minutes at 37 oC. The tagged and transposed DNA fragments were purified using MinElute Reaction Cleanup kit (QIAgen, Cat#28204) and eluted in 11 μL elution buffer (from the MinElute kit) and amplified as described (Buenrostro et al., 2013). Libraries were sequenced to a depth of 12–23 million reads per replicate.
QUANTIFICATION AND STATISTICAL ANALYSIS
Fluorescence-activated cell sorting (FACS)
Flow cytometry was performed on FACS Aria II (BD Biosciences). Gating schemes were established with fluorescence-minus-one (FMO: staining with all fluorophores except one) controls and negative PI staining (1 μg/ml) was used as a measure for cell viability. Cells from the human xenograft model and from the in vivo skeletal-induction assays were also analyzed by FACS. FlowJo was used to analyze FACS data.
Transcriptional Expression Profiling
Raw microarray data were submitted to Gene Expression Commons (http://gexc.riken.jp) (Seita et al., 2012), where data normalization was computed against the Common Reference, which is a large collection of more than 11,939 mouse and 25,229 human array experiments deposited to the National Institutes of Health Gene Expression Omnibus (NIH GEO) database. GEXC assigns a threshold value to each probeset using the StepMiner algorithm (Sahoo et al., 2007) and calculates a percentile value between −100% and +100% for each available gene, allowing us to compare mouse and human gene expression on a normalized, continuous scale. Meta-analysis of the Common Reference also provides the dynamic range of each probe set on the array, and, in situations where there are multiple probe sets for the same gene, the probe set with the widest dynamic range was used for analysis. The Affymetrix Mouse Genome 430 2.0 Array includes 45,101 probe sets, of which 17,872 annotated genes are measurable. A list of mSSC/mBCSP-specific genes was generated by using the pattern search feature of the Gene Expression Commons (GEXC) database (Seita et al., 2012) for transcripts expressed in SSCs and BCSPs but not in their downstream progeny (Supplemental Table 1). The biomaRt R package (Durinck et al., 2009) was used to determine human orthologs to the mSSC/mBCSP-specific genes. Single cell RNA-seq data from each growth plate zone and diaphyseal region were then queried for expression of these human orthologs and zero-mean normalized by subtracting the mean gene expression. Percent positive gene enrichment was calculated by dividing the total number of positively-expressed genes by the total number of genes queried for each cell. Heatmap in Figure 1E was generated by plotting the most variable genes across single cells in the growth plate zones and diaphyseal region.
Scatter plots comparing mouse and human gene expression were plotted on ggplot2 platform in R (The R Foundation). Normalized gene expression values from probe sets with the widest dynamic range were plotted for a curated list of canonical signaling and bone development genes. Genes were broken into four quadrant groups: Q1: ↓Mouse ↑Human, Q2: ↑Mouse ↑Human, Q3: ↓Mouse ↓Human, Q4: ↑Mouse ↓Human; percent of each pathway represented in calculated as: Heatmaps were generated using normalized expression values from GEXC (Seita et al., 2012).
Single-cell RNA-seq
Data processing
bcl2fastq2 2.18 (Illumina) was used to extract the data and generate FASTQ files for each single cell by using unique barcode combinations from the Nextera XT preparation. Raw reads were trimmed for base call quality (PHRED score >=21) and for adapter sequences using Skewer (Jiang et al., 2014). Trimmed reads were then aligned to hg38 using STAR 2.4 (Dobin et al., 2013), and transcripts per million (TPM) was calculated using RSEM 1.2.21 (Li and Dewey, 2011). Raw TPM values were mean- and log2-normalized. Cells with less than 200,000 uniquely mapped reads or fewer than 1,000 genes detected were excluded, leaving 1308 out of 1508 total cells for downstream analysis. Genes that were undetectable across all cells were also removed, leaving 21,414 genes out of total 26,856. Additional filtering criteria are described here for each figure.
Data analysis
Unsupervised principal component analysis (PCA) of single cells from fetal, adult, B-HAS-derived, and iPSC-derived hSSCs was completed using the prcomp() R function (R-Core-Team, 2017). Quality filtering prior to entering the matrix for PCA included (1) removal of cells with less than 2400 gene features, (2) removal of unexpressed genes and genes in which a single value occupied greater than 80% of the total sum. A total of 196 cells, including fetal (n=42), adult (n=36), B-HAS-derived (n=77), and iPSC-derived hSSCs (n=41) and 15,386 genes were analyzed.
Supervised analysis of our scRNA-seq data was guided by a gene set of canonical signaling pathways and bone development pathways created using Gene Expression Commons (GEXC) database (Seita et al., 2012) and the Molecular Signatures Database (MSigDB) (Liberzon et al., 2015). Quality filtering steps included (1) removal of cells with fewer than ~33% of gene features expressed and (2) removal of genes expressed in fewer than ~5% of cells. Gene expression values were log2 normalized. Total of 114 genes across 196 cells were analyzed. The same [cell x gene] matrix was used to generate a Pearson correlation matrix using the ggcorrplot package in R (Kassambara, 2016). For the bulk correlation matrix, mean gene expression was calculated for each gene per group (i.e. fetal, adult, B-HAS, iPSC) and analyzed using the ggcorrplot package in R by Pearson’s correlation.
ATAC-seq analysis:
ATAC-seq reads were trimmed using CutAdapt (Martin, 2011) and aligned to the human (hg19) or mouse (mm9) genome using Bowtie2 (Langmead and Salzberg, 2012). After filtering and removing duplicate reads, peaks were called using MACS2 as previously described, without a shifting model (Buenrostro et al., 2013). HOMER was used for motif analysis using default settings (Heinz et al., 2010). Promoter-proximal and promoter-distal peaks were separated based on distance to the nearest TSS (>2kb, distal. ≤2kb, proximal) using HOMER peak annotation. To identify peaks near SSC-specific, human-specific, or mouse-specific genes, we used the HOMER annotatePeaks tool to identify the nearest gene to a given peak. We then took the set of all peaks closest to an SSC-specific, human-specific, or mouse-specific gene and performed motif enrichment analysis. To find individual instances of RUNX2 motifs, we used the HOMER annotatePeaks tool with the “--motif” option specifying the RUNX2 consensus motif.
Statistical analysis
Bar chart data illustrating the analyses comparing SSCs in human fracture and xenografts are presented as the mean ± SEM. Analyses were performed on GraphPad Prism. Unpaired, two-tailed Student’s t-tests were used, with the assumption of unequal variances (Figure 5). Reproducibility was confirmed by repeating the analysis on multiple patients, n represents the number of patients.
DATA AND SOFTWARE AVAILABILITY
The ATAC-seq, RNA-seq, and Microarray data described in this study was deposited with the gene expression omnibus with the accession number SRA: PRJNA478935.
RESOURCES TABLE
| REAGENT or RESOURCE | SOURCE | IDENTIFIER |
|---|---|---|
| Antibodies | ||
| Mouse anti-human CD45-PB, Clone HI30 (1:50) | BioLegend | Cat#304029 |
| Mouse anti-human CD235a-PB, Clone HIR2 (1:50) | BioLegend, | Cat#306612 |
| Mouse anti-human CD31-biotin, Clone WM-59 (1:50) | Thermo Fisher Scientific™ | Cat#13–0319-82 |
| Mouse anti-human CD202b, biotin-linked, Clone 33.1 (1:50) | BioLegend | Cat#334204 |
| Streptavidin, APC-AF750 (1:100) | Thermo Fisher Scientific™ | Cat#SA1027 |
| Mouse anti-human CD146-PE-Cy7, Clone SHM-57 (1:50) | BioLegend | Cat#342010 |
| Mouse anti-human PDPN-APC, Clone NZ-1.3 (1:50) | Thermo Fisher Scientific™ | Cat#17–9381-42 |
| Mouse anti-human THY1-PE, Clone 5E10, (1:50) | BioLegend | Cat#328110 |
| Mouse anti-human CD164-PE, Clone X, (1:50) | BioLegend | Cat#324808 |
| Mouse anti-human CD73-FITC, Clone Ad2, (1:50) | BioLegend | Cat#344016 |
| Mouse anti-human CD2-PE-Cy5, Clone RPA-2.10, (1:50) | BD Biosciences | Cat#555328 |
| Mouse anti-human CD3-PE-Cy5, Clone HIT3a, (1:50) | BD Biosciences | Cat#555341 |
| Mouse anti-human CD4-PE-Cy5, Clone RPA-T4, (1:50) | BD Biosciences | Cat#555348 |
| Mouse anti-human CD7-PE-Cy5, Clone M-T701, (1:50) | BD Biosciences | Cat#555362 |
| Mouse anti-human CD8-PE-Cy5, Clone RPA-T8, (1:50) | BD Biosciences | Cat#555368 |
| Mouse anti-human CD11b-PE-Cy5, Clone ICRF44, (d1:50) | BD Biosciences | Cat#555389 |
| Mouse anti-human CD14-PE-Cy5, clone MϕP9, (1:50) | BD Biosciences | Cat#562692 |
| Mouse anti-human CD16-PE-Cy5, Clone 3G8, (1:50) | BD Biosciences | Cat#555408 |
| Mouse anti-human CD19-PE-Cy5, Clone HIB19, (1:50) | BD Biosciences | Cat#555414 |
| Mouse anti-human CD20-PE-Cy5, Clone 2H7, (1:50) | BD Biosciences | Cat#561761 |
| Mouse anti-human CD56-PE-Cy5, Clone B159, (1:50) | BD Biosciences | Cat#555517 |
| Mouse anti-human CD38-PE-Cy7, Clone HB7, (1:50) | BD Biosciences | Cat#33579 |
| Mouse anti-human CD90-FITC, Clone 5E10, (1:25) | BD Biosciences | Cat#555595 |
| Mouse anti-human CD123-PE, Clone 7G3, (1:10) | BD Biosciences | Cat#554529 |
| Mouse anti-human CD235a (GPA)-PE-Cy5, clone GAR2 (1:100) | BD Biosciences | Cat#559944 |
| Mouse anti-human CD34-APC-R700, Clone 8G12, (1:25) | BD Biosciences | Cat#659123 |
| Mouse anti-human CD10-APC-Cy7, Clone HI10a, (1:25) | BioLegend | Cat#312212 |
| Mouse anti-human CD45RA-BV605, Clone HI100, (1:20) | BioLegend | Cat#304133 |
| Mouse anti-human CD45R-PE/DAZZLE 594, Clone RA3–6B2, (1:100) | BioLegend | Cat#103258 |
| Mouse anti-human HLA-A,B,C FITC, Clone W6/32(1:100) | BioLegend | Cat #311404 |
| Mouse anti-human CD19-AF700, Clone HIB19, (1:100) | BioLegend | Cat#302226 |
| Mouse anti-human CD33-AF647, Clone P67.6 (1:100) | BioLegend | Cat#366626 |
| Purified rabbit anti-human CD164, (1:100) | Sigma-Aldrich | Cat#HPA010636 |
| Purified anti-Perilipin A, (1:100) | Chemicon | Cat#AB10200 |
| Purified Adiponectin, (1:100) | Invitrogen | Cat#MA1–054 |
| Purified mouse anti-Human Nuclear Antigen, [235–1] (1:100) | Abcam | Cat#ab191181 |
| Purified rabbit polyclonal Collagen II, (1:100) | Abcam | Cat#ab34712 |
| Purified mouse anti-Osteocalcin [OC4–30], (1:100) | Abcam | Cat#ab13418 |
| Secondary goat anti-rabbit-AF-488 (1:500) | Molecular Probes | Cat#A11034 |
| Secondary goat anti-rat AF488 (1:500) | Invitrogen | Cat#A11006 |
| Secondary goat anti-mouse AF647 (1:500) | Invitrogen | Cat#A21236 |
| Secondary donkey anti-rabbit AF647 (1:500) | Molecular Probes | Cat#A31573 |
| Anti-human CD45 microbeads (1:100) | Miltenyi Biotec | Cat#130–045-801 |
| Anti-human CD34 microbeads (1:100) | Miltenyi Biotec | Cat#130–056-701 |
| Bacterial and Virus Strains | ||
| Lentivirus carrying GFP, RFP, and CFP. | Subcloned in the Weissman laboratory from pLL3.7 (Rubinson et al., 2003) | Addgene#11795 |
| Chemicals, Peptides, and Recombinant Proteins | ||
| DAPI | Biolegend | Cat#422801 |
| DiD lipophilic dye-AF647 | Life Technologies | Cat#V22887 |
| propidium iodide (PI) | Sigma-Aldrich | Cat#P4170 |
| Matrigel | Corning | Cat#CB40234A |
| paraformaldehyde (PFA) | Electron Microscopy Sciences | Cat#15710 |
| Bovine serum albumin (BSA) | Sigma-Aldrich | Cat#A9647 |
| Donkey serum | Sigma-Aldrich | Cat#D9663 |
| Goat Serum | Thermo Fisher Scientific™ | Cat#G9023 |
| Tris Buffered Saline (TBS), 10× solution | Sigma-Aldrich | Cat#T5912 |
| Phosphate Buffered Saline (PBS) | GIBCO | Cat#C14190500BT |
| Fluoromount-G | Invitrogen | Cat#00–4958-02 |
| rhBMP2 (recombinant human BMP2) | R&D Systems | Cat#355-BM/CF |
| rhVEGFR1 (recombinant human VEGFR1) | R&D Systems | Cat#321-FL/CF |
| Recombinant RNase inhibitor | Clontech | Cat#2313B |
| Triton X-100 10% | Thermo Fisher Scientific™ | Cat#85111 |
| MMLV SMARTScribe reverse transcriptase | Clontech | Cat#639538 |
| KAPA HiFi hotStart ReadyMix | Kapa Biosystems | Cat#KK2602 |
| Saffron | Sigma-Aldrich | Cat#S8381–5G |
| Acid Red 73 | Sigma-Aldrich | Cat#49823–25MG |
| Alcian Blue 8GX | Sigma-Aldrich | Cat#A3157–25G |
| Acid Fuchsin | Sigma-Aldrich | Cat#F8129–25G |
| Phosphotungstic Acid | Sigma-Aldrich | Cat#P4006 |
| Hematoxylin | Sigma-Aldrich | Cat#MHS32–1L |
| Eosin Y | Thermo Fisher Scientific™ Shandon™ | Cat#6766009 |
| Calcein-AM | Invitrogen | Cat#C1430 |
| Hoescht | Thermo Fisher Scientific™ | Cat#62249 |
| Type II collagenase | Sigma-Aldrich | Cat#C6885 |
| 100 U/mL DNase I | Worthington | Cat#NC9199796 |
| Fetal bovine serum (FBS) | Fisher Scientific | Cat#16000–069 |
| Histopaque of density 1.119 g/mL | Sigma-Aldrich | Cat#11191 |
| Alizarin Red stain | Sigma-Aldrich | Cat#A5533 |
| TRIzol LS | Invitrogen | Cat#10296028 |
| Ethylenediaminetetraacetic acid (EDTA) | Invitrogen | Cat#15573–038 |
| Optimal Cutting Temperature compound (OCT) | Fisher Scientific | Cat#23–730-571 |
| Human platelet derived lysate | Stem Cell Technologies | Cat#06960 |
| MEM alpha medium | Thermo Fisher Scientific™ | Cat#12561–056 |
| Penicillin-Streptomycin Solution | Thermo Fisher Scientific™ | Cat#15140–122 |
| 0.1% Gelatin Solution | Millipore | Cat#ES-006-B |
| Media 199 (M199) | Sigma-Aldrich | Cat#C6885 |
| Dulbecco’s Modified Eagle Medium (DMEM)/F12 | Thermo Fisher Scientific™ | Cat#11320–033 |
| Dexamethasone | MP Biomedicals | Cat#194561 |
| Sodium β-glycerophosphate | Sigma-Aldrich | Cat#G9891 |
| Ascorbic acid 2-phosphate | Sigma-Aldrich | Cat#A8960 |
| Human Insulin Recombinant Protein | Invitrogen | Cat#RP-10908 |
| 3-isobutyl-1-methylxanthine (IBMX) | Sigma-Aldrich | Cat#I7018 |
| Indomethacin | Sigma-Aldrich | Cat#57413 |
| Oil Red O | Sigma-Aldrich | Cat#O0625 |
| Alcian blue stain | Sigma-Aldrich | Cat#A5268 |
| Geltrex | Gibco | Cat#A1569601 |
| Essential 8 Medium | Gibco | Cat#A1007101 |
| Human recombinant stem cell factor | Peprotech | Cat#300–07 |
| Human recombinant thrombopoietin | Peprotech | Cat#300–18 |
| Human basic fibroblast growth factor | R&D Systems | Cat#P09038 |
| Human ng/mL insulin growth factor | R&D Systems | Cat#P05019 |
| Stemline serum-free hematopoietic stem cell expansion media | Sigma-Aldrich | Cat#S0192 |
| 2× TD Buffer (Tagmentation DNA Buffer) | Illumina | Cat#FC-121–1030 |
| Tn5 enzyme | Illumina | Cat#FC-121–1030 |
| Digitonin | Promega | Cat#G9441 |
| Agencourt AMPure XP beads | BEECKMAN COULTER | Cat#A63882 |
| UltraPure™ DNase/RNase-Free Distilled Water | Thermo Fisher Scientific™ | Cat#10977023 |
| Critical Commercial Assays | ||
| Nextera XT DNA Library Preparation kit | Illumina | Cat#FC-131–1096 |
| High Sensitivity DNA analysis kit | Advanced Analytics, Stanford SFGF facility | N/A |
| Qubit dsDNA HS Assay kits | Thermo Fisher Scientific™ | Cat#Q32851 |
| M.O.M. immunodetection kit | Vector Laboratories | Cat#BMK-2202 |
| RNeasy Micro Kit | Qiagen | Cat#74004 |
| Arcturus™ RiboAmp™ PLUS Kit | Applied Biosystems™ | Cat#KIT0521 |
| StemPro chondrogenesis differentiation kit | Thermo Fisher Scientific™ | Cat#A1007101 |
| QIAGEN MinElute Reaction Cleanup kit | QIAgen | Cat#28204 |
| Deposited Data | ||
| Microarray data, ATAC-seq data, sc-RNA-seq data | This paper | PRJNA478935 |
| Experimental Models: Cell Lines | ||
| Human: Human monocyte derived iPSC line SCVI 113 | A gift from the laboratory of Joseph C. Wu | N/A |
| Experimental Models: Organisms/Strains | ||
| Mouse: BA (C57BL/Ka-Thy1.1-CD45.1) | The Jackson Laboratory | JAX: 000406 |
| Mouse: NSG (NOD.Cg-Prkdcscid Il2rgtm1Wjl/SzJ) | The Jackson Laboratory | JAX: 005557 |
| Mouse: RFP (B6.Cg-Tg(CAG-mRFP1)1F1Hadj/J) | The Jackson Laboratory | JAX: 005884 |
| Human: human fetal samples | Stemexpress | N/A |
| Oligonucleotides | ||
| Oligo-dT30VN (5′– AAGCAGTGGTATCAACGCAGAGTACT30VN-3′) | IDT | N/A |
| template-switching oligonucleotide (TSO) (5′-AAGCAGTGGTATCAACGCAGAGTACATrGrG+G-3′) | Exiqon | N/A |
| ISPCR primers (5′-AAGCAGTGGTATCAACGCAGAGT-3′) | IDT | N/A |
| dNTP | Invitrogen | Cat#10297–018 |
| ERCC (External RNA Controls Consortium) ExFold RNA Spike-In Mixes | Invitrogen | Cat#4456739 |
| Recombinant DNA | ||
| cDNA expression cassettes for SOST | Genecopeia | Cat#Mm11378 |
| cDNA expression cassettes for DNAJB6 | Genecopeia | Cat#Mm21356 |
| Software and Algorithms | ||
| Leica DMI6000B inverted microscope system running Leica Application Suite (LAS)-X software | Leica Microsystems | NA |
| ImageJ | NIH | http://wsr.imagej.net/distros/osx/ij152osx-java8.zip |
| GraphPad Prism 6.0 | GraphPad Software | https://www.graphpad.com/scientific-software/prism |
| Bioanalyzer | Agilent | https://www.genomics.agilent.com/en/Bioanalyzer-System/2100-Expert-Software/?cid=AG-PT-106&tabId=AG-PR-1002 |
| Qubit 2.0 Fluorometer runs specific Invitrogen Qubit quantitation assays | Invitrogen | REF. Q32866 |
| NextSeq 500; The NextSeq System Suite software; NCS v2.0 | Illumina | ftp://webdata2:webdata2@ussdftp.illumina.com/downloads/Software/nextseq/nextseq-system-suite-v2-0-1.zip |
| HiSeq 4000 | Illumina | ftp://webdata2:webdata2@ussd-ftp.illumina.com/downloads/software/hiseq/hiseq-3000-4000hcs-3-4-0-38.zip |
| FlowJo | FLOWJO LLC | https://www.flowjo.com/ |
| bcl2fastq2 2.18 | Illumina | https://support.illumina.com/sequencing/sequencing_software/bcl2fastqconversion-software.html |
| Skewer | Jiang et al., 2014 | https://sourceforge.net/projects/skewer |
| STAR 2.4 | Dobin et al. 2013 | https://github.com/alexdobin/STAR |
| RSEM 1.2.21 | Li and Dewey, 2011 | https://deweylab.github.io/RSEM/ |
| Gene Expression Commons (GEXC) database | Seita et al. 2012 | http://gexc.riken.jp |
| The R package for Statistical Computing | The R Foundation | https://www.rproject.org/ |
| BD FACSAria II | BD Biosciences | http://www.bdbiosciences.com/cn/home |
| Molecular Signatures Database | MSigDB | http://software.broadinstitute.org/gsea/msigdb |
| Gene Chip Scanner 3000 running GCOS 1.1.1 software | Affymetrix | http://www.affymetrix.com/products/software/specific/gcos.affx |
| CutAdapt (Martin, 2011) | Martin, 2011 | http://code.google.com/p/cutadapt/ |
| Bowtie2 | Langmead and Salzberg, 2012 | http://bowtie-bio.sourceforge.net/bowtie2/index.shtml |
| MACS2 v. 2.0.10, pileup | Buenrostro et al 2013 | http://liulab.dfci.harvard.edu/MACS/ |
| HOMER | Heinz et al., 2010 | Homer.ucsd.edu/homer/ |
| Other | ||
| Mouse Affymetrix 430–2.0 array | Affymetrix, Applied Biosystems™ | Cat#900495 |
| Human Affymetrix HG-U133+ array | Affymetrix, Applied Biosystems™ | Cat#901569 |
Supplementary Material
Supplemental Figure 1 (related to Figure 1). Comparative transcriptome analysis of mSSC/mBCSP core genes within scRNA-seq data obtained from different zones in the human bone to identify zones where hSSCs are most enriched.
A) Bar chart showing percent of human orthologs to mSSC/mBCSP-specific genes expressed in human CD45-CD235- single cells from each zone as in “Figure 1F” with the addition of periosteum. Grayscale gradient from “low” to “high” percent gene enrichment is shown. Aggregated bulk representation of single cell data calculated by mean ± standard deviation of single-cell percent gene enrichment for each zone is also shown. Statistical significance was calculated by one-way ANOVA with post-hoc Tukey HSD test with proliferative 1 (P1) as reference at an α-level of 0.01, as done in “Figure 1F”. **p-value<0.005, ****p-value<0.0005.
B) hSSC-specific putative cell-surface markers. Candidate surface markers from the Gene Expression Commons (GEXC) (Seita et al., 2012) “cell surface” and “CD antigen” gene sets. Only cell-surface markers that were expressed in at least ~15% of total cells sequenced, showed statistically significant variability in expression across different zones, and for which flow cytometry-tested antibodies were available were selected for downstream FACS analysis. Markers identified to separate growth plate zones into visually and functionally distinct populations by FACS are highlighted in red.
C) PDPN, CD146, CD164, and CD73 separate human fetal growth plate into subpopulations by flow cytometry and immunohistochemistry. Top panel shows distribution of PDPN and CD146 on a FACS plot for the different anatomical zones as described in “Figure 1A–E”. The PDPN+CD146- gate is highlighted in red and a further drill-down shows CD164 and CD73 expression-spread within this population (bottom panel). Each gate is annotated with its skeletal lineage identity (SSC, BCSP, OP, or CP) and the adjacent numerical values represent percentage of cells in each gate (n=3).
D) Movat pentachrome staining of fetal bone marks three distinct regions within the bone: (i) Hypertrophic zone, (ii) Growth plate and (iii) Ossification zone. Scale: 500 μm (left). Immunofluorescent (IF) images showing the spatial organization of hSSC markers in the longitudinal bone sections (middle and right). The PDPN+CD146- (red arrowheads) and the PDPN+CD146+ (white arrowheads) cells reside above the ossification zone; the PDPN-CD146+cells (green arrow) are in the ossification zone (middle). Scale: 100 μm. Magnification 5×. The CD164+ (red arrowheads), and CD73+ (green arrowheads) single-positive cells as well as the double-positive CD164+CD73+ cells (white arrowheads), which include the hSSC are also shown (right panel). Scale: 200 μm.
E) Bar chart showing fraction of PDPN+CD146-CD73+CD164+ single-cells that show 0–9, 9–18, or >18 % enrichment for human orthologs to mSSC/mBCSP-specific genes (left). Bar chart showing percent of PDPN+CD146-CD73+CD164+ cells in diaphysis, periosteum, and p-H2/H1 zones in the growth plate (right). p-values were calculated by Fisher exact test using a 2×2 contingency table.
F) scRNA-seq data supports enrichment of PDPN, CD73, and CD164 and depletion of CD146 within the fetal bone growth plate region. Bar chart showing log2 fold-change in mean transcripts per million (TPM) between pre-hypertrophic 2/hypertrophic 1 (p-H2/H1) zones and the diaphysis (D). Markers identified to separate growth plate zones into visually and functionally distinct populations by FACS are highlighted in red.
Supplemental Figure 7 (related to Figure 7): mSSCs transduced with hSSC-specific WNT antagonists form larger bone ossicles in vivo.
A) Experimental strategy for testing functional effect of overexpression of human-specific SSC genes in mSSCs by lentiviral transduction. Five replicates of renal capsule transplants in NSG mice were performed (n=5). mSSCs transduced with GFP were used as negative-control. Ossicles thus developed in vivo from the transduced mSSCs were extracted after either 16 or 32 days post-transplant for examination.
B) (i) Fluorescent (left) and brightfield (right) images from two different experiments showing ossicles that are derived from transplanted GFP-labeled-mSSCs after 32 days of development. Scale: 1 mm.
(ii) Movat pentachrome stain of a cross-section of one of the ossicles shown in B-(i); yellow: bone, blue: cartilage, purple: marrow (bottom).
(iii) IF image of a cross-section of an ossicle derived from GFP-labelled-mSSCs after 16 days of development showing osteocalcin expression (top); Movat pentachrome stained image of an adjacent cross-section of the same ossicle (bottom). Scale: 100 μm.
C) (i) Skeletal lineage tree showing expression levels of SOST in human and Sost in mouse SSCs and downstream progenitors based on microarray data. Gene expression was normalized to a scale of −100 to +100, where values >0 are colored shades of red, while values <0 are colored shades of blue.
(ii) Fluorescent (left) and brightfield (right) images from two different experiments showing ossicles that were derived from SOST/GFP-tranduced-mSSCs after 32 days of development. Scale: 1 mm.
(iii) Movat pentachrome stained image of a cross-section of one of the ossicles shown in C-(ii); yellow: bone, blue: cartilage, purple: marrow.
(iv) IF image of a cross-section of an ossicle derived from SOST/GFP-transduced-mSSCs after 16 days of development showing Osteocalcin expression (top); Movat pentachrome stained image of an adjacent cross-section of the same ossicle (bottom). Scale: 100 μm.
D) (i) Skeletal lineage tree showing expression levels of DNAJB6 in human and Dnajb6 in mouse SSCs and progenitors based on microarray data. Gene expression was normalized to a scale of −100 to +100, where values >0 are colored shades of red, while values <0 are colored shades of blue.
(ii) Fluorescent (left) and brightfield (right) images from two different experiments showing ossicles that were derived from DNAJB6/GFP-labeled-mSSCs after 32 days of development. Scale: 1 mm.
(iii) Movat pentachrome stained image of a cross-section of one of the ossicles shown in D-(ii); yellow: bone, blue: cartilage, purple: marrow.
(iv) IF image of a cross section of an ossicle derived from DNAJB6/GFP-transduced-mSSCs ossicle section after 16 days of development showing Osteocalcin expression (top); Movat pentachrome stained image of an adjacent cross-section of the same ossicle (bottom). Scale: 100 μm.
E) Quantification of relative ossicle sizes formed by mSSC transduced with GFP, SOST/GFP, or DNAJB6/GFP by morphometric analysis. *p<0.05.
F) Heat map showing expression levels of selected genes in GFP-, SOST/GFP-, and DNAJB6/GFP-transduced mSSCs based on microarray data.
Supplemental Table 1 (related to Figure 1): Geneset of human orthologs to mSSC/mBCSP-specific genes as generated by the Gene Expression Commons (GEXC) (Seita et al., 2012).
Supplemental Table 2 (related to all Figures): Human specimen number, age, sex and average hSSC per million FACS events.
Supplemental Table 3 (related to Figure 6): Curated set of canonical signaling pathways and bone development genes created using the GEXC (Seita et al., 2012) and Broad Institute’s Molecular Signature Database (MSigDB) (Liberzon et al., 2015).
Supplemental Table 4 (related to Figure 7): Transcriptional comparison between mouse and human osteoprogenitors. Supervised transcriptional comparison of microarray data from mouse (CD200-CD51+CD105+THY1+) and human osteoprogenitors (PDPN-CD146+) (n=3). Heatmaps show expression of genes associated with collagen, extracellular matrix, fibronectin, and elastin as determined from the GEXC database (Seita et al., 2012). All gene expression values are normalized to a scale of −100 to +100, where values >0 are colored shades of red, while values <0 are colored shades of blue.
Supplemental Table 5 (related to Figure 7): Transcriptional comparison between mouse and human chondroprogenitors. Supervised transcriptional comparison of microarray data from mouse (CD200-CD51+CD105+THY1+) and human chondroprogenitors (PDPN+CD146-CD73+CD164-) (n=3). Heatmaps show expression of genes associated with collagen, extracellular matrix, fibronectin, and elastin as determined from the GEXC database (Seita et al., 2012). All gene expression values are normalized to a scale of −100 to +100, where values >0 are colored shades of red, while values <0 are colored shades of blue.
Supplemental Figure 2 (related to Figure 2). hSSCs self-renew in vivo and generate serial multilineage ossicles.
A) Experimental strategy to test the self-renewal property of hSSC (n=6).
B) Prior to the primary transplant in the renal capsule of NSG mice, freshly isolated hSSC were stained with a lipophilic dye (red) and compared to unstained cells (gray). The resulting graft was explanted 2 weeks post-transplant. The hSSC were re-isolated from the graft and exhibited lower lipophilic dye fluorescence (blue) indicating that dye-labeled-hSSCs had undergone cell-division in vivo. The re-isolated hSSCs were then transplanted into renal capsule of a secondary NSG host, allowed to develop in vivo for 4 weeks, and the resulting grafts were extracted for histology.
C) (i) 500 single hSSC were isolated from fresh 17–19-week fetal bone, plated for colony formation and imaged by phase microscopy to examine cell morphology after each of the serial passages all the way up to the quaternary colonies (top row). Scale: 20 μm. FACS plots show that throughout serial colony formation, hSSC retains their ability to self-renew and ultimately consists of 49.3% of the parent population after quaternary colony formation (bottom row).
(ii) 100,000 hSSCs isolated in C-(i) were embedded in Matrigel and transplanted into the renal capsule of NSG mice. The primary graft was explanted 4 weeks after development, dissociated, hSSCs were purified and plated for two-rounds of serial colony formation in vitro up to a tertiary passage. Phase microscopic images for colonies at each of the serial stages show similar morphology (top row). Scale: 20 μm. FACS profiles of the serial colonies derived from hSSCs purified from primary graft at each stage of serial passage; hSSC comprise 39.5% of the total cells in the parent population in the tertiary colony (bottom row).
D) Brightfield images of the primary hSSC graft 2 weeks after transplant into the renal capsule (left) and 4 weeks after the secondary transplant (right) from B. Scale: 1 mm.
E) Movat pentachrome showing different tissue components of the hSSC graft. An Alcian blue region indicates cartilage presence (white arrow head) and a yellow region indicates bone (black arrowhead). Scale: 250 μm.
F) (i) FACS plot showing gating strategy for isolating CD146+ mesenchymal stem cells (redbox).
(ii) Cellular morphology of the mesenchymal stem cells after 2 weeks in culture.
(iii) FACS profile and gating strategy for re-isolating CD146+ mesenchymal stem cells after 2 weeks in culture.
(iv) Cellular morphology of CD146+ mesenchymal stem cells after further 1 week of serial (secondary) culture. Images are representative of three independent experiments (n=3). Scale: 20 μm.
G) (i) FACS profile and gating strategy for isolating hSSCs.
(ii) Cellular morphology of hSSCs after 2 weeks in culture.
(iii) FACS profile and gating strategy for re-isolating hSSCs after 2 weeks in culture.
(iv) Cellular morphology of hSSC after a further 1 week of serial (secondary) culture. Images are representative of three independent experiments (n=3). Scale: 20 μm.
Supplemental Figure 3 (related to Figure 3). hSSCs do not differentiate into adipocytes.
A) Experimental strategy for isolating adult hSSC or human adipose stromal cell (hASC) and assessing their in vitro and in vivo adipogenic potential (n=6).
B) Microarray data analyzed using GEXC (Seita et al., 2012) platform showing known osteogenic genes that are upregulated in the hSSC, but not in human-derived fat samples and vise versa.
C) Adult (middle) and fetal (left) hSSCs were isolated, differentiated using adipogenic conditions and stained for Oil Red O. hASCs were used as a positive control (right). Black arrowheads indicate lipid globules. Scale: 100 μm.
D) Test for adipogenic differentiation potential of skeletal progenitors. Brightfield and Oil Red O stained images of either non-induced (top two rows) or adipogenic-induced (bottom two rows) human bone, cartilage and stromal progenitor (hBCSP) (left), human osteoprogenitor (hOP) (middle), and double-negative human chondroprogenitor (hCP) populations (right) is shown. Scale: 100 μm.
E) hSSC were transplanted into the inguinal fat pads of immunodeficient RFP mice, grafts (marked by white dashed border) were harvested 4 weeks after transplant, sectioned and stained with FITC-labelled antibodies directed against mouse and human perilipin and adiponectin, both of which constitute pan-adipose markers (top row). A cross-section of human adipose tissue stained in the same fashion was used as a positive control for adiponectin and perilipin staining antibodies (bottom row). Rightmost panel shows Movat pentachrome staining of adjacent cross-sections of the same graft; yellow: bone, blue: cartilage, purple: marrow. Mouse-derived fat (white arrowhead) adjacent to hSSC derived compacted bone-like tissue and cartilage (black arrowhead) is shown. Scale: 100 μm.
Supplemental Figure 4 (related to Figure 3): hSSCs generate hematopoiesis-supportive stroma.
A) Experimental strategy for co-culturing Lin-CD34+CD38-THY1loCD45RA- hHSCs with human skeletal progenitors and analyzing multilineage engraftment after hHSC transplantation into sublethally irradiated immunodeficient NSG mice (n=10).
B) Representative FACS plots showing myeloid and lymphoid xenograftment in recipient NSG mice 8 weeks after transplant of freshly sorted uncultured hHSCs, hHSCs cultured without stroma, or hHSCs co-cultured with hSSCs, hBCSPs, or hOPs. Human antigen: HLA-ABC, hematopoietic antigen: hCD45, lymphoid antigen: hCD19, myeloid antigen: hCD33.
C) Bar chart showing percent myeloid and lymphoid engraftment of uncultured hHSCs, hHSCs cultured without stroma, and hHSCs co-cultured with hSSCs, hBCSPs, or hOPs.
D) Model of niche interactions between skeletal and hematopoietic lineage trees; MPP: multipotent progenitor, LMPP: lymphoid-primed multipotent progenitor, MEP: megakaryocyte-erythroid progenitor, CLP: common lymphoid progenitor, GMP: granulocyte-macrophage progenitor.
E) Ligand-receptor interaction maps demonstrating cis- and trans-signaling patterns within and between skeletal and hematopoietic lineages. Gene expression analysis of microarray data from skeletal and hematopoietic subsets show ligands in the left column and cognate receptors in the right column. Gene expression was normalized to a scale of −100 to +100, where values >0 are colored shades of red, while values <0 are colored shades of blue. The connecting arrows indicate possible ligand-receptor interaction pathways; CSF1: colony stimulating factor 1, SDF: stromal cell-derived factor, SCF: stem cell factor.
F) i. Table listing cytokines expressed by various members of the human skeletal lineage tree as determined by microarray analysis using GEXC platform (Seita et al., 2012). Values in parentheses represent cytokine expression levels from microarray data normalized to a scale of 0 to 10. Only skeletal cells with normalized gene expression >0 are included.
ii. Table listing representative skeletal regulatory factors expressed by different types of human hematopoietic progenitors and the hHSCs as determined after the analysis of microarray data using the GEXC platform. Values in parentheses represent cytokine expression-values normalized to a scale of 0 to 10. Only hematopoietic cells with normalized gene expression >0 are included.
G) Heatmap shows log2(TPM+1) variable gene expression of cytokines that were expressed in at least ~15% of total cells sequenced across single human fetal and adult skeletal progenitors. Dendrogram showing hierarchical clustering of the expressed cytokines calculated using Ward’s method.
Supplemental Figure 5 (related to Figure 7): Transcriptionally conserved skeletal pathways between mouse and human SSCs.
A) Analysis pipeline for transcriptional comparison of mSSCs and hSSCs microarray data using the GEXC platform (Seita et al., 2012) (n=3).
B) Diagram showing shared and unshared genes (that belong to WNT, BMP, Hedgehog, FGF, and Notch pathways, and the gene ontology [GO] Bone Development gene set) between mSSCs and hSSCs. Percent enrichments of each gene set are represented in each Cartesian quadrant (formula: ; Q1: ↓Mouse ↑Human, Q2: ↑Mouse ↑Human, Q3: ↓Mouse ↓Human, Q4: ↑Mouse ↓Human). Legend with corresponding color codes is shown on the left.
C) Scatter plot showing gene expression within mSSCs and hSSCs. Expression values were normalized to a scale of −100 to +100 for genes that are known to comprise canonical signaling and bone development pathways. Genes are labeled by number and reference is provided in “Supplemental Table 3“. Color codes are the same as in B. SOST, DNAJB6 are circled in red.
D) Pie charts showing distribution of each gene set (WNT, BMP, FGF, Hedgehog, Notch, and GO Bone Development) across the four quadrants as described in B, (Q1: ↓Mouse ↑Human, Q2: ↑Mouse ↑Human, Q3: ↓Mouse ↓Human, Q4: ↑Mouse ↓Human). Legend with corresponding color codes is shown at the bottom.
Supplemental Figure 6 (related to Figure 7): Proximal/distal enhancer motifs in mSSC and hSSC.
A) ATAC-seq libraries were prepared from age-matched hSSCs and mSSCs purified from 18-week human and e17.5 mouse fetal bone, respectively (n=3). Plot shows log2(reads) in ATAC-seq peaks for hSSC replicates 1 and 2; R=0.94 (left) and mSSC replicates 1 and 2; R=0.91 (right).
B) Table showing the top 5 transcription factor (TF) motifs enriched in hSSC ATAC-seq peaks closest to SSC-specific genes from HOMER (Heinz et al., 2010) (left). SSC-specific genes are genes expressed in hSSCs and mSSCs but not in their corresponding downstream osteogenic or chondrogenic progenitors as calculated by GEXC platform (Seita et al., 2012) using microarray data. Bar chart (right) shows the percentage of hSSC ATAC-seq peaks that are enriched with the TF motifs listed in the table on left compared to the percentage of background sites harboring the same motifs.
C) Table showing top 5 TF motifs enriched in ATAC-seq peaks near human-specific SSC genes. Human-specific SSC genes are a subset of SSC-specific genes that are expressed in human but not mouse SSCs. Motifs enriched in hSSC ATAC-seq peaks near human-specific genes (1713 peaks, 148 genes) are shown on the left. Motifs enriched in mSSC ATAC-seq peaks near human-specific genes (1194 peaks, 148 genes) are shown on the right.
D) Bar chart showing the percentage of ATAC-seq peaks with the top enriched TF motifs near human-specific SSC genes. Each set of peaks (human and mouse) is compared against a set of background sites.
E) Plots showing the enrichment of ATAC-seq reads at transcription start sites (TSSs) in hSSCs (left) and mSSCs (right). The plot shows the number of Tn5 insertions averaged over all known TSSs in the genome, representing the signal-to-noise ratio in the ATAC-seq libraries (n=3).
F) Density plot showing the log2 distance to the nearest TSS of all ATAC-seq peaks in hSSCs (black) and mSSCs (red). Two peaks represent promoter-proximal sites of accessibility and promoter-distal sites of accessibility, highlighting the ability to identify both active promoters and putative enhancers.
G and H) The top 5 TF motifs [using HOMER (Heinz et al., 2010)] enriched at promoter-proximal (<2kb from nearest TSS) and promoter-distal (>2kb from nearest TSS) regions of chromatin accessibility in hSSCs (left) and mSSCs (right).
I) Example of a human-specific SSC gene, DNAJB6. ATAC-seq signal at the human DNAJB6 locus (top) and the mouse Dnajb6 locus (bottom). Green rectangles mark ATAC-seq peaks that were identified close to the DNAJB6 locus. Purple rectangles mark a subset of green ATAC-seq peaks that contain RUNX motifs.
J) Example of an SSC-specific gene, Wnt4. ATAC-seq signal at WNT4 locus and location of two known SNPs. A GWAS SNP for height, rs1014987, is marked in blue. Another GWAS SNP for bone mineral density, rs7521902, is marked in red. PDPN+CD146-Additional Explanation for Supplemental Figure 6 (related to Figure 7) To understand the gene regulatory programs underlying the SSC identity and how they are different in mouse and human systems, we performed ATAC-seq on mouse and human SSCs isolated at similar developmental stages (18-week-old human and e17.5 mouse embryo) to identify sites of accessible chromatin genome-wide. This analysis revealed active promoters as well as gene-distal enhancers (Supplemental Figure 6 A, E, F). To identify TFs that might be important in regulating the SSC state, we performed motif enrichment analysis on the set of all hSSC accessible loci and found that proximal-promoter regions are enriched in ATF, RUNX, CTCF, NFAT, and MYB motifs, while distal accessible regions are enriched for motifs corresponding to ETS, NFY, RUNX, ATF, and KLF family of TFs (Supplemental Figure 6G). The motifs for many of the same factors were enriched in ATAC-seq peaks in mSSCs (Supplemental Figure 6H), suggesting that a similar TF-network drives SSC fate in these two species. To probe the network that is responsible for gene expression specifically in the skeletal stem cell state, we performed motif enrichment analysis on the set of peaks located close to genes that are transcribed in both mouse and human SSCs, but not in downstream osteogenic or chondrogenic progenitors—the expression pattern referred to as “skeletal stem cell-specific program”. We found that in hSSCs, the binding motifs of the same factors that are enriched in all accessible chromatin (ATF, RUNX, CTCF, NFAT, BACH family of TFs) are also enriched in the skeletal stem cell-specific program (Supplemental Figure 6B). Having found that the same TFs are driving SSC identity in both the human and mouse SSC, we sought to understand species-specific differences between these two cell types at the epigenetic level. We focused on genes that are transcribed in the hSSC but not in the mSSC, as they may drive some of the phenotypic differences in the two skeletal systems. We found that while active regulatory regions (accessible sites) near human-specific SSC genes in hSSCs harbor the core SSC TF-motifs, sites near those same genes in the mouse do not harbor all of them (Supplemental Figure 6 C, D). Notably, predicted RUNX binding sites are not enriched in the open chromatin landscape in mSSCs near human-specific SSC genes. An example is shown in Figure 7D at the SOST locus. In hSSCs, there are many active regulatory regions just downstream of SOST, four of which harbor potential RUNX binding sites that are not conserved in mouse (middle, Figure 7D). The Sost locus in mSSCs shows greatly reduced chromatin accessibility, reflecting that this gene is not active in mSSCs. The same is true for another human-specific gene, DNAJB6 (Supplemental Figure 6I). These data suggest that genes that are expressed in a species-specific way in SSCs and may be functionally important for SSC function have acquired binding sites for TFs in the core SSC transcriptional network through evolution. Genome-wide association studies (GWAS) have identified several non-coding genomic polymorphisms that are associated with human bone mineral density and height, traits arising during development and homeostasis in the skeletal system (Chan et al., 2015; Estrada et al., 2012). Out of the 56 SNPs strongly associated with variation in bone mineral density in humans, one is contained in a predicted RUNX binding site within the SOST locus (middle left, Figure 7D). This reinforces the notion that SOST may play an important functional role in the hSSC and that RUNX factor binding may enhance its transcription. However, to test this hypothesis, it will first be necessary to validate the predicted RUNX binding sites with CHiP assays. In addition, we found that there are GWAS SNPs associated with bone mineral density and height in accessible non-coding regions surrounding SSC-specific genes. For example, SNPs for bone mineral density and height are found upstream of the WNT4 promoter (Supplemental Figure 6J). This finding suggests that these variants may exert their effects on height and bone density specifically at the stem cell level.
PDPN+CD146-CD73+CD164+ marks a self-renewing, multipotent human skeletal stem cell
hSSCs can be isolated from fetal, adult, BMP2-treated human adipose stroma, and iPSCs
hSSCs undergo local expansion in response to acute skeletal injury
Comparison of mouse and human SSCs reveals evolutionary differences in skeletogenesis
Acknowledgements
We thank Ben Barres, Justyna Janas, and Randall Mann, for their support and mentorship. A. McCarty and C. Wang for mouse colony management; P. Pereira, T. Storm, T. Naik, L. Quinn, L. Jerabek, S. Kantoff and C. McQuarrie for lab management; and P. Lovelace, J. Ho, and S. Weber for FACS Support. Joseph C. Wu for kind gift of iPSC line. This study was supported by the NIH; R01DE027323, R56 DE025597, R01 DEO26730, R01 DE021683, R21 DE024230, U01HL099776, U24DE026914, and R21 DE019274, CIRMTR1–01249, Oak Foundation, Hagey Laboratory, and Gunn/Olivier Research Fund to M.T.L.; U01HL099999, 5 R01 CA86065, and 5 R01 L058770 to I.L.W.; Siebel Fellowship, PCF YI Award, Stinehart/Reed, and the NIA1K99AG049958–01A1 to C.K.F.C.; HHMI Fellowship to G.S.G.; PSRF to M.P.M.; DFG399915929 to T.H.A.; NIH P50-HG007735 to H.Y.C., NIH 2R01AR055650, 1R01AR063717 and the Ellenburg Chair to S.B.G.; and 1S10RR02933801.
Footnotes
Declaration of Interests
Patent is pending for the isolation, derivation, and use of human skeletal stem cells and downstream skeletal progenitors.
References
- Baum CM, Weissman IL, Tsukamoto AS, Buckle AM, and Peault B (1992). Isolation of a candidate human hematopoietic stem-cell population. Proc Natl Acad Sci U S A 89, 2804–2808. [DOI] [PMC free article] [PubMed] [Google Scholar]
- Bensidhoum M, Chapel A, Francois S, Demarquay C, Mazurier C, Fouillard L, Bouchet S, Bertho JM, Gourmelon P, Aigueperse J, et al. (2004). Homing of in vitro expanded Stro-1- or Stro-1+human mesenchymal stem cells into the NOD/SCID mouse and their role in supporting human CD34 cell engraftment. Blood 103, 3313–3319. [DOI] [PubMed] [Google Scholar]
- Beyth S, Schroeder J, and Liebergall M (2011). Stem cells in bone diseases: current clinical practice. Br Med Bull 99, 199–210. [DOI] [PubMed] [Google Scholar]
- Chan CK, Chen CC, Luppen CA, Kim JB, DeBoer AT, Wei K, Helms JA, Kuo CJ, Kraft DL, and Weissman IL (2009). Endochondral ossification is required for haematopoietic stem-cell niche formation. Nature 457, 490–494. [DOI] [PMC free article] [PubMed] [Google Scholar]
- Chan CK, Lindau P, Jiang W, Chen JY, Zhang LF, Chen CC, Seita J, Sahoo D, Kim JB, Lee A, et al. (2013). Clonal precursor of bone, cartilage, and hematopoietic niche stromal cells. Proc Natl Acad Sci U S A 110, 12643–12648. [DOI] [PMC free article] [PubMed] [Google Scholar]
- Chan CK, Seo EY, Chen JY, Lo D, McArdle A, Sinha R, Tevlin R, Seita J, Vincent-Tompkins J, Wearda T, et al. (2015a). Identification and specification of the mouse skeletal stem cell. Cell 160, 285–298. [DOI] [PMC free article] [PubMed] [Google Scholar]
- Chan Y, Salem RM, Hsu YH, McMahon G, Pers TH, Vedantam S, Esko T, Guo MH, Lim ET, Consortium G, et al. (2015b). Genome-wide Analysis of Body Proportion Classifies Height-Associated Variants by Mechanism of Action and Implicates Genes Important for Skeletal Development. Am J Hum Genet 96, 695–708. [DOI] [PMC free article] [PubMed] [Google Scholar]
- Compton JT, and Lee FY (2014). A review of osteocyte function and the emerging importance of sclerostin. J Bone Joint Surg Am 96, 1659–1668. [DOI] [PMC free article] [PubMed] [Google Scholar]
- Estrada K, Styrkarsdottir U, Evangelou E, Hsu YH, Duncan EL, Ntzani EE, Oei L, Albagha OM, Amin N, Kemp JP, et al. (2012). Genome-wide meta-analysis identifies 56 bone mineral density loci and reveals 14 loci associated with risk of fracture. Nat Genet 44, 491–501. [DOI] [PMC free article] [PubMed] [Google Scholar]
- Fleming A, Kishida MG, Kimmel CB, and Keynes RJ (2015). Building the backbone: the development and evolution of vertebral patterning. Development 142, 1733–1744. [DOI] [PubMed] [Google Scholar]
- Karp JM, Ferreira LS, Khademhosseini A, Kwon AH, Yeh J, and Langer RS (2006). Cultivation of human embryonic stem cells without the embryoid body step enhances osteogenesis in vitro. Stem Cells 24, 835–843. [DOI] [PubMed] [Google Scholar]
- Kojima T, Shimazui T, Hinotsu S, Joraku A, Oikawa T, Kawai K, Horie R, Suzuki H, Nagashima R, Yoshikawa K, et al. (2009). Decreased expression of CXXC4 promotes a malignant phenotype in renal cell carcinoma by activating Wnt signaling. Oncogene 28, 297–305. [DOI] [PubMed] [Google Scholar]
- Lange A, Dlubek D, Drabczak-Skrzypek D, Bogunia-Kubik K, and Emilia (2005). Marrow Cells Cultured in MSC Medium Expand to CD73, CD90 and CD105 Cells of Fibroblast-Like Morphology. Blood 106, 4319–4319. [Google Scholar]
- Liberzon A, Birger C, Thorvaldsdottir H, Ghandi M, Mesirov JP, and Tamayo P (2015). The Molecular Signatures Database (MSigDB) hallmark gene set collection. Cell Syst 1, 417–425. [DOI] [PMC free article] [PubMed] [Google Scholar]
- Lo DD, Hyun JS, Chung MT, Montoro DT, Zimmermann A, Grova MM, Lee M, Wan DC, and Longaker MT (2012). Repair of a critical-sized calvarial defect model using adipose-derived stromal cells harvested from lipoaspirate. J Vis Exp. [DOI] [PMC free article] [PubMed] [Google Scholar]
- Lv FJ, Tuan RS, Cheung KM, and Leung VY (2014). Concise review: the surface markers and identity of human mesenchymal stem cells. Stem Cells 32, 1408–1419. [DOI] [PubMed] [Google Scholar]
- Marecic O, Tevlin R, McArdle A, Seo EY, Wearda T, Duldulao C, Walmsley GG, Nguyen A, Weissman IL, Chan CK, et al. (2015). Identification and characterization of an injury-induced skeletal progenitor. Proc Natl Acad Sci U S A 112, 9920–9925. [DOI] [PMC free article] [PubMed] [Google Scholar]
- Mendez-Ferrer S, Michurina TV, Ferraro F, Mazloom AR, Macarthur BD, Lira SA, Scadden DT, Ma’ayan A, Enikolopov GN, and Frenette PS (2010). Mesenchymal and haematopoietic stem cells form a unique bone marrow niche. Nature 466, 829–834. [DOI] [PMC free article] [PubMed] [Google Scholar]
- Menezes ME, Mitra A, Shevde LA, and Samant RS (2012). DNAJB6 governs a novel regulatory loop determining Wnt/beta-catenin signalling activity. Biochem J 444, 573–580. [DOI] [PMC free article] [PubMed] [Google Scholar]
- Moester MJ, Papapoulos SE, Lowik CW, and van Bezooijen RL (2010). Sclerostin: current knowledge and future perspectives. Calcif Tissue Int 87, 99–107. [DOI] [PMC free article] [PubMed] [Google Scholar]
- Nei M, and Glazko GV (2002). The Wilhelmine E. Key 2001 Invitational Lecture. Estimation of divergence times for a few mammalian and several primate species. J Hered 93, 157–164. [DOI] [PubMed] [Google Scholar]
- Picelli S, Faridani OR, Bjorklund AK, Winberg G, Sagasser S, and Sandberg R (2014). Full-length RNA-seq from single cells using Smart-seq2. Nat Protoc 9, 171–181. [DOI] [PubMed] [Google Scholar]
- Quirici N, Soligo D, Bossolasco P, Servida F, Lumini C, and Deliliers GL (2002). Isolation of bone marrow mesenchymal stem cells by anti-nerve growth factor receptor antibodies. Exp Hematol 30, 783–791. [DOI] [PubMed] [Google Scholar]
- Reinisch A, Etchart N, Thomas D, Hofmann NA, Fruehwirth M, Sinha S, Chan CK, Senarath-Yapa K, Seo EY, Wearda T, et al. (2015). Epigenetic and in vivo comparison of diverse MSC sources reveals an endochondral signature for human hematopoietic niche formation. Blood 125, 249–260. [DOI] [PMC free article] [PubMed] [Google Scholar]
- Sacchetti B, Funari A, Michienzi S, Di Cesare S, Piersanti S, Saggio I, Tagliafico E, Ferrari S, Robey PG, Riminucci M, et al. (2007). Self-renewing osteoprogenitors in bone marrow sinusoids can organize a hematopoietic microenvironment. Cell 131, 324–336. [DOI] [PubMed] [Google Scholar]
- Sahoo D, Dill DL, Tibshirani R, and Plevritis SK (2007). Extracting binary signals from microarray time-course data. Nucleic Acids Res 35, 3705–3712. [DOI] [PMC free article] [PubMed] [Google Scholar]
- Seita J, Sahoo D, Rossi DJ, Bhattacharya D, Serwold T, Inlay MA, Ehrlich LI, Fathman JW, Dill DL, and Weissman IL (2012). Gene Expression Commons: an open platform for absolute gene expression profiling. PLoS One 7, e40321. [DOI] [PMC free article] [PubMed] [Google Scholar]
- Simmons PJ, and Torok-Storb B (1991). Identification of stromal cell precursors in human bone marrow by a novel monoclonal antibody, STRO-1. Blood 78, 55–62. [PubMed] [Google Scholar]
- Sorrentino A, Ferracin M, Castelli G, Biffoni M, Tomaselli G, Baiocchi M, Fatica A, Negrini M, Peschle C, and Valtieri M (2008). Isolation and characterization of CD146+ multipotent mesenchymal stromal cells. Exp Hematol 36, 1035–1046. [DOI] [PubMed] [Google Scholar]
- Spangrude GJ, Heimfeld S, and Weissman IL (1988). Purification and characterization of mouse hematopoietic stem cells. Science 241, 58–62. [DOI] [PubMed] [Google Scholar]
- Tevlin R, Seo EY, Marecic O, McArdle A, Tong X, Zimdahl B, Malkovskiy A, Sinha R, Gulati G, Li X, et al. (2017). Pharmacological rescue of diabetic skeletal stem cell niches. Sci Transl Med 9. [DOI] [PMC free article] [PubMed] [Google Scholar]
- Weber K, Thomaschewski M, Warlich M, Volz T, Cornils K, Niebuhr B, Tager M, Lutgehetmann M, Pollok JM, Stocking C, et al. (2011). RGB marking facilitates multicolor clonal cell tracking. Nat Med 17, 504–509. [DOI] [PubMed] [Google Scholar]
- Worthley DL, Churchill M, Compton JT, Tailor Y, Rao M, Si Y, Levin D, Schwartz MG, Uygur A, Hayakawa Y, et al. (2015). Gremlin 1 identifies a skeletal stem cell with bone, cartilage, and reticular stromal potential. Cell 160, 269–284. [DOI] [PMC free article] [PubMed] [Google Scholar]
- Zhou BO, Yue R, Murphy MM, Peyer JG, and Morrison SJ (2014). Leptin-receptor-expressing mesenchymal stromal cells represent the main source of bone formed by adult bone marrow. Cell Stem Cell 15, 154–168. [DOI] [PMC free article] [PubMed] [Google Scholar]
Associated Data
This section collects any data citations, data availability statements, or supplementary materials included in this article.
Supplementary Materials
Supplemental Figure 1 (related to Figure 1). Comparative transcriptome analysis of mSSC/mBCSP core genes within scRNA-seq data obtained from different zones in the human bone to identify zones where hSSCs are most enriched.
A) Bar chart showing percent of human orthologs to mSSC/mBCSP-specific genes expressed in human CD45-CD235- single cells from each zone as in “Figure 1F” with the addition of periosteum. Grayscale gradient from “low” to “high” percent gene enrichment is shown. Aggregated bulk representation of single cell data calculated by mean ± standard deviation of single-cell percent gene enrichment for each zone is also shown. Statistical significance was calculated by one-way ANOVA with post-hoc Tukey HSD test with proliferative 1 (P1) as reference at an α-level of 0.01, as done in “Figure 1F”. **p-value<0.005, ****p-value<0.0005.
B) hSSC-specific putative cell-surface markers. Candidate surface markers from the Gene Expression Commons (GEXC) (Seita et al., 2012) “cell surface” and “CD antigen” gene sets. Only cell-surface markers that were expressed in at least ~15% of total cells sequenced, showed statistically significant variability in expression across different zones, and for which flow cytometry-tested antibodies were available were selected for downstream FACS analysis. Markers identified to separate growth plate zones into visually and functionally distinct populations by FACS are highlighted in red.
C) PDPN, CD146, CD164, and CD73 separate human fetal growth plate into subpopulations by flow cytometry and immunohistochemistry. Top panel shows distribution of PDPN and CD146 on a FACS plot for the different anatomical zones as described in “Figure 1A–E”. The PDPN+CD146- gate is highlighted in red and a further drill-down shows CD164 and CD73 expression-spread within this population (bottom panel). Each gate is annotated with its skeletal lineage identity (SSC, BCSP, OP, or CP) and the adjacent numerical values represent percentage of cells in each gate (n=3).
D) Movat pentachrome staining of fetal bone marks three distinct regions within the bone: (i) Hypertrophic zone, (ii) Growth plate and (iii) Ossification zone. Scale: 500 μm (left). Immunofluorescent (IF) images showing the spatial organization of hSSC markers in the longitudinal bone sections (middle and right). The PDPN+CD146- (red arrowheads) and the PDPN+CD146+ (white arrowheads) cells reside above the ossification zone; the PDPN-CD146+cells (green arrow) are in the ossification zone (middle). Scale: 100 μm. Magnification 5×. The CD164+ (red arrowheads), and CD73+ (green arrowheads) single-positive cells as well as the double-positive CD164+CD73+ cells (white arrowheads), which include the hSSC are also shown (right panel). Scale: 200 μm.
E) Bar chart showing fraction of PDPN+CD146-CD73+CD164+ single-cells that show 0–9, 9–18, or >18 % enrichment for human orthologs to mSSC/mBCSP-specific genes (left). Bar chart showing percent of PDPN+CD146-CD73+CD164+ cells in diaphysis, periosteum, and p-H2/H1 zones in the growth plate (right). p-values were calculated by Fisher exact test using a 2×2 contingency table.
F) scRNA-seq data supports enrichment of PDPN, CD73, and CD164 and depletion of CD146 within the fetal bone growth plate region. Bar chart showing log2 fold-change in mean transcripts per million (TPM) between pre-hypertrophic 2/hypertrophic 1 (p-H2/H1) zones and the diaphysis (D). Markers identified to separate growth plate zones into visually and functionally distinct populations by FACS are highlighted in red.
Supplemental Figure 7 (related to Figure 7): mSSCs transduced with hSSC-specific WNT antagonists form larger bone ossicles in vivo.
A) Experimental strategy for testing functional effect of overexpression of human-specific SSC genes in mSSCs by lentiviral transduction. Five replicates of renal capsule transplants in NSG mice were performed (n=5). mSSCs transduced with GFP were used as negative-control. Ossicles thus developed in vivo from the transduced mSSCs were extracted after either 16 or 32 days post-transplant for examination.
B) (i) Fluorescent (left) and brightfield (right) images from two different experiments showing ossicles that are derived from transplanted GFP-labeled-mSSCs after 32 days of development. Scale: 1 mm.
(ii) Movat pentachrome stain of a cross-section of one of the ossicles shown in B-(i); yellow: bone, blue: cartilage, purple: marrow (bottom).
(iii) IF image of a cross-section of an ossicle derived from GFP-labelled-mSSCs after 16 days of development showing osteocalcin expression (top); Movat pentachrome stained image of an adjacent cross-section of the same ossicle (bottom). Scale: 100 μm.
C) (i) Skeletal lineage tree showing expression levels of SOST in human and Sost in mouse SSCs and downstream progenitors based on microarray data. Gene expression was normalized to a scale of −100 to +100, where values >0 are colored shades of red, while values <0 are colored shades of blue.
(ii) Fluorescent (left) and brightfield (right) images from two different experiments showing ossicles that were derived from SOST/GFP-tranduced-mSSCs after 32 days of development. Scale: 1 mm.
(iii) Movat pentachrome stained image of a cross-section of one of the ossicles shown in C-(ii); yellow: bone, blue: cartilage, purple: marrow.
(iv) IF image of a cross-section of an ossicle derived from SOST/GFP-transduced-mSSCs after 16 days of development showing Osteocalcin expression (top); Movat pentachrome stained image of an adjacent cross-section of the same ossicle (bottom). Scale: 100 μm.
D) (i) Skeletal lineage tree showing expression levels of DNAJB6 in human and Dnajb6 in mouse SSCs and progenitors based on microarray data. Gene expression was normalized to a scale of −100 to +100, where values >0 are colored shades of red, while values <0 are colored shades of blue.
(ii) Fluorescent (left) and brightfield (right) images from two different experiments showing ossicles that were derived from DNAJB6/GFP-labeled-mSSCs after 32 days of development. Scale: 1 mm.
(iii) Movat pentachrome stained image of a cross-section of one of the ossicles shown in D-(ii); yellow: bone, blue: cartilage, purple: marrow.
(iv) IF image of a cross section of an ossicle derived from DNAJB6/GFP-transduced-mSSCs ossicle section after 16 days of development showing Osteocalcin expression (top); Movat pentachrome stained image of an adjacent cross-section of the same ossicle (bottom). Scale: 100 μm.
E) Quantification of relative ossicle sizes formed by mSSC transduced with GFP, SOST/GFP, or DNAJB6/GFP by morphometric analysis. *p<0.05.
F) Heat map showing expression levels of selected genes in GFP-, SOST/GFP-, and DNAJB6/GFP-transduced mSSCs based on microarray data.
Supplemental Table 1 (related to Figure 1): Geneset of human orthologs to mSSC/mBCSP-specific genes as generated by the Gene Expression Commons (GEXC) (Seita et al., 2012).
Supplemental Table 2 (related to all Figures): Human specimen number, age, sex and average hSSC per million FACS events.
Supplemental Table 3 (related to Figure 6): Curated set of canonical signaling pathways and bone development genes created using the GEXC (Seita et al., 2012) and Broad Institute’s Molecular Signature Database (MSigDB) (Liberzon et al., 2015).
Supplemental Table 4 (related to Figure 7): Transcriptional comparison between mouse and human osteoprogenitors. Supervised transcriptional comparison of microarray data from mouse (CD200-CD51+CD105+THY1+) and human osteoprogenitors (PDPN-CD146+) (n=3). Heatmaps show expression of genes associated with collagen, extracellular matrix, fibronectin, and elastin as determined from the GEXC database (Seita et al., 2012). All gene expression values are normalized to a scale of −100 to +100, where values >0 are colored shades of red, while values <0 are colored shades of blue.
Supplemental Table 5 (related to Figure 7): Transcriptional comparison between mouse and human chondroprogenitors. Supervised transcriptional comparison of microarray data from mouse (CD200-CD51+CD105+THY1+) and human chondroprogenitors (PDPN+CD146-CD73+CD164-) (n=3). Heatmaps show expression of genes associated with collagen, extracellular matrix, fibronectin, and elastin as determined from the GEXC database (Seita et al., 2012). All gene expression values are normalized to a scale of −100 to +100, where values >0 are colored shades of red, while values <0 are colored shades of blue.
Supplemental Figure 2 (related to Figure 2). hSSCs self-renew in vivo and generate serial multilineage ossicles.
A) Experimental strategy to test the self-renewal property of hSSC (n=6).
B) Prior to the primary transplant in the renal capsule of NSG mice, freshly isolated hSSC were stained with a lipophilic dye (red) and compared to unstained cells (gray). The resulting graft was explanted 2 weeks post-transplant. The hSSC were re-isolated from the graft and exhibited lower lipophilic dye fluorescence (blue) indicating that dye-labeled-hSSCs had undergone cell-division in vivo. The re-isolated hSSCs were then transplanted into renal capsule of a secondary NSG host, allowed to develop in vivo for 4 weeks, and the resulting grafts were extracted for histology.
C) (i) 500 single hSSC were isolated from fresh 17–19-week fetal bone, plated for colony formation and imaged by phase microscopy to examine cell morphology after each of the serial passages all the way up to the quaternary colonies (top row). Scale: 20 μm. FACS plots show that throughout serial colony formation, hSSC retains their ability to self-renew and ultimately consists of 49.3% of the parent population after quaternary colony formation (bottom row).
(ii) 100,000 hSSCs isolated in C-(i) were embedded in Matrigel and transplanted into the renal capsule of NSG mice. The primary graft was explanted 4 weeks after development, dissociated, hSSCs were purified and plated for two-rounds of serial colony formation in vitro up to a tertiary passage. Phase microscopic images for colonies at each of the serial stages show similar morphology (top row). Scale: 20 μm. FACS profiles of the serial colonies derived from hSSCs purified from primary graft at each stage of serial passage; hSSC comprise 39.5% of the total cells in the parent population in the tertiary colony (bottom row).
D) Brightfield images of the primary hSSC graft 2 weeks after transplant into the renal capsule (left) and 4 weeks after the secondary transplant (right) from B. Scale: 1 mm.
E) Movat pentachrome showing different tissue components of the hSSC graft. An Alcian blue region indicates cartilage presence (white arrow head) and a yellow region indicates bone (black arrowhead). Scale: 250 μm.
F) (i) FACS plot showing gating strategy for isolating CD146+ mesenchymal stem cells (redbox).
(ii) Cellular morphology of the mesenchymal stem cells after 2 weeks in culture.
(iii) FACS profile and gating strategy for re-isolating CD146+ mesenchymal stem cells after 2 weeks in culture.
(iv) Cellular morphology of CD146+ mesenchymal stem cells after further 1 week of serial (secondary) culture. Images are representative of three independent experiments (n=3). Scale: 20 μm.
G) (i) FACS profile and gating strategy for isolating hSSCs.
(ii) Cellular morphology of hSSCs after 2 weeks in culture.
(iii) FACS profile and gating strategy for re-isolating hSSCs after 2 weeks in culture.
(iv) Cellular morphology of hSSC after a further 1 week of serial (secondary) culture. Images are representative of three independent experiments (n=3). Scale: 20 μm.
Supplemental Figure 3 (related to Figure 3). hSSCs do not differentiate into adipocytes.
A) Experimental strategy for isolating adult hSSC or human adipose stromal cell (hASC) and assessing their in vitro and in vivo adipogenic potential (n=6).
B) Microarray data analyzed using GEXC (Seita et al., 2012) platform showing known osteogenic genes that are upregulated in the hSSC, but not in human-derived fat samples and vise versa.
C) Adult (middle) and fetal (left) hSSCs were isolated, differentiated using adipogenic conditions and stained for Oil Red O. hASCs were used as a positive control (right). Black arrowheads indicate lipid globules. Scale: 100 μm.
D) Test for adipogenic differentiation potential of skeletal progenitors. Brightfield and Oil Red O stained images of either non-induced (top two rows) or adipogenic-induced (bottom two rows) human bone, cartilage and stromal progenitor (hBCSP) (left), human osteoprogenitor (hOP) (middle), and double-negative human chondroprogenitor (hCP) populations (right) is shown. Scale: 100 μm.
E) hSSC were transplanted into the inguinal fat pads of immunodeficient RFP mice, grafts (marked by white dashed border) were harvested 4 weeks after transplant, sectioned and stained with FITC-labelled antibodies directed against mouse and human perilipin and adiponectin, both of which constitute pan-adipose markers (top row). A cross-section of human adipose tissue stained in the same fashion was used as a positive control for adiponectin and perilipin staining antibodies (bottom row). Rightmost panel shows Movat pentachrome staining of adjacent cross-sections of the same graft; yellow: bone, blue: cartilage, purple: marrow. Mouse-derived fat (white arrowhead) adjacent to hSSC derived compacted bone-like tissue and cartilage (black arrowhead) is shown. Scale: 100 μm.
Supplemental Figure 4 (related to Figure 3): hSSCs generate hematopoiesis-supportive stroma.
A) Experimental strategy for co-culturing Lin-CD34+CD38-THY1loCD45RA- hHSCs with human skeletal progenitors and analyzing multilineage engraftment after hHSC transplantation into sublethally irradiated immunodeficient NSG mice (n=10).
B) Representative FACS plots showing myeloid and lymphoid xenograftment in recipient NSG mice 8 weeks after transplant of freshly sorted uncultured hHSCs, hHSCs cultured without stroma, or hHSCs co-cultured with hSSCs, hBCSPs, or hOPs. Human antigen: HLA-ABC, hematopoietic antigen: hCD45, lymphoid antigen: hCD19, myeloid antigen: hCD33.
C) Bar chart showing percent myeloid and lymphoid engraftment of uncultured hHSCs, hHSCs cultured without stroma, and hHSCs co-cultured with hSSCs, hBCSPs, or hOPs.
D) Model of niche interactions between skeletal and hematopoietic lineage trees; MPP: multipotent progenitor, LMPP: lymphoid-primed multipotent progenitor, MEP: megakaryocyte-erythroid progenitor, CLP: common lymphoid progenitor, GMP: granulocyte-macrophage progenitor.
E) Ligand-receptor interaction maps demonstrating cis- and trans-signaling patterns within and between skeletal and hematopoietic lineages. Gene expression analysis of microarray data from skeletal and hematopoietic subsets show ligands in the left column and cognate receptors in the right column. Gene expression was normalized to a scale of −100 to +100, where values >0 are colored shades of red, while values <0 are colored shades of blue. The connecting arrows indicate possible ligand-receptor interaction pathways; CSF1: colony stimulating factor 1, SDF: stromal cell-derived factor, SCF: stem cell factor.
F) i. Table listing cytokines expressed by various members of the human skeletal lineage tree as determined by microarray analysis using GEXC platform (Seita et al., 2012). Values in parentheses represent cytokine expression levels from microarray data normalized to a scale of 0 to 10. Only skeletal cells with normalized gene expression >0 are included.
ii. Table listing representative skeletal regulatory factors expressed by different types of human hematopoietic progenitors and the hHSCs as determined after the analysis of microarray data using the GEXC platform. Values in parentheses represent cytokine expression-values normalized to a scale of 0 to 10. Only hematopoietic cells with normalized gene expression >0 are included.
G) Heatmap shows log2(TPM+1) variable gene expression of cytokines that were expressed in at least ~15% of total cells sequenced across single human fetal and adult skeletal progenitors. Dendrogram showing hierarchical clustering of the expressed cytokines calculated using Ward’s method.
Supplemental Figure 5 (related to Figure 7): Transcriptionally conserved skeletal pathways between mouse and human SSCs.
A) Analysis pipeline for transcriptional comparison of mSSCs and hSSCs microarray data using the GEXC platform (Seita et al., 2012) (n=3).
B) Diagram showing shared and unshared genes (that belong to WNT, BMP, Hedgehog, FGF, and Notch pathways, and the gene ontology [GO] Bone Development gene set) between mSSCs and hSSCs. Percent enrichments of each gene set are represented in each Cartesian quadrant (formula: ; Q1: ↓Mouse ↑Human, Q2: ↑Mouse ↑Human, Q3: ↓Mouse ↓Human, Q4: ↑Mouse ↓Human). Legend with corresponding color codes is shown on the left.
C) Scatter plot showing gene expression within mSSCs and hSSCs. Expression values were normalized to a scale of −100 to +100 for genes that are known to comprise canonical signaling and bone development pathways. Genes are labeled by number and reference is provided in “Supplemental Table 3“. Color codes are the same as in B. SOST, DNAJB6 are circled in red.
D) Pie charts showing distribution of each gene set (WNT, BMP, FGF, Hedgehog, Notch, and GO Bone Development) across the four quadrants as described in B, (Q1: ↓Mouse ↑Human, Q2: ↑Mouse ↑Human, Q3: ↓Mouse ↓Human, Q4: ↑Mouse ↓Human). Legend with corresponding color codes is shown at the bottom.
Supplemental Figure 6 (related to Figure 7): Proximal/distal enhancer motifs in mSSC and hSSC.
A) ATAC-seq libraries were prepared from age-matched hSSCs and mSSCs purified from 18-week human and e17.5 mouse fetal bone, respectively (n=3). Plot shows log2(reads) in ATAC-seq peaks for hSSC replicates 1 and 2; R=0.94 (left) and mSSC replicates 1 and 2; R=0.91 (right).
B) Table showing the top 5 transcription factor (TF) motifs enriched in hSSC ATAC-seq peaks closest to SSC-specific genes from HOMER (Heinz et al., 2010) (left). SSC-specific genes are genes expressed in hSSCs and mSSCs but not in their corresponding downstream osteogenic or chondrogenic progenitors as calculated by GEXC platform (Seita et al., 2012) using microarray data. Bar chart (right) shows the percentage of hSSC ATAC-seq peaks that are enriched with the TF motifs listed in the table on left compared to the percentage of background sites harboring the same motifs.
C) Table showing top 5 TF motifs enriched in ATAC-seq peaks near human-specific SSC genes. Human-specific SSC genes are a subset of SSC-specific genes that are expressed in human but not mouse SSCs. Motifs enriched in hSSC ATAC-seq peaks near human-specific genes (1713 peaks, 148 genes) are shown on the left. Motifs enriched in mSSC ATAC-seq peaks near human-specific genes (1194 peaks, 148 genes) are shown on the right.
D) Bar chart showing the percentage of ATAC-seq peaks with the top enriched TF motifs near human-specific SSC genes. Each set of peaks (human and mouse) is compared against a set of background sites.
E) Plots showing the enrichment of ATAC-seq reads at transcription start sites (TSSs) in hSSCs (left) and mSSCs (right). The plot shows the number of Tn5 insertions averaged over all known TSSs in the genome, representing the signal-to-noise ratio in the ATAC-seq libraries (n=3).
F) Density plot showing the log2 distance to the nearest TSS of all ATAC-seq peaks in hSSCs (black) and mSSCs (red). Two peaks represent promoter-proximal sites of accessibility and promoter-distal sites of accessibility, highlighting the ability to identify both active promoters and putative enhancers.
G and H) The top 5 TF motifs [using HOMER (Heinz et al., 2010)] enriched at promoter-proximal (<2kb from nearest TSS) and promoter-distal (>2kb from nearest TSS) regions of chromatin accessibility in hSSCs (left) and mSSCs (right).
I) Example of a human-specific SSC gene, DNAJB6. ATAC-seq signal at the human DNAJB6 locus (top) and the mouse Dnajb6 locus (bottom). Green rectangles mark ATAC-seq peaks that were identified close to the DNAJB6 locus. Purple rectangles mark a subset of green ATAC-seq peaks that contain RUNX motifs.
J) Example of an SSC-specific gene, Wnt4. ATAC-seq signal at WNT4 locus and location of two known SNPs. A GWAS SNP for height, rs1014987, is marked in blue. Another GWAS SNP for bone mineral density, rs7521902, is marked in red. PDPN+CD146-Additional Explanation for Supplemental Figure 6 (related to Figure 7) To understand the gene regulatory programs underlying the SSC identity and how they are different in mouse and human systems, we performed ATAC-seq on mouse and human SSCs isolated at similar developmental stages (18-week-old human and e17.5 mouse embryo) to identify sites of accessible chromatin genome-wide. This analysis revealed active promoters as well as gene-distal enhancers (Supplemental Figure 6 A, E, F). To identify TFs that might be important in regulating the SSC state, we performed motif enrichment analysis on the set of all hSSC accessible loci and found that proximal-promoter regions are enriched in ATF, RUNX, CTCF, NFAT, and MYB motifs, while distal accessible regions are enriched for motifs corresponding to ETS, NFY, RUNX, ATF, and KLF family of TFs (Supplemental Figure 6G). The motifs for many of the same factors were enriched in ATAC-seq peaks in mSSCs (Supplemental Figure 6H), suggesting that a similar TF-network drives SSC fate in these two species. To probe the network that is responsible for gene expression specifically in the skeletal stem cell state, we performed motif enrichment analysis on the set of peaks located close to genes that are transcribed in both mouse and human SSCs, but not in downstream osteogenic or chondrogenic progenitors—the expression pattern referred to as “skeletal stem cell-specific program”. We found that in hSSCs, the binding motifs of the same factors that are enriched in all accessible chromatin (ATF, RUNX, CTCF, NFAT, BACH family of TFs) are also enriched in the skeletal stem cell-specific program (Supplemental Figure 6B). Having found that the same TFs are driving SSC identity in both the human and mouse SSC, we sought to understand species-specific differences between these two cell types at the epigenetic level. We focused on genes that are transcribed in the hSSC but not in the mSSC, as they may drive some of the phenotypic differences in the two skeletal systems. We found that while active regulatory regions (accessible sites) near human-specific SSC genes in hSSCs harbor the core SSC TF-motifs, sites near those same genes in the mouse do not harbor all of them (Supplemental Figure 6 C, D). Notably, predicted RUNX binding sites are not enriched in the open chromatin landscape in mSSCs near human-specific SSC genes. An example is shown in Figure 7D at the SOST locus. In hSSCs, there are many active regulatory regions just downstream of SOST, four of which harbor potential RUNX binding sites that are not conserved in mouse (middle, Figure 7D). The Sost locus in mSSCs shows greatly reduced chromatin accessibility, reflecting that this gene is not active in mSSCs. The same is true for another human-specific gene, DNAJB6 (Supplemental Figure 6I). These data suggest that genes that are expressed in a species-specific way in SSCs and may be functionally important for SSC function have acquired binding sites for TFs in the core SSC transcriptional network through evolution. Genome-wide association studies (GWAS) have identified several non-coding genomic polymorphisms that are associated with human bone mineral density and height, traits arising during development and homeostasis in the skeletal system (Chan et al., 2015; Estrada et al., 2012). Out of the 56 SNPs strongly associated with variation in bone mineral density in humans, one is contained in a predicted RUNX binding site within the SOST locus (middle left, Figure 7D). This reinforces the notion that SOST may play an important functional role in the hSSC and that RUNX factor binding may enhance its transcription. However, to test this hypothesis, it will first be necessary to validate the predicted RUNX binding sites with CHiP assays. In addition, we found that there are GWAS SNPs associated with bone mineral density and height in accessible non-coding regions surrounding SSC-specific genes. For example, SNPs for bone mineral density and height are found upstream of the WNT4 promoter (Supplemental Figure 6J). This finding suggests that these variants may exert their effects on height and bone density specifically at the stem cell level.
Data Availability Statement
The ATAC-seq, RNA-seq, and Microarray data described in this study was deposited with the gene expression omnibus with the accession number SRA: PRJNA478935.