

Abstract
Background:
Adaptive emotion processing is critical for nearly all aspects of social and emotional functioning. There are distinct developmental trajectories associated with improved emotion processing, with a protracted developmental course for negative or complex emotions. The specific changes in neural circuitry that underlie this development, however are still scarcely understood. We employed a multivariate approach in order to elucidate distinctions in complex, naturalistic emotion processing between childhood and adulthood.
Method:
Twenty-one adults (M±SD age=26.57±5.08 years) and thirty children (age=7.75±1.80 years) completed a free-viewing movie task during BOLD fMRI scanning. This task was designed to assess naturalistic processing of movie clips portraying positive, negative, and neutral emotions. Multivariate support vector machines (SVM) were trained to classify age groups based on neural activation during the task.
Results:
SVMs were able to successfully classify condition (positive, negative, and neutral) across all participants with high accuracy (61.44%). SVMs could successfully distinguish adults and children within each condition (ps<0.05). Regions that informed the age group SVMs were associated with sensory and socio-emotional processing (inferior parietal lobule), emotion regulation (inferior frontal gyrus), and sensory regions of the temporal and occipital lobes.
Conclusions:
These results point to distributed differences in activation between childhood and adulthood unique to each emotional condition. In the negative condition specifically, there is evidence for a shift in engagement from regions of sensory and socio-emotional integration to emotion regulation regions between children and adults. These results provide insight into circuitry contributing to maturation of emotional processing across development.
Keywords: emotion processing, development, machine learning, naturalistic viewing, children
1. Introduction
Processing emotional information is critical for social and emotional functioning. Disruptions in emotion processing are found in nearly every psychiatric disorder (e.g. Brotman et al., 2010; Engels et al., 2007; Kircanski & Gotlib, 2015; Stuhrmann, Suslow, & Dannlowski, 2011). For example, extensive research has found a preference for processing sad stimuli in depression (for a review, see Kircanski and Gotlib, 2015). This disruption in emotion processing is present even in asymptomatic older children and adolescents at high familiar risk for depression evidenced by difficulty processing and identifying sad and angry faces (Joormann et al., 2010, 2007). These deficits in emotion processing are hypothesized to reflect aberrant amygdala and nucleus accumbens functioning (Monk et al., 2008). Further, preschool children who are unimpaired and high in temperamental negative affect, and therefore predisposed to depression, also show increased amygdala activation toward sad faces, which in turn predicts increased negative affect at a 12 month follow up (Gaffrey et al., 2016). Similarly, youth at risk for developing bipolar disorder show deficits in labeling emotional faces on par with bipolar patients (Brotman et al., 2008). Further, children temperamentally risk for anxiety disorders demonstrate an increased propensity for processing negative stimuli over neutral, which in turn moderates social withdrawal later in adolescence (Pérez-Edgar et al., 2010). These data point to a neurodevelopmental component to aberrant emotion processing in psychiatric disorders, which implies the need to characterize foundations of adaptive emotion processing in typically developing children. Our ability to pinpoint the developing brain’s normative processing circuits for specific, emotionally-laden, environmental stimuli, will be critical to understanding how these disruptions in psychiatric disorders emerge. This circuitry, particularly in the negative domain, is likely to differ between children and adults, making it imperative that we develop models specific to each neurodevelopmental stage.
Early in development, the cognitive and biological foundations of emotion processing begin to solidify. Children are readily able to discriminate happy faces from other affective faces as young as infancy (Barrera and Maurer, 1981) and at consistent adult-levels throughout childhood (Boyatzis et al., 1993; Camras and Allison, 1985; Durand et al., 2007; Gao and Maurer, 2010). Other basic emotions such as anger and sadness are discriminated from neutral faces at adult levels of accuracy in early childhood (Boyatzis et al., 1993; Camras and Allison, 1985; Durand et al., 2007), while other nuanced facial emotions such as disgust are not as easily discriminated until late childhood (Durand et al., 2007; Gao and Maurer, 2010). Further, when basic emotions are presented dynamically there is evidence for continued development into late adolescence (Thomas et al., 2007). Additionally, there is evidence that the ability to discriminate complex emotions such as those with a social component like embarrassment or guilt is still developing into late adolescence and early adulthood (Motta-Mena and Scherf, 2017). This suggests that the processing of discrete emotions have distinct developmental trajectories with more nuanced emotions having more protracted development. Concurrent changes in regional brain structure and function are hypothesized to support this emotional development (Casey et al., 2005; Perlman and Pelphrey, 2011; Posner et al., 2014; Shaw et al., 2008; Tsujimoto, 2008), however the specific changes in neural circuitry from childhood to adulthood are still scarcely understood. Thus, more recent work has sought to identify specific functional changes in the brain that occur from childhood to adulthood.
Previous investigations of the neural processing of emotion across development have examined isolated stimuli such as emotional faces or sounds during free viewing/listening (e.g., Hare et al., 2008; Todd et al., 2011) or placed emotion stimuli as distractors within a cognitive task (e.g., Perez-Edgar and Fox, 2003; Perlman et al., 2014; Perlman and Pelphrey, 2010). Many such studies, which examine basic emotions (e.g. fearful, angry, happy), find amygdala activation to be critical in detecting distinct emotional stimuli. Past research has found increased amygdala activation to fearful faces in teens (Hare et al., 2008) and to happy faces in children (Todd et al., 2011), which was not found in the adult comparison sample. There is even some evidence that children have increased amygdala activation in response to neutral faces compared to fearful faces, which is not found in adults (Thomas et al., 2001). Social emotions such as guilt and embarrassment, on the other hand, consistently activate a circuit of the brain associated with social cognition including the medial prefrontal cortex (MPFC), inferior parietal lobule (IPL), and superior temporal sulcus (STS) (Adolphs, 2009), in addition to the amygdala. A study by Burnett et al. (2009) found evidence for a shift in activation from the anterior MPFC to the posterior MPFC from adolescence to adulthood, indicating continued development in how the MPFC processes emotion into later ages than were previously expected. Taken together, these studies demonstrate neurodevelopmental support for differential trajectories in processing emotions, with more complex and nuanced emotions activating a more sophisticated circuit that shifts across development.
The limitation of this work, however, is that real-world emotion processing rarely occurs as isolated affective events or stimuli. Thus, more recent developmental work has turned away from reductionist emotion tasks and toward naturalistic perception (Cantlon and Li, 2013; Karim and Perlman, 2017; Richardson et al., 2018) which is critical for studying ecologically-relevant socio-emotional processing (Zaki and Ochsner, 2009). Previous studies that examine emotions in isolation have provided important foundations for interpretation of more naturalistic, complex emotion processing. Two studies that use naturalistic viewing paradigms to examine neurodevelopment found that socio-emotional regions such as the MPFC, STS, and IPL are critical for integrating emotions into the context in which they are perceived (Karim and Perlman, 2017; Richardson et al., 2018). Karim and Perlman (2017) compared whole brain activation differences in processing positive, negative, and neutral film clips between adults and children. They found increased activation in children compared to adults in both positive and negative viewing conditions across many neural regions including the IPL (the angular gyrus), STS (superior and middle temporal gyri), and the MPFC (anterior cingulate). Richardson et al. examined age related changes in processing emotional versus physical pain in children and adults (Richardson et al., 2018) and found increasing coherence and overall activation with age of these same regions while processing emotional pain. These two studies together indicate important development of the socio-emotional integration circuit of the parietal and temporal lobes across age in processing emotional stimuli.
There are limitations in previous developmental work that we seek to address in this investigation. First, most functional studies of brain development initially isolate neural activation associated with task condition and then examine correlations between task activation and age post-hoc. This approach excludes regions that do not activate during emotion processing uniformly across the lifespan. In other words, this approach is best tuned to detect changes in signal magnitude for a given region across development but not to detect regions that, for example, contribute to emotion processing in childhood only but not in adulthood or vice versa. Second, as alluded to above, studies that present emotional stimuli in isolation such as with static, emotional faces or scenes snapshots do not represent the ecologically valid complexity in which people experience emotions. Lastly, most studies examining emotional neurodevelopment rely on univariate statistics, which involves modeling the time series of each voxel in the dataset separately, clustering, and correcting for multiple comparisons. This approach has sparked controversy as there is high statistical likelihood for Type I error when adequate controls for multiple comparisons are not applied (Eklund et al., 2016) and an inherently increased bias for large effects (increased Type II error) when they are.
To address these limitations, we employ a multivariate machine learning approach to identify regions of the brain whose activity during a naturalistic emotion processing task accurately categorizes children versus adults. More recently, multivariate analyses of emotion processing in adults have elucidated widespread regions involved in processing emotional information. These neural signatures are unique enough to correctly categorize a wide range of emotions (Baucom et al., 2012; Ethofer et al., 2009; Peelen et al., 2010; Said et al., 2010) and are consistent across multiple emotional modalities including body posture, facial expressions, and voices (Peelen et al., 2010). By using a multivariate analysis to categorize participant age groups within and across emotional conditions, we can more precisely explore the changes in emotional processing that occur as a function of brain development, both in conjunction with and independent of the emotional content. Based on previous work, we hypothesize that there are circuitry wide differences between children and adults that reflect a refinement of socio-emotional integration across development. Specifically, negative and positive stimuli will have distinct differences in circuitry between children and adults, reflecting the protracted development of negative emotion processing in children (Durand et al., 2007; Gao and Maurer, 2010). This would be reflected in distinct neural activation patterns informing child versus adult classification.
2. Methods
This study was approved by the Institutional Review Board of the University of Pittsburgh. Informed consent and assent was obtained from all participants.
2.1. Participants
Participants included 21 adults ages 20-44 years old and 36 children ages 4-12 years old recruited from the Pittsburgh area. The sample has been previously described by Karim & Perlman (2017). The child group was selected to represent a wide range of emotional processing across childhood but prior to the onset of adolescence. Exclusion criteria for both adults and children included personal history of any Axis I disorder, autism spectrum disorders, mental retardation, severe systematic illnesses, neurological disorders, head trauma with loss of consciousness, MR contraindications (such as metal in the body), claustrophobia, pregnancy, and use of medications that may produce central nervous system effects. Participants were required to be able to complete tasks in English. For children, additional exclusion criteria included history of Axis I disorders in first-degree relatives. The final sample included 21 adults (M±SD age = 26.6±5.1 years) and 30 children (M±SD age = 7.8±1.8 years) after removing children with unusable MRI data (see section 2.4).
2.2. Movie task
Participants performed a free-viewing movie task during fMRI scanning described in greater detail in Karim and Perlman (Karim and Perlman, 2017) and depicted in Figure 1. Participants were instructed to lie still in the scanner and watch the screen in order to perform the task. Because children are still developing their self-control, we sought to minimize cognitive demand during the task. Thus, no button box was given to the participant and no button presses were required to complete the task. The KidVid fMRI task included 24 short film clips 19-46 seconds long with an inter-stimulus interval (ISI) of 6-12 seconds for a total of 17 minutes of scanning. Positive, negative, or neutral content film clips (eight each) were shown. Negative and positive film clips were selected from popular kid’s movies and contained a mixture of live action and cartoon clips. All of the clips contained music either in the form of a song or to aid in setting the tone for the scene. For the affective clips, 4 negative and 2 positive contained spoken words while 4 negative and 5 positive contained songs with words. One positive clip contained a song without words. Neutral clips were from nature documentaries (e.g. a flower blooming) and contained no affective content. Importantly, to control for differences in animation and cinematography styles, each movie contributed one negative and one positive clip. To help minimize differences in visual features each film clip was rated on a second-by-second basis for the presence (1 if present, 0 if not) of the following: facial features (eyes, noses, mouths), negative emotion (e.g., anger, fearfulness, pain, or frowning), positive affect (e.g., smiling, cheering, warm embrace, excitement), and neutral content (i.e., not containing either positive or negative content). The specific ratings for each clip are included in Supplement 1. There was no difference between positive and negative clips in the average amount of time (t(14) = −0.30, p=0.77) that facial features were present, nor was there a difference in the average emotional valence scores (t(14) = 0.51, p=0.62). In total, participants viewed 253 seconds of negative film clips, 237 seconds of neutral film clips, and 256 seconds of positive film clips. To minimize carryover effects from viewing one valence into the next movie clip, the clips were randomly ordered, creating three different versions of the task. The three versions of the task were randomly assigned to participants. After the fMRI scan, participants were administered a short quiz in which they were asked to identify if a given movie frame was from the clips they had watched in the scanner (8 questions) or from an unviewed movie (8 questions). Participants were able to pass this quiz with high accuracy in both the adult (accuracy 92.9±7.9%) and child (accuracy 97.9±3.3%) groups. There was no significant difference in accuracy between adults and children (t(49)= −1.82, p=0.076) and no significant correlation between age and accuracy in the child group (Pearson’s r(29)=0.25, p=0.189).
Figure 1:
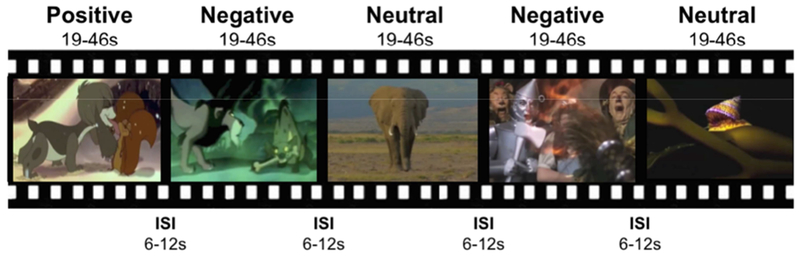
A schematic of the KidVid fMRI task. Children watched 24 short film clips (8 each positive, negative and neutral) 19-46 seconds long with an inter-stimulus interval (ISI) of 6-12 seconds.
2.3. MRI Acquisition
Neuroimaging data were collected using a 3T Siemens Trio MR scanner equipped with a 12-channel parallel transmit-receive head coil. T1-weighted structural magnetization prepared rapid acquisition gradient echo (MP-RAGE) images were acquired with the following sequence parameters: repetition time, inversion time, and echo time (TR/TI/TE, respectively) = 2530/1100/3.44ms, 7-degree flip angle (FA), 256mm field of view (FOV), 256×256 matrix, 1mm isotropic voxel, and a total acquisition time of 353s (1 volume). There were 175 sagittal left-to-right slices (whole brain) acquired. Functional whole brain blood oxygen-level dependent (BOLD) echo planar images were collected in a sagittal acquisition with the following parameters: TR/TE = 2000/30ms, 90-degree FA, 256mm FOV, 64×64 matrix, 4mm isotropic voxel, and a total acquisition time of 1020s (510 successive volumes). Stabilization scans were acquired and discarded by the scanner before triggering the start of the KidVid task.
2.4. MRI preprocessing
Structural MR data (sMRI) were preprocessed by simultaneous segmentation and normalization as implemented in SPM12 (Friston et al., 2007) with default parameters. This step segmented the sMRI using six tissue priors, registered the sMRI to a standard Montreal Neurological Institute (MNI) 2mm isotropic template, and performed light regularization to correct for spatial bias in the image. Brain extraction was performed by first thresholding gray, white, and cerebrospinal fluid tissue maps with a 0.1 probability threshold then combining them and filling holes in the volume. The resulting mask was applied to the sMRI. Functional MR data (fMRI) were preprocessed in SPM12 according to standard practices. Each volume was first slice-time corrected then rigidly registered to the mean volume of the time series to correct for movement across sequence collection. Next, the mean fMRI image was used to register the fMRI data to the MNI template by first coregistering to the participant’s sMRI then applying the deformation field from the structural segmentation to the fMRI data. Finally, fMRI data were spatially smoothed using an 8mm full-width at half-maximum kernel. To control for motion quality, participants with motion exceeding 3mm of absolute translation in any direction for more than 2% of the fMRI volumes were excluded from further analyses (6 children, 0 adults).
2.5. Preparing the training set
All subsequent analyses were carried out in python3.6 using the Nipype (Gorgolewski et al., 2011) and scikit-learn (Pedregosa et al., 2011) libraries. The full analysis code is freely available online at bitbucket.org/lcbd/kidvid_mvpa. To build the training sample set, each trial was modeled using a typical general linear model (GLM). This model consisted of each trial modeled separately by convolving a double gamma hemodynamic response function convolved onto a box car function, the width of which corresponded to the length of each particular clip. Serial correlations were also modeled and framewise displacement was included as a covariate of noninterest. High-pass filtering to account for slow signal drift (1/128 Hz) was applied right before GLM deconvolution. This model resulted in 24 (8 per condition) whole brain, voxel-wise parameter maps per subject for a total of 1,224 training samples across all participants. Parameter estimates were normalized (i.e. converted to standard units) for subsequent analyses.
2.6. Condition classification across age groups
Before classifying subjects on the basis of age group, a support vector classifier (SVC) with a linear kernel was trained on the full sample (1,224 training samples) to classify each condition (positive, negative, or neutral). This model provides context for development-specific changes in neural activity in response to the three conditions. Additionally, this model would provide insight into which regions are stable in their participation during emotion processing across childhood and into adulthood. Classification accuracy for each model was estimated using leave one subject out (LOSO) cross-validation in order to maximize the amount of training data used in each cross-validation iteration. As points of reference to evaluate the SVC performance, theoretical chance level was calculated based on ground truth (1/3 or 33.33%) and simulated chance level were derived from 500 condition-label permutations. Labels (positive, negative, or neutral) were permuted within each participant rather than across the entire training sample set in order to maintain the same number of each label within each subject for these permutation tests.
2.7. Age group classification across and within conditions
To test if the emotion processing parameter estimates from the negative and positive conditions could accurately classify age groups (adults versus children) an SVC with a linear kernel was employed to classify age groups across and within each condition. There is no a priori reason to hypothesize that children and adults would process neutral movie clips (nature videos) differently, thus the across conditions model and neutral condition model were included to contextualize results from the negative and positive condition models. Classification accuracy for each model was estimated using LOSO cross-validation. To evaluate the performance of the SVCs, theoretical chance level accuracy was calculated based on ground truth (number of children divided by total number of participants) and simulated chances levels were estimated from 500 group-label permutations. Labels (adult or child) were permuted across the entire training sample set for these permutation tests. Both theoretical and simulated chance levels provide a reference point to evaluate model performance. Additionally, p-values were assigned based on recommendations from Combrisson and Jerbi, which includes acceptable accuracy cut offs based on sample size and number of labels (Combrisson and Jerbi, 2015). A total of 4 SVC models classifying age group were examined: across all conditions (1,224 training samples), within negative (408 training samples), within positive (408 training samples), and within neutral (408 training samples).
2.8. Exploratory multivariate age prediction in children
As an exploratory follow-up analysis, we next examined if the emotion processing parameter estimates could train a model to accurately predict a child’s age. To this end, a linear kernel support vector regression (SVR) was employed within only children to predict activity within each condition associated with age. Mean square error (MSE) for each model was estimated using LOSO cross validation. Predicted ages for each subject from the cross validation was regressed on the actual ages to test correspondence between the model and the ground truth. Both Pearson’s and Spearman’s correlations were recorded. A total of 4 models were tested: across all conditions (720 training samples), within negative (240 training samples), within positive (240 training samples), and within neutral (240 training samples).
3. Results
3.1. Participants
There were no differences between the adult and child groups on the basis of race, ethnicity, or sex (X2<0.71, ps>0.398). Participants were 49.9% male, 46.7% in the child group and 52.4% in the adult group. The child sample was 76.7% Caucasian American, 13.3% African American, 10.0% Asian American. The adult sample was 71.4% Caucasian American, 19.0% African American, and 9.5% Asian American. Only 1 participant identified as Latino or Hispanic (child group).
Multivariate results (SVC and SVR) are summarized in Table 1.
Table 1:
Multivariate support vector model results. 1a.) A summary of the support vector classifier performance across adults and children (N=51 participants, 1224 total training samples). Theoretical chance was calculated as instances of a given label over the total labels in the set. In the case of group, there are more children than adults, thus chance level was calculated as number of children over the total number of participants (30/51). The permuted chance level was derived from 500 label permutations and is included as the mean accuracy. The p-value range is taken from Combrisson and Jerbi, 2015 and corresponds to a sample size range of 40-60 subjects (note: since 3 label classes were not simulated in Combrisson and Jerbi, 2015, a p-value range for the condition-classifying SVC is not included). 1b.) A summary of SVR model performance performed within the child group only (N=30 children, 720 total training samples). Pearson’s correlation coefficient and Spearman’s rho were derived from correlating the predicted age label and the actual age label.
| a. Support Vector Classifiers | |||||||
|---|---|---|---|---|---|---|---|
| Outcome | Sample Set | Accuracy | Sensitivity | Precision | Theoretical Chance | Permuted Chance | P-value Range |
| Condition | All | 61.44% | 61.44% | 61.50% | 33.33% | 33.37% | -- |
| Group | All | 62.01% | 61.01% | 60.92% | 58.00% | 50.79% | >0.05, n.s. |
| Group | Negative | 69.61% | 69.17% | 68.83% | 58.00% | 51.06% | 0.001-0.01 |
| Group | Neutral | 64.71% | 64.55% | 64.17% | 58.00% | 51.11% | 0.01-0.05 |
| Group | Positive | 70.59% | 70.45% | 69.97% | 58.00% | 51.09% | 0.001-0.01 |
| b. Support Vector Regressors | ||||||
|---|---|---|---|---|---|---|
| Outcome | Sample Set | Pearson’s R | P-value | Spearman’s rho | P-value | MSE |
| Age | All | 0.34 | 0.066 | 0.26 | 0.156 | 408.90 |
| Age | Negative | −0.17 | 0.374 | −0.09 | 0.632 | 813.33 |
| Age | Neutral | 0.04 | 0.846 | 0.07 | 0.728 | 548.21 |
| Age | Positive | 0.17 | 0.363 | 0.14 | 0.454 | 507.71 |
3.2. Condition classification across age groups
The SVC was able to successfully classify positive, negative, and neutral viewing conditions across the full sample with 61.44% accuracy that was nearly double both theoretical (33.33%) and simulated (33.37%) chance. The SVC performed with high sensitivity (61.44%) and precision (61.50%). Sensitivity was higher for neutral than for negative and positive (75.00%, 62.75%, and 46.57% respectively). Brain regions whose activity contributed the most to the model (top 5%) are presented in full in Table 2. To aid in interpretation, these regions were separated using the AAL2 atlas, and mean parameter estimates were extracted for the intersection of the full SVM weight map and the AAL2 atlas. These included large areas of the bilateral superior temporal sulcus (superior and middle temporal gyri), bilateral posterior cingulate cortex, bilateral posterior inferior temporal gyrus, the right inferior frontal gyrus, the right pulvinar/ventral posteriolateral thalamic nuclei, and small regions of the right dorsolateral precentral gyrus, right amygdala, and right hippocampus. These regions and the confusion matrix from this SVC are visualized in Figure 2 as a comparison to the age group classification model results.
Table 2:
Regions that best classified each condition are listed in descending rank order (largest contributors to the model first). Average parameter estimates and standard deviations are listed in standard units.
| SVC | Peak MNI Coordinates | Outcome Parameter Estimate Mean±SD | ||||||
|---|---|---|---|---|---|---|---|---|
| sample set | Cluster Size | Region | X | Y | Z | Negative | Neutral | Positive |
| All | 91 | Bilateral posterior cingulate cortex | 0 | −18 | 28 | −6.75±6.65 | −1.74±5.79 | −5.66±6.11 |
| 187 | Right superior temporal pole | 42 | 10 | −24 | 1.31±2.88 | 1.61±2.90 | 1.23±3.42 | |
| 1567 | Right superior temporal gyrus | 62 | −6 | −2 | 1.88±2.89 | 3.27±3.88 | 2.50±3.84 | |
| 1965 | Left middle temporal gyrus | −48 | −22 | −8 | 1.34±2.52 | 2.11±3.35 | 1.40±3.41 | |
| 2098 | Right middle temporal gyrus | 68 | −22 | −4 | 2.03±3.28 | 2.82±4.03 | 2.12±4.19 | |
| 78 | Left superior temporal pole | −46 | 4 | −20 | 1.08±3.10 | 1.00±3.05 | 0.85±3.47 | |
| 13 | Right lingual gyrus | 14 | −30 | −8 | 1.77±4.37 | 1.74±5.57 | 1.77±5.59 | |
| 31 | Right precentral gyrus | 50 | 2 | 54 | 2.99±4.20 | −0.64±4.16 | 2.12±4.36 | |
| 412 | Right fusiform gyrus | 40 | −40 | −14 | 3.69±4.54 | 4.15±5.00 | 3.91±5.68 | |
| 924 | Left superior temporal gyrus | −52 | −26 | 4 | 2.84±3.23 | 3.45±3.29 | 2.93±3.40 | |
| 90 | Right angular gyrus | 44 | −52 | 24 | 0.24±3.47 | 0.95±5.00 | 0.24±4.44 | |
| 225 | Right middle temporal pole | 50 | 2 | −16 | 0.89±2.66 | 1.22±3.55 | 0.64±3.79 | |
| 517 | Left occipital cortex | −38 | −68 | −14 | 2.97±3.87 | −0.40±3.44 | 2.16±3.78 | |
| 212 | Right inferior frontal gyrus | 48 | 20 | 20 | 5.12±4.12 | 0.55±4.44 | 3.85±4.41 | |
| 72 | Left supramarginal gyrus | −54 | −44 | 26 | 0.90±3.37 | 2.11±4.22 | 0.91±4.17 | |
| 77 | Left middle occipital cortex | −46 | −74 | 12 | 3.61±4.79 | 5.62±5.67 | 4.73±6.64 | |
| 61 | Right hippocampus | 16 | −28 | −8 | 0.66±2.88 | 0.69±2.90 | 0.60±3.32 | |
| 38 | Right middle occipital cortex | 40 | −66 | 4 | 4.94±5.46 | 7.02±4.66 | 5.32±5.63 | |
| 133 | Right inferior temporal gyrus | 42 | −42 | −14 | 3.81±4.47 | 4.94±4.52 | 4.39±5.32 | |
| 113 | Right inferior occipital cortex | 44 | −72 | −10 | 5.06±4.88 | 6.20±4.87 | 5.15±5.50 | |
| 81 | Right pulvinar thalamic nucleus | 18 | −24 | −2 | 1.12±2.80 | 1.06±3.04 | 0.91±3.02 | |
| 25 | Right amygdala | 34 | 0 | −20 | 0.34±2.90 | 1.02±3.05 | 0.97±3.48 | |
| 5 | Left angular gyrus | −44 | −52 | 22 | 0.44±3.06 | 0.85±4.13 | 0.98±4.25 | |
| 73 | Right supramarginal gyrus | 56 | −48 | 24 | −0.09±3.18 | 1.06±5.04 | 0.47±4.58 | |
| 55 | Right cerebellum | 40 | −60 | −24 | 2.84±5.24 | 3.78±6.78 | 3.95±7.93 | |
| 4 | Right cerebellum crus | 44 | −58 | −24 | 2.18±5.88 | 4.38±8.96 | 3.31±8.91 | |
Figure 2:
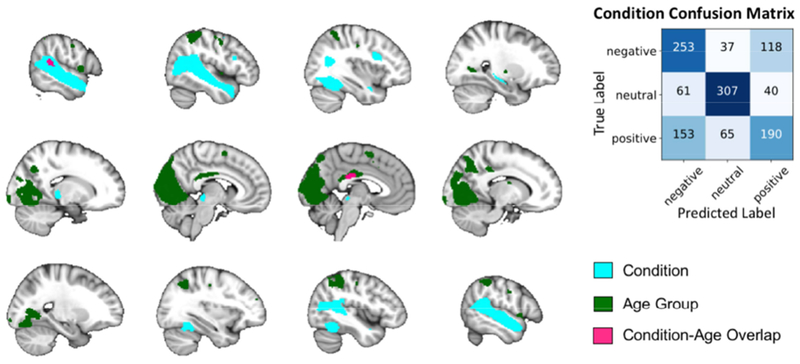
Regions that most informed the condition SVC are overlaid on the MNI template brain for ease of comparison to regions informing the age group SVCs. Only two brain regions overlapped between the two sets. Age group SVC regions from only the within positive and negative models are included for ease of visualization. The confusion matrix for the condition SVC is included to highlight the accuracy of the model per condition.
3.3. Age group classification across and within conditions
The SVCs within neutral, negative, and positive condition SVCs were able to successfully classify adults versus children (ps<0.05), while the SVC classifying adults versus children across all conditions did not perform better than chance (p>0.05). The negative and positive models performed better than neutral (positive p-value range = 0.001-0.01; negative p-value range = 0.001-0.01; neutral p-value range = 0.01-0.05). Both performed well above theoretical (58.00%) and simulated (Mean±SD negative=51.06%; positive=51.09%) chance levels with accuracies greater than 69.61% and high sensitivity (>69.17%) and precision (>68.83%). Brain regions contributing most to each SVC (top 5%) are listed in detail in Table 3. As with the previous model, these regions were separated using the AAL2 atlas, and mean parameter estimates were extracted for the intersection of the full SVM weight map and the AAL2 atlas. The positive condition SVC was best informed by the bilateral cuneus, calcarine cortex, lingual gyri, precuneus, superior parietal lobule, inferior parietal lobule, posterior cingulate cortex, left posterior putamen, left pallidum, left caudate tail, bilateral occipital pole, and the cerebellum. These regions are visualized in Figure 3 along with the confusion matrix for the positive condition SVC. These regions overlapped with regions contributing most to the negative condition SVC, however the caudate tail did not contribute to the negative condition SVC. Regions of the left precentral gyrus and right posterior putamen additionally contributed to the negative condition SVC, and the bilateral inferior and superior parietal lobule regions were larger. The confusion matrix for the negative condition SVC and the regions contributing to the model are included in Figure 3. Positive and negative condition SVC results are also combined in Figure 2 for easy comparison to the condition classifier results listed in section 3.2.
Table 3:
Regions that best classified each group for each SVC that performed better than chance (positive, negative, and neutral) are listed below in descending rank order (largest contributors to the model first). Average parameter estimates and standard deviations for each cluster are listed in standard units.
| SVC | Peak MNI Coordinates | Outcome Parameter Estimate Mean±SD | |||||
|---|---|---|---|---|---|---|---|
| Sample set | Cluster Size | Region | X | Y | Z | Adults | Children |
| Negative | 21 | Right fusiform gyrus | −42 | −58 | −22 | 3.38±4.75 | 7.62±6.70 |
| 304 | Right inferior parietal lobule | 56 | −44 | 22 | 2.38±2.49 | 5.64±4.15 | |
| 58 | Left middle temporal gyrus | −62 | −40 | −10 | −0.21±1.69 | −2.44±3.43 | |
| 83 | Right inferior frontal gyrus | 60 | 8 | 10 | 1.40±2.49 | −0.90±3.30 | |
| 28 | Left inferior frontal gyrus | −58 | 8 | 0 | 0.47±3.80 | −2.35±4.07 | |
| 1008 | Left lingual gyrus | −24 | −86 | −16 | −0.80±3.25 | −1.43±3.26 | |
| 115 | Right cerebellum | 8 | −66 | −10 | 0.50±3.81 | −0.24±2.96 | |
| 696 | Right cuneus | 4 | −76 | 32 | −2.15±3.35 | −2.93±3.59 | |
| 80 | Left superior occipital cortex | −6 | −100 | 8 | 0.54±3.40 | 1.40±5.48 | |
| 1267 | Left calcarine cortex | 0 | −96 | 0 | −0.72±3.42 | −1.07±3.87 | |
| 81 | Right precuneus | 10 | −76 | 54 | −2.50±5.15 | −2.50±5.38 | |
| 49 | Cerebellar vermis | 6 | −68 | −10 | −0.93±4.92 | −1.13±3.60 | |
| 1109 | Right lingual gyrus | 8 | −68 | −10 | −0.50±3.02 | −1.01 ±3.07 | |
| 527 | Bilateral posterior cingulate cortex | 10 | −28 | 28 | −2.15±3.09 | −5.24±4.40 | |
| 621 | Left cuneus | −2 | −82 | 32 | −3.33±4.40 | −3.83±4.61 | |
| 790 | Left inferior parietal lobule | −54 | −46 | 54 | −0.77±3.29 | −4.43±4.51 | |
| 148 | Left premotor cortex | −8 | 0 | 62 | 0.01±3.07 | −2.57±3.61 | |
| 34 | Left fusiform gyrus | −22 | −86 | −18 | 5.00±7.11 | 5.24±5.56 | |
| 42 | Right premotor cortex | 50 | −10 | 52 | 0.72±3.48 | −2.01±3.99 | |
| 219 | Left cerebellum | −4 | −74 | −14 | 0.08±5.11 | −0.64±3.59 | |
| 1042 | Right calcarine cortex | 10 | −98 | 4 | −1.28±2.88 | −1.42±3.17 | |
| 533 | Right angular gyrus | 50 | −52 | 52 | −0.45±4.01 | −5.31±5.59 | |
| 355 | Left precuneus | −10 | −68 | 38 | −0.71±3.82 | −5.16±5.43 | |
| 80 | Right premotor cortex | 58 | −6 | 42 | 1.12±2.81 | −1.36±3.65 | |
| 28 | Cerebellar vermis | −2 | −62 | −2 | −1.60±3.33 | −1.84±3.25 | |
| 26 | Right fusiform gyrus | 24 | −74 | −12 | 2.64±4.95 | 0.92±3.34 | |
| 60 | Right cerebellum | 12 | −48 | −6 | −1.20±2.71 | −1.32±3.15 | |
| 39 | Left cerebellum | −4 | −60 | −2 | −2.14±3.83 | −2.32±3.37 | |
| 114 | Left precentral gyrus | −52 | −12 | 42 | 0.22±2.97 | −2.08±3.12 | |
| 5 | Right superior parietal lobule | 10 | −78 | 52 | −1.49±8.68 | −1.24±6.72 | |
| 66 | Left putamen/pallidum | −26 | −20 | 0 | 0.09±2.18 | −1.65±2.59 | |
| 26 | Right putamen | 30 | −10 | 2 | 0.13±2.16 | −1.57±2.73 | |
| 12 | Right superior occipital cortex | 31 | 12 | 44 | −0.09±3.67 | 1.34±5.45 | |
| Neutral | 1227 | Right calcarine cortex | 30 | −66 | 6 | −4.49±3.92 | −5.87±3.93 |
| 1473 | Left lingual gyrus | −22 | −78 | −2 | −3.12±4.28 | −5.96±4.58 | |
| 160 | Left fusiform gyrus | −28 | −80 | −18 | 3.36±5.17 | 0.08±6.61 | |
| 40 | Left thalamus | −8 | −30 | 4 | −0.11±4.31 | −3.08±5.95 | |
| 123 | Left superior occipital cortex | −14 | −88 | 14 | −1.63±2.84 | −3.67±4.74 | |
| 363 | Left cerebellum | −26 | −80 | −20 | −1.23±4.33 | −4.22±4.89 | |
| 40 | Left middle occipital cortex | 18 | −86 | 18 | −0.59±5.33 | −2.71±6.22 | |
| 35 | Left cerebellum crus | −26 | −82 | −20 | 2.05±8.87 | −0.04±9.01 | |
| 386 | Left superior temporal sulcus | −54 | −30 | −2 | −0.21±1.35 | −1.57±2.06 | |
| 1620 | Left calcarine cortex | 2 | −98 | 0 | −5.12±4.29 | −6.71±4.70 | |
| 573 | Left cuneus | −8 | −78 | 20 | −6.79±3.83 | −10.36±5.36 | |
| 627 | Right cuneus | 18 | −90 | 14 | −4.79±3.61 | −7.37±4.88 | |
| 391 | Right superior temporal sulcus | 46 | −30 | −8 | −0.75±1.97 | −2.42±2.99 | |
| 1549 | Left lingual gyrus | 16 | −68 | −8 | −3.29±4.01 | −4.76±4.26 | |
| 291 | Right fusiform gyrus | 24 | −62 | −14 | 4.50±4.01 | 1.28±5.24 | |
| 10 | Right inferior occipital cortex | 32 | −80 | −12 | 7.79±4.54 | 5.17±7.62 | |
| 3 | Left middle occipital cortex | −18 | −86 | −6 | 2.11±4.37 | 2.05±6.24 | |
| 262 | Right cerebellum | 10 | −72 | −20 | 1.01±4.28 | −1.26±4.9 | |
| 43 | Right precuneus | 6 | −76 | 54 | −5.55±6.74 | −9.68±9.87 | |
| 50 | Cerebellar vermis | −2 | −64 | −2 | −4.26±3.74 | −5.87±5.06 | |
| 102 | Cerebellar vermis | 6 | −74 | −18 | −2.11±4.64 | −4.58±5.16 | |
| 92 | Right cerebellum | 8 | −52 | −6 | −2.99±3.16 | −4.16±3.88 | |
| 10 | Left inferior occipital cortex | −28 | −80 | −12 | 5.21±5.48 | 4.52±7.93 | |
| 37 | Left caudate tail | −16 | −12 | 20 | −0.32±2.57 | −1.84±3.00 | |
| 56 | Left cerebellum | −6 | −62 | −6 | −3.15±3.07 | −5.41±4.01 | |
| 30 | Left precuneus | −24 | −56 | 4 | −2.75±2.85 | −3.28±3.52 | |
| 8 | Right superior parietal lobule | 12 | −82 | 48 | −3.41±7.84 | −9.82±12.64 | |
| Positive | 879 | Right cuneus | 12 | −100 | 8 | −5.60±4.51 | −7.38±5.59 |
| 81 | Right occipital cortex | 18 | −102 | −12 | 4.69±6.08 | 8.84±5.21 | |
| 61 | Left inferior parietal lobule | −58 | −38 | 48 | −0.45±4.04 | −3.28±4.74 | |
| 32 | Right fusiform cortex | 22 | −78 | −14 | −0.79±5.77 | −2.89±4.82 | |
| 1157 | Right lingual gyrus | 20 | −80 | −14 | −4.36±3.82 | −4.99±4.24 | |
| 142 | Right cerebellum | 20 | −78 | −16 | −2.92±5.09 | −3.70±5.51 | |
| 141 | Right precuneus | 12 | −78 | 54 | −5.99±6.89 | −6.03±6.83 | |
| 1287 | Left calcarine cortex | −4 | −104 | 4 | −4.71±4.74 | −6.10±4.99 | |
| 55 | Right premotor cortex | 48 | −2 | 48 | 1.42±3.50 | −1.05±4.01 | |
| 120 | Left superior occipital cortex | −4 | −104 | 6 | −3.37±3.91 | −3.95±4.99 | |
| 1102 | Left lingual gyrus | −14 | −66 | −6 | −3.70±4.07 | −5.12±4.34 | |
| 514 | Bilateral posterior cingulate cortex | −6 | −40 | 20 | −1.98±3.34 | −5.01±4.55 | |
| 185 | Right inferior parietal lobule | 54 | −42 | 20 | 1.69±2.56 | 4.53±4.21 | |
| 904 | Left cuneus | −4 | −102 | 6 | −6.45±5.56 | −8.41±6.99 | |
| 214 | Left premotor cortex | −2 | 0 | 56 | −0.26±3.20 | −2.59±3.37 | |
| 16 | Right superior parietal lobule | 14 | −80 | 52 | −4.66±9.22 | −5.59±10.81 | |
| 409 | Left precuneus | 0 | −66 | 54 | −5.83±6.63 | −5.43±6.18 | |
| 999 | Right calcarine cortex | 12 | −64 | 14 | −4.42±4.25 | −6.76±4.74 | |
| 139 | Left inferior frontal gyrus | 56 | 4 | 8 | 2.25±3.41 | −0.26±3.66 | |
| 247 | Left cerebellum | −22 | −68 | −16 | −3.05±5.12 | −4.70±5.68 | |
| 101 | Right inferior parietal lobule | 44 | −50 | 54 | 0.46±7.39 | −4.56±7.21 | |
| 116 | Left occipital cortex | −16 | −100 | −4 | 6.32±5.35 | 10.9±5.94 | |
| 82 | Cerebellar vermis | −2 | −80 | −14 | −3.86±5.59 | −4.20±5.89 | |
| 119 | Left putamen | −32 | −14 | 0 | −0.06±2.14 | −1.60±2.40 | |
| 51 | Left fusiform cortex | −22 | −70 | −14 | 1.40±7.40 | 0.79±6.22 | |
| 57 | Left cerebellum | −8 | −58 | −6 | −3.24±4.35 | −4.84±4.81 | |
| 32 | Right superior occipital cortex | 16 | −88 | 28 | −4.52±4.45 | −5.47±5.13 | |
| 71 | Left inferior frontal gyrus | −58 | 12 | 0 | 0.27±3.69 | −2.54±4.11 | |
| 65 | Right cerebellum | 8 | −54 | −8 | −2.95±3.39 | −4.07±3.99 | |
| 64 | Cerebellar vermis | 0 | −66 | −4 | −2.75±5.34 | −4.45±4.77 | |
| 44 | Left caudate tail | −14 | −8 | 20 | −0.21±2.70 | −1.96±2.84 | |
| 21 | Left superior parietal lobule | −14 | −60 | 46 | −3.62±5.33 | −2.30±5.01 | |
| 90 | Left inferior parietal lobule | −44 | −58 | 44 | −1.30±4.93 | −4.85±5.83 | |
Figure 3:
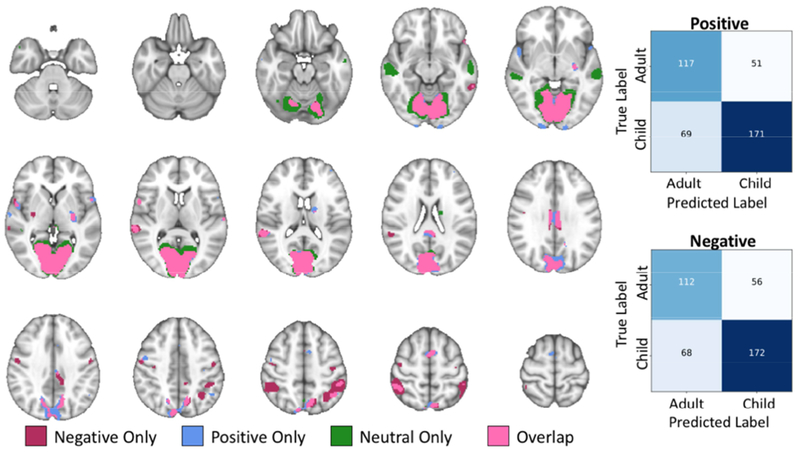
Regions most informing the age group classification models for each condition and their overlap is displayed for ease of comparison. The confusion matrices for the negative and positive models are presented to visualize age group level accuracy.
Two follow up analyses were also conducted and are included in the Supplement (Supplement 2 and 3). Supplement 2 repeats all SVCs but uses a cross validation technique that leaves specific clips out for testing rather than specific participants. Supplement 3 tests if an SVC trained in one condition would be able to predict age groups in another condition.
3.4. Exploratory multivariate age prediction in children
None of the exploratory SVRs predicting child age within the child group only were able to perform accurately. None of the linear relationships between the predicted and actual ages were significant (ps>0.05).
4. Discussion
Our findings replicate and extend previous work decoding emotion processing in the human brain (Ethofer et al., 2009; Kassam et al., 2013; Said et al., 2010). We found evidence for a distributed network of neural activation patterns that lent to accurate classification of positive, negative, and neutral stimuli across all participants, which included sensory integration, social processing (IPL and STS), and ventral and primary visual cortex regions. Extending these results, we were able to accurately classify child and adult neural activation within each condition separately. These models were best informed by a distributed pattern of activation that did not overlap with the condition classification model with the exception of a small region of the IPL/posterior STS and a region of the posterior cingulate cortex. Regions that accurately distinguished adults from children within each condition (positive, negative, and neutral) overlapped considerably with a handful of exceptions. In negative only, additional regions of the left fusiform cortex, left precentral gyrus, posterior cingulate, right angular gyrus, left supramarginal gyrus, and the left superior parietal lobule were informative to the model. In positive only, additional regions of the bilateral occipital and temporal poles, right precentral gyrus, and posterior cingulate cortex informed the model. In neutral only, anterior regions of the bilateral middle temporal gyri were informative. Additionally, the across conditions model was not able to accurately classify children versus adults, consistent with behavioral research indicating distinct trajectories for developing negative, neutral, and positive emotion processing (Durand et al., 2007; Gao and Maurer, 2010). These results may point to important developmental shifts from childhood to adulthood in visual processing of negative content, specifically decreased engagement of social and sensory integration regions (fusiform gyrus, occipital cortex, inferior parietal lobule) and increased emotion regulation engagement (inferior frontal gyrus) in adults compared to children.
The largest area informing the group models was the visual cortex. There is extensive evidence for the protracted development of the visual cortex through childhood and adolescence, particularly for regions that distinguish faces and scenes from objects (Golarai et al., 2007; Grill-Spector et al., 2008). There is some evidence that the visual cortex activation is modulated by emotional content (Peyk et al., 2008; Sabatinelli et al., 2009). Systematic study of emotional content versus feature detection (e.g. colors, angles, or shapes), however, finds that this relationship between visual cortex activation and emotional content is likely due to the differences in visual features between stimuli of differing valences (Rotshtein et al., 2001). Additionally, the visual cortex has a low propensity to habituation (Schupp et al., 2006) evidenced by extensive multivariate work successfully and reliably decoding it (Haxby, 2012, 2001; Norman et al., 2006). The visual cortex would therefore activate similarly across a task even if the participant had habituated to the emotional content of the task stimuli. This suggests that the visual cortex is likely developing across age in terms of feature processing rather than in how it processes distinct emotions. This is consistent with our results since the visual cortex did not inform the across sample condition classification to the same degree as it informed the age classification models.
We also found greater activation of the inferior frontal gyrus (IFG) in adults compared to children when processing emotional stimuli (positive and negative). Lesion studies of the IFG suggest that the IFG is important for engaging in emotional empathy (Shamay-Tsoory et al., 2009). The IFG is associated with processing prosody, the emotional content of speech (Frühholz and Grandjean, 2013; Rota et al., 2011) as well as both identifying and expressing emotional faces (Hennenlotter et al., 2005). There is evidence that individuals with autism spectrum disorder improve in emotional face identification with increasing activation of the IFG both within a task (Zürcher et al., 2013) and with developmental improvements across age (Bastiaansen et al., 2011). Based on this work, it is possible that greater activation in the IFG found in the present study is related to improved emotional content identification, however behavioral studies of emotion processing in children show that children 4-12 possess adult-level ability to identify overtly positive and negative stimuli (Durand et al., 2007; Gao and Maurer, 2010). Additionally, there is evidence that the IFG is integral to inhibiting both cognitive and motor responses, likely via cortico-basal ganglia-thalamic loops (Aron et al., 2014). Inhibition is an important step in emotion regulation, and the IFG is found to activate more during directed emotion regulation (Goldin et al., 2008; Grecucci et al., 2013). Thus, it is more likely that greater IFG activation in adults is related to improvements in emotional regulation between childhood and adulthood.
This study has several notable strengths. First, we used naturalistic, child-friendly emotional stimuli that included a wider range of contexts than previous work on emotion processing in children. Complex scenes, with multiple emotions of the same general valence, more accurately reflect real world emotional situations than single, static, isolated stimuli. Second, we included a wide range of children (ages 4-12) as well as a separate adult group in order to more confidently generalize our findings between differences in children and adults. However, there were several limitations to take into consideration. First, though these analyses were conducted on 1,224 training samples, these samples came from only 51 individuals. This is a larger number of participants than have been previously included in studies decoding emotion processing (Ethofer et al., 2009; Kassam et al., 2013; Said et al., 2010) but these results must be replicated in a larger, separate sample nonetheless. With a larger sample of children, it may be possible to detect changes in emotion processing circuitry year by year, which was not found in our sample. Further, pubertal status was not formally collected for our child sample. While most of the children included in the study are too young to likely be starting puberty, future work examining emotion processing from childhood into adolescence should collect this information, particularly since boys and girls tend to progress through puberty at different rates (Sisk and Foster, 2004). Additionally, though we tried to minimize this limitation by including unique film clips for each trial, it is impossible to completely disentangle development in visual processing from development of emotional processing as there are likely visual features that are highly collinear with their emotional content (e.g. dark green and black contrast correlating with negative film clips). Thus, future work should strive to include a wide variety of visual presentations of emotional stimuli to further elucidate circuitry associated with emotional visual processing development separately from simple visual processing development. Lastly, the KidVid paradigm included generally negative, neutral, and positive movie clips and were not further selected to fit specific but common emotional situations. Future work is needed to see if there are distinct neurodevelopmental pathways for naturalistic processing of specific emotional situations (e.g., learning of the death of a loved one or achieving a group goal). A potential means of conducting this work while maintaining the naturalistic integrity of the stimuli could include having participants ranging from child through adulthood watch an entire episode of an emotional TV show and conduct inter-subject correlation analysis similar to the analysis done in Finn et al (2018).
5. Conclusions
In conclusion, this study provides an important step forward in mapping the neurodevelopmental changes that underlie the development of emotional processing from childhood to adulthood. Notably, these results extend past research demonstrating a distinct, protracted development in processing negative information. Specifically, we found evidence for the neural basis of the shift from primarily processing or contextualizing the content to regulating emotion while consuming negative content. This is consistent with behavioral observations of child versus adult reactions to emotional stimuli. Most people have the experience of seeing a child get visibly excited at a happy song in a movie or physically hiding or crying in response to the appearance of a villain while teens and adults are able to remain composed when watching the same content. Mapping this change across age is important to understanding emotion regulation development, a crucial process to engage with in order to treat childhood onset socio-emotional psychopathology such as depression, anxiety, irritability, and autism. A better understanding of these emotional neural systems would improve intervention and prevention efforts of these disorders.
Supplementary Material
Acknowledgements
We thank the many families who contributed their time to this study. We thank Lisa Bemis, Brianna Jones, Caroline Macgillivray, Meghan Murphy, and Amiee Willet for their help with data collection, stimuli development, and subject recruitment. This work was supported by the National Institute of Health [K01 MH094467 (Perlman), R01 MH107540 (Perlman), T32 MH019986 (Karim)] and the National Science Foundation Graduate Research Fellowship [174745 (Camacho)].
Footnotes
Publisher's Disclaimer: This is a PDF file of an unedited manuscript that has been accepted for publication. As a service to our customers we are providing this early version of the manuscript. The manuscript will undergo copyediting, typesetting, and review of the resulting proof before it is published in its final citable form. Please note that during the production process errors may be discovered which could affect the content, and all legal disclaimers that apply to the journal pertain.
Declarations of interest: none
References
- Adolphs R, 2009. The Social Brain: Neural Basis of Social Knowledge. Annu. Rev. Psychol 60, 693–716. 10.1146/annurev.psych.60.110707.163514 [DOI] [PMC free article] [PubMed] [Google Scholar]
- Aron AR, Robbins TW, Poldrack RA, 2014. Inhibition and the right inferior frontal cortex: one decade on. Trends Cogn. Sci 18, 177–185. 10.1016/j.tics.2013.12.003 [DOI] [PubMed] [Google Scholar]
- Barrera ME, Maurer D, 1981. The Perception of Facial Expressions by the Three-Month-Old. Child Dev. 52, 203 10.2307/1129231 [DOI] [PubMed] [Google Scholar]
- Bastiaansen JA, Thioux M, Nanetti L, van der Gaag C, Ketelaars C, Minderaa R, Keysers C, 2011. Age-Related Increase in Inferior Frontal Gyrus Activity and Social Functioning in Autism Spectrum Disorder. Biol. Psychiatry 69, 832–838. 10.1016/j.biopsych.2010.11.007 [DOI] [PubMed] [Google Scholar]
- Baucom LB, Wedell DH, Wang J, Blitzer DN, Shinkareva SV, 2012. Decoding the neural representation of affective states. Neuroimage 59, 718–727. 10.1016/j.neuroimage.2011.07.037 [DOI] [PubMed] [Google Scholar]
- Boyatzis CJ, Chazan E, Ting CZ, 1993. Preschool Children’s Decoding of Facial Emotions. J. Genet. Psychol 154, 375–382. 10.1080/00221325.1993.10532190 [DOI] [PubMed] [Google Scholar]
- Brotman MA, Guyer AE, Lawson ES, Horsey SE, Rich BA, Dickstein DP, Pine DS, Leibenluft E, 2008. Facial Emotion Labeling Deficits in Children and Adolescents at Risk for Bipolar Disorder. Am. J. Psychiatry 165, 385–389. 10.1176/appi.ajp.2007.06122050 [DOI] [PubMed] [Google Scholar]
- Brotman MA, Rich BA, Guyer AE, Lunsford JR, Horsey SE, Reising MM, Thomas LA, Fromm SJ, Towbin K, Pine DS, Leibenluft E, 2010. Amygdala Activation During Emotion Processing of Neutral Faces in Children With Severe Mood Dysregulation Versus ADHD or Bipolar Disorder. Am. J. Psychiatry 167, 61–69. https://doi.Org/10.1176/appi.ajp.2009.09010043 [DOI] [PMC free article] [PubMed] [Google Scholar]
- Burnett S, Bird G, Moll J, Frith C, Blakemore S-J, 2009. Development during Adolescence of the Neural Processing of Social Emotion. J. Cogn. Neurosci 21, 1736–1750. 10.1162/jocn.2009.21121 [DOI] [PMC free article] [PubMed] [Google Scholar]
- Camras LA, Allison K, 1985. Children’s understanding of emotional facial expressions and verbal labels. J. Nonverbal Behav 9, 84–94. 10.1007/BF00987140 [DOI] [Google Scholar]
- Cantlon JF, Li R, 2013. Neural Activity during Natural Viewing of Sesame Street Statistically Predicts Test Scores in Early Childhood. PLoS Biol. 11, e1001462 10.1371/journal.pbio.1001462 [DOI] [PMC free article] [PubMed] [Google Scholar]
- Casey BJ, Tottenham N, Liston C, Durston S, 2005. Imaging the developing brain: what have we learned about cognitive development? Trends Cogn. Sci 9, 104–110. 10.1016/j.tics.2005.01.011 [DOI] [PubMed] [Google Scholar]
- Combrisson E, Jerbi K, 2015. Exceeding chance level by chance: The caveat of theoretical chance levels in brain signal classification and statistical assessment of decoding accuracy. J. Neurosci. Methods 250, 126–136. 10.1016/j.jneumeth.2015.01.010 [DOI] [PubMed] [Google Scholar]
- Durand K, Gallay M, Seigneuric A, Robichon F, Baudouin J-Y, 2007. The development of facial emotion recognition: The role of configural information. J. Exp. Child Psychol 97, 14–27. 10.1016/j.jecp.2006.12.001 [DOI] [PubMed] [Google Scholar]
- Eklund A, Nichols TE, Knutsson H, 2016. Cluster failure: Why fMRI inferences for spatial extent have inflated false-positive rates. Proc. Natl. Acad. Sci 113, 7900–7905. 10.1073/pnas.1602413113 [DOI] [PMC free article] [PubMed] [Google Scholar]
- Engels AS, Heller W, Mohanty A, Herrington JD, Banich MT, Webb AG, Miller GA, 2007. Specificity of regional brain activity in anxiety types during emotion processing. Psychophysiology 44, 352–363. 10.1111/j.1469-8986.2007.00518.x [DOI] [PubMed] [Google Scholar]
- Ethofer T, Van De Ville D, Scherer K, Vuilleumier P, 2009. Decoding of Emotional Information in Voice-Sensitive Cortices. Curr. Biol 19, 1028–1033. 10.1016/j.cub.2009.04.054 [DOI] [PubMed] [Google Scholar]
- Finn ES, Corlett PR, Chen G, Bandettini PA, Constable RT, 2018. Trait paranoia shapes inter-subject synchrony in brain activity during an ambiguous social narrative. Nat. Commun 9, 2043 10.1038/s41467-018-04387-2 [DOI] [PMC free article] [PubMed] [Google Scholar]
- Friston KJ, Ashburner J, Kiebel S, Nichols T, Penny WD, 2007. Statistical parametric mapping: the analysis of funtional brain images. Elsevier/Academic Press. [Google Scholar]
- Frühholz S, Grandjean D, 2013. Processing of emotional vocalizations in bilateral inferior frontal cortex. Neurosci. Biobehav. Rev 37, 2847–2855. 10.1016/j.neubiorev.2013.10.007 [DOI] [PubMed] [Google Scholar]
- Gaffrey MS, Barch DM, Luby JL, 2016. Amygdala reactivity to sad faces in preschool children: An early neural marker of persistent negative affect. Dev. Cogn. Neurosci 10.1016/j.dcn.2015.12.015 [DOI] [PMC free article] [PubMed] [Google Scholar]
- Gao X, Maurer D, 2010. A happy story: Developmental changes in children’s sensitivity to facial expressions of varying intensities. J. Exp. Child Psychol 107, 67–86. 10.1016/j.jecp.2010.05.003 [DOI] [PubMed] [Google Scholar]
- Golarai G, Ghahremani DG, Whitfield-Gabrieli S, Reiss A, Eberhardt JL, Gabrieli JDE, Grill-Spector K, 2007. Differential development of high-level visual cortex correlates with category-specific recognition memory. Nat. Neurosci 10, 512–522. 10.1038/nn1865 [DOI] [PMC free article] [PubMed] [Google Scholar]
- Goldin PR, McRae K, Ramel W, Gross JJ, 2008. The Neural Bases of Emotion Regulation: Reappraisal and Suppression of Negative Emotion. Biol. Psychiatry 63, 577–586. 10.1016/j.biopsych.2007.05.031 [DOI] [PMC free article] [PubMed] [Google Scholar]
- Gorgolewski K, Burns CD, Madison C, Clark D, Halchenko YO, Waskom ML, Ghosh SS, 2011. Nipype: A Flexible, Lightweight and Extensible Neuroimaging Data Processing Framework in Python. Front. Neuroinform 5, 13 10.3389/fninf.2011.00013 [DOI] [PMC free article] [PubMed] [Google Scholar]
- Grecucci A, Giorgetta C, Bonini N, Sanfey AG, 2013. Reappraising social emotions: the role of inferior frontal gyrus, temporo-parietal junction and insula in interpersonal emotion regulation. Front. Hum. Neurosci 10.3389/fnhum.2013.00523 [DOI] [PMC free article] [PubMed] [Google Scholar]
- Grill-Spector K, Golarai G, Gabrieli J, 2008. Developmental neuroimaging of the human ventral visual cortex. Trends Cogn. Sci 12, 152–162. 10.1016/j.tics.2008.01.009 [DOI] [PMC free article] [PubMed] [Google Scholar]
- Hare TA, Tottenham N, Galvan A, Voss HU, Glover GH, Casey BJ, 2008. Biological Substrates of Emotional Reactivity and Regulation in Adolescence During an Emotional Go-Nogo Task. Biol. Psychiatry 63, 927–934. 10.1016/j.biopsych.2008.03.015 [DOI] [PMC free article] [PubMed] [Google Scholar]
- Haxby JV, 2012. Multivariate pattern analysis of fMRI: The early beginnings. Neuroimage 62, 852–855. 10.1016/j.neuroimage.2012.03.016 [DOI] [PMC free article] [PubMed] [Google Scholar]
- Haxby JV, 2001. Distributed and Overlapping Representations of Faces and Objects in Ventral Temporal Cortex. Science (80-. ). 293, 2425–2430. 10.1126/science.1063736 [DOI] [PubMed] [Google Scholar]
- Hennenlotter A, Schroeder U, Erhard P, Castrop F, Haslinger B, Stoecker D, Lange K, Ceballosbaumann A, 2005. A common neural basis for receptive and expressive communication of pleasant facial affect. Neuroimage 26, 581–591. 10.1016/j.neuroimage.2005.01.057 [DOI] [PubMed] [Google Scholar]
- Joormann J, Gilbert K, Gotlib IH, 2010. Emotion identification in girls at high risk for depression. J. Child Psychol. Psychiatry Allied Discip 51, 575–582. 10.1111/j.1469-7610.2009.02175.x [DOI] [PMC free article] [PubMed] [Google Scholar]
- Joormann J, Talbot L, Gotlib IH, 2007. Biased processing of emotional information in girls at risk for depression. J. Abnorm. Psychol 116, 135–143. 10.1037/0021-843X.116.1.135 [DOI] [PubMed] [Google Scholar]
- Karim HT, Perlman SB, 2017. Neurodevelopmental maturation as a function of irritable temperament: Insights From a Naturalistic Emotional Video Viewing Paradigm. Hum. Brain Mapp 10.1002/hbm.23742 [DOI] [PMC free article] [PubMed] [Google Scholar]
- Kassam KS, Markey AR, Cherkassky VL, Loewenstein G, Just MA, 2013. Identifying Emotions on the Basis of Neural Activation. PLoS One 8, e66032 10.1371/journal.pone.0066032 [DOI] [PMC free article] [PubMed] [Google Scholar]
- Kircanski K, Gotlib IH, 2015. Processing of Emotional Information in Major Depressive Disorder: Toward a Dimensional Understanding . Emot. Rev 7, 256–264. 10.1177/1754073915575402 [DOI] [Google Scholar]
- Monk CS, Klein RG, Telzer EH, Schroth EA, Mannuzza S, Moulton JL, Guardino M, Masten CL, McClure-Tone EB, Fromm S, Blair RJ, Pine DS, Ernst M, 2008. Amygdala and Nucleus Accumbens Activation to Emotional Facial Expressions in Children and Adolescents at Risk for Major Depression. Am. J. Psychiatry 165, 90–98. 10.1176/appi.ajp.2007.06111917 [DOI] [PubMed] [Google Scholar]
- Motta-Mena NV, Scherf KS, 2017. Pubertal development shapes perception of complex facial expressions. Dev. Sci 20, e12451 10.1111/desc.12451 [DOI] [PubMed] [Google Scholar]
- Norman KA, Polyn SM, Detre GJ, Haxby JV, 2006. Beyond mind-reading: multi-voxel pattern analysis of fMRI data. Trends Cogn. Sci 10, 424–430. 10.1016/j.tics.2006.07.005 [DOI] [PubMed] [Google Scholar]
- Pedregosa F, Varoquaux G, Gramfort A, Michel V, Thirion B, Grisel O, Blondel M, Prettenhofer P, Weiss R, Dubourg V, Vanderplas J, Passos A, Cournapeau D, Brucher M, Perrot M, Duchesnay E, 2011. Scikit-learn: Machine Learning in Python. J. Mach. Learn. Res 12, 2825–2830. [Google Scholar]
- Peelen MV, Atkinson AP, Vuilleumier P, 2010. Supramodal Representations of Perceived Emotions in the Human Brain. J. Neurosci 30, 10127–10134. 10.1523/JNEUROSCI.2161-10.2010 [DOI] [PMC free article] [PubMed] [Google Scholar]
- Pérez-Edgar K, Bar-Haim Y, McDermott JM, Chronis-Tuscano A, Pine DS, Fox NA, 2010. Attention biases to threat and behavioral inhibition in early childhood shape adolescent social withdrawal. Emotion 10, 349–357. 10.1037/a0018486 [DOI] [PMC free article] [PubMed] [Google Scholar]
- Perez-Edgar K, Fox NA, 2003. Individual differences in children’s performance during an emotional Stroop task: A behavioral and electrophysiological study. Brain Cogn. 52, 33–51. 10.1016/S0278-2626(03)00007-1 [DOI] [PubMed] [Google Scholar]
- Perlman SB, Hein TC, Stepp SD, The LAMS Consortium, 2014. Emotional reactivity and its impact on neural circuitry for attention–emotion interaction in childhood and adolescence. Dev. Cogn. Neurosci 8, 100–109. 10.1016/j.dcn.2013.08.005 [DOI] [PMC free article] [PubMed] [Google Scholar]
- Perlman SB, Pelphrey KA, 2011. Developing connections for affective regulation: Age-related changes in emotional brain connectivity. J. Exp. Child Psychol 108, 607–620. https://doi.Org/10.1016/j.jecp.2Q10.08.006 [DOI] [PMC free article] [PubMed] [Google Scholar]
- Perlman SB, Pelphrey KA, 2010. Regulatory brain development: Balancing emotion and cognition. Soc. Neurosci. iFirst, 1–10. 10.1080/17470911003683219 [DOI] [PMC free article] [PubMed] [Google Scholar]
- Peyk P, Schupp HT, Elbert T, Junghofer M, 2008. Emotion Processing in the Visual Brain: A MEG Analysis. Brain Topogr. 20, 205–215. 10.1007/s10548-008-0052-7 [DOI] [PubMed] [Google Scholar]
- Posner MI, Rothbart MK, Sheese BE, Voelker P, 2014. Developing Attention: Behavioral and Brain Mechanisms. Adv. Neurosci 10.1155/2014/405094 [DOI] [PMC free article] [PubMed] [Google Scholar]
- Richardson H, Lisandrelli G, Riobueno-Naylor A, Saxe R, 2018. Development of the social brain from age three to twelve years. Nat. Commun 9, 1027 10.1038/s41467-018-03399-2 [DOI] [PMC free article] [PubMed] [Google Scholar]
- Rota G, Handjaras G, Sitaram R, Birbaumer N, Dogil G, 2011. Reorganization of functional and effective connectivity during real-time fMRI-BCI modulation of prosody processing. Brain Lang. 117, 123–132. 10.1016/j.bandl.2010.07.008 [DOI] [PubMed] [Google Scholar]
- Rotshtein P, Malach R, Hadar U, Graif M, Hendler T, 2001. Feeling or Features: Different Sensitivity to Emotion in High-Order Visual Cortex and Amygdala. Neuron 32, 747–757. 10.1016/S0896-6273(01)00513-X [DOI] [PubMed] [Google Scholar]
- Sabatinelli D, Lang PJ, Bradley MM, Costa VD, Keil A, 2009. The Timing of Emotional Discrimination in Human Amygdala and Ventral Visual Cortex. J. Neurosci 29, 14864–14868. 10.1523/JNEUROSCI.3278-09.2009 [DOI] [PMC free article] [PubMed] [Google Scholar]
- Said CP, Moore CD, Engell AD, Todorov A, Haxby JV, 2010. Distributed representations of dynamic facial expressions in the superior temporal sulcus. J. Vis 10, 11–11. 10.1167/10.5.11 [DOI] [PMC free article] [PubMed] [Google Scholar]
- Schupp HT, Stockburger J, Codispoti M, Jungh??fer M, Weike AI, Hamm AO, 2006. Stimulus novelty and emotion perception: the near absence of habituation in the visual cortex. Neuroreport 17, 365–369. 10.1097/01.wnr.0000203355.88061.c6 [DOI] [PubMed] [Google Scholar]
- Shamay-Tsoory SG, Aharon-Peretz J, Perry D, 2009. Two systems for empathy: a double dissociation between emotional and cognitive empathy in inferior frontal gyrus versus ventromedial prefrontal lesions. Brain 132, 617–627. 10.1093/brain/awn279 [DOI] [PubMed] [Google Scholar]
- Shaw P, Kabani NJ, Lerch JP, Eckstrand K, Lenroot R, Gogtay N, Greenstein D, Clasen L, Evans A, Rapoport JL, Giedd JN, Wise SP, 2008. Neurodevelopmental Trajectories of the Human Cerebral Cortex. J. Neurosci 28, 3586–3594. 10.1523/JNEUROSCI.5309-07.2008 [DOI] [PMC free article] [PubMed] [Google Scholar]
- Sisk CL, Foster DL, 2004. The neural basis of puberty and adolescence. Nat. Neurosci 7, 1040–1047. 10.1038/nn1326 [DOI] [PubMed] [Google Scholar]
- Stuhrmann A, Suslow T, Dannlowski U, 2011. Facial emotion processing in major depression: a systematic review of neuroimaging findings. Biol. Mood Anxiety Disord 1, 10 10.1186/2045-5380-1-10 [DOI] [PMC free article] [PubMed] [Google Scholar]
- Thomas KM, Drevets WC, Whalen PJ, Eccard CH, Dahl RE, Ryan ND, Casey BJ, 2001. Amygdala Response to Facial Expressions in Children and Adults. Biol. Psychiatry 49, 309–316. 10.1016/S0006-3223(00)01066-0 [DOI] [PubMed] [Google Scholar]
- Thomas LA, De Bellis MD, Graham R, LaBar KS, 2007. Development of emotional facial recognition in late childhood and adolescence. Dev. Sci 10, 547–558. 10.1111/j.1467-7687.2007.00614.x [DOI] [PubMed] [Google Scholar]
- Todd RM, Evans JW, Morris D, Lewis MD, Taylor MJ, 2011. The changing face of emotion: age-related patterns of amygdala activation to salient faces. Soc. Cogn. Affect. Neurosci 6, 12–23. 10.1093/scan/nsq007 [DOI] [PMC free article] [PubMed] [Google Scholar]
- Tsujimoto S, 2008. The Prefrontal Cortex: Functional Neural Development During Early Childhood. Neuroscientist 14, 345–358. 10.1177/1073858408316002 [DOI] [PubMed] [Google Scholar]
- Zaki J, Ochsner K, 2009. The need for a cognitive neuroscience of naturalistic social cognition, in: Annals of the New York Academy of Sciences. 10.1111/j.1749-6632.2009.04601.x [DOI] [PMC free article] [PubMed]
- Zürcher NR, Donnelly N, Rogier O, Russo B, Hippolyte L, Hadwin J, Lemonnier E, Hadjikhani N, 2013. It’s All in the Eyes: Subcortical and Cortical Activation during Grotesqueness Perception in Autism. PLoS One 8, e54313 10.1371/journal.pone.0054313 [DOI] [PMC free article] [PubMed] [Google Scholar]
Associated Data
This section collects any data citations, data availability statements, or supplementary materials included in this article.