

Abstract
Anthropogenic influences on global processes and climatic conditions are increasingly affecting ecosystems throughout the world.
Hawaii Island’s native ecosystems are well studied and local long‐term climatic trends well documented, making these ecosystems ideal for evaluating how native taxa may respond to a warming environment.
This study documents adaptive divergence of populations of a Hawaiian picture‐winged Drosophila, D. sproati, that are separated by only 7 km and 365 m in elevation.
Representative laboratory populations show divergent behavioral and physiological responses to an experimental low‐intensity increase in ambient temperature during maturation. The significant interaction of source population by temperature treatment for behavioral and physiological measurements indicates differential adaptation to temperature for the two populations.
Significant differences in gene expression among males were mostly explained by the source population, with eleven genes in males also showing a significant interaction of source population by temperature treatment.
The combined behavior, physiology, and gene expression differences between populations illustrate the potential for local adaptation to occur over a fine spatial scale and exemplify nuanced response to climate change.
Keywords: climate change, gene expression, Hawaiian Drosophila, local adaptation, population divergence
1. INTRODUCTION
Global climatic changes ascribed to anthropogenic activities are causing increasing and likely irreversible changes to ecological systems, including those that have largely escaped the impacts of land conversion, invasive species, and other more direct forms of human disturbances (Barnosky et al., 2012; Lister & Garcia, 2018). Understanding how native species and ecosystems are responding to these changes is critical for mitigating the effects of changes in both natural and managed systems (Birkett, Blackburn, & Menéndez, 2018, Dahlhoff & Rank, 2000, Hoffmann & Sgrò 2011). Accordingly, anticipating these ecological responses is an urgent area of research for ecologists, with implications that extend beyond conservation into agriculture, ecosystem services, and other diverse topics (Cardinale et al., 2012).
The Hawaiian archipelago is a classic model system for the study of ecological and evolutionary processes, particularly those related to speciation, biogeography, and ecosystem change (Carson & Clague, 1995; Vitousek, 2004). The high islands of this volcanic archipelago contain steep environmental gradients over short geographical distances that result in highly heterogeneous landscapes (Wilson, 1963). This natural combination of isolating forces, diverse habitat, and variable biotic communities, which together encourage population differentiation and local adaptation, is thought to account for the large number of adaptive radiations and endemic species found within the archipelago (Gillespie & Roderick, 2002; Price & Clague 2002). These native species and ecosystems may be particularly vulnerable to global climate change due to the relatively small natural habitat patches and population sizes, negative impacts from invasive species, and dramatic habitat degradation, fragmentation, and loss (Hobbelen, Samuel, Foote, Tango, & LaPointe, 2013; Uy, LeDuc, Ganote, & Price, 2015). As evidence of this, numerous recent extinctions have occurred, and many of the remaining native species are increasingly confined to small preserves or found only at higher elevations (Benning, LaPointe, Atkinson, & Vitousek, 2002; Howarth & Gagné, 2012).
This archipelago is also closely associated with long‐term measurement of global atmospheric changes and the identification of the role of anthropogenic activities as a driving force (Benning et al., 2002; Manning, Nisbet, Keeling, & Liss, 2011). The 50 + year continuous monitoring of atmospheric CO2 levels on the Mauna Loa volcano of Hawaii's Big Island documents a historically unprecedented increase, known as the “Keeling Curve,” which is now referenced throughout the world as evidence of human‐induced climate change (Giambelluca, Diaz, & Luke, 2008; Keeling, Whorf, Wahlen, & Vanderplicht, 1995). The environmental implications of atmospheric accumulation of greenhouse gasses are well documented both globally and in Hawaii, and the latter has experienced a steady increase in air temperature and a 15% decrease in rainfall over the last few decades (Chu & Chen, 2005; Giambelluca et al., 2008). Atmospheric models project a further 1.4–5.8°C increase in global temperature by 2,100, with an accelerated increase at higher elevations and increasingly volatile weather patterns as a result (Lemke et al., 2007).
The Hawaiian Drosophila are a well‐studied part of these island ecosystems and have been used as indicators of biogeographic history, habitat disturbances, and other environmental changes (Eldon, Price, Magnacca, & Price, 2013; Price & Muir, 2008). Most of the approximately 800 species in this group appear to have radiated from a single colonization event approximately 25 million years ago, and 120 of these species belong to the large, charismatic, and well‐studied picture‐winged group (Katoh, Izumitani, Yamashita, & Watada, 2016; O'Grady et al., 2011). Twelve picture‐winged Drosophila species are currently listed as endangered or threatened, and monitoring over the last 30 years has documented sharp declines and reduced distributions for many of the nonlisted species (Richardson, 2006). These Drosophila, like many tropical ectotherms, are thought to be particularly vulnerable to climatic changes due to their narrow physiological tolerance windows (Saxon, O'Brien, & Bridle, 2018), as well as limited habitat ranges and highly specific native host plant associations (Magnacca, Foote, & O'Grady, 2008; Magnacca & Price, 2015).
Understanding how species respond to climate change is a pertinent theoretical question and an immediate conservation priority (Hoffmann & Sgrò 2011; Kellermann et al., 2009; Porcelli, Gaston, Butlin, & Snook, 2017). A recent study of two Hawaii Island endemic picture‐winged Drosophila, the rare D. silvestris and the more ubiquitous D. sproati, found strong species‐level differences in temperature tolerance (Uy et al., 2015), and previously observed clinal patterns of genetic differentiation in D. silvestris (Craddock & Carson 1989) suggest that temperature may also be driving adaptive population divergence. This current study continues such investigations of D. sproati by testing for adaptive divergence between the highest and lowest elevation populations within a fragmented portion of wet forest habitat on the east side of Hawaii Island. Wild‐caught individuals from each site were assessed for genetic differentiation at putative neutral loci and used to found representative laboratory populations that were tested for differences in behavior, physiology, and gene expression, following a nonfatal temperature increase during maturation. This experimental design mimics the predicted increase in ambient temperatures in association with climate change (Giambelluca et al., 2008), and the mixed‐methods approach has the potential to offer a comprehensive picture of adaptive population divergence (Flatt, 2016; Hoffmann, Sørensen, & Loeschcke, 2003).
2. MATERIALS AND METHODS
2.1. Site description
This study focuses on populations of D. sproati in the convergence zone of the Mauna Loa and Mauna Kea volcanoes on the east side of Hawaii Island. A series of lava flows in this region ending in the 1800 s created islands of montane wet forest habitat, known as “kipuka,” surrounded by young substrate that supports only pioneer species. D. sproati, a relatively common picture‐winged Drosophila endemic to montane wet forests around the island, can only be found in this region within kipuka between the elevations of 1,260 m and 1625 m (J. Eldon, pers. obs.). While less mobile species, such as the endemic Tetragnatha spiders, have been found to display neutral population differentiation among these kipukas, neutral differentiation among more mobile species has not been well studied in this habitat mosaic and only rarely at this scale (Vandergast, Gillespie, & Roderick, 2004), and potential for adaptive divergence is an underexplored area of investigation. Accordingly, this study compares D. sproati from the lowest elevation kipuka (“Low” at 1,260 m) where the species can be found in this region against those from the highest (“High” at 1625 m), which is approximately 7 km upslope. The suitability of the two sites as representing mature wet forest habitat was quantified through a surface cover and tree/tree fern surveys conducted at the center and edge of each kipuka. The presence of a climatic gradient corresponding to elevation was assessed through concurrent measurement of temperature and humidity during a 2‐week period using HOBO Pro v2 data loggers placed under shaded covers at the center and edge of each kipuka.
2.2. Collection and maintenance of fly stocks
A total of 35 and 32 adult D. sproati were captured from the center of each kipuka using fermented banana bait. The flies were immediately transferred to one‐gallon breeding jars kept in a climate‐controlled laboratory and maintained at 18°C, the standard rearing temperature for picture‐winged Drosophila (Uy et al., 2015, Table 1). Each jar contained a layer of sand to regulate moisture and vials containing a standard Hawaiian Drosophila agar food medium with a tissue soaked in pulverized rotten bark from Cheirodendron trigynum, the larval host plant for this species (Droney, 1992; Magnacca et al., 2008; Price & Boake, 1995). These vials were replaced every 3–4 days, and those that contained larvae were transferred to 1‐gallon pupation jars that contained a layer of slightly larger sand. Adults that emerged within these jars were transferred to new breeding jars. These laboratory populations were maintained in this controlled environment at a concentration of approximately 250 interbreeding adults for five generations. The wild‐caught founders were placed in 95% EtOH within 12 hr of dying and stored at −20°C for subsequent DNA extraction and analysis.
Table 1.
Number of flies or mating groups sampled for each analysis. Wild‐caught flies were used to found the laboratory populations and were sequenced at the COII and YP1 gene regions. The number of analyzed sequences is given in Table S2. All other flies came from the sixth generation of the representative laboratory populations and were assessed during their fourth week of maturity
| Analysis | Sex | Low elevation | High elevation | ||
|---|---|---|---|---|---|
| 18°C | 24°C | 18°C | 24°C | ||
| Wild‐caught | # Male | 13 | 12 | ||
| # Female | 22 | 20 | |||
| Physiology—Heat knockdown | # Male | 67 | 35 | 28 | 12 |
| # Female | 60 | 53 | 28 | 30 | |
| Physiology—Chill coma recovery | # Male | 33 | 32 | 19 | 13 |
| # Female | 40 | 51 | 30 | 36 | |
| Behavior | # Groups | 22 | 24 | 16 | 14 |
| Gene expression | # Male | 7 | 7 | 5 | 5 |
| # Female | 6 | 5 | 6 | 3 | |
2.3. Experimental temperature treatment
Flies from the sixth laboratory generation were isolated by sex within 24 hr of emergence. Half of each population/sex group were maintained at 18°C for the first week of maturation, moved to a 24°C climate‐controlled laboratory for the second week, and returned to 18°C for the third week, while the other half matured at a constant 18°C (Figure 1). Initial pilot studies had found that one week at 24°C did not result in heat‐induced sterilization or fatality for D. sproati (J. Eldon, unpublished data). Subsequent analyses were performed on adult flies between 3 and 4 weeks old from each population/sex/temperature group, with different flies used for each physiological and behavioral analysis.
Figure 1.
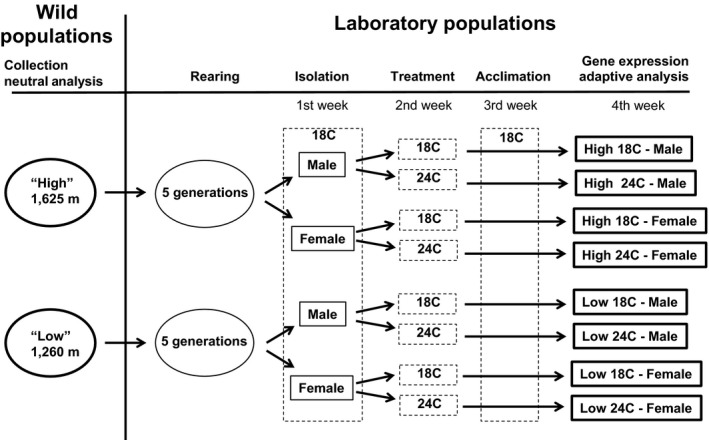
A schematic of the experimental design, showing the Drosophila sproati populations, treatments, and analyses. “Neutral analysis” consisted of sequence analysis of putatively neutral regions within the COII and YP1 genes. “Adaptive analysis” consisted of measures of heat knockdown resistance and cold chill coma recovery, activity levels and courtship displays, and microarray analysis of differential gene expression
2.4. Behavioral analysis
Behavioral analysis focused on overall activity levels and male social displays, which are similar to the closely related D. grimshawi and described in Table S1 (Ringo & Hodosh, 1978). These measures are common assessments of species and population divergence in Drosophila, and thermal stress has been found to inhibit courtship behavior in some species (Patton & Krebs, 2001). Drosophila sproati is thought to form leks or collapsed leks during mating; thus, behavioral analysis was conducted on groups consisting of three virgin male and three virgin female flies (Droney, 1992). The numbers and types of independent male displays were recorded during six one‐minute observational periods at 15‐ to 20‐min intervals between the hours of 9:30 a.m. and 12:30 p.m. The number of stationary flies per group was recorded during each observational period as a measure of overall activity level.
2.5. Physiological analysis
The physiological analysis measured the response of each population/sex/temperature group to subsequent high‐intensity heat and cold shocks. Heat knockdown resistance was measured by exposing flies to 32.5°C and recording the time until knockdown at half hour intervals. Cold chill coma recovery was measured by chilling flies at 2°C for 1.5 hr to induce a comatose state, then returning them to 18°C and recording the number of minutes until each fly righted themselves. These two tests are conventional measures of thermal tolerance in Drosophila and have been shown to be heritable and ecologically relevant traits (Hoffmann, Anderson, & Hallas, 2002; Norry, Scannapieco, Sambucetti, Bertoli, & Loeschcke, 2008). An initial pilot study was performed to determine appropriate knockdown and chill coma temperatures for D. sproati (J. Eldon, unpublished data).
2.6. Data analysis and statistics
A two‐way analysis of variance (ANOVA) was used to assess the significance of source population, temperature treatment, and the interaction of the two factors on the behavioral and physiological measures, using the statistical program MiniTab version 15, with all data first tested for normality. For response variables that exhibited significant block effects due to differences among the weeks of the study, the residuals from an analysis of variance for the block effect were used in subsequent analysis of source population and treatment effects. The ANOVA analyses were performed on all response variables (or the residuals) in a two‐way interaction model with source population and temperature treatment as the main factors considered random variables (i.e., main effects mean squares were tested with the interaction mean square as the error term). Pairwise significance testing was performed among all population/sex/temperature groups for each measure using Tukey's multiple comparison tests and a significance threshold of p < 0.05.
2.7. DNA extraction and analysis of neutral loci
DNA was extracted from all wild‐caught flies using a nondestructive soaking technique specially developed for arthropods (Rowley et al., 2007) and subsequently purified with a Qiagen DNeasy kit (Qiagen, Hilden, Germany) and stored at −20°C. Between‐population genetic differentiation was measured using the mitochondrial cytochrome oxidase II gene (COII) and nuclear yolk protein I gene (YPI) as described in Eldon et al., 2013. These two genes showed no significant differentiation within D. sproati sampled among multiple locations within the large eastern wet forest region of Hawaii Island that encompasses the study site (Eldon et al., 2013, unpublished data). Sequencher version 4.9 was used to visually aligned and edit sequences and Arlequin version 3.1 was used to perform all statistical analysis of these two gene regions (Excoffier, Laval, & Schneider, 2005).
2.8. RNA extraction and gene expression analysis
A total of 44 flies (three to seven per population/sex/temperature treatment group) were subjected to microarray‐based gene expression analysis upon completion of their three‐week maturation period (Figure 1, Table 1). Individual flies were mechanically homogenized for total RNA extraction using a NucleoSpin® RNA II Kit (Macherey Nagel). The RNA was normalized to a concentration of 30 ng/μl and submitted to the John A. Burns School of Medicine at the University of Hawaii at Manoa core genetics facility for microarray processing. Briefly, an Agilent Technologies low‐input quickAmp Labeling kit was used to reverse transcribe RNA into cDNA and amplify it in the presence of dye‐labeled nucleotides (Cyanine‐3 CTP). Labeled samples were hybridized at 65°C overnight on a commercially prepared Agilent Technologies (Santa Clara, CA) microarray slide, with males and females loaded on to separate slides. Each microarray contained 14,850 probes, of which 14,766 produced signals and represented 14,319 D. grimshawi genes. After hybridization, microarray slides were washed at room temperature (37°C) for 1 min each using Agilent wash buffers, followed by slide scans using Agilent scanner G2565CA. Adherent dye intensities were recorded using Agilent Technologies Feature extraction software. Statistical differences in log2 gene expression were measured using a two‐factor ANOVA with main factors source population and temperature treatment and a factor for their interaction. Data were analyzed separately by sex. In cases where the Agilent chip contained multiple probes per gene (828 probes for 383 genes), the probe expression values were averaged across each gene. To adjust for multiple tests, a Benjamini–Hochberg false discovery rate (BH‐FDR) was applied to ANOVA p‐values using a statistical significance threshold of q < 0.05 implemented in the R package “stats” v. 3.1.1.
2.9. Gene annotation and functional classification
Differentially expressed genes (DEGs) were assigned to gene ontology (GO) categories and tested for overrepresentation utilizing Protein ANalysis THrough Evolutionary Relationships (PANTHER, Thomas et al., 2003, version 13.1 released 2018‐02‐03; overrepresentation test function released 20171205; GO Ontology database released 2018–05–2). The analyzed gene lists were constructed by matching differentially expressed D. sproati genes (tracked by D. grimshawi FlyBase “Fbgn” identifiers, Appendix S1) to D. melanogaster gene orthologs and gene symbols procured from the FlyBase.org file “gene_orthologs_fb_2016_03.tsv.” PANTHER's built‐in Fisher's exact test with FDR multiple test corrections was used to assess statistical significance of overrepresented GO‐Slim categories, applying a threshold cutoff of q < 0.05 and D. melanogaster as a background genome. To permit direct comparison to Drosophila findings by Sørensen, Nielsen, Kruhøffer, Justesen, & Loeschcke, 2005 and PANTHER results, additional pathway enrichment tests were performed in DAVID (Huang, Sherman, & Lempicki, 2009a; Huang, Sherman, & Lempicki, 2009b; v6.8) using the Functional Annotation Tool and Pathway Viewer with built‐in BH‐FDR tests. D. melanogaster was again used as a background genome. Additional DEG annotation was performed by procuring gene function information from FlyBase's heat‐shock protein and cognate gene lists and the “jump to gene” query tool, and through peer‐reviewed literature searches for thermal adaptation genes.
3. RESULTS
3.1. Site descriptions
Mature wet forest tree and tree fern species were found at the center of each kipuka, with smaller individuals of the same species found at the edges prior to the sharp transition to the surrounding recent lava flows. Concurrent temperature measurement during December 2009 identified the low‐elevation site as having higher minimum, maximum, and daytime mean temperatures (Table 2).
Table 2.
Ecological and climatic description of the two study locations. Trees and tree ferns over 2 m in height or 1 cm DBH were surveyed in four 3 m radius plots at the center and edge of each kipuka. Temperature was measured concurrently from December 16–29, 2009 with measurements made at 5‐min intervals at 2 m off the ground under artificial shade. The daytime means were calculated from 6 a.m. to 6 p.m.
| Low | High | |||
|---|---|---|---|---|
| Center | Edge | Center | Edge | |
| Site description | ||||
| Elevation | 1,260 | 1625 | ||
| Forest reserve | Hilo Watershed | Upper Waiakea | ||
| GPS location | N 19.677613 | N 19.665613 | ||
| W −155.290150 | W −155.350996 | |||
| Indicator tree and fern species | ||||
| Total count | ||||
| Metrosideros polymorpha | 19 | 70 | 11 | 43 |
| Cheirodendron trigynum | 14 | 4 | 4 | 10 |
| Cibotium spp. | 40 | 15 | 39 | 3 |
| Mean DBH | ||||
| Metrosideros polymorpha | 10.0 | 7.0 | 26.2 | 9.9 |
| Cheirodendron trigynum | 8.6 | 4.5 | 11.2 | 3.7 |
| Temperature (Dec 16–29, 2009) | ||||
| Daytime Mean | 12.4 | 14.5 | 11.0 | 12.2 |
| Observed Maximum | 18.2 | 24.9 | 16.3 | 18.6 |
| Observed Minimum | 4.0 | 4.3 | 3.4 | 3.3 |
3.2. Behavior
The four representative D. sproati laboratory groups (low‐ vs. high‐elevation source population, 18°C vs. 24°C maturation temperature) showed multiple significant differences in behavior that were explained by source population or the interaction between source population and temperature treatment (Figure 2, Table 3). The two‐way ANOVA identified source population alone as accounting for the significant difference in overall activity levels and the frequency of the male‐only abdomen drag display. The interaction of source population and temperature treatment explained significant differences in four behavioral measures: the percent of observations with at least one male display, the total number of male displays per social group, the numbers of types of male displays, and the number of “approach” displays that initiates courtship. Pairwise population comparisons through Tukey tests identified the two high‐elevation populations (18°C and 24°C) to be the primary source of these differences, with the flies that had experienced 24°C during maturation scoring significantly lower on many of the behavioral measures, including overall activity levels and the male‐only abdomen drag display.
Figure 2.
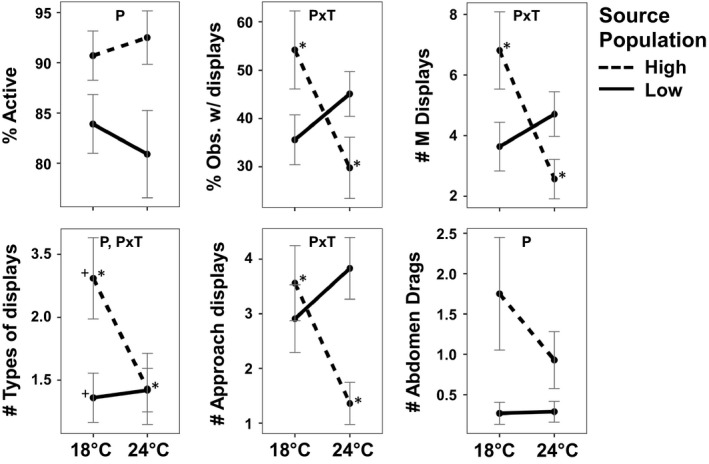
Means and standard errors of behavioral measures of D. sproati laboratory groups from low‐ and high‐elevation populations maintained at 18°C or exposed to 24°C during maturation. Significant two‐way ANOVA results are noted in each panel as P (source population), T (temperature treatment), and P T (interaction). Significant differences between paired groups, as assessed through Tukey tests (p < 0.05), are indicated by matching symbols (* or +). M = Male‐only display; M:F = Male approaching female display
Table 3.
Summary statistics and two‐way ANOVA results for select physiological and behavioral measures of D. sproati laboratory groups from low‐ and high‐elevation populations maintained at 18°C or exposed to 24°C during maturation. Statistically significant results (p‐value <0.05) are bolded. All tests had 1 degree of freedom. The unit of the male displays is mean total number of displays per courtship group over the six observation periods
| Measure | Sex | Mean | Standard error | ANOVA | ||||||||||||
|---|---|---|---|---|---|---|---|---|---|---|---|---|---|---|---|---|
| Low elevation | High elevation | Low elevation | High elevation | Source population | Temperature treatment | Interaction | ||||||||||
| 18°C | 24°C | 18°C | 24°C | 18°C | 24°C | 18°C | 24°C | F | p‐value | F | p‐value | F | p‐value | |||
| Physiological | ||||||||||||||||
| Heat Knockdown (hr) | M | 3.01 | 1.80 | 2.52 | 2.75 | 0.22 | 0.25 | 0.28 | 0.54 | 0.49 | 0.486 | 2.19 | 0.141 | 4.76 | 0.031 | |
| F | 3.42 | 2.83 | 3.59 | 4.90 | 0.20 | 0.27 | 0.29 | 0.39 | 15.3 | 0.000 | 1.59 | 0.201 | 34.4 | 0.001 | ||
| Chill coma recovery (min) | M | 18.38 | 19.77 | 16.21 | 19.38 | 0.87 | 1.00 | 1.29 | 1.42 | 1.23 | 0.27 | 3.95 | 0.049 | 0.61 | 0.438 | |
| F | 19.7 | 19.68 | 19.21 | 17.45 | 1.24 | 0.69 | 0.95 | 0.71 | 2.21 | 0.139 | 0.95 | 0.332 | 0.90 | 0.345 | ||
| Behavioral | ||||||||||||||||
| % Active | 83.9 | 80.9 | 90.7 | 92.5 | 2.92 | 4.34 | 2.45 | 2.66 | 6.81 | 0.011 | 0.03 | 0.873 | 0.46 | 0.501 | ||
| % Obs with ≥1 display | 35.6 | 45.1 | 54.2 | 29.8 | 5.17 | 4.63 | 8.08 | 6.32 | 0.07 | 0.787 | 1.61 | 0.208 | 8.39 | 0.005 | ||
| # Male displays | 3.64 | 4.71 | 6.81 | 2.57 | 0.80 | 0.74 | 1.28 | 0.65 | 0.07 | 0.788 | 2.70 | 0.105 | 8.90 | 0.004 | ||
| # Types of displays | 1.36 | 1.42 | 2.31 | 1.43 | 0.20 | 0.17 | 0.32 | 0.28 | 4.31 | 0.042 | 3.22 | 0.077 | 4.10 | 0.047 | ||
| # Abdomen drag (M) | 0.27 | 0.29 | 1.75 | 0.93 | 0.14 | 0.13 | 0.70 | 0.35 | 9.41 | 0.003 | 1.22 | 0.272 | 1.35 | 0.249 | ||
| # Approach (M:F) | 2.91 | 3.83 | 3.56 | 1.36 | 0.62 | 0.56 | 0.69 | 0.39 | 3.09 | 0.083 | 1.12 | 0.294 | 7.76 | 0.007 | ||
3.3. Physiology
For heat knockdown resistance, the ANOVA analysis identified the interaction of source population and temperature treatment to be significant for both male and female flies, and as well as population alone for females (Figure 3). In the low‐elevation populations, both male and female flies exposed to 24°C during maturation were less resistant to subsequent heat shock than those maintained at 18°C, while the opposite was true for those from the high‐elevation population. The Tukey test of pairwise differences found that the only significant difference among males for knockdown resistance was between the 18°C and 24°C low‐elevation populations, while for females the 24°C high‐elevation population was significantly different from the other three female groups. For cold chill coma recovery, the ANOVA analysis identified temperature treatment alone was found to be significant in males, with flies exposed 24°C during maturation taking on average longer to recover than flies maintained at 18°C (Table 3, Figure 3).
Figure 3.
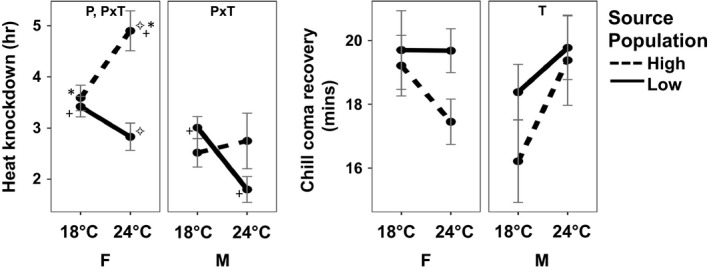
Mean and standard error for heat knockdown resistance and cold chill coma recovery of male (M) and female (F) D. sproati from laboratory groups founded from low‐ and high‐elevation populations and exposed to 18°C or 24°C during maturation. Significant two‐way ANOVA results are noted in panels as P (source population), T (temperature treatment), and P T (interaction). Significant differences between paired groups, as assessed through Tukey tests (p < 0.05), are indicated by matching symbols
3.4. Population genetic analysis
The two populations were not significantly differentiated (p > 0.05) at either the COII or YP1 gene as measured by pairwise F ST (COII = 0.001, YP1 = 0.043) or by an exact test of population differentiation (COII = 0.158, YP1 = 0.084). Internal characteristics of the two populations were similar in both loci (Table S2).
3.5. Differential gene expression
Significant differences in gene expression, explained by source population or the interaction between source population and temperature treatment, were observed for 1730 (12.1% of 14,319) genes in the male group and for 96 (0.7% of 14,319) genes in the female group (Appendix S1). Females and males shared 39 of these DEGs in common. The main factor population explained 99% (1,720) of the male and 100% of the female DEGs. Of the 1,720 male DEGs significant for population, 671 and 1,032 were log2 fold upregulated in the low‐ and high‐elevation population groups, respectively. The remaining 17 genes showed patterns of expression consistent with the interaction of population and temperature treatment (see below), despite nonsignificance for that term. Although no significant changes in gene expression were solely attributed to the main factor temperature treatment (males or females), 11 genes in males were significant for the population and temperature treatment interaction term (Figure 4, Table 4; one gene also significant for population in males). In all of these cases, male flies from the low‐elevation population responded to the elevated temperature treatment by down‐regulating gene expression, while males from the high‐elevation population responded to the elevated temperature treatment by up‐regulating gene expression. Due to the limited difference between females across treatment contrasts, and because their expression patterns followed male counterparts across 38 of the 39 genes in common, subsequent analyses are focused on interpretation of the male DEG data set.
Figure 4.
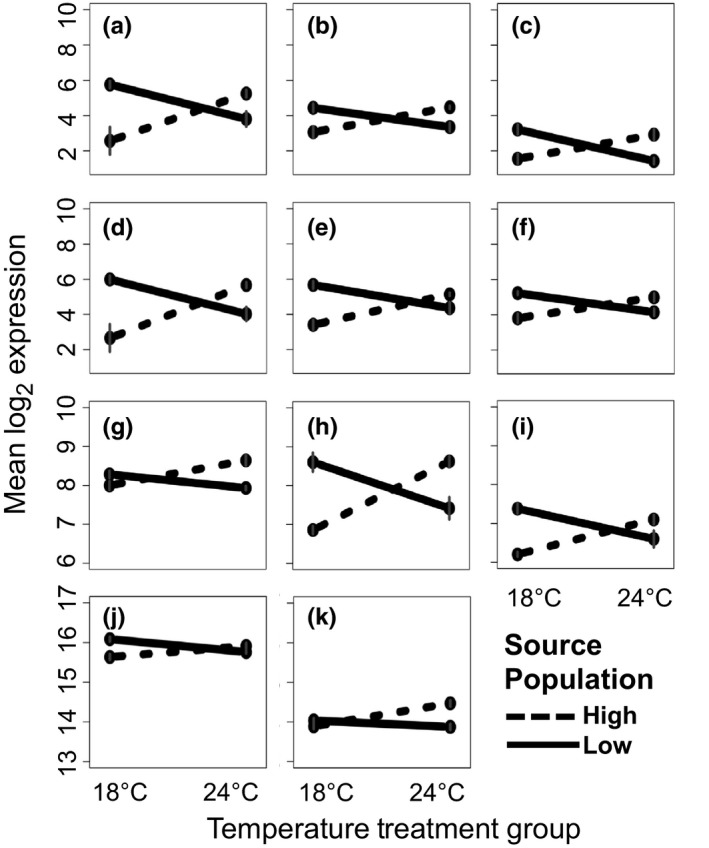
Interaction plots for 11 genes differentially expressed in low‐ and high‐elevation populations of male Drosophila sproati and explained by the interaction of source population and temperature treatment. FlyBase IDs and brief functional descriptions with corresponding D. melanogaster gene ortholog symbols or functional domain annotations (if available) are as follows: (a) FBgn0130876; (b) FBgn0117568 (CG31784); (c) FBgn0119956 (GH12477, contains domain cytochrome b561/ferric reductase transmembrane); (d) FBgn0132691; (e) FBgn0123024 (transcriptional co‐factor, nab); (f) FBgn0123345 (retinin‐like protein); (g) FBgn0120752 (CG17005); (h) FBgn0128660 (cuticle protein, Cpr49Ad); (i) FBgn0129493 (transcription factor, bap); (j) FBgn0126885 (contains succinate dehydrogenase, subunit C, mitochondrial protein, SdhC, domain); (k) FBgn0119942 (contains hypoxia‐induced protein domain). (a) and (d) contain a palmitoyltransferase, DHHC domain and match to multiple D. melanogaster orthologs (CG13029, CG17195–98, CG4956). Error bars are shown in gray
Table 4.
List of differentially expressed genes in male Drosophila sproati populations significant for the interaction of source population and temperature treatment (top row only), or significant for source population only and identified as responsive to heat stress in one or more comparison studies. Genes identified as heat responsive in two or more comparison studies are indicated by bold font
| ANOVA Factor | Comparative study | Species | Gene symbol |
|---|---|---|---|
| Population x Temperature treatment | n/a | D. sproati | bap, CG31784, GH12477, CG17005, Cpr49Ad, CG13029a, CG17195–8a, CG4956a, FBgn0120752 (no gene symbol), CG9921b, nab, SdhCc |
| Population | Leemans et al. (2000) | D. melanogaster | DNAJ−1, Dlc90F, Eip71CD, Gpdh, HSC70–3, HSP23, HSP83, ImpL3, Shark, ovo |
| Population | Sørensen et al. (2005), Table 3d | D. melanogaster | aay, Cyp4ac2, CG2254, CG3244, CG5023, CG5804, CG5966, CG6426, CG7916, CG8774, CG9259, CG10383, CG10513, CG10514, CG10680, CG16762, CG16898, CG16985, CG17124, CG18585, Eip71CD, GstD2, GstD4, GstD5, hgo, HSP23, HSP83, ImpL3, Pepck, Thor (two paralogs), Trxr−1 |
| Population | Sørensen et al. (2005), Table 4e | D. melanogaster | Cyp4ac2, DNAJ‐like−1 (DNAJ−1), CG1628, CG4797, CG5646, CG15408, GstE1, GstD2, GstD5, Hsc70Cb, HSP83, PEK, raw, Vha26 |
| Population | Uy et al. (2015) | D. sproati | Arl5, CG4797, CG8665, CG14694, CG31975, fusl, fw, Ilp8, Prat2 |
| Population | Uy et al. (2015) | D. silvestris | Alp4, ArfGAP3, Atg1, betaggt‐I, capu, CG5853, CG5958, CG10178, CG10621, CG11123, CG11529, CG11601, CG11854, CG12909, CG12975, CG15408, CG31431, CG32191, DCP1, Droj2, GIIIspla2, KCNQ, lft, lolal, mRpL17, mRpS6, MTF−1, Nbr, net, Pld, prc, RpLP0‐like, swi2 |
| Population | Uy et al. (2015) | D. sproati and silvestris | baf, CG11267, CG13748, CG45782, fok, Hipk, HSP23, HSP83, MFS14, Pat1, Pdk, PEK, Slc45–1 |
The Drosophila grimshawi FlyBase gene identifiers FBgn0130876 and FBgn0132691 match to the same multiple gene symbols and have multiple D. melanogaster orthologs.
Also significant for factor population.
Associated with mitochondrial function: blp (Roy et al. 2012), Hsc20, SdhC (Uhrigshardt et al., 2010), and CG11267.
3.6. Gene annotation and functional classification
FlyBase's high level of annotation permitted assignment of D. melanogaster gene symbols to 84% (566 of 671) and 93% (964 of 1,032) of the DEGs upregulated in the low‐ and high‐elevation population groups (males only). Based on these gene symbols, 471 and 777 DEGs were assigned to PANTHER GO category terms, after accounting for paralogs (i.e., duplicate genes) and genes with no mapping information. Allocations of these genes to each of the three major GO categories—molecular function, biological process, and cellular component—indicate a greater number and diversity of overrepresented GO terms (n = 36) in the high‐elevation relative to the low‐elevation population groups (n = 4) (Appendix S2). Several overrepresented GO terms were associated with energy, metabolism, and mitochondria. No statistically enriched pathways were identified through PANTHER analysis, but results for the 1,467 gene symbols recognized by DAVID indicate significant enrichment of 17 KEGG pathways (Table S3), with 8 and 9 overrepresented in low‐ and high‐elevation populations groups, respectively. Most of the overrepresented pathways relate to metabolism (e.g., tryptophan, propanoate, ether lipid, and xenobiotics). The most notable pathway was glutathione metabolism, overrepresented in high‐elevation population groups and associated with heat and cold tolerance pathways in D. melanogaster (MacMillan et al., 2016; Sørensen et al., 2005). Approximately 100 DEGs were identified as responsive to temperature stress in other studies (Table 4), along with 18 heat‐shock proteins and cognates (Table 5; some genes in common between tables). Annotations for the 11 DEGs significant for the interaction of source population and temperature treatment (Figure 4, Table 4, Appendix S1) indicate that two are involved in mitochondrial function, two are involved in transcriptional activity, one contains a hypoxia‐induced protein domain (per InterPro, also significant for source population), a cuticle protein, and five genes having unknown function at this point in time.
Table 5.
Heat‐shock protein family or cognate membership of 18 genes significant for the factor source population and differentially upregulated in low‐ or high‐elevation male Drosophila sproati population groups
| Heat‐shock protein family/cognates | High elevation | Low elevation |
|---|---|---|
| Small heat‐shock protein (HSP20) family | HSP23 (two copies) | — |
| HSP 40/J‐protein Gene Group | blpa, CG2790, CG17187, DnaJ−1, Droj2, Hsc20a, P58IPK | CG8476, CG8531 |
| HSP60 Gene Group, Chaperonins, Group I | CG11267a | HSP60B |
| HSP70 Superfamily | Hsc70Cb, HSC70–3 | CG2918 (atypical HSP70) |
| HSP90 Gene Group, Chaperones | HSP83 | — |
| Hsp100 Family | DnaK | — |
4. DISCUSSION
This integrated assessment of behavioral, physiological, population genetic, and gene expression measures indicates strong adaptive divergence between two populations of D. sproati at distributional extremes along a narrow 365 m elevation gradient. Despite these populations being separated by only 7 km and showing no significant population genetic structure, D. sproati males in laboratory populations exhibited opposing adaptive strategies in response to a slight increase in ambient temperature during maturation. Relative to the males from each elevation that matured at a constant 18°C, those from the low‐elevation population that were exposed to 24°C maintained normal levels of courtship but were physiologically more sensitive to subsequent high temperatures, while those from the high‐elevation population that were exposed to 24°C maintained normal heat‐shock resistance but displayed reduced courtship behavior. This divergent response among males was also shown through significant differences in gene expression attributed to the interaction of temperature and population, with the males in the two populations showed a uniformly opposite regulatory response to the low‐intensity temperature increase.
We found surprisingly high levels of behavioral and gene expression differentiation between the laboratory populations from the low‐ and high‐elevation sites irrespective of the temperature treatment. Flies descended from the high‐elevation site were generally more active than those from the low‐elevation site, and the males were more likely to perform a solitary pre‐courtship behavioral display. The males from the high‐elevation population site also demonstrated statistical overrepresentation of genes related to energy production and consumption, enzymatic activity, and gene regulation. In total, transcriptome profiles showed that nearly 12% of the functional genes targeted in the array were differentially expressed among males due to the source population, while none were associated with the temperature treatment alone and less than 0.1% were related to the interaction between the two factors.
Gene expression studies of temperature tolerance often assess short‐term responses to high‐intensity heat shocks (e.g., Leemans et al., 2000, Sørensen et al., 2005, Boardman, Mitchell, Terblanche, Jesper, & Sørensen, 2018), rather than long‐term responses to low‐intensity temperature differences. Both types of stress are associated with anthropogenic climate change and can drive adaptation, but it might be assumed that they would present radically different selective pressures and would induce distinct adaptive responses. However, we found that more than 100 of the DEGs significant for source population in this study were affected by heat shock in other Drosophila studies (Table 4). These include 13.5% of the 74 heat‐shock‐inducible genes in identified by Leemans et al., 2000 and 15.6% of the 199 heat‐responsive genes identified by Sørensen et al., 2005, both in D. melanogaster. Our data set also includes 20.1% of 106 DEGs identified within D. sproati subjected to a one‐hour treatment at 25°C, as compared to those at a controlled temperature of 16°C, and 18.3% of 246 DEGs found in D. silvestris after the same one‐hour, 25°C treatment (Table 4, Uy et al., 2015). That certain genes were differentially expressed across multiple Drosophila temperature treatment studies and between our low‐ and high‐elevation population groups suggests these genes have important roles in adaptation to thermal conditions.
The identification of HSPs and cognates differentially expressed between low‐ and high‐elevation populations and common to other temperature tolerance Drosophila studies may aid in pinpointing proteins with broad roles in climate adaptation. HSPs and their cognates are part of the protein quality system that assists in degradation of denatured or aggregated proteins and is mounted when organisms are exposed to environmental stressors, including oxidative, physical activity, heavy metals, and temperature (Sørensen, Kristensen, & Loeschcke, 2003). We found that genes HSP23 and HSP83 were differentially expressed in low‐and high‐elevation D. sproati populations, and heat‐shocked D. sproati (Uy et al., 2015 ), D. silvestris (Uy et al., 2015), and D. melanogaster (Leemans et al., 2000; Sørensen et al., 2005). Also notable were two DEGs belonging to the HSP70 superfamily that showed differential expression in heat‐shocked D. melanogaster: HSC70–3 (Leemans et al., 2000) and HSC70Cb (Sørensen et al., 2005). We also found nine HSP40/J‐domain proteins, which help HSP70s target to their substrates and control the ATPase cycle (Mayer & Bukau, 2005). A subset of the HSPs/cognates are associated with mitochondria function, including iron–sulfur cluster assembly, and were co‐expressed with male DEGs IscU, an iron–sulfur cluster assembly enzyme, and SdhC, a subunit of the mitochondrial complex (Uhrigshardt et al. 2010). In sum, HSPs and cognates that show commonality across studies may have particularly important roles in the ability of these Drosophila to cope with both short intense heat shocks and more subtle long‐term increases in ambient temperature, both of which might be required to adapt to changing climatic conditions.
In addition to HSPs, several non‐HSP genes associated with temperature tolerance in other studies were differentially expressed between the low‐ and high‐elevation male population groups. Most notably, Glutathione S transferase (GstD2 and GstD5) genes have been identified as heat resistance genes through multiple lines of research: QTL mapping, differential gene expression, and gene deletion approaches (Leemans et al., 2000, Sørensen et al., 2005, Takahashi, Okada, & Teramura, 2011, see Table 5, this study). The GstD gene is functionally involved in Glutathione metabolism, a pathway enriched in the higher elevation population and that appears to have a role in cold and heat tolerance (MacMillan et al., 2016; Sørensen et al., 2005). This pathway is also speculated to correspond to natural climatic fluctuations in plants (Milner, Reade, & Cobb, 2007). Also notable are genes in the mitogen‐activated protein kinase (MAPK) family, which are associated with general stress‐responses and are induced by heat, oxidative, and UV light stress (Takahashi et al., 2011). We found one MAPK gene, Extracellularly regulated kinase 7 (Erk7), to be differentially upregulated in the low‐elevation population. Clearly, temperature is only one of many selective pressures that drives adaptive divergence, and assessing ecological responses to anthropogenic climate change may benefit from broader surveys of gene expression responses under a variety of environmental conditions (e.g., humidity, UV exposure). Our findings add to the growing body of literature that identifies candidate genes and biochemical pathways that may underlie physiological adaptations to local environmental conditions.
The evidence for adaptive divergence between the low‐ and high‐elevation populations is supported by significant differences in behavior, physiology and gene expression, and no significant population genetic structure as estimated using the COII and YP1 genes in the wild‐caught flies collected from the source populations. Further studies are needed to determine whether the underlying DNA sequence divergence between populations result in the important differences in behavioral and physiological traits and thus represent rapid local adaptation following recent isolation. Differentiation in the presence of ongoing gene flow is known to occur in Drosophila species, including natural populations of D. melanogaster and D. buzzatii (Michalak et al., 2001; Sarup, Sørensen, Dimitrov, Barker, & Loeschcke, 2006). An additional, unexplored possibility is that population differences are explained by epigenetic inheritance, which would allow for plasticity over the long term. However, the populations were housed in the same common environment room for five generations before the initiation of this study, which should limit any epigenetic effects. Since D. sproati are large and able fliers, and the previous island‐wide study did not find genetic structuring within the larger wet forest region on the eastern side of Hawaii Island (Eldon et al., 2013), divergent adaptation amidst ongoing gene flow appears to be the most parsimonious explanation for our observations.
This observation of potential adaptive divergence without differentiation at putatively neutral loci could also be explained if the laboratory populations were not in fact representative of the wild populations. This might occur from strong founder effects or selective bottlenecks during the establishment of the laboratory populations, or from dramatic genetic drift during the five generations in the laboratory. However, a previous survey of wild‐caught mature females from multiple Hawaiian Drosophila species found 99.6% insemination across the group, and 100% among D. sproati females (Kambysellis & Craddock, 1991). Another survey found D. sproati females to have the highest potential fecundity of the sampled Hawaiian Drosophila species, having on average 65 ovarioles per fly and 1–3 mature eggs per ovarioles (Kambysellis & Heed, 1971). The likelihood of a strong founder effect from the 20 + founding females per laboratory population or dramatic divergent drift in the five subsequent generations is therefore low.
In this study, we found evidence that indicates there is adaptive divergence of populations of D. sproati separated by only 7 kilometers and 365 m in elevation, but no evidence of population differentiation at genes commonly used to estimate population genetic structure. This finding suggests that the ecological responses to climatic differences may occur at finer scales and be more complex than is often assumed. For example, a common assumption is that close proximity or a lack of differentiation at putatively neutral gene sequences indicates lack of adaptive population divergence, but clearly that is not the case in this study. This finding is relevant to conservation planning efforts, which often use the former assumptions to determine management units. In addition, rather than observing a simple range shift, where one population was more stressed and the other less so, this study found that the marginal D. sproati populations are making opposing adaptive trade‐offs under increasing ambient temperatures. Such results caution against the reliance on neutral loci alone or broad ecological assumptions when planning conservation actions. Instead, the findings of this study suggest that we need to adopt a more precise and integrated approach to investigating ecological responses to global climatic change and a more data‐driven approach to drawing conclusions, predictions, and management recommendations.
CONFLICT OF INTEREST
None declared.
AUTHORS’ CONTRIBUTIONS
JE collected and maintained the D. sproati population used in this study and conducted the behavioral, physiological, and neutral genetic analysis. DP and RB conducted the gene expression analysis. RB modeled and analyzed gene expression profiles and performed functional annotation. DP guided the project design and supervised all research activities. All authors contributed critically to the drafts and gave final approval for publication.
Supporting information
ACKNOWLEDGMENTS
Funding for this research was provided by the Gordon and Betty Moore Foundation and the National Science Foundation Center for Research Excellence in Science and Technology (Grant No. 1345247). Any opinions, findings, and conclusions or recommendations expressed in this material are those of the authors and do not necessarily reflect the views of the Moore Foundation or the National Science Foundation. The authors have no conflicts of interest in the publication of this work.
Eldon J, Bellinger MR, Price DK. Hawaiian picture‐winged Drosophila exhibit adaptive population divergence along a narrow climatic gradient on Hawaii Island. Ecol Evol. 2019;9:2436–2448. 10.1002/ece3.4844
DATA ACCESSIBILITY
The microarray data discussed in this publication have been deposited in NCBI's Gene Expression Omnibus and are accessible through GEO Series accession number GSE122959. The D. sproati collection locations are available through DRYAD (https://doi.org/10.5061/dryad.cn946) and the COII and YP1 sequence data through GenBank (COII: JX455020‐JX455050, YP1: JX454999‐JX455019).
REFERENCES
- Barnosky, A. D. , Hadly, E. A. , Bascompte, J. , Berlow, E. L. , Brown, J. H. , Fortelius, M. , … Martinez, N. D. (2012). Approaching a state shift in Earth's biosphere. Nature, 486(7401), 52–58. [DOI] [PubMed] [Google Scholar]
- Benning, T. L. , LaPointe, D. , Atkinson, C. T. , & Vitousek, P. M. (2002). Interactions of climate change with biological invasions and land use in the Hawaiian Islands: Modeling the fate of endemic birds using a geographic information system. Proceedings of the National Academy of Sciences, 99(22), 14246–14249. 10.1073/pnas.162372399 [DOI] [PMC free article] [PubMed] [Google Scholar]
- Birkett, A. J. , Blackburn, G. A. , & Menéndez, R. (2018). Linking species thermal tolerance to elevational range shifts in upland dung beetles. Ecography. 41, 1510‐1519. [Google Scholar]
- Boardman, L. , Mitchell, K. A. , Terblanche, J. S. , Jesper, G. , & Sørensen, J. G. (2018). A transcriptomics assessment of oxygen‐temperature interactions reveals novel candidate genes underlying variation in thermal tolerance and survival. Journal of Insect Physiology, 106(3), 179–188. [DOI] [PubMed] [Google Scholar]
- Cardinale, B. J. , Duffy, J. E. , Gonzalez, A. , Hooper, D. U. , Perrings, C. , Venail, P. , … Kinzig, A. P. (2012). Biodiversity loss and its impact on humanity. Nature, 486(7401), 59 10.1038/nature11148 [DOI] [PubMed] [Google Scholar]
- Carson, H. L. , & Clague, D. A. (1995). Geology and biogeography of the Hawaiian Islands In Wagner W. L., & Funk V. A. (Eds.), Hawaiian biogeography: Evolution on a hotspot archipelago (pp. 14–29). Washington, DC: Smithsonian Institution Press. [Google Scholar]
- Chu, P. S. , & Chen, H. (2005). Interannual and interdecadal rainfall variations in the Hawaiian Islands. Journal of Climate, 18(22), 4796–4813. 10.1175/JCLI3578.1 [DOI] [Google Scholar]
- Craddock, E. M. , & Carson, H. L. (1989). Chromosomal inversion patterning and population differentiation in a young insular species, Drosophila silvestris . Proceedings of the National Academy of Sciences of the United States of America, 86, 4798–4802. 10.1073/pnas.86.12.4798 [DOI] [PMC free article] [PubMed] [Google Scholar]
- Dahlhoff, E. P. , & Rank, N. E. (2000). Functional and physiological consequences of genetic variation at phosphoglucose isomerase: Heat shock protein expression is related to enzyme genotype in a montane beetle. Proceedings of the National Academy of Sciences, 97(18), 10056–10061. 10.1073/pnas.160277697 [DOI] [PMC free article] [PubMed] [Google Scholar]
- Droney, D. C. (1992). Sexual selection in a lekking Hawaiian Drosophila: The roles of male competition and female choice in male mating success. Animal Behaviour, 44(6), 1007–1020. 10.1016/S0003-3472(05)80313-6 [DOI] [Google Scholar]
- Eldon, J. , Price, J. P. , Magnacca, K. , & Price, D. K. (2013). Patterns and processes in complex landscapes: Testing alternative biogeographical hypotheses through integrated analysis of phylogeography and community ecology in Hawai'i. Molecular Ecology, 22(13), 3613–3628. 10.1111/mec.12326 [DOI] [PubMed] [Google Scholar]
- Excoffier, L. , Laval, G. , & Schneider, S. (2005). Arlequin (version 3.0): An integrated software package for population genetics data analysis. Evolutionary Bioinformatics Online, 1, 47–50. [PMC free article] [PubMed] [Google Scholar]
- Flatt, T. (2016). Genomics of clinal variation in Drosophila: Disentangling the interactions of selection and demography. Molecular Ecology, 25(5), 1023–1026. [DOI] [PubMed] [Google Scholar]
- Giambelluca, T. W. , Diaz, H. F. , & Luke, M. S. (2008). Secular temperature changes in Hawai ‘i. Geophysical Research Letters, 35, L12707. [Google Scholar]
- Gillespie, R. G. , & Roderick, G. K. (2002). Arthropods on islands: Colonization, speciation, and conservation. Annual Review of Entomology, 47(1), 595–632. 10.1146/annurev.ento.47.091201.145244 [DOI] [PubMed] [Google Scholar]
- Hobbelen, P. H. , Samuel, M. D. , Foote, D. , Tango, L. , & LaPointe, D. A. (2013). Modeling the impacts of global warming on predation and biotic resistance: Mosquitoes, damselflies and avian malaria in Hawaii. Theoretical Ecology, 6(1), 31–44. 10.1007/s12080-011-0154-9 [DOI] [Google Scholar]
- Hoffmann, A. A. , Anderson, A. , & Hallas, R. (2002). Opposing clines for high and low temperature resistance in Drosophila melanogaster . Ecology Letters, 5(5), 614–618. 10.1046/j.1461-0248.2002.00367.x [DOI] [Google Scholar]
- Hoffmann, A. A. , & Sgrò, C. M. (2011). Climate change and evolutionary adaptation. Nature, 470(7335), 479 10.1038/nature09670 [DOI] [PubMed] [Google Scholar]
- Hoffmann, A. A. , Sørensen, J. G. , & Loeschcke, V. (2003). Adaptation of Drosophila to temperature extremes: Bringing together quantitative and molecular approaches. Journal of Thermal Biology, 28(3), 175–216. 10.1016/S0306-4565(02)00057-8 [DOI] [Google Scholar]
- Howarth, F. G. , & Gagné, B. H. (2012). Development of insect conservation in Hawai‘i In New T. R. (Ed.), Insect conservation: Past, present and prospects (pp. 359–376). Dordrecht, Netherlands: Springer Press. [Google Scholar]
- Huang, D. W. , Sherman, B. T. , & Lempicki, R. A. (2009a). Systematic and integrative analysis of large gene lists using DAVID Bioinformatics Resources. Nature Protocols, 4(1), 44–57. [DOI] [PubMed] [Google Scholar]
- Huang, D. W. , Sherman, B. T. , & Lempicki, R. A. (2009b). Bioinformatics enrichment tools: Paths toward the comprehensive functional analysis of large gene lists. Nucleic Acids Research, 37(1), 1–13. [DOI] [PMC free article] [PubMed] [Google Scholar]
- Kambysellis, M. P. , & Craddock, E. M. (1991). Insemination patterns in Hawaiian Drosophila species (Diptera: Drosophilidae) correlate with ovarian development. Journal of Insect Behavior, 4(1), 83–100. 10.1007/BF01092553 [DOI] [Google Scholar]
- Kambysellis, M. P. , & Heed, W. B. (1971). Studies of oogenesis in natural populations of Drosophilidae. I. Relation of ovarian development and ecological habitats of the Hawaiian species. The American Naturalist, 105(941), 31–49. [Google Scholar]
- Katoh, T. , Izumitani, H. F. , Yamashita, S. , & Watada, M. (2016). Multiple origins of Hawaiian drosophilids: Phylogeography of Scaptomyza Hardy (Diptera: Drosophilidae). Entomological Science, 20(1), 33–44. [Google Scholar]
- Keeling, C. D. , Whorf, T. P. , Wahlen, M. , & Vanderplicht, J. (1995). Interannual extremes in the rate of rise of atmospheric carbon‐dioxide since 1980. Nature, 375(6533), 666–670. [Google Scholar]
- Kellermann, V. , van Heerwaarden, B. , Sgrò, C. M. , & Hoffmann, A. A. (2009). Fundamental evolutionary limits in ecological traits drive Drosophila species distributions. Science, 325(5945), 1244–1246. [DOI] [PubMed] [Google Scholar]
- Leemans, R. , Egger, B. , Loop, T. , Kammermeier, L. , He, H. , Hartmann, B. , … Reichert, H. (2000). Quantitative transcript imaging in normal and heat‐shocked Drosophila embryos by using high‐density oligonucleotide arrays. Proceedings of the National Academy of Sciences, 97(22), 12138–12143. 10.1073/pnas.210066997 [DOI] [PMC free article] [PubMed] [Google Scholar]
- Lemke, P. , Ren, J. , Alley, R. , Allison, I. , Carrasco, J. , Flato, G. , Zhang, T. . (2007) Observations: Changes in Snow, Ice and Frozen Ground In Solomon S., Qin D., Manning M., Chen Z., Marquis M., Averyt K. B., Tignor M., & Miller H. L. (Eds.), Climate change 2007: The physical science basis. Contribution of working group I to the fourth assessment report of the intergovernmental panel on climate change (pp. 337–384). Cambridge: Cambridge University Press. [Google Scholar]
- Lister, B. C. , & Garcia, A. (2018). Climate‐driven declines in arthropod abundance restructure a rainforest food web. Proceedings of the National Academy of Sciences, 115(44), E10397–E10406. 10.1073/pnas.1722477115 [DOI] [PMC free article] [PubMed] [Google Scholar]
- MacMillan, H. A. , Knee, J. M. , Dennis, A. B. , Udaka, H. , Marshall, K. E. , Merritt, T. J. , & Sinclair, B. J. (2016). Cold acclimation wholly reorganizes the Drosophila melanogaster transcriptome and metabolome. Scientific Reports, 6, 28999 10.1038/srep28999 [DOI] [PMC free article] [PubMed] [Google Scholar]
- Magnacca, K. N. , Foote, D. , & O’Grady, P. M. (2008). A review of the endemic Hawaiian Drosophilidae and their host plants. Zootaxa, 1728(1), 58. [Google Scholar]
- Magnacca, K. , & Price, D. K. (2015). Rapid adaptive radiation and host plant conservation in the Hawaiian picture wing Drosophila (Diptera: Drosophilidae). Molecular Phylogenetics and Evolution, 92, 226–242. 10.1016/j.ympev.2015.06.014 [DOI] [PubMed] [Google Scholar]
- Manning, A. C. , Nisbet, E. G. , Keeling, R. F. , & Liss, P. S. (2011). Greenhouse gases in the Earth system: Setting the agenda to 2030. Philosophical Transactions A Mathematical Physical and Engineering Sciences, 369(1943), 1885–1890. 10.1098/rsta.2011.0076 [DOI] [PubMed] [Google Scholar]
- Mayer, M. P. , & Bukau, B. (2005). Hsp70 chaperones: Cellular functions and molecular mechanism. Cellular and Molecular Life Sciences, 62(6), 670–784. 10.1007/s00018-004-4464-6 [DOI] [PMC free article] [PubMed] [Google Scholar]
- Michalak, P. , Minkov, I. , Helin, A. , Lerman, D. N. , Bettencourt, B. R. , Feder, M. E. , … Nevo, E. (2001). Genetic evidence for adaptation‐driven incipient speciation of Drosophila melanogaster along a microclimatic contrast in “Evolution Canyon”, Israel. Proceedings of the National Academy of Sciences, 98(23), 13195–13200. 10.1073/pnas.231478298 [DOI] [PMC free article] [PubMed] [Google Scholar]
- Milner, L. J. , Reade, J. P. H. , & Cobb, A. H. (2007). The effect of temperature on glutathione S‐transferase activity and glutathione content in Alopecurus myosuroides (black grass) biotypes susceptible and resistant to herbicides. Weed Research, 47(2), 106–112. 10.1111/j.1365-3180.2007.00540.x [DOI] [Google Scholar]
- Norry, F. M. , Scannapieco, A. C. , Sambucetti, P. , Bertoli, C. I. , & Loeschcke, V. (2008). QTL for the thermotolerance effect of heat hardening, knockdown resistance to heat and chill‐coma recovery in an intercontinental set of recombinant inbred lines of Drosophila melanogaster . Molecular Ecology, 17(20), 4570–4581. [DOI] [PubMed] [Google Scholar]
- O’Grady, P. M. , Lapoint, R. T. , Bonacum, J. , Lasola, J. , Owen, E. , Wu, Y. , & DeSalle, R. (2011). Phylogenetic and ecological relationships of the Hawaiian Drosophila inferred by mitochondrial DNA analysis. Molecular Phylogenetics and Evolution, 58(2), 244–256. 10.1016/j.ympev.2010.11.022 [DOI] [PubMed] [Google Scholar]
- Patton, Z. J. , & Krebs, R. A. (2001). The effect of thermal stress on the mating behavior of three Drosophila species. Physiological and Biochemical Zoology, 74(6), 783–788. [DOI] [PubMed] [Google Scholar]
- Porcelli, D. , Gaston, K. J. , Butlin, R. K. , & Snook, R. R. (2017). Local adaptation of reproductive performance during thermal stress. Journal of Evolutionary Biology, 30(2), 422–429. 10.1111/jeb.13018 [DOI] [PubMed] [Google Scholar]
- Price, D. K. , & Boake, C. R. (1995). Behavioral reproductive isolation in Drosophila silvestris, D. heteroneura, and their F 1 hybrids (Diptera: Drosophilidae). Journal of Insect Behavior, 8(5), 595–616. [Google Scholar]
- Price, D. K. , & Muir, C. (2008). Conservation implications of hybridization in Hawaiian picture‐winged Drosophila . Molecular Phylogenetics and Evolution, 47(3), 1217–1226. 10.1016/j.ympev.2007.12.003 [DOI] [PubMed] [Google Scholar]
- Price, J. P. , & Clague, D. A. (2002) How old is the Hawaiian biota? Geology and phylogeny suggest recent divergence. Proceedings of the Royal Society of London B: Biological Sciences, 269(1508), 2429–2435. [DOI] [PMC free article] [PubMed] [Google Scholar]
- Richardson, M. (2006). Endangered and threatened wildlife and plants: Determination of status for 12 species of picture‐wing flies from the Hawaiian Islands. Federal Register, 71(89), 26835–26852. [Google Scholar]
- Ringo, J. M. , & Hodosh, R. J. (1978). A multivariate analysis of behavioral divergence among closely related species of endemic Hawaiian Drosophila . Evolution, 32(2), 389–397. [DOI] [PubMed] [Google Scholar]
- Rowley, D. L. , Coddington, J. A. , Gates, M. W. , Norrbom, A. L. , Ochoa, R. A. , Vandenberg, N. J. , & Greenstone, M. H. (2007). Vouchering DNA‐barcoded specimens: Test of a nondestructive extraction protocol for terrestrial arthropods. Molecular Ecology Resources, 7(6), 915–924. 10.1111/j.1471-8286.2007.01905.x [DOI] [Google Scholar]
- Roy, S. , Short, M. K. , Stanley, E. R. , & Jubinsky, P. T. (2012). Essential role of Drosophila black-pearl is mediated by its effects on mitochondrial respiration. The FASEB Journal, 26(9), 3822–3833. [DOI] [PMC free article] [PubMed] [Google Scholar]
- Sarup, P. , Sørensen, J. G. , Dimitrov, K. , Barker, J. S. F. , & Loeschcke, V. (2006). Climatic adaptation of Drosophila buzzatii populations in southeast Australia. Heredity, 96(6), 479–486. 10.1038/sj.hdy.6800828 [DOI] [PubMed] [Google Scholar]
- Saxon, A. D. , O'Brien, E. K. , & Bridle, J. R. (2018). Temperature fluctuations during development reduce male fitness and may limit adaptive potential in tropical rainforest Drosophila . Journal of Evolutionary Biology, 31(3), 405–415. [DOI] [PubMed] [Google Scholar]
- Sørensen, J. G. , Kristensen, T. N. , & Loeschcke, V. (2003). The evolutionary and ecological role of heat shock proteins. Ecology Letters, 6(11), 1025–1037. 10.1046/j.1461-0248.2003.00528.x [DOI] [Google Scholar]
- Sørensen, J. G. , Nielsen, M. M. , Kruhøffer, M. , Justesen, J. , & Loeschcke, V. (2005). Full genome gene expression analysis of the heat stress response in Drosophila melanogaster. Cell Stress & Chaperones, 10(4), 312–328. 10.1379/CSC-128R1.1 [DOI] [PMC free article] [PubMed] [Google Scholar]
- Takahashi, K. H. , Okada, Y. , & Teramura, K. (2011). Genome‐wide deficiency screen for the genomic regions responsible for heat resistance in Drosophila melanogaster . BMC Genetics, 12(1), 57 10.1186/1471-2156-12-57 [DOI] [PMC free article] [PubMed] [Google Scholar]
- Thomas, P. D. , Campbell, M. J. , Kejariwal, A. , Mi, H. , Karlak, B. , Daverman, R. , … Narechania, A. (2003). PANTHER: A library of protein families and subfamilies indexed by function. Genome Research, 13(9), 2129–2141. 10.1101/gr.772403 [DOI] [PMC free article] [PubMed] [Google Scholar]
- Uhrigshardt, H. , Singh, A. , Kovtunovych, G. , Ghosh, M. , & Rouault, T. A. (2010) Characterization of the human HSC20, an unusual DnaJ type III protein, involved in iron–sulfur cluster biogenesis. Human Molecular Genetics, 19(19), 3816–3834. [DOI] [PMC free article] [PubMed] [Google Scholar]
- Uy, K. L. , LeDuc, R. , Ganote, C. , & Price, D. K. (2015). Physiological effects of heat stress on Hawaiian picture‐wing Drosophila: Genome‐wide expression patterns and stress‐related traits. Conservation Physiology, 3(1), cou062. [DOI] [PMC free article] [PubMed] [Google Scholar]
- Vandergast, A. G. , Gillespie, R. G. , & Roderick, G. K. (2004). Influence of volcanic activity on the population genetic structure of Hawaiian Tetragnatha spiders: Fragmentation, rapid population growth and the potential for accelerated evolution. Molecular Ecology, 13(7), 1729–1743. 10.1111/j.1365-294X.2004.02179.x [DOI] [PubMed] [Google Scholar]
- Vitousek, P. M. (2004). Nutrient cycling and limitation: Hawai'i as a model system. Princeton, NJ: Princeton University Press. [Google Scholar]
- Wilson, J. T. (1963). A possible origin of the Hawaiian Islands. Canadian Journal of Physics, 41(6), 863–870. 10.1139/p63-094 [DOI] [Google Scholar]
Associated Data
This section collects any data citations, data availability statements, or supplementary materials included in this article.
Supplementary Materials
Data Availability Statement
The microarray data discussed in this publication have been deposited in NCBI's Gene Expression Omnibus and are accessible through GEO Series accession number GSE122959. The D. sproati collection locations are available through DRYAD (https://doi.org/10.5061/dryad.cn946) and the COII and YP1 sequence data through GenBank (COII: JX455020‐JX455050, YP1: JX454999‐JX455019).