

In this study, Albert et al. investigated the mechanisms by which the yeast Sfp1 protein coordinates both cell division and growth. They demonstrate that Sfp1 directly controls genes required for ribosome production and many other growth-promoting processes.
Keywords: G1/S regulon, START, Sfp1, cell cycle, cell growth, chromatin endogenous cleavage (ChEC), ribosomal protein gene, ribosome biogenesis, transcription
Abstract
The yeast Sfp1 protein regulates both cell division and growth but how it coordinates these processes is poorly understood. We demonstrate that Sfp1 directly controls genes required for ribosome production and many other growth-promoting processes. Remarkably, the complete set of Sfp1 target genes is revealed only by a combination of ChIP (chromatin immunoprecipitation) and ChEC (chromatin endogenous cleavage) methods, which uncover two promoter binding modes, one requiring a cofactor and the other a DNA-recognition motif. Glucose-regulated Sfp1 binding at cell cycle “START” genes suggests that Sfp1 controls cell size by coordinating expression of genes implicated in mass accumulation and cell division.
The expression of genes required for ribosome production is an intensive transcriptional process in growing cells and serves as a paradigm to study coordination of large gene networks (Lempiäinen and Shore 2009). Regulation of ribosome production at the transcriptional level in eukaryotes is best understood in the budding yeast Saccharomyces cerevisiae, where RNA polymerase II (RNAPII)-mediated transcription of ribosomal protein (RP) genes, genes required for ribosome assembly (ribosome biogenesis [RiBi] genes), and small nucleolar RNA (snoRNA) genes is highly regulated according to nutrient availability and stress. Despite this fact, the promoters of these three groups of genes are organized differently (Bosio et al. 2011), begging the question of how they can be coordinately regulated.
The split-finger protein 1 (Sfp1) is a nutrient- and stress-sensitive transcription factor (TF) whose deletion or overexpression has been shown to primarily affect the expression of RP and RiBi genes (Fingerman et al. 2003; Jorgensen et al. 2004; Marion et al. 2004). In addition, sfp1Δ cells are unusually small, whereas cells overexpressing SFP1 are large (Jorgensen et al. 2002). These findings imply a role for Sfp1 in determining the size at which cells commit to division, through an unknown mechanism. Notably, the transcriptional and cell-size phenotypes of SFP1 are similar to those of the c-Myc proto-oncogene (Jorgensen et al. 2004).
One paradox that has limited our understanding of Sfp1's mechanism of action is that the protein has been detected by chromatin immunoprecipitation (ChIP) at only a small fraction of the promoters that it appears to regulate. Thus, although ChIP detects Sfp1 at many RP gene promoters (Reja et al. 2015), it is undetectable at virtually all of the >200 RiBi gene promoters, raising the question of whether it acts indirectly at these genes.
Here we vastly expand our knowledge of Sfp1 binding by chromatin endogenous cleavage (ChEC)-seq analysis (Schmid et al. 2004; Zentner et al. 2015). Notably, we find that ChEC and ChIP provide a complementary picture of Sfp1 binding, with distinct sets of sites identified by one technique or the other. We present evidence that Sfp1 directly orchestrates TATA-binding protein (TBP) and RNAPII recruitment at a broad array of growth-promoting genes, including most RiBi, RP and snoRNA genes, but also many others. Unexpectedly, we also find that Sfp1 binds in a glucose-regulated manner to the promoters of many G1/S (“START”) regulon genes where it appears to act as a repressor. Interestingly, Sfp1 binding sites detected by ChEC are enriched for the motif gAAAATTTTc, whereas binding identified by ChIP is often strongly dependent on another TF: Ifh1 at RP genes or Swi4 at G1/S regulon genes. Our findings provide an unprecedented example of how the combination of ChIP and ChEC can reveal a more complete picture of TF-chromatin interactions and reveal a possible mechanism by which Sfp1 helps to regulate cell size by coordinating transcriptional programs involved in both mass accumulation and cell division.
Results and Discussion
Modulation of Sfp1 protein level triggers a genome-wide redistribution of RNAPII
Steady-state mRNA measurements in sfp1Δ strains have revealed up- or down-regulation of large numbers of genes (Jorgensen et al. 2004; Cipollina et al. 2005). However, sfp1Δ cells grow very slowly, making it difficult to distinguish between direct and indirect effects. Furthermore, measurements of steady-state mRNA levels can mask transcription effects that are buffered by compensatory mRNA stability changes. To better understand the role of Sfp1 in transcription we used RNAPII occupancy measured by ChIP-seq as a proxy for transcription initiation, first examining the effect of SFP1 overexpression from the inducible GAL1 promoter. This triggered a massive change in the transcriptional program, consistent with previous findings (Jorgensen et al. 2004), with 745 genes up-regulated and 1429 genes apparently down-regulated by at least 1.5-fold (Fig. 1A; see Supplemental Table S1 for a complete list).
Figure 1.
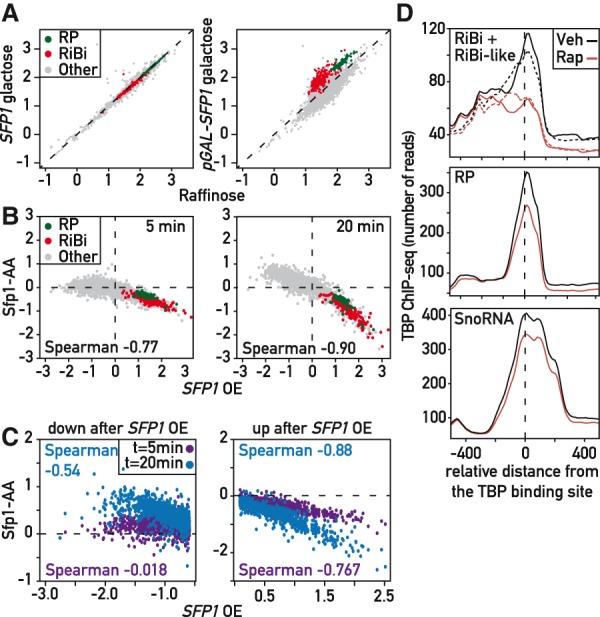
Regulation of growth-related genes by Sfp1. (A) Scatter plot comparing Rpb1 ChIP-seq signal (log10 normalized read counts) in SFP1 (left panel) and pGAL1-SFP1 (right panel) strains grown in 2% raffinose (x-axis) or 1 h following 2% galactose addition (y-axis). RP genes (green); RiBi genes (red); all other genes (gray). (B) Scatter plots comparing Rpb1 ChIP-seq fold-change (log2) relative to t = 5 (left) and 20 (right) min following rapamycin addition in a Sfp1 anchor-away strain (y-axes) to Rpb1 ChIP-seq change 60 min following galactose addition in a pGAL-SFP1 strain (x-axes). (C) Direct comparison of time points in B focusing on Sfp1-repressed (left) and Sfp1-activated (right) genes. (D) Average TBP binding profiles, centered on TATA or TATA-like element (Rhee and Pugh 2012), at 20 min following vehicle or rapamycin addition to a Sfp1 anchor-away strain at the indicated gene groups. In the top panel, average values for RiBi genes are depicted in solid lines, those for RiBi-like genes in dashed lines.
We were struck by the fact that many of the genes down-regulated upon SFP1 overexpression are glucose-repressed genes implicated in carbohydrate metabolism, whereas induced genes are strongly enriched in RP, RiBi, and translation-related genes (see Supplemental Table S1 for complete GO term analysis). Indeed, we observed a strong overlap between the transcriptional response to SFP1 overexpression and that of a glucose pulse (2%) (Supplemental Fig. S1A,B). Consistent with this finding, promoter motifs identified in the two sets of up-regulated genes are highly similar (Supplemental Fig. S1C). These data indicate that Sfp1 levels can influence expression of over 30% of RNAPII-transcribed genes, a much larger transcriptional network than is revealed by ChIP analysis of its binding sites (Reja et al. 2015).
To challenge this idea by a loss-of-function approach that bypasses the severe effect of sfp1Δ on cell growth, we used the “anchor-away” system (Haruki et al. 2008) to rapidly deplete Sfp1 from the nucleus. To ascertain which genes might be direct targets of Sfp1, we measured RNAPII binding by ChIP-seq at 5 and 20 min following rapamycin addition to the anchor-away strain and compared the changes to those observed following SFP1 overexpression (Fig. 1C). We observed a significant anti-correlation between depletion and overexpression effects (Spearman = 0.77 and 0.90 after 5 and 20 min, respectively) confirming that the majority of up-regulated and down-regulated genes identified by overexpression are also sensitive to a reduction of Sfp1 nuclear levels. The weaker anti-correlation at 5 min, compared to 20 (or 60 min, Supplemental Fig. S1D) is largely due to genes that appear to be negatively regulated by Sfp1 (Fig. 1C), suggesting that for at least some of these genes, the inhibition by Sfp1 might be a secondary effect. Since negative regulation by Sfp1 was somewhat unexpected, we performed a “spike-in” control (Bruzzone et al. 2018), which allowed us to confirm that up-regulation was not due to a normalization error in the ChIP-seq analysis.
Sfp1 promotes PIC assembly and transcription initiation at many growth-related genes
We next analyzed in more detail the molecular roles of genes activated by Sfp1, applying a >1.5-fold threshold to both overexpression and depletion data for RNAPII binding. As indicated above, this group of >500 genes is dominated by RiBi (201) and RP (112) genes (Supplemental Table S2). Although both sets of genes are down-regulated with similar kinetics following Sfp1 depletion, the magnitude of the effect is greater for RiBi genes. The remaining genes in this group are regulated in a manner similar to that of RiBi genes (Supplemental Fig. S1E), and we thus refer to this group as “RiBi-like.” Consistent with this assignment, we note that both RiBi and RiBi-like promoters display a strong enrichment for the RRPE motif and to a slightly lesser extent the PAC motif (Supplemental Fig. S1F; Hughes et al. 2000; Bosio et al. 2011). In addition, these two groups of genes share many functional annotations (Supplemental Table S2).
Further examination of the RiBi-like group revealed three different connections to previously inferred Sfp1 functions. First, we noted a strong enrichment for genes involved in nuclear transport, consistent with a phenotype associated with increased SFP1 gene dosage ((Blumberg and Silver 1991), see Supplemental Table S2). Second, the RiBi-like group includes all known genes encoding proteins involved in translation termination (Supplemental Table S3), including those encoding the ribosome-associated Hsp70-like proteins Ssb1/2, and the termination factors Sup45 and Sup35, all of which have been implicated in prion formation (Liebman and Chernoff 2012). Curiously, Sfp1 also exists in a prion form [ISP+] that suppresses the phenotype of the prion derivative of Sup35 [PSI+] (Matveenko et al. 2016). Finally, we identified new target genes with functional connections to Sfp1. One of these, MRS6, encodes the only yeast Rab escort protein, which in addition to its essential function in secretion, interacts directly with Sfp1 and regulates its nuclear localization (Lempiäinen et al. 2009; Singh and Tyers 2009). Another novel target gene, TOD6, encodes a repressor of RiBi genes (Lippman and Broach 2009; Huber et al. 2011). These links point to possible feedback mechanisms that might act to fine-tune nutrient and/or stress responses.
We next asked whether Sfp1 could be involved in transcription of snoRNA genes, a distinct set of RiBi-like genes. Notably, snoRNA genes as a whole display significant down-regulation following Sfp1 depletion and marked up-regulation upon Sfp1 overexpression, similar to that of RiBi, RP, and RiBi-like genes (Supplemental Fig. S1G).
To investigate how Sfp1 impacts transcription we measured TBP binding, the first step in pre-initiation complex (PIC) assembly, following rapid nuclear depletion of Sfp1. We observed a significant drop in TBP ChIP-seq signal that tracks with the RNAPII decrease (i.e., larger at RiBi and RiBi-like genes, compared to RP and snoRNA genes; Fig. 1D). As expected, Sfp1 depletion has no effect on TBP binding at genes where RNAPII recruitment is unaffected, or at RNAPIII-transcribed tRNA genes (Supplemental Fig. S1H,I). Since Sfp1 has been suggested to affect RNAPII processivity, particularly at RP genes (Gómez-Herreros et al. 2012), we quantified the RNAPII distribution across ORFs following Sfp1 depletion but found no change (Supplemental Fig. S1J).
Glucose-dependent binding of Sfp1 at G1/S regulon genes
Given the similarity of the transcriptional responses to SFP1 overexpression and a glucose pulse, and the fact that sfp1Δ most strongly impairs growth in glucose medium, we decided to measure Sfp1 binding in three different carbon source conditions (glucose and two “poor” carbon sources, raffinose and galactose). As reported previously (Reja et al. 2015), Sfp1 binds at many RP gene promoters in glucose-grown cells, and we found that the same is true for cells grown in either galactose or raffinose (Supplemental Table S4). However, we identified ∼100 target genes in glucose-grown cells where Sfp1 binding was weaker in either galactose or raffinose compared to glucose (see Fig. 2A for one example), typically from 1.5- to threefold (Fig. 2B). Strikingly, this group is highly enriched in genes implicated in the G1/S cell-cycle transition, (“START” (Bertoli et al. 2013)), whose promoters are bound by the Swi4 activator. In contrast, genes where Sfp1 promoter binding was essentially equivalent in all carbon sources are highly enriched in Ifh1-bound RP genes (Fig. 2B; Supplemental Table S4). This glucose-specific increase in Sfp1 promoter binding is recapitulated by growing pGAL1-SFP1 cells in galactose (Fig. 2C). Interestingly, we found that total cellular levels of Sfp1 are not detectably influenced by carbon source (Supplemental Fig. S2A), whereas the nuclear concentration of Sfp1-GFP is clearly higher in glucose-grown cells compared to either raffinose or galactose (Supplemental Fig. S2B). These findings suggest that Sfp1 binding, specifically at G1/S gene promoters, is limited by Sfp1 nuclear concentration, which is highest in the presence of glucose.
Figure 2.
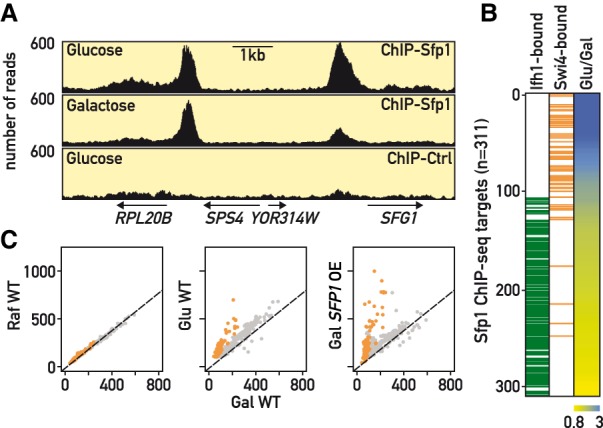
Glucose-regulated binding of Sfp1 at G1/S (START) regulon genes. (A) Genome browser tracks comparing Sfp1-TAP ChIP-seq signals in glucose or galactose medium, or in an untagged strain grown in glucose, at the genomic loci indicated below. (B) Heat map (right) showing ratio of Sfp1-TAP ChIP-seq signal from glucose-grown versus galactose-grown cells. Positions of genes whose promoters are bound by Swi4 or Ifh1 are indicated in orange or green, respectively. (C) Scatter plots comparing Sfp1-TAP ChIP-seq signal in the indicated strains and growth conditions (RAF, raffinose; GAL, galactose; GLU, glucose). For the pGAL1-SFP1-TAP strain ChIP-seq was performed 60 min following galactose.
Surprisingly, the expression of this G1/S-specific group of Sfp1 target genes is on average decreased by SFP1 overexpression and increased upon Sfp1 depletion, in contrast to the group predominated by Ifh1 binding (Supplemental Fig. S2C), suggesting that Sfp1 may act as a negative regulator of many START genes, including two key drivers of the G1/S transition, CLN1 and CLN2. This finding is consistent with a proposal that Sfp1 works as an inhibitor of START through an unknown mechanism acting at the level of CLN1/2 transcription (Ferrezuelo et al. 2012). Furthermore, the glucose-dependent binding of Sfp1 may in part explain the cAMP/PKA-dependent inhibition of CLN1 expression proposed to operate through Swi4 (Amigoni et al. 2015). Nevertheless, the association of Sfp1 with a large number of other genes in the G1/S regulon raises the possibility that Sfp1 regulation of START may extend well beyond its role in CLN1/2 expression. This issue clearly warrants further study.
ChEC-seq reveals Sfp1 target genes that are missed by ChIP
Although the ChIP-seq experiments described above confirmed Sfp1 binding to a number of genes where functional experiments suggest it is either a positive or negative regulator, they fail to explain how Sfp1 regulates large groups of additional target genes, such as RiBi, RiBi-like and snoRNA genes. We thus asked whether an alternative assay to detect TF binding, chromatin endogenous cleavage (ChEC; (Schmid et al. 2004)), could reveal Sfp1 binding at the promoters of these genes. To this end, we fused the micrococcal nuclease (MNase) gene to the C-terminus of endogenous SFP1 and performed a ChEC assay that was analyzed by high throughput sequencing (ChEC-seq; (Zentner et al. 2015)). Strikingly, this revealed a strong signal at a much larger number of promoters than was detected by Sfp1-TAP ChIP-seq (see Supplemental Table S5 for a complete list with functional annotations), including most RiBi, RiBi-like, and snoRNA genes (examples shown in Fig. 3A; Supplemental Fig. S3A). Furthermore, when ordered according to the effect of Sfp1 depletion on RNAPII binding genome-wide, it is clear that ChEC-seq signal strength is better correlated with this functional measure of Sfp1 than is ChIP-seq (see heatmaps, Supplemental Fig. S3B,C). This conclusion is borne out by quantitative analysis of the correlations between the two binding data sets (ChIP-seq or ChEC-seq) and the transcriptional effect of Sfp1 depletion (Supplemental Fig. S3D).
Figure 3.
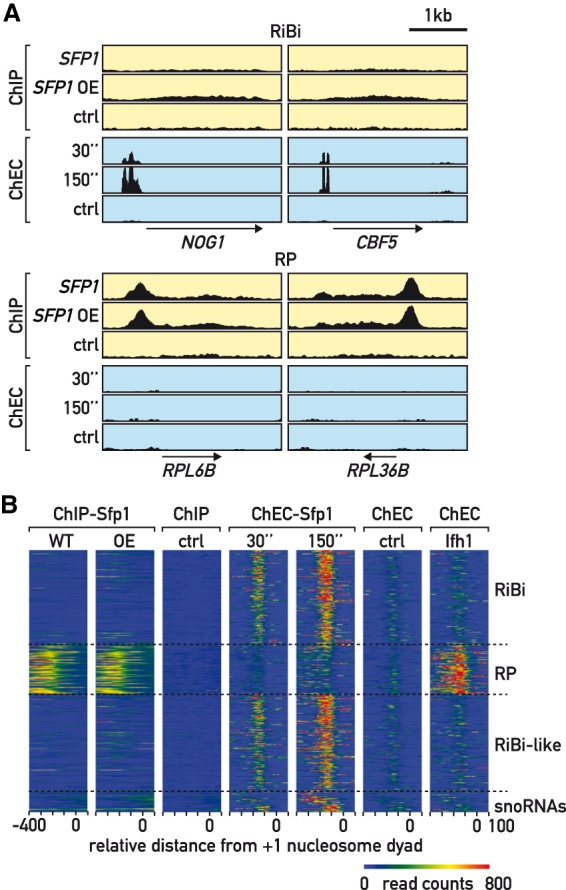
ChIP and ChEC detect distinct classes of Sfp1 promoter binding sites. (A) Genome browser tracks comparing Sfp1-TAP or untagged ChIP-seq signals (yellow background) to Sfp1-MNase and free MNase ChEC-seq signals (blue background), the latter at the indicated time points following calcium addition. The position and direction of transcription of individual RiBi (top) and RP (bottom) genes are shown below. Control strains (ctrl) lack either the TAP or MNase tags. (B) Heat maps showing Sfp1-TAP ChIP-seq under endogenous expression (WT) or after pGAL1-SFP1 overexpression (OE); Sfp1 ChEC-seq signal after 30 or 150 sec of Ca+2 treatment, or Ifh1 ChEC-seq signal after 150 sec of Ca+2 treatment at the indicated categories of genes (right). Signals for a window of −400 to +100 bp relative to the +1 nucleosome (0) are displayed (x-axis). Control for ChIP (untagged strain) and ChEC (free-MNase, 20 min following Ca+2 addition) are also shown.
To examine the Sfp1 ChEC-seq results in more detail, and better compare them to those obtained by ChIP-seq, we focused on the group of over 500 genes described above, whose expression is most strongly dependent upon Sfp1. We divided this group of genes into four subgroups (RiBi, RP, RiBi-like, and snoRNA) and mapped both Sfp1 ChIP-seq and Sfp1 ChEC-seq signals onto these separate groups (Fig. 3B). This shows clearly that ChIP-seq reveals Sfp1 binding at RP genes, but little or no binding at RiBi, RiBi-like, or snoRNA genes, whereas an opposite trend is observed for ChEC-seq. Box plots of these data also attest to this distinction between ChIP- and ChEC-detected binding sites (Supplemental Fig. S3E).
This complementary behavior of Sfp1 is not a universal feature of the ChEC assay, since the ChEC-seq results for three general regulatory factors in yeast (Rap1, Abf1, and Reb1) are largely concordant with those obtained by ChIP (Zentner et al. 2015). We also find that Ifh1 ChEC analysis yields a profile very similar to that of ChIP (cleavage almost exclusively at RP gene promoters; Fig. 3B). Nevertheless, we have no reason to believe that the differential behavior of Sfp1 in these two chromatin binding assays is unique to this factor.
Cofactor-dependent and sequence-driven binding modes of Sfp1
In considering possible causes for the different behavior of Sfp1 in ChEC and ChIP assays, we first noted that Sfp1 binding at RP gene promoters is remarkably co-incident with that of the RP-specific activator Ifh1 (Supplemental Fig. S4A), and we thus wondered whether Sfp1 association at these genes might be dependent on this factor. To test this idea, we measured Sfp1 binding at two RP genes following rapid nuclear depletion of Ifh1 and found that it is strongly reduced under these conditions (Fig. 4A). This dependence upon Ifh1 for Sfp1 binding probably extends to all RP genes, since we observed a strong correlation between the ChIP-seq signal strength of the two factors that is largely specific to these genes (Supplemental Fig. S4B). As noted above, many additional Sfp1 promoter binding sites detected by ChIP are also bound by the TF Swi4, and at these promoters we found that Sfp1 binding is highly coincident with that of Swi4 (Supplemental Fig. S4C). As was the case for Ifh1 at RP genes, anchor-away of Swi4 caused a strong decrease in Sfp1 binding at two G1/S regulon genes that we tested, those encoding cyclins Cln1 and Cln2 (Fig. 4B). We thus infer that many of the Sfp1 binding events detected by ChIP are linked to recruitment through another TF: Ifh1 at RP genes and Swi4 at G1/S regulon genes. These would appear to explain the majority of ChIP-detectable binding events (Fig. 2B), though other examples may exist where a different co-factor helps to recruit Sfp1.
Figure 4.
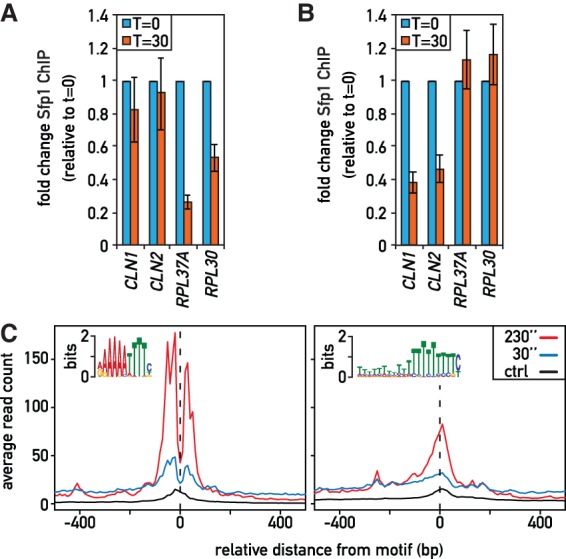
Cofactor-dependent and DNA sequence motif-dependent modes of Sfp1 binding. (A) Sfp1 occupancy (qPCR-ChIP) at the indicated promoters and times following auxin treatment in an Ifh1-AID strain; fold enrichment relative to ACT1 was normalized to values at t = 0, which were set to 1. (B) Sfp1 occupancy as in (A) following rapamycin treatment in a Swi4 anchor-away strain. (C) Average plots of Sfp1-MNase cleavage centered on the indicated motifs at 30 or 150 sec after Ca+2 activation of MNase. Control averages (free-MNase cleavage 20 min after Ca+2) are also shown.
To understand Sfp1 recruitment at genes where it is detected by ChEC, we searched for a common DNA feature at sites of Sfp1-MNase cleavage (Bailey 2011). We found a strong enrichment for two different motifs, one a large stretch of A residues, the other a palindromic A/T-rich sequence that strongly resembles the RRPE motif (Fig. 4C; Supplemental Fig. S4D), which is highly enriched at promoters of genes that are affected by Sfp1 depletion or overexpression (Supplemental Fig. S1F). Significantly, protein-binding microarray (PBM) data indicate that Sfp1 has DNA-binding specificity for an RRPE-like DNA sequence nearly identical to the palindromic motif identified by our ChEC experiments (Supplemental Fig. S4D; Zhu et al. 2009), suggesting that Sfp1 binds directly to this motif in vivo. Consistent with this idea, MNase cutting produced two sharp peaks immediately surrounding the motif (Fig. 4C), as was the case for three other yeast TFs (Abf1, Reb1, and Rap1) at their respective binding motifs. Interestingly, these other TFs also displayed cutting enrichment at polyA tracts (Zentner et al. 2015).
Concluding remarks
Results described here help to clarify the previously enigmatic role of Sfp1 in transcription and place this protein at the center of transcriptional networks controlling ribosome biogenesis and other growth-promoting processes, as well as the G1/S transition (START) (Fig. 5).
Figure 5.
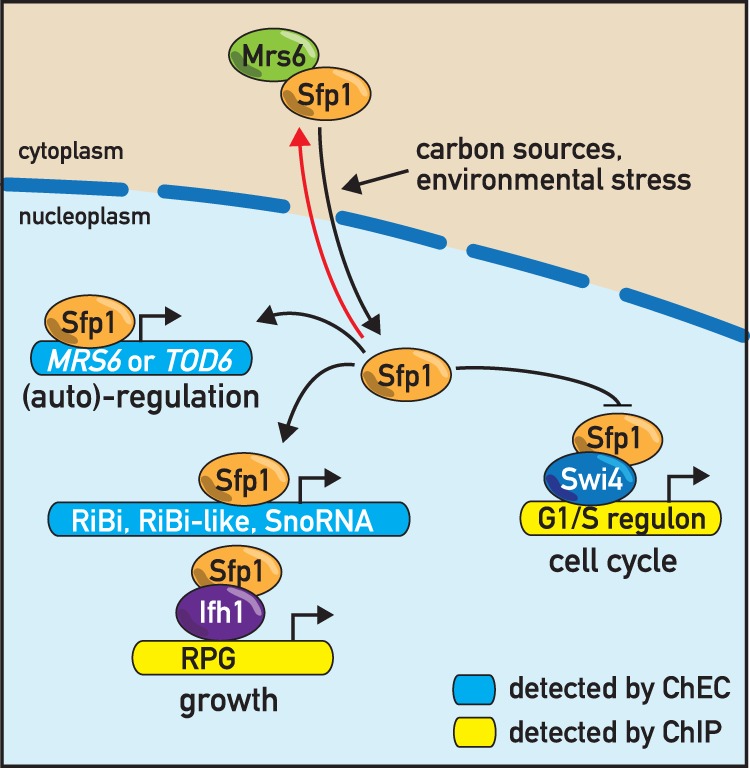
Schematic representation of Sfp1 binding and regulation. See text for details.
The application of ChEC-seq and related MNase-based methods is still in its infancy, and we are unaware of other cases where the ChIP and ChEC methods yield such complementary results. Nevertheless, our findings highlight limitations of both techniques that may be underappreciated. For example, the failure of ChIP to detect Sfp1 binding at RiBi and RiBi-like genes is surprising considering our evidence that these interactions result from direct DNA binding. One possible explanation for this discrepancy is that the Sfp1 binding motif is extremely A/T-rich and may thus be unable to form direct cross-links with Sfp1 at a detectable frequency (Rossi et al. 2018). Alternatively, or in addition, the C-terminal epitope tags so far used to detect Sfp1 by ChIP may be masked at sites where Sfp1 binds directly to DNA, but not at those sites where its binding is dependent upon a second TF. In the case of ChEC, we imagine that Sfp1 detection at RP and G1/S regulon genes might be limited by a short binding half-life and/or access of the tethered MNase to accessible promoter DNA. We suggest that the pleiotropic chromatin-binding behavior of Sfp1 described here is not unique and propose that the complementary application of ChEC-seq and related techniques maybe be essential for identifying the full spectrum of TF targets, not just in yeast, but also in more complex metazoan organisms.
Materials and methods
Yeast strains and growth
Strains used in this study are listed in Supplemental Table S6. Experiments were typically performed with log phase cells harvested between OD600 0.4 and 0.6. Anchor-away experiments were performed as described (Haruki et al. 2008). ChIP-seq analysis of Sfp1-TAP was performed on cultures grown in yeast extract-peptone (YP) medium with indicated carbon sources. The untagged SFP1 wild-type strain (YDS2) was used as a control. The pGAL1-SFP1-TAP strain was grown in YP raffinose-containing medium for two generations before 1 h growth in 2% galactose to induce SFP1 expression. For glucose pulse experiments, wild-type strains were grown in YP glycerol (3%), glucose (0.05%), and shifted to YP, adenine, and dextrose medium (YPAD; 2% glucose).
ChIP- and ChEC-seq
ChIP-seq (Knight et al. 2014) and ChEC-seq (Kubik et al. 2018) were performed and quantified as described (see Supplemental Materials and Methods for details).
Swi4 and Ifh1 binding
ChIP data from Harbison et al. (2004) and Knight et al. (2014) were used to map Swi4 and Ifh1 binding, respectively. To quantify ChIP-seq signals for each promoter, the total number of reads from each sample in a 400 bp region upstream the TSS (transcription start site; (Jiang and Pugh 2009)) of each ORF was determined.
Data and software availability
All sequencing data generated in this study were submitted to the GEO database as SuperSeries GSE118561.
Supplementary Material
Acknowledgments
We thank other members of the Shore laboratory for helpful discussions; Florian Steiner and Robbie Loewith for comments on the manuscript; Uli Laemmli for ChEC reagents and advice on the ChEC method; Mylène Docquier and the Institute of Genetics and Genomics of Geneva (iGE3; http://www.ige3.unige.ch/genomics-platform.php) for high-throughput DNA sequencing; Nicolas Roggli for expert artwork; and Thomas Schalch for the use of his local Galaxy server. B.A. acknowledges support from an EMBO Long-Term Fellowship. L.H. was supported by an “Excellence Masters” fellowship from the University of Geneva. D.S. acknowledges support from the Swiss National Fund (grant number 31003A_170153) and the Republic and Canton of Geneva.
Author contributions: B.A. and S.T. designed the study together with D.S. and carried out most of the experiments. Y.G. constructed and characterized Sfp1 anchor-away strains, B.A., S.M. and L.H. performed and analyzed all ChEC-seq experiments, and S.K. analyzed RNAPII binding on coding regions and the “spike-in” control for RNAPII ChIP-seq following Sfp1 depletion. B.A. and D.S. wrote the manuscript.
Footnotes
Supplemental material is available for this article.
Article published online ahead of print. Article and publication date are online at http://www.genesdev.org/cgi/doi/10.1101/gad.322040.118.
References
- Amigoni L, Colombo S, Belotti F, Alberghina L, Martegani E. 2015. The transcription factor Swi4 is target for PKA regulation of cell size at the G1 to S transition in Saccharomyces cerevisiae. Cell Cycle 14: 2429–2438. 10.1080/15384101.2015.1055997 [DOI] [PMC free article] [PubMed] [Google Scholar]
- Bailey TL. 2011. DREME: motif discovery in transcription factor ChIP-seq data. Bioinformatics 27: 1653–1659. 10.1093/bioinformatics/btr261 [DOI] [PMC free article] [PubMed] [Google Scholar]
- Bertoli C, Skotheim JM, de Bruin RA. 2013. Control of cell cycle transcription during G1 and S phases. Nat Rev Mol Cell Biol 14: 518–528. 10.1038/nrm3629 [DOI] [PMC free article] [PubMed] [Google Scholar]
- Blumberg H, Silver P. 1991. A split zinc-finger protein is required for normal yeast growth. Gene 107: 101–110. 10.1016/0378-1119(91)90302-R [DOI] [PubMed] [Google Scholar]
- Bosio MC, Negri R, Dieci G. 2011. Promoter architectures in the yeast ribosomal expression program. Transcription 2: 71–77. 10.4161/trns.2.2.14486 [DOI] [PMC free article] [PubMed] [Google Scholar]
- Bruzzone MJ, Grünberg S, Kubik S, Zentner GE, Shore D. 2018. Distinct patterns of histone acetyltransferase and Mediator deployment at yeast protein-coding genes. Genes Dev 32: 1252–1265. 10.1101/gad.312173.118 [DOI] [PMC free article] [PubMed] [Google Scholar]
- Cipollina C, Alberghina L, Porro D, Vai M. 2005. SFP1 is involved in cell size modulation in respiro-fermentative growth conditions. Yeast 22: 385–399. 10.1002/yea.1218 [DOI] [PubMed] [Google Scholar]
- Ferrezuelo F, Colomina N, Palmisano A, Gari E, Gallego C, Csikász-Nagy A, Aldea M. 2012. The critical size is set at a single-cell level by growth rate to attain homeostasis and adaptation. Nat Commun 3: 1012 10.1038/ncomms2015 [DOI] [PubMed] [Google Scholar]
- Fingerman I, Nagaraj V, Norris D, Vershon AK. 2003. Sfp1 plays a key role in yeast ribosome biogenesis. Eukaryot Cell 2: 1061–1068. 10.1128/EC.2.5.1061-1068.2003 [DOI] [PMC free article] [PubMed] [Google Scholar]
- Gómez-Herreros F, de Miguel-Jiménez L, Morillo-Huesca M, Delgado-Ramos L, Muñoz-Centeno MC, Chávez S. 2012. TFIIS is required for the balanced expression of the genes encoding ribosomal components under transcriptional stress. Nucleic Acids Res 40: 6508–6519. 10.1093/nar/gks340 [DOI] [PMC free article] [PubMed] [Google Scholar]
- Harbison CT, Gordon DB, Lee TI, Rinaldi NJ, Macisaac KD, Danford TW, Hannett NM, Tagne JB, Reynolds DB, Yoo J, et al. 2004. Transcriptional regulatory code of a eukaryotic genome. Nature 431: 99–104. 10.1038/nature02800 [DOI] [PMC free article] [PubMed] [Google Scholar]
- Haruki H, Nishikawa J, Laemmli UK. 2008. The anchor-away technique: rapid, conditional establishment of yeast mutant phenotypes. Mol Cell 31: 925–932. 10.1016/j.molcel.2008.07.020 [DOI] [PubMed] [Google Scholar]
- Huber A, French SL, Tekotte H, Yerlikaya S, Stahl M, Perepelkina MP, Tyers M, Rougemont J, Beyer AL, Loewith R. 2011. Sch9 regulates ribosome biogenesis via Stb3, Dot6 and Tod6 and the histone deacetylase complex RPD3L. EMBO J 30: 3052–3064. 10.1038/emboj.2011.221 [DOI] [PMC free article] [PubMed] [Google Scholar]
- Hughes JD, Estep PW, Tavazoie S, Church GM. 2000. Computational identification of cis-regulatory elements associated with groups of functionally related genes in Saccharomyces cerevisiae. J Mol Biol 296: 1205–1214. 10.1006/jmbi.2000.3519 [DOI] [PubMed] [Google Scholar]
- Jiang C, Pugh BF. 2009. A compiled and systematic reference map of nucleosome positions across the Saccharomyces cerevisiae genome. Genome Biol 10: R109 10.1186/gb-2009-10-10-r109 [DOI] [PMC free article] [PubMed] [Google Scholar]
- Jorgensen P, Nishikawa JL, Breitkreutz BJ, Tyers M. 2002. Systematic identification of pathways that couple cell growth and division in yeast. Science 297: 395–400. 10.1126/science.1070850 [DOI] [PubMed] [Google Scholar]
- Jorgensen P, Rupes I, Sharom JR, Schneper L, Broach JR, Tyers M. 2004. A dynamic transcriptional network communicates growth potential to ribosome synthesis and critical cell size. Genes Dev 18: 2491–2505. 10.1101/gad.1228804 [DOI] [PMC free article] [PubMed] [Google Scholar]
- Knight B, Kubik S, Ghosh B, Bruzzone MJ, Geertz M, Martin V, Dénervaud N, Jacquet P, Ozkan B, Rougemont J, et al. 2014. Two distinct promoter architectures centered on dynamic nucleosomes control ribosomal protein gene transcription. Genes Dev 28: 1695–1709. 10.1101/gad.244434.114 [DOI] [PMC free article] [PubMed] [Google Scholar]
- Kubik S, O'Duibhir E, de Jonge WJ, Mattarocci S, Albert B, Falcone JL, Bruzzone MJ, Holstege FCP, Shore D. 2018. Sequence-directed action of RSC remodeler and general regulatory factors modulates +1 nucleosome position to facilitate transcription. Mol Cell 71: 89–102.e5. 10.1016/j.molcel.2018.05.030 [DOI] [PubMed] [Google Scholar]
- Lempiäinen H, Shore D. 2009. Growth control and ribosome biogenesis. Curr Opin Cell Biol 21: 855–863. 10.1016/j.ceb.2009.09.002 [DOI] [PubMed] [Google Scholar]
- Lempiäinen H, Uotila A, Urban J, Dohnal I, Ammerer G, Loewith R, Shore D. 2009. Sfp1 interaction with TORC1 and Mrs6 reveals feedback regulation on TOR signaling. Mol Cell 33: 704–716. 10.1016/j.molcel.2009.01.034 [DOI] [PubMed] [Google Scholar]
- Liebman SW, Chernoff YO. 2012. Prions in yeast. Genetics 191: 1041–1072. 10.1534/genetics.111.137760 [DOI] [PMC free article] [PubMed] [Google Scholar]
- Lippman SI, Broach JR. 2009. Protein kinase A and TORC1 activate genes for ribosomal biogenesis by inactivating repressors encoded by Dot6 and its homolog Tod6. Proc Natl Acad Sci 106: 19928–19933. 10.1073/pnas.0907027106 [DOI] [PMC free article] [PubMed] [Google Scholar]
- Marion RM, Regev A, Segal E, Barash Y, Koller D, Friedman N, O'Shea EK. 2004. Sfp1 is a stress- and nutrient-sensitive regulator of ribosomal protein gene expression. Proc Natl Acad Sci 101: 14315–14322. 10.1073/pnas.0405353101 [DOI] [PMC free article] [PubMed] [Google Scholar]
- Matveenko AG, Drozdova PB, Belousov MV, Moskalenko SE, Bondarev SA, Barbitoff YA, Nizhnikov AA, Zhouravleva GA. 2016. SFP1-mediated prion-dependent lethality is caused by increased Sup35 aggregation and alleviated by Sis1. Genes Cells 21: 1290–1308. 10.1111/gtc.12444 [DOI] [PubMed] [Google Scholar]
- Reja R, Vinayachandran V, Ghosh S, Pugh BF. 2015. Molecular mechanisms of ribosomal protein gene coregulation. Genes Dev 29: 1942–1954. 10.1101/gad.268896.115 [DOI] [PMC free article] [PubMed] [Google Scholar]
- Rhee HS, Pugh BF. 2012. Genome-wide structure and organization of eukaryotic pre-initiation complexes. Nature 483: 295–301. 10.1038/nature10799 [DOI] [PMC free article] [PubMed] [Google Scholar]
- Rossi MJ, Lai WKM, Pugh BF. 2018. Genome-wide determinants of sequence-specific DNA binding of general regulatory factors. Genome Res 28: 497–508. 10.1101/gr.229518.117 [DOI] [PMC free article] [PubMed] [Google Scholar]
- Schmid M, Durussel T, Laemmli UK. 2004. ChIC and ChEC; genomic mapping of chromatin proteins. Mol Cell 16: 147–157. [DOI] [PubMed] [Google Scholar]
- Singh J, Tyers M. 2009. A Rab escort protein integrates the secretion system with TOR signaling and ribosome biogenesis. Genes Dev 23: 1944–1958. 10.1101/gad.1804409 [DOI] [PMC free article] [PubMed] [Google Scholar]
- Zentner GE, Kasinathan S, Xin B, Rohs R, Henikoff S. 2015. ChEC-seq kinetics discriminates transcription factor binding sites by DNA sequence and shape in vivo. Nat Commun 6: 8733 10.1038/ncomms9733 [DOI] [PMC free article] [PubMed] [Google Scholar]
- Zhu C, Byers KJ, McCord RP, Shi Z, Berger MF, Newburger DE, Saulrieta K, Smith Z, Shah MV, Radhakrishnan M, et al. 2009. High-resolution DNA-binding specificity analysis of yeast transcription factors. Genome Res 19: 556–566. 10.1101/gr.090233.108 [DOI] [PMC free article] [PubMed] [Google Scholar]
Associated Data
This section collects any data citations, data availability statements, or supplementary materials included in this article.
Supplementary Materials
Data Availability Statement
All sequencing data generated in this study were submitted to the GEO database as SuperSeries GSE118561.