

Abstract
Movement and expansion of mesonephric-derived stroma appears to be very important in the development of the ovary. Here, we examined the expression of 24 genes associated with stroma in fetal ovaries during gestation (n = 17; days 58–274) from Bos taurus cattle. RNA was isolated from ovaries for quantitative RT-PCR. Expression of the majority of genes in TGFβ signalling, stromal transcription factors (NR2F2, AR), and some stromal matrix genes (COL1A1, COL3A1 and FBN1, but not FBN3) showed a positive linear increase with gestational age. Expression of genes associated with follicles (INSL3, CYP17A1, CYP11A1 and HSD3B1), was low until mid-gestation and then increased with gestational age. LHCGR showed an unusual bimodal pattern; high levels in the first and last trimesters. RARRES1 and IGFBP3 also increased with gestational age. To relate changes in gene expression in stromal cells with that in non stromal cells during development of the ovary we combined the data on the stromal genes with another 20 genes from non stromal cells published previously and then performed hierarchical clustering analysis. Three major clusters were identified. Cluster 1 genes (GATA4, FBN3, LHCGR, CYP19A1, ESR2, OCT4, DSG2, TGFB1, CCND2, LGR5, NR5A1) were characterised by high expression only in the first trimester. Cluster 2 genes (FSHR, INSL3, HSD3B1, CYP11A1, CYP17A1, AMH, IGFBP3, INHBA) were highly expressed in the third trimester and largely associated with follicle function. Cluster 3 (COL1A1, COL3A1, FBN1, TGFB2 TGFB3, TGFBR2, TGFBR3, LTBP2, LTBP3, LTBP4, TGFB1I1, ALDH1A1, AR, ESR1, NR2F2) had much low expression in the first trimester rising in the second trimester and remaining at that level during the third trimester. Cluster 3 contained members of two pathways, androgen and TGFβ signalling, including a common member of both pathways namely the androgen receptor cofactor TGFβ1 induced transcript 1 protein (TGFB1I1; hic5). GATA4, FBN3 and LHCGR, were highly correlated with each other and were expressed highly in the first trimester during stromal expansion before follicle formation, suggesting that this could be a critical phase in the development of the ovarian stroma.
Introduction
The mammalian ovary undergoes many different cell processes during its development [1]. The somatic granulosa cells of follicles and the surface epithelial cells, except at the base of the ovary, are derived from a common precursor, the gonadal ridge-epithelial-like (GREL) cell. This precursor cell very likely originates from the surface epithelial cells of the mesonephros and replicates to form the gonadal ridge. The oogonia and oocytes arise from primordial germ cells (PGC) that migrate from as far away as the yolk sac into the mesonephros from where they are incorporated into the gonadal ridge [2]. During their migration, the PGCs start to proliferate—a process which is continued after colonising the gonad. In the developing ovary, the germ cells firstly replicate (oogonia), then subsequently enter meiosis and arrest in the dictyate stage of prophase I (oocytes) until ovulation.
The ovarian stroma arises from the mesonephric stroma, as does the ovarian vasculature. This stroma penetrates the developing ovary and branches between the mass of GREL cells and PGCs/oogonia to form ovigerous cords [1]. Subsequently the ovigerous cords break into smaller and smaller groups of GREL cells and PGCs/oogonia until the first primordial follicles are formed. The processes involved in this breakdown are not well understood but certainly stroma penetrates in between these groups of cells during this process. The stroma spreads laterally below the surface thus partitioning some GRELs onto the surface of the ovary which then develop into a specialised epithelial layer. The expansion of cortical stroma is greatest in early gestation due to stromal cell proliferation [3].
The stroma is rich in stromal matrices such as decorin, versican, collagens type 1 and III, latent TGFβ binding proteins (LTBP) and fibrillins [1,4–6]. However, the matrix is not static during ovarian development. Fibrillin 3 is expressed in the first trimester only, and then in trimester 2 fibrillins 1 and 2 are expressed [6]. This maturational change in fibrillin types also occurs when fetal fibroblasts are cultured in vitro [7] and since fibrillins bind LTBPs and regulate bioavailability of TGFβ in tissues, presumably the action of TGFβ changes during fetal development of the ovary.
The importance of stroma in the ovary is best illustrated in polycystic ovary syndrome (PCOS) [8,9]. In the PCOS ovary all stromal compartments are different to normal ovaries. The polycystic ovaries have fifty per cent more ovarian capsule or tunica albuginea containing more collagen [9]. Their thickness of the cortical stromal is increased by one third, and the subcortical stroma, whether deep cortical or medullary, by five fold [9]. Functionally, the specialised stromal theca interna layer that develops around antral follicles also behaves differently in PCOS, with elevated capacity to produce steroid hormones [10,11]. The consequences of expanded stroma are well known in fibrosis, where TGFβ stimulates stromal fibroblast replication and deposition of collagen [12,13]. It has therefore logically been proposed that altered TGFβ activity in stroma is involved in development of polycystic ovaries [6]. However, this suggestion [6] was from a study of human and bovine fetal ovaries, not adult ovaries where polycystic ovaries can be observed [6]. This is reasonable as there is evidence for a fetal origin of PCOS that comes from a variety of sources now [14–18] and it is widely agreed now that events in fetal life affect the predisposition to PCOS in later life. The formation of the fetal ovarian stroma may be a critical event in this process.
Little is known about ovarian stroma, much less its development in the fetal ovary. In a morphometric study of the developing bovine ovary [3] it was found that during growth of cortex and medulla across gestation, the rate of cortical expansion slowed and the proliferation index and numerical density of proliferating cells in stroma significantly decreased. However, the proportion of stroma in the cortex significantly increased as the non stromal cells ceased dividing. Thus the stroma appears to be active throughout development. To further understand the role of stromal cells and matrices in the process of ovarian development and working on the hypothesis that development of the ovary is under genetic control we examined the expression patterns of genes related to TGFβ signalling, extracellular matrix and androgen synthesis throughout gestation in fetal ovaries. Genes related to germ cells, GREL cells and granulosa cells have been discussed previously [19] but analyses of the combined data sets have additionally been undertaken and presented here. We used the bovine ovary, which is similar to the human ovary [20,21], including fetal ovary development [6] and a summary of gene expression in the ovary was also informative in our selection of genes [22].
Materials and methods
Tissues
Fetuses of pregnant Bos taurus cows were collected at T&R Pastoral abattoir at Murray Bridge, SA, Australia and then transported on ice to the laboratory (n = 17). Crown-rump length (CRL) was measured to estimate gestational age [23]. All ovaries were frozen at -80°C for subsequent RNA analyses.
Gender determination
To confirm the gender of young fetuses (CRL < 8 cm), genomic DNA was extracted from the tail samples using the Wizard SV Genomic DNA Purification System (Promega Australia, Alexandria, NSW, Australia) according to the manufacturer’s instructions. Genomic DNA was amplified with a primer pair (sense primer: 5’-TCACTCCTGCAAAAGGAGCA-3’, antisense primer: 5’-TTATTGTGGCCCAGGCTTG-3’), specific for a region in the SRY-determining sequence, and primers specific for the 18S ribosomal RNA gene sequence [24] in separate reactions. SRY product sequences were verified by automated sequencing (3730 DNA analyser; Applied Biosystems, Mulgrave, VIC, Australia).
RNA extraction, cDNA synthesis and quantitative real time PCR
All fetal gonad samples for RNA sample extraction were homogenised with 1 ml of Trizol (Cat # 15596–026, Thermo Fisher Scientific, Waltham, MA, USA) each for two 10 s cycles at 3,500 rpm in a PowerLyzer 24 Bench Top Bead-Based Homogenizer (MoBio, Carlsbad, Ca, USA). The samples were then processed according to the standard Trizol protocol and resuspended in 30 μl of nuclease free H2O. Ten μg or less of each sample was treated with 2 U of DNAse 1 for 20 min at 37° C and the enzyme removed using DNAse inactivation reagent (Thermo Fisher Scientific). Two hundred ng of DNAse-treated RNA was used for reverse transcription reactions with or without Superscript RT III (Thermo Fisher Scientific) to generate cDNA or negative control to detect genomic contaminant respectively.
Primer assays were designed where possible to span intron-exon junctions or from one exon to another for quantitative real time PCR (qRT-PCR) using the free web-based software programs, Primer3 plus (Rozen and Skaletsky) and Net primer (PREMIER Biosoft, Palo Alto, CA, USA), based on the Reference RNA sequences available in NCBI (S1 Table). The cDNA was diluted from 1 in 4 to 1in 1000 and pooled from 10 samples to generate 5 standards which were used to establish a standard curve for testing primer combinations for quantitative real time PCR. Only those assays which gave a single sharp peak by melt curve analysis and achieved an amplification efficiency of 0.9–1.1 and an R2 value ≥ 0.98 were used for quantitation of transcript abundance.
The reactions were performed in duplicate on a Fluidigm Biomark HD instrument (San Francisco, CA, USA) using the following protocol. The reaction started with a pre-amplification step consisting of a 95°C hold for 10 min, followed by 12 cycles of 95°C for 15 s and 60°C for 4 min each using 50 nM of each primer and 2.5 μl of cDNA in 10 μl. The amplified product was then diluted 1 in 5 and added in 0.05 μl to the final reaction volume of 0.1 μl in a 48x48 plate which contained 500 nM of each primer per assay. The final amplification conditions were a 60 s activation step at 95°C, followed by 30 cycles of 96°C denaturation for 5 s and 60°C annealing/extension for 20 s using SsoFast EvaGreen Supermix with Low ROX (Biorad, Hercules, CA, USA) which contains a fluorescent intercalating agent for measuring amplification. The expression values for each gene were determined as the mean of the ratio of 2-Δ Ct for the target gene to the mean of RPL32 and PPIA because this gene combination was determined to be the most stable across all samples out of RPL32, PPIA, ACTB and GAPDH with a value of 0.056 using the Normfinder program.
Statistical analyses
ANOVA and post hoc statistical calculations using Tukey’s test were performed using GraphPad Prism version 6.00 (GraphPad Software Inc., La Jolla, CA, USA) following log transformation where appropriate to normalise the raw data distribution. Pearson’s correlations across all target genes and samples were performed on the data in Partek Genomics Suite (St Louis, MI, USA). Hierarchical clustering by gene only was also performed on the data using the Euclidian algorithm for dissimilarity with average linkage in Partek to generate a heatmap of relative transcript abundance. Prior to clustering, the raw data were first normalised by adjusting the mean expression across all samples for each gene to zero and the standard deviation to one. After correlation values between genes were identified, a network graph was plotted using the qgraph R package [25] and illustrated as an adjacent matrix plot.
Results
Due to the large number of genes analysed, we will only describe the expression profiles of genes associated with stromal and thecal cells in the following paragraphs.
TGFβ signalling pathway
The majority of genes involved in TGFβ signalling (Fig 1 and S1 Fig) increased throughout fetal ovarian development and showed a positive linear responses with gestational age, apart from TGFB1 (Fig 1A and S1A Fig), TGFBR1 (Fig 1D and S1D Fig) and LTBP1 (Fig 1G and S1G Fig). The expression of these three genes was unchanged throughout gestation.
Fig 1. TGF-β signalling pathway in fetal ovarian development.

Expression levels of genes for each animal are plotted against gestational age in days (n = 16 or 17 animals).
Stromal matrix and stromal markers
The expression of NR2F2 (COUP-TFII; Fig 2A and S2A Fig), a specific stromal cell marker, increased linearly with gestational age. This coincided with the observed increase to high levels in the expression of extracellular matrix genes COL1A1, COL3A1 and FBN1 (Fig 2B–2D and S2B–S2D Fig) during gestation. In contrast to FBN1, FBN2 (Fig 2E and S2E Fig) expression remained unchanged and FBN3 (Fig 2F and S2F Fig) declined drastically with age as shown previously [6].
Fig 2. Stromal matrix and marker in fetal ovarian development.

Expression levels of genes for each animal are plotted against gestational age in days (n = 16 or 17 animals).
Steroidogenesis and growth factor signalling
The expression of INSL3 (Fig 3A and S3A Fig), a peptide hormone involved in regulating steroidogenesis [26], and enzymes of the androgen synthesis pathway, CYP17A1, CYP11A1 and HSD3B1 (Fig 3B–3D and S3B–S3D Fig), were low until mid-gestation and then increased with gestational age. LHCGR (Fig 3E and S3E Fig) was highly expressed early in gestation, declined rapidly to a low point in mid-gestation and then slightly increased again towards the end of gestation. The expression of AR, RARRES1 and IGFBP3 (Fig 3F–3H and S3F–S3H Fig) increased with gestational age.
Fig 3. Steroidogenesis and growth factor signalling in fetal ovarian development.

Expression levels of genes for each animal are plotted against gestational age in days (n = 16 or 17 animals).
Relationships between functional groups of genes
Pearson’s correlation analysis were conducted and revealed correlations between genes within and between functional groups. A few examples of scatter plots of the mRNA levels between different genes are shown in S4 Fig. Most of the examined members of the TGFβ signalling showed strong positive correlation between each other, except for TGFB1 and TGFBR1 (Table 1). TGFB1 had only a strong negative correlation with TGFBR3, and TGFBR1 a strong positive correlation to LTBP1. Furthermore, all genes of the TGFβ signalling, except for TGFB1 and TGFBR1, were strongly positively correlated with the stromal cell marker NR2F2 and the extracellular matrix genes COL1A1, COL3A1 and FBN1, and strongly negatively with FBN3. TGFBR1 and LTBP1 were strongly correlated with FBN2. TGFB1 was only negatively correlated with FBN1. TGFβ signalling seemed to be not correlated with the enzymes of androgen synthesis, except for LTBP2 which was positively correlated with CYP11A1. Only TGFBR2, LTBP2 and TGFB1I1 had a positive correlation with INSL3. TGFB2, TGFB3, TGFBR2, TGFBR3, LTBP3, LTBP4 and TGFB1I1 were strongly negatively correlated with LHCGR. All TGFβ signalling genes examined, were positively correlated with AR, except for TGFB1 and TGFBR1, and were positively correlated with IGFBP3, except for TGFB1, TGFBR1, LTPB2 and LTBP3. TGFB2, TGFBR2, TGFBR3, LTBP2 and TGFB1I1 are also positively correlated with RARRES1.
Table 1. Pearson’s correlation coefficients between expression of genes in TGF-β signalling with other genes in TGF-β signalling, stromal matrix and marker and thecal cells and gestational age.
The darker the background colour the more significant the correlation is. Blue indicates a negative correlation and red indicates a positive correlation. (P-values: a < 0.05, b < 0.01, c < 0.001, d < 0.0001).
| TGF-β Signalling | ||||||||||||
|---|---|---|---|---|---|---|---|---|---|---|---|---|
| TGFB1 | TGFB2 | TGFB3 | TGFBR1 | TGFBR2 | TGFBR3 | LTBP1 | LTBP2 | LTBP3 | LTBP4 | TGFB1I1 | ||
| Gestational age | -0.330 | 0.818d | 0.758c | 0.121 | 0.838d | 0.930d | 0.454 | 0.957d | 0.857d | 0.855d | 0.895d | |
| TGF-β Signalling | TGFB1 | -0.441 | -0.282 | -0.033 | -0.298 | -0.499a | -0.418 | -0.395 | -0.228 | -0.334 | -0.452 | |
| TGFB2 | -0.441 | 0.720b | 0.092 | 0.861c | 0.945c | 0.575a | 0.863c | 0.796c | 0.796c | 0.954c | ||
| TGFB3 | -0.282 | 0.720b | 0.418 | 0.832c | 0.764c | 0.665b | 0.630b | 0.850c | 0.920c | 0.776c | ||
| TGFBR1 | -0.033 | 0.092 | 0.418 | 0.110 | 0.076 | 0.604a | 0.107 | 0.34 | 0.279 | 0.082 | ||
| TGFBR2 | -0.298 | 0.861c | 0.832c | 0.110 | 0.900c | 0.457 | 0.857c | 0.902c | 0.943c | 0.928c | ||
| TGFBR3 | -0.499a | 0.945c | 0.764c | 0.076 | 0.900c | 0.617b | 0.849c | 0.801c | 0.883c | 0.968c | ||
| LTBP1 | -0.418 | 0.575a | 0.665b | 0.604a | 0.457 | 0.617b | 0.469 | 0.497a | 0.617b | 0.554a | ||
| LTBP2 | -0.395 | 0.863c | 0.630b | 0.107 | 0.857c | 0.849c | 0.469 | 0.784c | 0.758c | 0.893c | ||
| LTBP3 | -0.228 | 0.796c | 0.850c | 0.340 | 0.902c | 0.801c | 0.497a | 0.784c | 0.916c | 0.864c | ||
| LTBP4 | -0.334 | 0.796c | 0.920c | 0.279 | 0.943c | 0.883c | 0.617b | 0.758c | 0.916c | 0.891c | ||
| TGFB1I1 | -0.452 | 0.954c | 0.776c | 0.082 | 0.928c | 0.968c | 0.554a | 0.893c | 0.864c | 0.891c | ||
| Stromal Matrix and Marker | NR2F2 | -0.049 | 0.652b | 0.740c | 0.443 | 0.786c | 0.590a | 0.352 | 0.691b | 0.855c | 0.752c | 0.695b |
| COL1A1 | -0.436 | 0.944c | 0.661b | -0.077 | 0.822c | 0.936c | 0.479 | 0.859c | 0.718b | 0.745c | 0.926c | |
| COL3A1 | -0.398 | 0.959c | 0.676b | -0.017 | 0.863c | 0.946c | 0.488a | 0.884c | 0.737c | 0.761c | 0.930c | |
| FBN1 | -0.503a | 0.945c | 0.572a | 0.044 | 0.735c | 0.870c | 0.533a | 0.799c | 0.712b | 0.655b | 0.887c | |
| FBN2 | -0.039 | 0.057 | 0.249 | 0.815c | -0.147 | -0.043 | 0.632b | -0.071 | 0.113 | 0.038 | -0.036 | |
| FBN3 | 0.251 | -0.837c | -0.726c | -0.034 | -0.856c | -0.844c | -0.485a | -0.868c | -0.842c | -0.821c | -0.866c | |
| Steroidogenesis and growth factor signalling | INSL3 | -0.319 | 0.462 | 0.041 | -0.413 | 0.489a | 0.459 | 0.063 | 0.624b | 0.250 | 0.294 | 0.498a |
| CYP17A1 | -0.357 | 0.323 | -0.063 | -0.411 | 0.338 | 0.390 | 0.034 | 0.407 | 0.069 | 0.187 | 0.365 | |
| CYP11A1 | -0.338 | 0.333 | 0.026 | -0.356 | 0.428 | 0.379 | 0.047 | 0.508a | 0.160 | 0.257 | 0.395 | |
| HSD3B1 | -0.269 | 0.210 | -0.006 | -0.321 | 0.375 | 0.284 | 0.018 | 0.433 | 0.102 | 0.223 | 0.293 | |
| LHCGR | 0.060 | -0.570a | -0.717b | -0.159 | -0.607b | -0.579a | -0.425 | -0.459 | -0.769c | -0.719b | -0.597a | |
| AR | -0.455 | 0.898c | 0.868c | 0.298 | 0.866c | 0.942c | 0.720b | 0.762c | 0.874c | 0.930c | 0.929c | |
| RARRES1 | -0.094 | 0.579a | 0.336 | -0.108 | 0.489a | 0.490a | 0.082 | 0.680b | 0.480 | 0.348 | 0.537a | |
| IGFBP3 | -0.224 | 0.541a | 0.646b | 0.156 | 0.567a | 0.646b | 0.646b | 0.416 | 0.441 | 0.648b | 0.568a | |
Looking at the relationships between extracellular matrix genes, we found a very strong correlation between the three genes COL1A1, COL3A1 and FBN1 and a strong positive correlation of these three genes with NR2F2 (Table 2). All four genes were strongly negatively correlated with FBN3. FBN2 showed no correlation with any of the other extracellular matrix genes, but a negative correlation with the steroidogenic genes INSL3, CYP11A1, CYP17A1 and HSD3B1. NR2F2, COL1A1, COL3A1 and FBN1 were negatively correlated with LHCGR but positively with AR, whereas FBN3 showed the reverse pattern for these two genes. COL1A1, COL3A1 and FBN1 were positively correlated with RARRES1. Additionally the collagen genes also showed a positive correlation with IGFBP3. FBN3 on the other hand was negatively correlated with RARRES1 and IGFBP3.
Table 2. Pearson’s correlation coefficients between levels of expression of genes for stromal matrix and marker with other genes for stromal matrix and marker and thecal cells and gestational age.
The darker the background colour the more significant the correlation is. Blue indicates a negative correlation and red indicates a positive correlation. (P-values: a < 0.05, b < 0.01, c < 0.001, d < 0.0001).
| Stromal Matrix and Marker | |||||||
|---|---|---|---|---|---|---|---|
| NR2F2 | COL1A1 | COL3A1 | FBN1 | FBN2 | FBN3 | ||
| Gestational age | 0.754c | 0.816d | 0.843d | 0.727c | -0.114 | -0.890d | |
| Stromal Matrix and Marker | NR2F2 | 0.543a | 0.585a | 0.527a | 0.122 | -0.631b | |
| COL1A1 | 0.543a | 0.964c | 0.908c | -0.093 | -0.833c | ||
| COL3A1 | 0.585a | 0.964c | 0.904c | -0.103 | -0.843c | ||
| FBN1 | 0.527a | 0.908c | 0.904c | 0.080 | -0.764c | ||
| FBN2 | 0.122 | -0.093 | -0.103 | 0.080 | 0.090 | ||
| FBN3 | -0.631b | -0.833c | -0.843c | -0.764c | 0.090 | ||
| Steroidogenesis and growth factor signalling | INSL3 | 0.170 | 0.442 | 0.508a | 0.463 | -0.503a | -0.509a |
| CYP17A1 | -0.018 | 0.296 | 0.403 | 0.334 | -0.563a | -0.336 | |
| CYP11A1 | 0.094 | 0.291 | 0.401 | 0.305 | -0.516a | -0.382 | |
| HSD3B1 | 0.057 | 0.173 | 0.284 | 0.151 | -0.512a | -0.296 | |
| LHCGR | -0.533a | -0.572a | -0.485a | -0.495a | -0.172 | 0.732c | |
| AR | 0.650b | 0.826c | 0.842c | 0.817c | 0.177 | -0.836c | |
| RARRES1 | 0.454 | 0.730c | 0.638b | 0.598a | -0.090 | -0.572a | |
| IGFBP3 | 0.366 | 0.535a | 0.558a | 0.460 | 0.004 | -0.600a | |
As expected, the genes for enzymes of the androgen synthesis pathway, CYP11A1, CYP17A1 and HSD3B1, were very strongly positively correlated (Table 3). AR showed a strong negative correlation with LHCGR, but a strong positive correlation with IGFBP3.
Table 3. Pearson’s correlation coefficients between transcript abundance levels of thecal cells and gestational age.
The darker the background colour the more significant the correlation is. Blue indicates a negative correlation and red indicates a positive correlation. (P-values: a < 0.05, b < 0.01, c < 0.001).
| Steroidogenesis and growth factor signalling | |||||||||
|---|---|---|---|---|---|---|---|---|---|
| INSL3 | CYP17A1 | CYP11A1 | HSD3B1 | LHCGR | AR | RARRES1 | IGFBP3 | ||
| Gestational age | 0.566a | 0.352 | 0.482 | 0.428 | -0.538a | 0.788c | 0.620b | 0.490a | |
| Thecal Cells | INSL3 | 0.886c | 0.955c | 0.904c | 0.063 | 0.275 | 0.196 | 0.211 | |
| CYP17A1 | 0.886c | 0.932c | 0.871c | 0.271 | 0.221 | -0.109 | 0.336 | ||
| CYP11A1 | 0.955c | 0.932c | 0.979c | 0.217 | 0.210 | -0.023 | 0.209 | ||
| HSD3B1 | 0.904c | 0.871c | 0.979c | 0.253 | 0.120 | -0.097 | 0.147 | ||
| LHCGR | 0.063 | 0.271 | 0.217 | 0.253 | -0.697b | -0.455 | -0.395 | ||
| AR | 0.275 | 0.221 | 0.210 | 0.120 | -0.697b | 0.355 | 0.679b | ||
| RARRES1 | 0.196 | -0.109 | -0.023 | -0.097 | -0.455 | 0.355 | 0.064 | ||
| IGFBP3 | 0.211 | 0.336 | 0.209 | 0.147 | -0.395 | 0.679b | 0.064 | ||
Transcript abundance relationships during gestation
Hierarchical clustering of the expression levels throughout gestation of 24 genes associated with thecal and stromal cells and TGFβ signalling in this study with 20 genes associated with germ cells, GREL cells and granulosa cells in another study [19], revealed three distinct clusters (Fig 4). Cluster 1 contained genes which were highly expressed in the first trimester compared to the other two trimesters. This included the pluripotency marker OCT4, the stem cell marker LGR5, the desmosomal protein DSG2, genes connected with steroids, CYP19A1, ESR2, NR5A1 and LHCGR, extracellular matrix associated genes FBN3 and TGFB1, the cell cycle gene CCND2, and GATA4. Cluster 2 included genes which showed low expression during the first and second trimester and higher expression during the third trimester. These genes were associated with granulosa cells (FSHR, INHBA, AMH and IGFBP3) and thecal cells (CYP17A1, CYP11A1, HSD3B1 and INSL3) of growing follicles. Genes of cluster 3 also showed very low expression in the first trimester and then the expression increased in trimester 2 and remained high until the end of gestation. The majority of genes in this cluster were associated with stroma (NR2F2, COL3A1, COL1A1, FBN1) and TGFβ-signalling (TGFB2 and 3, LTBP2-4, TGFBR2 and 3, TGFB1I1). Furthermore, the stem cell marker ALDH1A1, as well as the two steroidogenic receptors, AR and ESR1, had similar expression profiles. The remaining genes—germ cell markers DAZL and VASA, granulosa cell marker FOXL2, Wnt/β-catenin pathway genes WNT2B and CTNNB1, and KRT19, RARRES1 and the stroma-related genes FBN2, TGFBR1 and LTBP1 showed no defined pattern of expression that was either similar to other genes nor specific for any particular phase/developmental stage. DAZL and VASA were, however, elevated briefly in week 11 samples.
Fig 4. Heatmap of hierarchical clustering of transcript abundance in fetal ovaries throughout gestation.
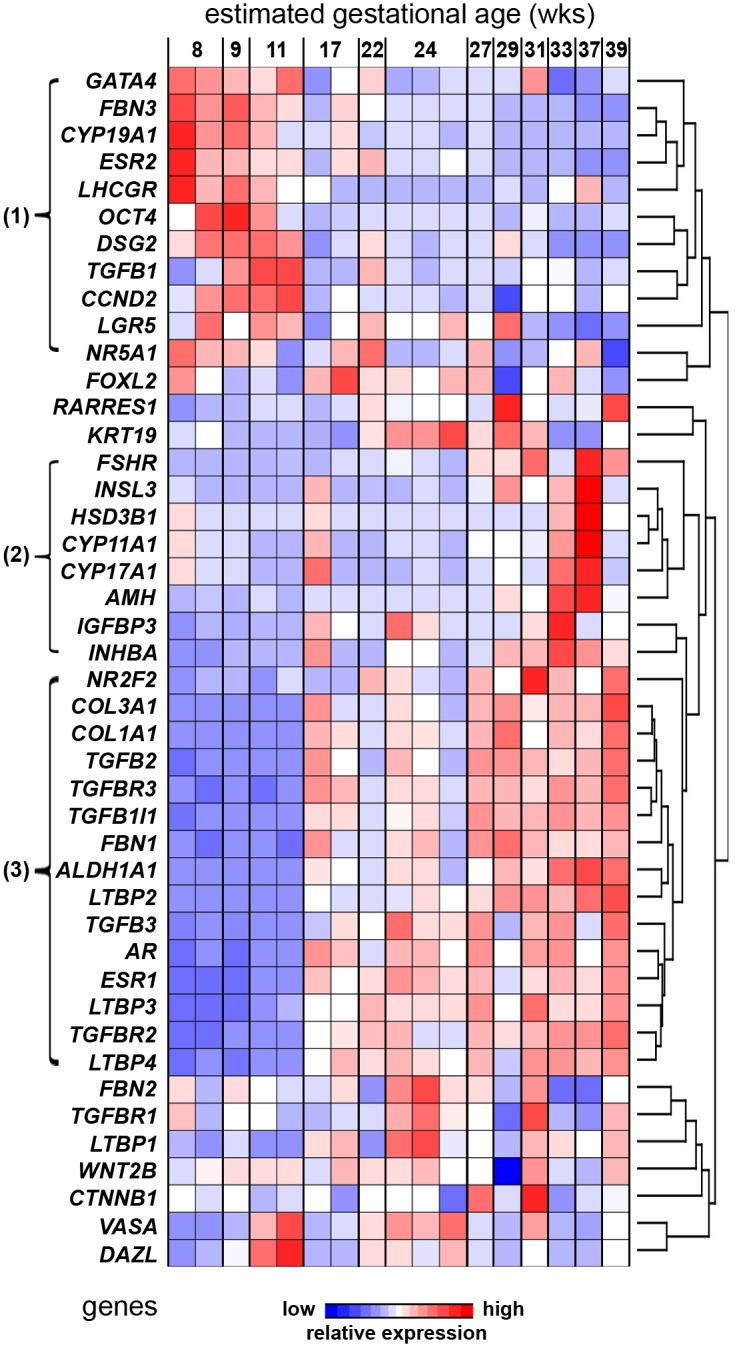
Hierarchical clustering analysis by transcript abundance only (rows) using q-PCR data of 44 genes (gene symbols on left) in n = 16–17 fetal ovaries (one per animal), from 8–39 weeks of gestation (left to right across the top). The raw data were first normalized by adjusting the mean expression across all samples for each gene to zero and the standard deviation to one. The genes were then clustered using the Euclidian algorithm for dissimilarity with average linkage in Partek Genomics Suite ™ (dendrogram on far right). Three transcript abundance clusters were identified as indicated by numbers and brackets on far left.
Correlation analyses were conducted on the expression levels of 24 genes associated thecal and stromal cells from this study with 20 genes associated with germ cells, GREL cells and granulosa cells in another study [27] and with day of gestation (S2 Table). After correlation values between genes were identified and regardless if they were positive or negative correlations, a network graph was plotted using the qgraph R package [28] using an adjacent matrix (Fig 5). Genes in each of clusters 2 and 3 were highly and closely correlated with each other whereas the genes in cluster 1 were less closely correlated with each other (Fig 5, S2 Table). Genes in clusters 1 and 2 were also closely, but negatively, correlated with each other (Fig 5, S2 Table).
Fig 5. An adjacent matrix network graph using correlation coefficients from S2 Table.

The closeness of the genes and the thickness of the interconnecting lines indicate stronger correlations between genes. Age is age of gestation. Green are cluster 1 genes, blue are cluster 2 genes and yellow are cluster 3 genes identified in Fig 4.
Discussion
The transcript abundance in whole ovaries of a number of genes in the developing bovine ovary were measured across gestation. Whilst we focused on 24 genes likely expressed in stroma we also compared these with 20 additional genes associated with germ cells, GREL cells and granulosa cells published previously [19]. We performed hierarchical clustering, and correlation and network analyses, looking for relationships between genes and gestational age. The genes associated into three clusters based upon their expression patterns, and new positive and negative relationships were identified.
Cluster 1 contained genes which were highly expressed in the first trimester compared to the last two trimesters. The genes in cluster 1 were of mixed function and were closely, but negatively, correlated with those in cluster 2 and were less closely correlated with each other than the genes in cluster 2 were. They included the pluripotency marker OCT4, the stem cell marker LGR5, the desmosomal protein DSG2, genes connected with steroid synthesis, action or regulation, such as CYP19A1, ESR2, and LHCGR, extracellular matrix associated genes FBN3 and TGFB1, the cell cycle gene CCND2, and the transcription factors NR5A1 and GATA4 which are important for development and differentiation of cells in the ovary. During the first trimester when the cluster 1 genes are highly expressed the stroma is penetrating into the cortex from the medulla and is expanding at its fastest rate [3]. Both NR5A1 and FBN3 are expressed in the stromal cells [1,6]. It is possible that both of these genes and other genes in cluster 1 are involved in the stromal development.
Cluster 2 included genes which showed low expression during the first and second trimester, rising during the third trimester. These genes were associated with follicle formation, activation and maturation including those expressed in granulosa cells (FSHR, INHBA, AMH and IGFBP3), and in thecal cells (CYP17A1, CYP11A1, HSD3B1 and INSL3). Thus, the cluster 2 genes clearly represent the periods when follicle activation and growth has commenced at least to the stage of thecal cell differentiation. Follicle growth clearly does not go beyond the thecal formation stage as there were no increases in CYP19A1 in the third trimester.
Genes of cluster 3 showed very low expression in the first trimester which then increased in trimester 2 and remained high until the end of gestation. Members of this cluster have been shown to be localised to stroma and included transcription factors AR [29] and NR2F2 [1], and the extracellular matrix genes COL3A1, COL1A1 and FBN1 [1]. They also included TGFβ-signalling genes (TGFB2 and 3, LTBP2-4, TGFBR2 and 3, TGFB1I1). Since TGFβ-signalling is important in stromal cell proliferation and collagen synthesis [30–34], these genes are likely involved in the steady expansion of stroma and the increase in collagen synthesis that occurs in the medulla and in the cortex of the ovary [3] at occurs during the latter part of gestation. Furthermore, the enzyme involved in retinoic acid synthesis, ALDH1A1, as well as the oestrogen receptor alpha, ESR1, showed similar expression profiles. ALDH1A1 was a little different to the other cluster 3 genes in that if continued to rise in the third trimester.
These results provide valuable insights into fetal ovary development. The expression of AR and a number of TGFβ-signalling molecules in the current study were highly correlated with each other and formed cluster 3. Their expression first increased at day 119 a time when ovigerous cords are breaking down and follicles are beginning to form [27]. Potentially important is that one of the genes in cluster 3 is common to both AR and TGFβ-signalling pathways, TGFB1I1 (TGFβ1 induced transcript 1 protein), also known as hic-5 and which is in fact an AR coactivator protein [35]. That these pathways intersect and have highly correlated levels of expression suggests that these signalling pathways are related and may in fact control the ovarian stroma in the latter part of gestation.
The remaining genes that were not part of the three gene clusters—germ cell markers DAZL and VASA, Wnt/β-catenin pathway genes WNT2B and CTNNB1, KRT19, RARRES1 and the stroma-related genes FBN2, TGFBR1 and LTBP1—showed no particular expression patterns similar to other genes nor specific for any particular phase/developmental stage.
The results could also provide insight into the fetal origins of PCOS. Three of the PCOS-associated genes [36] FBN3, LHCGR and GATA4 in cluster 1 were highly positively correlated with each other and highly expressed in the first trimester. FSHR is also associated with PCOS, and was negatively correlated with these three genes and highly expressed with other follicle-associated genes in cluster 3 at the end of gestation. These relationships are illuminating. GATA4 [37–41], LHCGR [42] and FSHR [43] are expressed and play important roles in adult ovaries and it is likely that their role in PCOS could be interpreted in the light of these adult functions. However, given that there is also a fetal origin of PCOS [44] it is possible that their contribution to the PCOS ovary phenotype is via their expression in the fetal ovary, as has been proposed for FBN3 [6]. The other results that bear upon PCOS are those of expression of the AR and TGFβ-signalling. TGFβ-signalling is important for stimulating stromal growth and expression of collagens [30–34] and the PCOS ovarian phenotype is characterised by substantially increased cortical and medullary stroma and collagen [8,9]. TGFβ-signalling in the fetal ovary has been suggested previously to be involved in the PCOS ovary phenotype [6,44]. Androgen signalling and indeed AR expression have been demonstrated in numerous animal models to be important for developing a PCOS phenotype [16].
Conclusions
The development of the ovary appears to undergo three major phases based upon transcript abundance. The early phase during which the stroma is actively replicating and expanding is characterised by expression of some genes related to PCOS, including FBN3, LHCGR and GATA4. In an intermediate stage the expression of stromal genes suggests that it has matured to express structural collagens and fibrillins associated with adult tissues, and under the control of TGFβ signalling and perhaps androgens. In the third phase the follicles have formed and some have commenced growth. The identification of the first two phases suggests that stroma is clearly dynamic during growth and development of the ovary and abnormalities may impact on the development of later reproductive pathologies.
Supporting information
(PDF)
The darker the background colour the more significant the correlation is. Blue indicates a negative correlation and red indicates a positive correlation. (P-values: a < 0.05, b < 0.01, c < 0.001, d < 0.0001).
(PDF)
Transcript abundance of markers specific for TGF-β signalling graphed by trimester (n = 16 and 17 animals respectively). Mean ± SEM are shown and statistical differences between trimesters are shown as *, **, ***, or ****, indicating P < 0.05, P < 0.01, P < 0.001 or P < 0.0001, respectively.
(TIF)
Transcript abundance of markers of thecal steroidogenesis and growth factor signalling graphed by trimester (n = 16 and 17 animals respectively). Mean ± SEM are shown and statistical differences between trimesters are shown as **, ***, or ****, indicating P < 0.01, P < 0.001 or P < 0.0001, respectively.
(TIF)
Transcript abundance of markers of thecal steroidogenesis and growth factor signalling graphed by trimester (n = 16 and 17 animals respectively). Mean ± SEM are shown and statistical differences between trimesters are shown as *, **, or ***, indicating P < 0.05, P < 0.01 or P < 0.001, respectively.
(TIF)
Data are presented as normalised transcript abundance to RPL32 and PPIA. Spearman’s correlation coefficient (R) test was used to analyse data.
(TIF)
Acknowledgments
We would like to thank Thomas Foods International, Murray Bridge, SA, Australia, for the supply of fetal bovine ovaries and Mrs. Wendy Bonner for the collection of these tissues from the abattoir.
Data Availability
All relevant data are within the manuscript and its Supporting Information files.
Funding Statement
Funding support for this research was obtained from the National Health and Medical Research Council of Australia (to RJR), the University of Adelaide (to RJR), and the Australian Research Council (to VP). The funders had no role in study design, data collection and analysis, decision to publish, or preparation of the manuscript.
References
- 1.Hummitzsch K, Irving-Rodgers HF, Hatzirodos N, Bonner W, Sabatier L, Reinhardt DP, et al. A new model of development of the mammalian ovary and follicles. PLoS One 2013; 8: e55578 10.1371/journal.pone.0055578 [DOI] [PMC free article] [PubMed] [Google Scholar]
- 2.Wrobel KH, Suss F Identification and temporospatial distribution of bovine primordial germ cells prior to gonadal sexual differentiation. Anat Embryol (Berl) 1998; 197: 451–467. [DOI] [PubMed] [Google Scholar]
- 3.Hartanti MD, Hummitzsch K, Irving-Rodgers HF, Bonner WM, KJ C, Anderson RA, et al. Morphometric and gene expression analyses of stromal expansion during bovine fetal ovarian development. Reprod Fert Devel (in press) 2018: (in press). [DOI] [PubMed] [Google Scholar]
- 4.Irving-Rodgers HF, Rodgers RJ (2007) Extracellular matrix in ovarian follicular and luteal development In: Gonzalez-Bulnes A, editor. Novel Concepts in Ovarian Endocrinology. India: Transworld Research Network; pp. 83–112. [Google Scholar]
- 5.Prodoehl MJ, Irving-Rodgers HF, Bonner WM, Sullivan TM, Micke GC, Gibson MA, et al. Fibrillins and latent TGFbeta binding proteins in bovine ovaries of offspring following high or low protein diets during pregnancy of dams. Mol Cell Endocrinol 2009; 307: 133–141. 10.1016/j.mce.2009.03.002 [DOI] [PubMed] [Google Scholar]
- 6.Hatzirodos N, Bayne RA, Irving-Rodgers HF, Hummitzsch K, Sabatier L, Lee S, et al. Linkage of regulators of TGF-beta activity in the fetal ovary to polycystic ovary syndrome. FASEB J 2011; 25: 2256–2265. 10.1096/fj.11-181099 [DOI] [PMC free article] [PubMed] [Google Scholar]
- 7.Bastian NA, Bayne RA, Hummitzsch K, Hatzirodos N, Bonner WM, Hartanti MD, et al. Regulation of fibrillins and modulators of TGFbeta in fetal bovine and human ovaries. Reproduction 2016; 152: 127–137. 10.1530/REP-16-0172 [DOI] [PubMed] [Google Scholar]
- 8.Stein IF, Leventhal ML Amenorrhea associated with bilateral polycystic ovaries. American Journal of Obstetrics and Gynecology 1935; 29: 181–191. [Google Scholar]
- 9.Hughesdon PE Morphology and morphogenesis of the Stein-Leventhal ovary and of so-called "hyperthecosis". Obstet Gynecol Surv 1982; 37: 59–77. [DOI] [PubMed] [Google Scholar]
- 10.Nelson VL, Legro RS, Strauss JF 3rd, McAllister JM Augmented androgen production is a stable steroidogenic phenotype of propagated theca cells from polycystic ovaries. Mol Endocrinol 1999; 13: 946–957. 10.1210/mend.13.6.0311 [DOI] [PubMed] [Google Scholar]
- 11.Nelson VL, Qin KN, Rosenfield RL, Wood JR, Penning TM, Legro RS, et al. The biochemical basis for increased testosterone production in theca cells propagated from patients with polycystic ovary syndrome. J Clin Endocrinol Metab 2001; 86: 5925–5933. 10.1210/jcem.86.12.8088 [DOI] [PubMed] [Google Scholar]
- 12.Carthy JM TGFbeta Signalling and the Control of Myofibroblast Differentiation: Implications for Chronic Inflammatory Disorders. J Cell Physiol 2017. [DOI] [PubMed] [Google Scholar]
- 13.Castellone MD, Laukkanen MO TGF-beta1, WNT, and SHH signaling in tumor progression and in fibrotic diseases. Front Biosci (Schol Ed) 2017; 9: 31–45. [DOI] [PubMed] [Google Scholar]
- 14.Davies MJ, March WA, Willson KJ, Giles LC, Moore VM Birthweight and thinness at birth independently predict symptoms of polycystic ovary syndrome in adulthood. Hum Reprod 2012; 27: 1475–1480. 10.1093/humrep/des027 [DOI] [PubMed] [Google Scholar]
- 15.Padmanabhan V, Veiga-Lopez A Animal models of the polycystic ovary syndrome phenotype. Steroids 2013; 78: 734–740. 10.1016/j.steroids.2013.05.004 [DOI] [PMC free article] [PubMed] [Google Scholar]
- 16.Walters KA Role of androgens in normal and pathological ovarian function. Reproduction 2015; 149: R193–218. 10.1530/REP-14-0517 [DOI] [PubMed] [Google Scholar]
- 17.Abbott DH, Barnett DK, Bruns CM, Dumesic DA Androgen excess fetal programming of female reproduction: a developmental aetiology for polycystic ovary syndrome? Hum Reprod Update 2005; 11: 357–374. 10.1093/humupd/dmi013 [DOI] [PubMed] [Google Scholar]
- 18.Hague WM, Adams J, Rodda C, Brook CG, de Bruyn R, Grant DB, et al. The prevalence of polycystic ovaries in patients with congenital adrenal hyperplasia and their close relatives. Clin Endocrinol (Oxf) 1990; 33: 501–510. [DOI] [PubMed] [Google Scholar]
- 19.Hummitzsch K, Hatzirodos N, Irving-Rodgers HF, Hartanti MD, Perry VE, Anderson RA, et al. Morphometic analyses and gene expression related to germ cells, GREL cells and granulosa cells during development of the bovine fetal ovary. Plos One 2018. [DOI] [PMC free article] [PubMed] [Google Scholar]
- 20.Kagawa N, Silber S, Kuwayama M Successful vitrification of bovine and human ovarian tussue. Reprod Biomed Online 2009; 18: 568–577. [DOI] [PubMed] [Google Scholar]
- 21.Adams GP, Pierson RA Bovine model for study of ovarian follicular dynamics in humans. Theriogenology 1995; 43: 113–120. [Google Scholar]
- 22.Hua J, Xu B, Yang Y, Ban R, Iqbal F, Cooke HJ, et al. Follicle Online: an integrated database of follicle assembly, development and ovulation. Database (Oxford) 2015; 2015: bav036. [DOI] [PMC free article] [PubMed] [Google Scholar]
- 23.Russe I Oogenesis in cattle and sheep. Bibl Anat 1983; 24: 77–92. [PubMed] [Google Scholar]
- 24.Irving-Rodgers HF, Harland ML, Sullivan TR, Rodgers RJ Studies of granulosa cell maturation in dominant and subordinate bovine follicles: novel extracellular matrix focimatrix is co-ordinately regulated with cholesterol side-chain cleavage CYP11A1. Reproduction 2009; 137: 825–834. 10.1530/REP-08-0485 [DOI] [PubMed] [Google Scholar]
- 25.Epskamp S, Cramer AOJ, Waldorp LJ, Schmittmann VD, Borsboom D qgraph: Network Visualizations of Relationships in Psychometric Data. J Stat Softw 2012; 48: 18. [Google Scholar]
- 26.Glister C, Satchell L, Bathgate RA, Wade JD, Dai Y, Ivell R, et al. Functional link between bone morphogenetic proteins and insulin-like peptide 3 signaling in modulating ovarian androgen production. Proc Natl Acad Sci U S A 2013; 110: E1426–1435. 10.1073/pnas.1222216110 [DOI] [PMC free article] [PubMed] [Google Scholar]
- 27.Hummitzsch K, Irving-Rodgers HF, Schwartz J, Rodgers RJ (2018) Development of the Mammalian Ovary and Follicles In: Leung PCK, Adashi E, editors. The Ovary. 3 ed: Academic Press. [Google Scholar]
- 28.Epskamp S, Cramer AO, Waldorp LJ, Schmittmann VD, Borsboom D qgraph: Network visualizations of relationships in psychometric data. Journal of Statistical Software 2012; 48: 18. [Google Scholar]
- 29.Fowler PA, Anderson RA, Saunders PT, Kinnell H, Mason JI, Evans DB, et al. Development of steroid signaling pathways during primordial follicle formation in the human fetal ovary. J Clin Endocrinol Metab 2011; 96: 1754–1762. 10.1210/jc.2010-2618 [DOI] [PubMed] [Google Scholar]
- 30.Govinden R, Bhoola KD Genealogy, expression, and cellular function of transforming growth factor-beta. Pharmacol Ther 2003; 98: 257–265. [DOI] [PubMed] [Google Scholar]
- 31.Verrecchia F, Mauviel A TGF-beta and TNF-alpha: antagonistic cytokines controlling type I collagen gene expression. Cell Signal 2004; 16: 873–880. 10.1016/j.cellsig.2004.02.007 [DOI] [PubMed] [Google Scholar]
- 32.Chapman HA Disorders of lung matrix remodeling. J Clin Invest 2004; 113: 148–157. 10.1172/JCI20729 [DOI] [PMC free article] [PubMed] [Google Scholar]
- 33.Christner PJ, Ayitey S Extracellular matrix containing mutated fibrillin-1 (Fbn1) down regulates Col1a1, Col1a2, Col3a1, Col5a1, and Col5a2 mRNA levels in Tsk/+ and Tsk/Tsk embryonic fibroblasts. Amino Acids 2006; 30: 445–451. 10.1007/s00726-005-0265-y [DOI] [PubMed] [Google Scholar]
- 34.Kisseleva T, Brenner DA Fibrogenesis of parenchymal organs. Proc Am Thorac Soc 2008; 5: 338–342. 10.1513/pats.200711-168DR [DOI] [PMC free article] [PubMed] [Google Scholar]
- 35.Fujimoto N, Yeh S, Kang HY, Inui S, Chang HC, Mizokami A, et al. Cloning and characterization of androgen receptor coactivator, ARA55, in human prostate. J Biol Chem 1999; 274: 8316–8321. [DOI] [PubMed] [Google Scholar]
- 36.Jones MR, Goodarzi MO Genetic determinants of polycystic ovary syndrome: progress and future directions. Fertil Steril 2016; 106: 25–32. 10.1016/j.fertnstert.2016.04.040 [DOI] [PubMed] [Google Scholar]
- 37.Vaskivuo TE, Anttonen M, Herva R, Billig H, Dorland M, te Velde ER, et al. Survival of human ovarian follicles from fetal to adult life: apoptosis, apoptosis-related proteins, and transcription factor GATA-4. J Clin Endocrinol Metab 2001; 86: 3421–3429. 10.1210/jcem.86.7.7679 [DOI] [PubMed] [Google Scholar]
- 38.Kyronlahti A, Vetter M, Euler R, Bielinska M, Jay PY, Anttonen M, et al. GATA4 deficiency impairs ovarian function in adult mice. Biol Reprod 2011; 84: 1033–1044. 10.1095/biolreprod.110.086850 [DOI] [PMC free article] [PubMed] [Google Scholar]
- 39.Bennett J, Wu YG, Gossen J, Zhou P, Stocco C Loss of GATA-6 and GATA-4 in granulosa cells blocks folliculogenesis, ovulation, and follicle stimulating hormone receptor expression leading to female infertility. Endocrinology 2012; 153: 2474–2485. 10.1210/en.2011-1969 [DOI] [PMC free article] [PubMed] [Google Scholar]
- 40.Efimenko E, Padua MB, Manuylov NL, Fox SC, Morse DA, Tevosian SG The transcription factor GATA4 is required for follicular development and normal ovarian function. Dev Biol 2013; 381: 144–158. 10.1016/j.ydbio.2013.06.004 [DOI] [PMC free article] [PubMed] [Google Scholar]
- 41.Padua MB, Fox SC, Jiang T, Morse DA, Tevosian SG Simultaneous gene deletion of gata4 and gata6 leads to early disruption of follicular development and germ cell loss in the murine ovary. Biol Reprod 2014; 91: 24 10.1095/biolreprod.113.117002 [DOI] [PMC free article] [PubMed] [Google Scholar]
- 42.Huhtaniemi I, Zhang FP, Kero J, Hamalainen T, Poutanen M Transgenic and knockout mouse models for the study of luteinizing hormone and luteinizing hormone receptor function. Mol Cell Endocrinol 2002; 187: 49–56. [DOI] [PubMed] [Google Scholar]
- 43.Banerjee AA, Mahale SD Role of the Extracellular and Intracellular Loops of Follicle-Stimulating Hormone Receptor in Its Function. Front Endocrinol (Lausanne) 2015; 6: 110. [DOI] [PMC free article] [PubMed] [Google Scholar]
- 44.Raja-Khan N, Urbanek M, Rodgers RJ, Legro RS The role of TGF-beta in polycystic ovary syndrome. Reprod Sci 2014; 21: 20–31. 10.1177/1933719113485294 [DOI] [PMC free article] [PubMed] [Google Scholar]
Associated Data
This section collects any data citations, data availability statements, or supplementary materials included in this article.
Supplementary Materials
(PDF)
The darker the background colour the more significant the correlation is. Blue indicates a negative correlation and red indicates a positive correlation. (P-values: a < 0.05, b < 0.01, c < 0.001, d < 0.0001).
(PDF)
Transcript abundance of markers specific for TGF-β signalling graphed by trimester (n = 16 and 17 animals respectively). Mean ± SEM are shown and statistical differences between trimesters are shown as *, **, ***, or ****, indicating P < 0.05, P < 0.01, P < 0.001 or P < 0.0001, respectively.
(TIF)
Transcript abundance of markers of thecal steroidogenesis and growth factor signalling graphed by trimester (n = 16 and 17 animals respectively). Mean ± SEM are shown and statistical differences between trimesters are shown as **, ***, or ****, indicating P < 0.01, P < 0.001 or P < 0.0001, respectively.
(TIF)
Transcript abundance of markers of thecal steroidogenesis and growth factor signalling graphed by trimester (n = 16 and 17 animals respectively). Mean ± SEM are shown and statistical differences between trimesters are shown as *, **, or ***, indicating P < 0.05, P < 0.01 or P < 0.001, respectively.
(TIF)
Data are presented as normalised transcript abundance to RPL32 and PPIA. Spearman’s correlation coefficient (R) test was used to analyse data.
(TIF)
Data Availability Statement
All relevant data are within the manuscript and its Supporting Information files.