

Abstract
Protein structures are dynamic and can explore a large conformational landscape1,2. Only some of these structural substates are important for protein function (i.e. ligand binding, catalysis and regulation)3–5. How evolution shapes the structural ensemble to optimize a specific function is poorly understood>3,4. One of the constraints on the evolution of proteins is the stability of the folded ‘native’ state. Despite this, 44% of the human proteome contains intrinsically disordered (ID) peptide segments >30 residues in length6, the majority of which have no known function7–9. Here we show that the entropic force produced by an ID carboxy-terminus (ID-tail) shifts the conformational ensemble of human UDP-α-D-glucose-6-dehydrogenase (hUGDH) toward a substate with a high affinity for an allosteric inhibitor. The function of the ID-tail does not depend on its sequence or chemical composition. Instead, the affinity enhancement can be accurately predicted based on the length of the ID segment and is consistent with the entropic force generated by an unstructured peptide attached to the protein surface10–13. Our data show that the unfolded state of the ID-tail rectifies the dynamics and structure of hUGDH to favor inhibitor binding. Because this entropic rectifier does not have any sequence or structural constraints, it is an easily acquired adaptation. This model implies that evolution selects for disordered segments to tune the energy landscape of proteins, which may explain the persistence of ID in the proteome.
ID segments can exhibit complex functions such as ligand binding, the scaffolding of multi-protein complexes and mediating allosteric regulation14–18. However, many ID segments are assumed to be nonfunctional and are often removed from proteins to facilitate structural studies. For example, the 30-residue disordered C-terminus of hUGDH (residues 465–494) is often removed with no apparent impact on kinetic parameters19. Here, we show that this C-terminal segment (called the ‘ID-tail’) plays a novel role in the allosteric mechanism of hUGDH. hUGDH catalyzes the NAD+-dependent oxidation of UDP-α-D-glucose (UDP-Glc) to UDP-α-D-glucuronic acid19 and is regulated by the allosteric feedback inhibitor UDP-α-D-Xylose (UDP-Xyl)20,21. Three hUGDH dimers associate to form an inactive hexamer (E*)22–26 (Fig. 1a, b). The binding of substrate induces an allosteric switch (T131-loop/α6 helix) in the E* hexamer to isomerize into the active state (E)22,23,26,27 (Fig. 1a, c-e). The allosteric inhibitor UDP-Xyl competes with UDP-Glc for the active sites, and upon binding, triggers the allosteric switch to produce the inhibited state (EΩ)22,24,25,27. This inhibition mechanism is atypical in that the active site also functions as an allosteric site to control the structure and activity of the hexamer22–27 (Fig. 1a, c-e). The EΩ state has a high affinity for UDP-Xyl and a low affinity for UDP-Glc22,27. Because of this, the allosteric transition of the inhibited EΩ hexamer to the E state can be observed as cooperativity in substrate saturation curves22,27. We compared the structure and activity of full-length hUGDH (hUGDHFL) to a construct lacking the ID-tail (hUGDHΔID). The structures of E* states of hUGDHFL and hUGDHΔID were solved in isomorphous crystal lattices and revealed no significant differences (Extended Data Fig. 1a-c). hUGDHFL and hUGDHΔID also have a similar kcat and Km for both substrate and coenzyme, consistent with earlier reports19 (Extended Data Table 2). In contrast, the allosteric response is sensitive to the ID-tail; deletion of the ID-tail reduces the affinity for UDP-Xyl by an order of magnitude (Fig. 1f). The fact that inhibited hUGDHΔID still binds UDP-Glc cooperatively shows that the deletion of the ID-tail reduces UDP-Xyl affinity but does not prevent the formation of the EΩ hexamer (Fig. 1f and Extended Data Fig. 2a, b).
Figure 1|. The role of the ID-tail in allosteric inhibition of hUGDH.
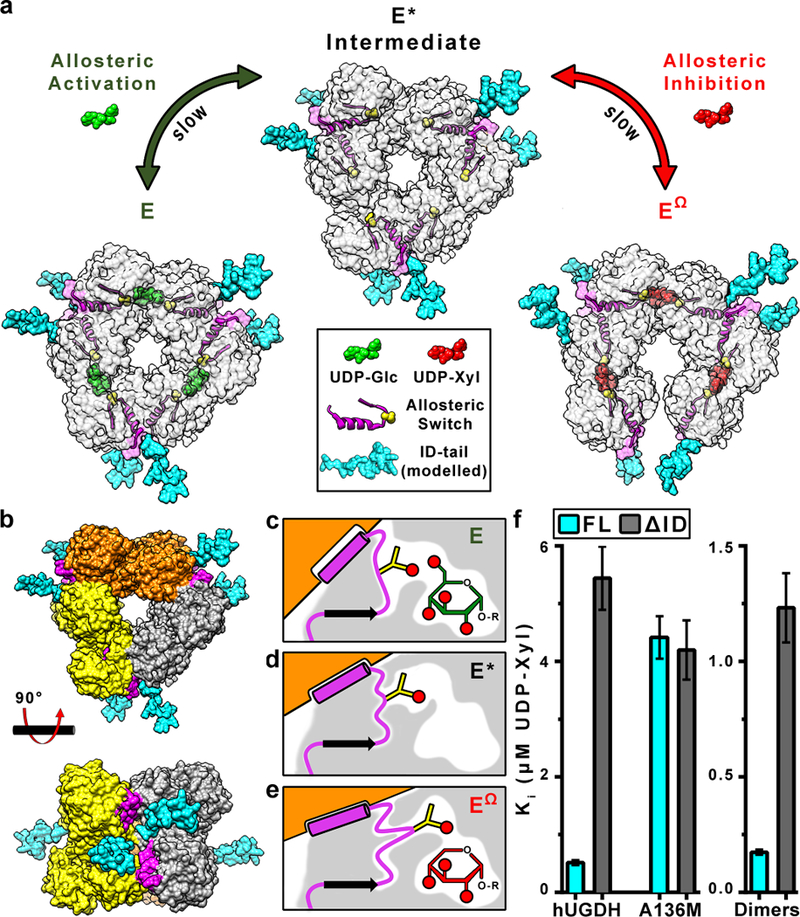
a, Unliganded hUGDH forms an inactive (E*) hexamer. UDP-Glc (green) induces the Thr131-loop/α6 allosteric switch (yellow spheres and magenta ribbons/surface) to slowly isomerize into the active (E) state. UDP-Xyl (red) competes with UDP-Glc for the active site, and induces the allosteric switch to slowly isomerize into the inhibited (EΩ) state. The slow isomerizations are due to the repacking of the allosteric switch in the protein core22,24,25,27. Because the ID-tail is disordered in the E, E* and EΩ states (Extended Data Fig. 1 and22,24–26), we have modeled energy minimized conformations of the ID-tail (cyan) onto the structures of hUGDH to depict the proximity to the active site, hexamer-building interface and the allosteric switch. b, Top and side view of the hUGDH E* hexamer that forms from the association of three dimers (orange, grey, yellow)22–27. The ID-tail of each dimer is located near two allosteric switches in the hexamer-building interface. c-e, The allosteric switch (magenta) is buried in the protein core (grey shading), which changes conformation in the E, E* and EΩ states. The Thr131 (yellow sticks) responds to the presence or absence of the C6’OH in UDP-Glc (green) or UDP-Xyl (red), respectively. This response shifts the α6 helix (magenta cylinder) in the hexamer building interface, which rotates the adjacent subunit (orange) to produce the E or EΩ hexamer, as appropriate. Red circles depict hydroxyl (OH) groups. f, The UDP-Xyl affinity depends on the ID-tail and allostery. Data are the globally fit Ki ± the standard error derived from 2 or 3 independent rate curves with varying amounts of inhibitor (n ≥ 31 independent data points; see Extended Data Table 2 for specific values).
Both the ID-tail and the α6 helix of the allosteric switch are located in the hexamer-building interface between adjacent dimers, suggesting that these two elements may work together to increase UDP-Xyl affinity (Fig. 1b). We used the allostery quenching A136M substitution to see if the ID-tail functions independently of the allosteric switch; this substitution has been shown to lock the allosteric switch and the hexamer in the low UDP-Xyl affinity, E state22. Inhibition studies show no significant difference in UDP-Xyl affinity between hUGDHFL-A136M and hUGDHΔID-A136M, which suggests that the ID-tail requires a functional allosteric switch and the EΩ state to enhance the affinity for UDP-Xyl (Fig. 1f).
The location of the α6 helix in the hexamer-building interface suggests that the oligomeric structure might be important for the function of the ID-tail (Fig. 1b). In fact, sedimentation velocity analyses shows that hUGDHΔID E* hexamer is slightly less stable than the hUGDHFL E* hexamer, which might explain the reduced UDP-Xyl affinity (Extended Data Fig. 3a). We tested the role of the hexamer using the M11 interfacial loop substitution, which prevents hexamer formation and stabilizes the dimer (hUGDHFL-dimer and hUGDHΔID-dimer)27. UDP-Xyl binds to the hUGDHFL-dimer with a 7-fold higher affinity than hUGDHΔID-dimer, which shows that the ID-tail enhanced affinity does not require the hexamer (Fig. 1f and Supplementary Information Section 1).
The ID-tail is highly conserved in vertebrate UGDHs (Fig. 2a). We examined the importance of primary structure by randomizing the native sequence to create two distinct ID-tails (hUGDHR1 and hUGDHR2) (Fig. 2b). Surprisingly, the hUGDHFL, hUGDHR1 and hUGDHR2 constructs have similar affinities for UDP-Xyl (Fig. 2c). Next, all six prolines in the ID-tail were substituted with serine (hUGDH-Pro) (Fig. 2b). Because serine and proline both promote disorder28,29, this substitution will conserve the unfolded state while disrupting any possible proline-specific interactions. Analysis of hUGDH-Pro shows that the prolines do not contribute to UDP-Xyl affinity (Fig. 2c). Since all of the above constructs conserve the positive charge of the native ID-tail (pI = 10.1), we created a negatively charged ID-tail (pI = 4.4) using lysine to serine substitutions (hUGDH-Lys) (Fig. 2b). Despite the charge switch, there is still no significant change in UDP-Xyl affinity (Fig. 2c). Finally, we show that the ID-tail can be replaced with polyserine (hUGDHSer) without significantly changing UDP-Xyl affinity (Fig. 2b, c). Thus, the conserved primary structure is not required for UDP-Xyl affinity but may have been selected for an additional, unrelated function in vivo (Fig. 2a). The absence of sequence constraints argues against any mechanism where the ID-tail specifically interacts with the inhibitor or the protein.
Figure 2|. Structural constraints of the ID-tail.
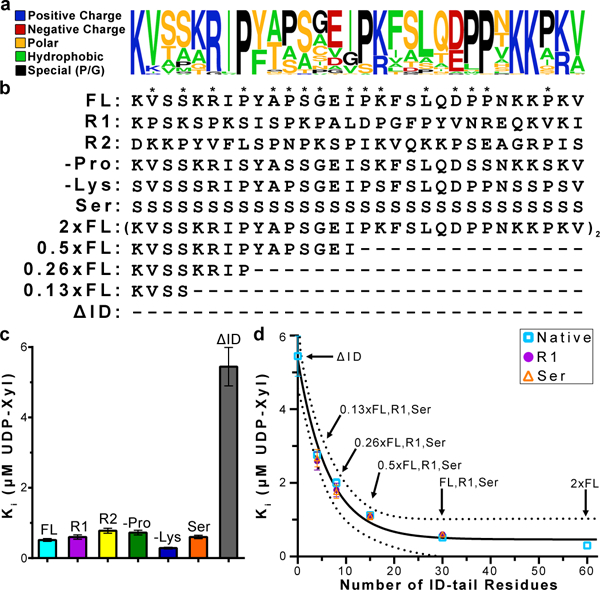
a, WebLogo (http://weblogo.berkeley.edu) representation of the 30-residue ID-tail sequence (res #: 465–494) from 79 vertebrate UGDHs (Extended Data Fig. 4a, b). Residues are colored according to type, and the height of each residue represents the relative frequency. b, Sequence modifications made to primary structure of the ID-tail (Extended Data Fig. 4b). Asterisks identify positions in sequence that are sampled with a proline residue in either hUGDHFL, hUGDHR1, or hUGDHR2. c, UDP-Xyl affinity is independent of the ID-tail sequence. Data are the globally fit Ki ± the standard error derived from 2 or 3 independent rate curves with varying amounts of inhibitor. See Extended Data Table 2 for the specific number of independent data points (n ≥ 27). d, The affinity for UDP-Xyl depends on the length of the ID-tail. Data are the globally fit Ki ± the standard error derived from 3 independent rate curves with varying amounts of inhibitor (n ≥ 38 independent data points; see Extended Data Table 2 for specific values). For some points the standard error is less than the dimensions of the data symbol. The data were fit to Equation 3(solid line) with 95% confidence intervals indicated (dashed lines). The fit predicts a maximum affinity of 0.46 ± 0.18 μM, corresponding to a free energy change of −1.45 kcal mol-1.
Next, we considered the possibility that the ID-tail might enhance UDP-Xyl affinity through a sequence-independent interaction involving the polypeptide backbone. Because the 6 prolines in the hUGDHFL, hUGDHR1 and hUGDHR2 ID-tails sample 16 unique positions throughout the sequence without altering UDP-Xyl affinity, it is unlikely that a backbone specific interaction is important for function (Fig. 2b, c). Still, if there is a backbone specific interaction, then a plot of affinity versus ID-tail length would reveal a jump discontinuity when the critical segment is removed. Inhibition studies comparing hUGDHFL, hUGDHΔID, and three new constructs with varying length ID-tails (hUGDH2×FL, hUGDH0.5×FL, and hUGDH0.26×FL, hUGDH0.13×FL) show that the affinity can be modeled as a simple exponential decay (Fig. 2b, d). We confirmed that this saturable effect is sequence independent using corresponding polyserine ID-tails (hUGDHSer, hUGDH0.5×Ser, hUGDH0.26×Ser, hUGDH0.13×Ser) and the scrambled R1 construct (hUGDHR1, hUGDH0.5×R1, hUGDH0.26×R1, hUGDH0.13×R1) (Fig. 2d). The fact that the native, polyserine and R1 variable length ID-tails give the same results in the dynamic range of Figure 2d should dispel any concerns of a sequence-specific mechanism. It is notable that hUGDH0.13×FL, hUGDH0.13×Ser and hUGDH0.13×R1 still enhance UDP-Xyl binding affinity; the conformations of these short, four-residue ID-tails are tightly constrained within a surface pocket, which should stabilize any weak structure (Fig. 3a). Still, none of the E, E* and EΩ hUGDHFL crystal structures (42 unique chains) show evidence of an ordered interaction within the pocket (Extended Data Fig. 1 and22,24–26).
Figure 3|. The entropic force of the ID-tail alters the structure of hUGDH.
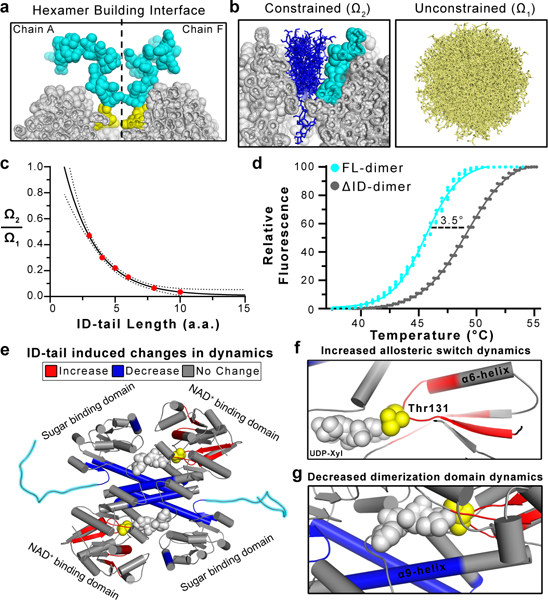
a, Cut-away of the hUGDH surface (grey spheres) at the hexamer building interface (dashed lines) depicting the modeled ID-tails (cyan and yellow spheres) from adjacent subunits (grey, Chains A and F). The volume exclusion effects of the hexamer building interface tightly constrains the conformations of the first four disordered residues (465–468) of the ID-tail (yellow). b, The left panel depicts a representative subset of the surface constrained conformations of a 10 residue ID-tail (blue sticks) from Monte Carlo sampling (see Methods for details). The adjacent ID-tail is shown as cyan spheres. The right panel is a representative sampling (tan sticks) of accessible conformations without surface constraints (also see Extended Data Figure 5). c, The fraction of constrained ID-tail conformations (Ω2) over the possible conformations of a free ID-tail (Ω1) exponentially converges with increasing ID-tail length. The data were fit to an exponential decay (Extended Data Fig. 5c). d, The ID-tail destabilizes hUGDH by 3.5 °C. e, Comparing HDX rates between hUGDHFL-dimer and hUGDHΔID-dimer using mass spectrometry shows that the ID-tail (cyan) alters the structure and dynamics of hUGDH. Peptides showing increases (red), decreases (blue) and no change (grey) in HDX rates are mapped to the structure. UDP-Xyl (grey spheres) was not used in the assay but is modeled in the active site. The Thr131 of the allosteric switch is shown as yellow spheres. f, Close-up view of the allosteric switch (Thr131/α6 helix), which shows an increase in HDX rates. g, Close-up view of the of the dimerization domain, which is largely solvent inaccessible. Data portrayed in e-g were derived from the normalized cumulative %D uptake comparing hUGDHFL-dimer and hUGDHΔID-dimer (Extended Data Figure 6).
The data presented thus far are strong evidence that the high affinity binding of UDP-Xyl is a function of the unfolded state of the ID-tail. An unstructured polymer tethered to a surface generates an entropic force at the point of attachment10–12 that can be strong enough to distort lipid bilayers30 and alter protein stability13. This force originates from the volume exclusion effects of the surface, which reduce the conformational entropy of the attached polymer (Fig. 3b). Since the entropy of the polymer increases with distance from the surface, the entropic force converges to a maximum value as the chain length increases10–12. The unfavorable change in free energy produced by constraining an unstructured, non-interacting peptide (ΔGconstrained) is:
| (Equation 1) |
where Ω1 is the sum of all possible states of an unconstrained peptide and Ω2 is the subset of states constrained by the protein surface and the adjacent ID-tail. Using Monte Carlo sampling of coarse grained, sterically allowed ϕ,ψ bins, we calculated the fraction of constrained conformations for various ID-tail lengths (see Methods, Fig. 3b and Extended Data Fig. 5). For this simulation, the adjacent ID-tail was held in a fixed conformation (Extended Data Fig. 5). If the conformational entropy of the ID-tail contributes to the change in UDP-Xyl affinity, then we would expect Ω2/Ω1 and the affinity constant Ki to show similar behavior with increasing length of the tail. Despite the simplicity of the Monte Carlo model, the simulations confirm that Ω2/Ω1 converges as the ID-tail length increases (Fig. 3c).
Previous studies have showed that the entropic force generated by a tethered polymer can alter protein stability13. We have carried out thermal denaturation studies of hUGDH dimers (chosen to avoid complications arising from hexamer dissociation), and we find that the high affinity hUGDHFL-dimer (Ki = 0.17 μM) is less stable than the low affinity hUGDHΔID-dimer (Ki = 1.23 μM) (Fig. 3d). The destabilizing effect of the ID-tail should also be reflected in the structure and dynamics of hUGDH. To examine these changes at the peptide level, we compared the hydrogen/deuterium exchange (HDX) rates of hUGDHFL-dimer and hUGDHΔID-dimer using mass spectrometry. As expected, the fragment corresponding to the ID-tail is fully exchanged in less than 120 s, which is consistent with a disordered peptide31 (Extended Data Fig. 6a). The ID-tail increases the HDX rates of several segments in NAD+ binding domain, with largest increases being observed in the allosteric switch and an adjacent peptide (Fig. 3e-g). An increase in HDX rates for a buried peptide like the allosteric switch and the surrounding segments indicates an increase in the overall dynamics of the domain. This is significant, because the binding of UDP-Xyl induces the allosteric switch and surrounding core residues to change conformation and repack into the high affinity EΩ state22,27 (Fig. 1a, c-e). The ID-tail also decreases the HDX rates of several segments in the dimerization and sugar binding domains, suggesting that these areas become more structured (Fig. 3e, g). The largest decrease is seen for the α9 helix of the dimerization domain (residues 222–240). This helix is largely solvent inaccessible in crystal structures, which suggests that the ID-tail reduces the overall dynamics of the dimer interface (Fig. 3g). Overall, the data show that the cost of constraining the ID-tail destabilizes a low affinity substate, which biases the conformational ensemble toward a structurally and dynamically distinct high affinity substate. A simple exponential fit of the Ω2/Ω1 ratios in Figure 3c shows that the energetic cost of constraining the ID-tail converges to approximately 2.4 kcal mol−1 (Equation 1). Thus, our simple Monte Carlo model supports the argument that entropic confinement effects generate sufficiently strong forces to explain the maximum expected gain in UDP-Xyl binding affinity of −1.45 kcal/mol (Figs. 2d, 3c, and Extended Data Fig. 5). More rigorous calculations on other systems using simpler polymer models (and simpler confinement geometries), also find confinement free energy costs of this same magnitude32,33.
If the ID-tail favors the dynamics associated with the repacking of the allosteric switch into the EΩ state, then we would expect to see a difference in the activation (E* to E) and inhibition kinetics (E* to EΩ) (Fig. 1a). Pre-steady state analysis of progress curves shows that the ID-tail slows the rate of activation hysteresis (E* to E) by 39% (Fig. 4a). Next, we examined the UDP-Xyl induced isomerization of hUGDH to the EΩ state. Transient-state analysis of UDP-Xyl binding kinetics revealed a three-phase exponential decay of hUGDH time-resolved tryptophan fluorescence, and the data were globally fit by computer simulation (see Methods and Extended Data Fig. 7a-e). The same kinetic model produced the best fit for both hUGDHFL and hUGDHΔID and predicts UDP-Xyl affinities that are consistent with our steady state inhibition studies (Extended Data Figure 7):
| (Equation 2) |
Figure 4|. The ID-tail shapes the conformational landscape of hUGDH.
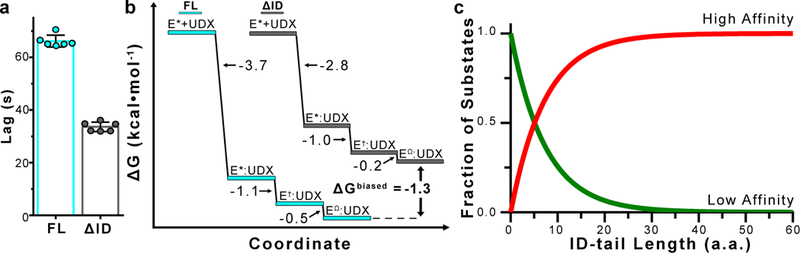
a, The ID-tail increases the hysteresis of allosteric activation (E* to E). Data are mean ± s.d. (n=6 independent experiments). b, Free energy plot of the transient-state kinetic model for the allosteric inhibition (Equation 2) of hUGDHFL (E*FL) and hUGDHΔID (E*ΔID). See Extended Data Figure 7e for errors derived from confidence contour analysis. The free energy for the initial binding step (2nd order) was determined using the standard state defined in units of mM, and the two isomerization steps (1st order) were calculated from Keq. d, Plot of the high and low affinity fractional components of Equation 3, showing the shift in states is a function of ID-tail length.
According to this model, UDP-Xyl binds to the E* state and induces two, sequential isomerizations. Based on the allosteric model, we had expected a single isomerization from E* to the EΩ state (Fig. 1a). We are calling the additional transient E†, which represents an intermediate between the E* to the EΩ states. The ID-tail changes the kinetic parameters of each transient observed in the time-resolved fluorescence (Extended Data Figure 7e). The largest effect of the ID-tail is a 4.4-fold enhancement of the initial UDP-Xyl binding step, corresponding to a −0.9 kcal mol−1 gain in affinity (Fig. 4b). The kinetic model predicts an overall favorable gain in binding affinity of −1.3 kcal mol−1, which agrees well with the observed gain of −1.39 kcal mol−1 (Fig. 4b and Extended Data Table 2). The different stabilities of the corresponding hUGDHFL and hUGDHΔID transients combined with the fact that the ID-tail slows activation hysteresis and accelerates inhibition kinetics, supports our conclusion that the ID-tail alters the energy landscape to favor UDP-Xyl inhibition (Fig. 4d).
Collectively, our data supports a model in which the entropic force of the ID-tail rectifies the energy landscape of hUGDH to favor a substate with a high affinity for UDP-Xyl. We can now interpret the exponential curve in Figure 2d as follows:
| (Equation 3) |
i) hUGDH exists as an ensemble of low affinity (Kiunbiased) and high affinity (Kibiased) substates; ii) the ID-tail functions as a length-dependent (l) entropic rectifier that biases (k) the distribution toward the high affinity substate; iii) the observed UDP-Xyl affinity results from a fractional summation of the low and high affinity substates at a given ID-tail length (Fig. 4d). The fit to Equation 3 produces a Kibiased of 0.46 ± 0.18 μM UDP-Xyl, which corresponds to a maximum favorable gain in binding energy of approximately −1.45 kcal mol-1. The lack of sequence constraints implies that the entropic force of any ID-segment is capable of shaping the conformational ensemble of a protein. In fact, an N-terminal hexahistidine affinity tag has been shown to alter the internal dynamics of a myoglobin34. Thus, the persistence of low complexity ID-segments in the proteome may reflect the selection for entropic rectifiers that can tune the function of a protein by shaping the native-state ensemble.
METHODS:
Protein expression, purification, and quantification of hUGDH constructs.
All hUGDH sequences were synthesized and cloned into pET-15b vectors (Norclone). Sequences contained an N-terminal hexahistidine affinity tag adjacent to a tobacco etch virus (TEV) cleavage site. The expression and purification of hUGDH constructs were conducted under identical conditions as previously described22–27. Following purification, the N-terminal hexahistidine tag was cleaved with TEV protease. An additional immobilized metal affinity column (IMAC) was used to obtain the pure, His tag free protein. Unless otherwise noted, all proteins were dialyzed into a storage buffer [25 mM Tris pH 8.0 and 50 mM NaCl] and concentrated to ≥ 20 mg/mL. Proteins were quantified in dilution replicates (N ≥ 6) using their respective molar extinction coefficients that is based on their specific amino acid composition35.
Protein crystallization, data collection, and structure solution.
To crystallize the E* conformation of hUGDHΔID, the protein (10.4 mg/mL) was dialyzed into 20 mM MES pH 5.6, 150 mM NaCl and crystallized at 20 °C using free interface diffusion in a 1.0 mm capillary containing 5 μL of 10.4 mg/mL enzyme and 200 μL of precipitant solution (100 mM MES pH 6.2, 100 mM MgCl2, and 16% PEG 3350). Crystals were cryoprotected in the precipitant solution supplemented with 18% glycerol and then plunged into liquid nitrogen. A 2.64 Å resolution data set was collected on the 22-ID beamline (SER-CAT) at the Argonne National Lab using an MAR 300 mm CCD detector. The data were processed in space group C2 using XDS36 and 5% of the data were set aside for cross-validation37. The crystal parameters and data collection statistics are summarized in Extended Data Table 1. The structure was solved by molecular replacement using the PHENIX software suite38 and hUGDH (PDB entry: 3TF5) as a search model. The structure was then subjected to iterative cycles of manual rebuilding using COOT39 and automated refinement using PHENIX with both NCS restraints38,40. B-factors were refined using TLS as implemented in PHENIX. Refinement statistics41,42 are summarized in Extended Data Table 1.
The EΩ hUGDHFL was crystallized in the presence of 5 mM UDP-xylose and 10 mM adenosine di-phosphate at 25 °C using the hanging drop vapor diffusion method. 1 uL of protein was mixed in a 1:1 ratio with reservoir solution (0.1 M HEPES pH 7.2, 14% 1–6-hexanediol, and 10% PEG 3350). Crystals were cryoprotected in the precipitant solution supplemented with 20% glycerol and then plunged into liquid nitrogen. A 2.0 Å resolution data set was collected on the 21-ID beamline (SER-CAT) at the Argonne National Laboratory (Argonne, IL) using a MAR 300 mm CCD detector. The data set was processed using XDS36 and 5% of the data were set aside for cross validation37. The data collection statistics are listed in Extended Data Table 1. The EΩ hUGDHFL structure was solved by molecular replacement using the Protein Data Bank (PDB) entry 2Q3E as a search model in PHENIX38, and refined as described above. Refinement statistics41,42 are summarized in Extended Data Table 1.
Steady state kinetics.
All steady state kinetic assays were conducted as previously described22–27. Briefly, assays contained either 100 nM hUGDH [FL, FL-A136M, ΔID, ΔID-A136M, R1, R2, -Pro, -Lys, 0.13×FL, 0.26×FL, 0.5×FL, 2×FL, 0.13×Ser, 0.26×Ser, 0.5×Ser, Ser, 0.13×R1, 0.26×R1, or 0.5×R1] or 500 nM hUGDH [FL-dimer, ΔID-dimer] in a standard reaction buffer [50 mM HEPES pH 7.5, 50 mM NaCl, and 5 mM EDTA] with either saturating amounts of NAD+ or UDP-Glucose (purchased from Sigma). Substrate and enzyme were incubated separately at 25 °C for 5 minutes, and then reactions were initiated by rapid mixing of both solutions. Progress curves were obtained by continuously monitoring NADH production at 340 nm (molar absorptivity coefficient of 6220 M−1cm−1) on an Agilent 8453 UV/Vis spectrometer equipped with a Peltier temperature controller (25 °C). hUGDH progress curves display hysteresis, thus the observed initial velocity (vi) represents a transient and does not satisfy steady state conditions. To obtain steady state initial velocities (vss), progress curves prior to the depletion of 10% substrate were fit to Frieden’s equation43 as in previous studies22,27,43:
| (Equation 4) |
where τ is the relaxation time of the lag, and the length of the lag is eτ. The vss was used for determination of hUGDH steady state kinetic parameters. Data were fit using nonlinear regression analysis in PRISM (GraphPad Software Inc., San Diego, CA).
Because the hUGDHFL-A136M, hUGDHΔID-A136M, hUGDHFL-dimer and hUGDHΔID-dimer constructs do not exhibit hysteresis, the observed initial velocity was used for the determination of steady state parameters as previously described22. UDP-Glc substrate saturation curves were fit to Equation 5.
| (Equation 5) |
As previously reported22,23,27, the NAD+ saturation curves of the hUGDH hexameric enzyme display negative cooperativity and were fit to sigmoidal rate equation (Equation 6) :
| (Equation 6) |
The determination of the Ki for the allosteric inhibitor UDP-Xylose has been previously described22,27. Briefly, data were globally fit to the model for competitive inhibition with cooperativity (Equation 7)using PRISM.
| (Equation 7) |
KM, kcat, and Ki were shared parameters in global fitting, while h was fit locally to each curve. The hUGDH dimers (hUGDHFL-dimer and hUGDHΔID-dimer) exhibited mixed inhibition with respect to both UDP-Glc and NAD+, and were globally fit to (Equation 8).
| (Equation 8) |
Here, Ki refers the competitive inhibition component, and αKi gives the noncompetitive contribution. KM, kcat, α and Ki were shared parameters global fitting.
Sedimentation velocity.
Sedimentation velocity analysis was conducted as previously described22–27. Briefly, hUGDH constructs were dialyzed >12 hr at 4 °C into (25 mM HEPES pH 7.5 and 150 mM KCl) and diluted to a final concentration of 9 μM. In ligand-bound studies, hUGDH constructs were dialyzed with comparable amounts of either substrate (UDP-Glc) or allosteric inhibitor (UDP-Xyl) for > 24 h. Samples were loaded into cells equipped with 12 mm double-sector Epon centerpieces and quartz windows. The cells were then loaded into an An60 Ti rotor and equilibrated to 20 °C for 1 h. Sedimentation velocity data were collected at 50,000 rpm in an Optima XLA analytical ultracentrifuge for 8–12 h. Data were recorded at 280 nm in radial step sizes of 0.003 cm. SEDNTERP44 was used to estimate the partial specific volume of all hUGDH constructs, and the buffer density (1.00726 g/mL) and viscosity (0.01018 P). SEDFIT45 was used to model and fit all data. Data were modeled as a continuous sedimentation coefficient (c(s)) distribution. The baseline, meniscus, frictional coefficient, and systematic time-invariant, and radial invariant noise were fit46. HYDROPRO47 was used to predict s-values based on crystal structures. The expected drag from the ID-tail was estimated by calculating the expected s-values from crystal structures with and without modeled, energy minimized ID-tails. The data fits for all experiments can be found in Extended Data Figure 3.
Evolutionary rate analysis.
79 UGDH sequences from vertebrates were used for analysis after removing redundancy at the organism level (only one UGDH sequence used per organism). The protein sequences were aligned using MUSCLE48, and rates of evolution at each alignment position was calculated under the JTT model49 using MEGA7 (log-likelihood method)50. The rates were normalized such that the average rate of evolution was 1.0 across the entire protein. Residue positions evolving faster than average show a rate greater than 1.0. In Extended Data Fig. 4, only the rates at alignment positions where the human UGDH did not have an indel were used.
Monte Carlo sampling.
The free energy cost of tethering an unstructured, non-interacting peptide to an impenetrable surface depends on the ratio of all constrained and unconstrained states:
| (Equation 1) |
Where R is the gas constant, T is temperature, Ω1 is the number of all possible states of an unconstrained, self-avoiding peptide and Ω2 is the number of the Ω1 states that do not conflict with the constraint imposed by the protein surface. To simplify, we used polyserine peptides, ignored sidechain entropy and used a hard sphere potential along with 166 coarse grained ϕ,ψ bins to calculate Ω1 and Ω2. Each bin represents a 10°×10° range of ϕ,ψ values of peptide conformations in the ‘allowed’ region of the original Ramachandran map (Extended Data Figure 5a, b). This calculation is nontrivial for large polymers, and an exhaustive grid search of all conformations was only conducted for the 3- and 4-residue ID-tails (Extended Data Figure 5c). We used the following Monte Carlo procedure to estimate the fraction of surface-constrained conformations (Ω2/Ω1) for each ID-tail. To determine the self-avoiding Ω1 mesostates, we randomly assigned one of the 166 ϕ,ψ bins to each ϕ,ψ torsion angle in the ID-tail and then looked for steric clashes within the conformer using the ‘outer limit’ for atomic clashes as described in the original Ramachandran map51. Next, each of Ω1 mesostates was analyzed for steric clashes with the surface or the adjacent ID-tail (Extended Data Figure 5d-l). Prior to the simulation, hydrogens were added to the hexamer structure using reduce program52, and an adjacent ID-tail was modeled in an extended conformation and fixed during the simulation (Extended Data Figure 5d-f). The simulation was stopped when a minimum of 124,000 self-avoiding conformers were analyzed and the ratio of surface-constrained conformations (Ω2/Ω1) reached convergence (Extended Data Figure 5c). The convergence threshold was defined as a change in the cumulative ratio of less than 10−5 within a window of 5000 trials. All runs reached convergence except for the 10-mer simulations, which only converged to 2 decimal places (Extended Data Figure 5c-l). We estimated the accuracy in our Monte Carlo simulations by comparing the results to the full grid search of the 3- and 4- residue ID-tails (Extended Data Figure 5c).
Thermodynamic shift assay.
Solutions of hUGDH [FL-dimer or ΔID-dimer] at 0.1 mg/mL were prepared with 5X SYPRO Orange ThemoFluor (ThermoFischer) in the standard reaction buffer (50 mM HEPES pH 7.5, 50 mM NaCl, and 5 mM EDTA). Samples were then briefly spun and allowed to equilibrate for 20 minutes. The thermal denaturation experiments were conducted in replicates (N ≥ 3) and data was acquired using a Bio-Rad MiniOpticon Real-Time qPCR machine. A fluorescence excitation spectrum wavelength between 470–505 nm and an emission spectrum between 540–570 nm were used. The fluorescence emission for each solution was recorded every 30 seconds as the temperature was increased from 25 to 80 °C (ramp speed of 0.5 °C/sec). Baselines were subtracted from the raw data using the buffer control experiments. Data were fit to a Boltzmann sigmoidal curve (Equation 8) to obtain the apparent TM values53.
| (Equation 9) |
Hydrogen-Deuterium Exchange Mass Spectrometry.
Studies have shown that Hydrogen-Deuterium Exchange (HDX) is an appropriate probe for protein dynamics and can illuminate differences between wild-type and mutant proteins54,55. HDX is a powerful tool for foot-printing the solvent accessible regions of a protein56, and was utilized in this study to compare structural and dynamic changes between the dimerized versions of hUGDH (hUGDHFL-dimer and hUGDHΔID-dimer).
Proteins were expressed and purified in the Wood Lab as previously described22–27. Proteins were then flash frozen and shipped overnight on dry ice to the Gross Lab at Washington University in St. Louis for HDX MS analysis. Protein solutions (2 μL) were continuously labeled at 25 °C by adding 20 μL of 10 mM HEPES buffer that contained 99.9% deuterium oxide (pD = 7.4). Samples were quenched by adding 33 μL of 8 M Guanidine Hydrochloride and 100 mM TCEP (final pH = 3.0) at 30 s, 1 min, 2 min, 15 min, 1 hr, and 2 hr time points57,58. One minute after quenching, samples were flash frozen in liquid nitrogen and stored for less than 36 hours at −80 °C. Control samples contained 10 mM HEPES in water rather than deuterium oxide. Each sample was thawed seconds prior to LC-MS analysis. On-line protein digestion was performed with a custom-packed pepsin column (2 mm x 20 mm) at a flow rate of 200 μL/min in 0.1% trifluoroacetic acid. For desalting, a Zorbax Eclipse XDB-C-8 trap column (2.1 × 15mm, 3.5 μm) was used to trap peptic peptides for 3 min. Following this, peptides were separated using a Hypersil Gold C-18 analytical column (2.1 × 50 mm, 2.5 μm), 4–80% gradient of acetonitrile with 0.1% formic acid (B), and a 100 μL/min flow rate. Peptides were detected using a LTQ XL Orbitrap mass spectrometer (Thermo Fisher Scientific), with a mass resolving power of 50000, m/z 400. Additional parameters were spray voltage of 5 kV, capillary temperature of 275 °C, capillary voltage of 49 V, and a tube lens of 163 V. All experiments were conducted in quadruplicate.
As a prelude to HDX, protein mapping was conducted by identifying pepsin-digested peptides. Product-ion mass spectra were collected in the data-dependent mode, picking the six most abundant ions from selected MS/MS. Peptides were identified using Mascot (Matrix Science, London, UK). Following HDX, mass spectra were analyzed with HDX Examiner (Sierra Analytics, Modesto, CA). Percent deuterium (%D) uptake was plotted against time for hUGDHFL-dimer and hUGDHΔID-dimer. To magnify slight, yet significant changes in uptake, the cumulative differences in HDX for hUGDHFL-dimer versus hUGDHΔID-dimer were calculated. These values were plotted alongside 3 times the error propagation for all measurements of both variants for each peptide, after the data and error were normalized - divided by the number of time points considered for each data point (Extended Data Fig. 6). The propagation error for each peptide is equal to the square root of the sum of all squared standard deviation values for collective time-dependent measurements of hUGDHFL-dimer and hUGDHΔID-dimer. The cumulative %D uptake was compared to 3 times the propagation error. Differences that were greater than 3 times the propagation error were noted as regions of change affected by the presence of the ID-tail. We chose to normalize the data to be more inclusive of peptides with low intensity that are found at most time points. In like manner, we have excluded those peptides that have avoided detection for more than two time points.
Stopped-Flow Analysis of hUGDH Hysteresis.
The allosteric activation (E* to E) of hUGDH can be observed as a lag (hysteresis) in progress curves22,27 (See Extended Data Figure 7f for examples). The allosteric activation rates for hUGDHFL (N ≥ 6) and hUGDHΔID (N ≥ 6) were monitored at 25 °C using an Applied Photophysics SX20 stopped flow spectrophotometer. Enzyme solutions contained 500 nM hUGDHFL or hUGDHΔID in the standard reaction buffer [50 mM HEPES pH 7.5, 50 mM NaCl, and 5 mM EDTA]. This solution was rapidly mixed with an equal volume of standard reaction buffer that contained both substrate and cofactor. The mixed solution contained 250 nM hUGDHFL or hUGDHΔID, with saturating amounts of both substrate and cofactor. The progress of the reaction was monitored by NADH production, with the absorbance reading at 340 nm being acquired every 10–15 ms. Progress curves were fit to Equation 4 to determine the length of the lag in enzyme activation (E* to E). The mean and standard deviation of the hysteretic lags were derived from 6 or more progress curves.
Transient State Kinetics of UDP-Xyl Binding.
Stopped-flow fluorescence studies were conducted at 25 °C using an Applied Photophysics SX20 stopped flow spectrophotometer with a dead time of ~1.2 ms. Syringes were loaded with 500 nM of hUGDHFL or hUGDHΔID and variable concentrations of UDP-Xyl, and then rapidly mixed. The change in intrinsic tryptophan fluorescence was continuously monitored using an excitation wavelength of 290 nm and an emission filter with a cutoff below 320 nm (Extended Data Fig. 7). Fluorescence decay curves were averaged from experimental replicates (N ≥ 4) for each concentration in the series. Raw data was corrected for the inner filter effect using the molar absorptivity at both the excitation and emission of UDP-Xyl59. Data were globally fit using computer simulation with KinTek Global Kinetic Explorer program (KinTek Corp., Austin, TX)60,61. Multiple input models based on the known structural states were tested, and the best fit model was determined using confidence contour analysis62. Microscopic rate constants and errors are reported in Extended Data Fig. 7e. Fit data and confidence contours can be found in Extended Data Fig. 7a-d.
Extended Data
Extended Data Figure 1|. The crystal structures of hUGDHFL and hUGDHΔID show no significant structural deviations, and structural evidence for UDP-Xyl binding in the NAD+ site.
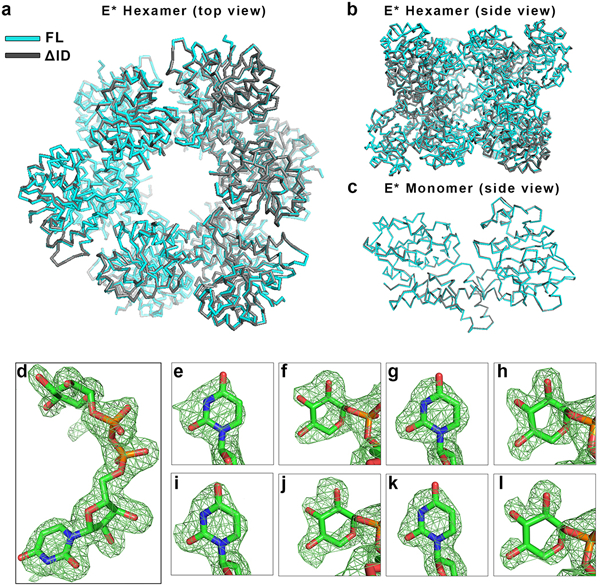
a-b, Structural overlay (r.m.s.d = 0.385 Å) comparing the hUGDHFL (cyan) and hUGDHΔID (grey) E* hexamers, and c, monomers. PDB entries for hUGDHFL and hUGDHΔID are 4RJT and 5W4X (this work, Extended Data Table 1), respectively. d, Crystal structure of native hUGDH with UDP-Xyl bound in the active site. Difference density map (FO-FC) of UDP-Xyl (chain B) calculated at 2.0 Å resolution and contoured at 3.5σ. The map was calculated after omitting the UDP-Xyl and subjecting the model to simulated annealing. e-l, UDP-Xyl can also bind weakly to the NAD+ binding site of native hUGDH. Difference electron density maps (FO-FC) were calculated as in d. The uracil and xylose in the NAD+ binding sites were contoured at 3.5 and 3σ for chain A (panels e and f, respectively), chain B (panels g, h), chain D (panels i, j), and chain E (panels k, l). Chains C and F do not contain UDP-Xyl in the NAD+ binding site. UDP-Xyl binding in the NAD+ site is the source of mixed inhibition observed in the hUGDHFL-dimer and hUGDHΔID-dimer constructs. (see Supplementary Information Section 1). PDB entry: 5VR8 (this work, Extended Data Table 1).
Extended Data Figure 2|. Steady state kinetic analysis of all hUGDH constructs.
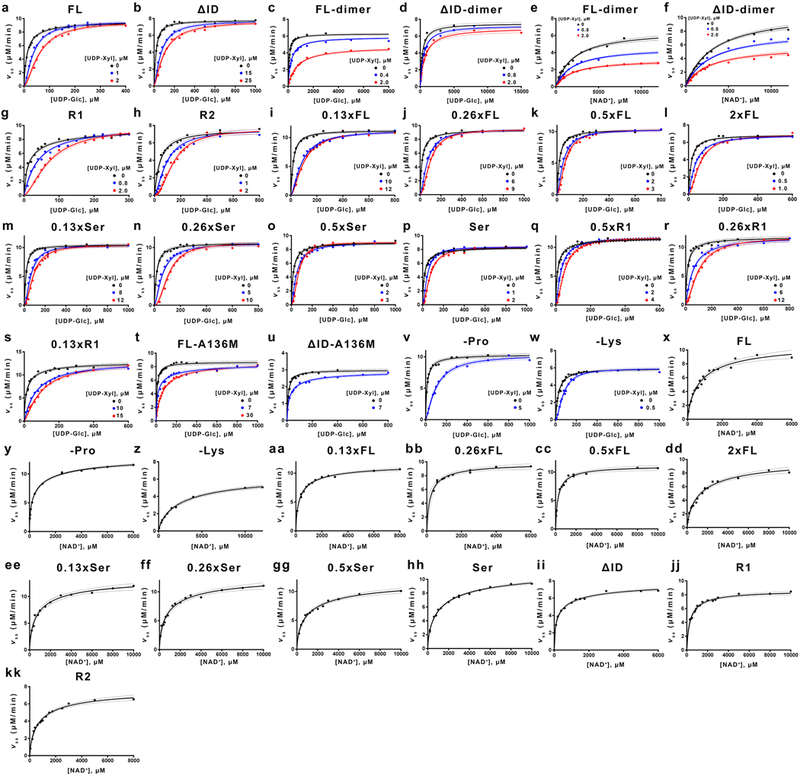
a-x, Inhibition studies with the allosteric inhibitor UDP-Xylose. Data from 2 or 3 independent rate curves were globally fit to the Equation 7 (or Equation 8 for dimers c-f) using nonlinear regression (n ≥ 26 data points). See Extended Data Table 2 for the specific number of data points and fit parameters. Dashed lines indicate 95% confidence intervals. y-kk, NAD+ substrate saturation curves fit to Equation 6 using nonlinear regression (n ≥ 10 independent data points). See Extended Data Table 3 for the specific number of data points used in global fitting.
Extended Data Figure 3|. Sedimentation velocity studies of the hUGDH constructs.

a-s, Plots of the c(s) distributions with oligomeric species labeled as (H)examer, (T)etramer, (D)imer, and (M)onomer. The R2 mutant (panel h) shows no change in UDP-Xyl affinity (Fig. 2c), yet shows evidence of a less stable hexamer. Panel s was included to show that the less stable hexamer in Panel h is due in part to the K465D substitution in the hUGDHR2 construct. The K465D substitution introduces an unfavorable negative charge near E460 in the hexamer interface, which may reduce the stability. t, Relative distributions, s-values (S) and the r.m.s.d’s for all sedimentation velocity experiments.
Extended Data Figure 4|. The ID-tail is conserved in vertebrates.

a, ClustalO sequence alignment of all vertebrate UGDH ID-tail regions (79 total). Residues are colored by type, where blue is positive charge (K, R, H), red is negative charge (D, E), peach is hydrophobic (A, V, L, I, M), orange is aromatic (F, W, Y), green is hydrophilic (S, T, N, Q), yellow is cysteine (C), and magenta is special (P, G). b, The ID-tail was extensively randomized and modified. Sequences of hUGDH (FL, R1, R2, -Lys, -Pro, and Ser) aligned by position and colored by residue type. c, Relative evolutionary rate of UGDH residues from the alignment of 79 vertebrate sequences. The ID-tail (red dots) begins at residue 465 and displays a ~3-fold higher rate of divergence than the folded portion of the protein (black dots). For clarity, only a small, representative segment of the folded protein is shown (residues 460–464). All rates were scaled such that the average rate is 1.0 across the entire dataset.
Extended Data Figure 5|. Exhaustive Monte Carlo simulations constraining the ID-tail.
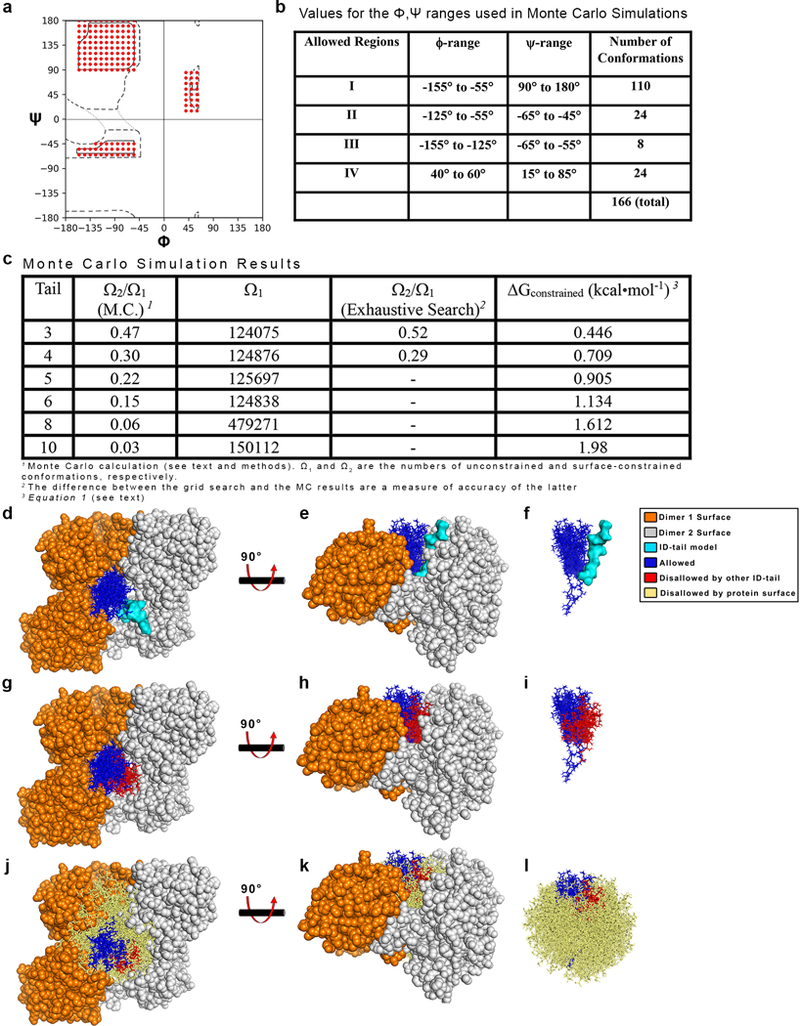
a, Dashed lines outline the traditional, generously allowed regions of the Ramachandran plot, while the red circles identify the conformations used in the MC simulations. b, The ranges of ϕ and ψ angles depicted in panel a. The 10°×10° bins are centered on the first and last numbers in the range. For example, in Region 1, first ϕ,ψ bin (−155°, 90°) and represents the ϕ-range −155° to −145° and the ψ-range 85° to 95°. c, Ratio of ID-tail conformations constrained (Ω2) to the number of conformations when the ID-tail is unconstrained (Ω1). The entropic cost of confining each length tail was calculated using Equation 1.d-e, The results of the 10-residue ID-tail simulations, shown in a surface representing the hexamer-building interface (orange and grey dimers) with the adjacent ID-tail (cyan) that was fixed during simulations. Also depicted is a representative sampling of 20 allowed Ω2 conformations (blue sticks) from the 4,503 identified in the Monte Carlo simulation. f, The same view as panel e, but without the protein surface. g-i, Same as in d-f, but now including a sampling of 20 of the 3,002 Ω1 conformations (red sticks) that clash with the fixed adjacent ID-tail (not depicted for clarity). j-l, Same as g-i, but including 750 of the 142,607 Ω1 conformations (tan sticks) that clash with the protein surface.
Extended Data Figure 6|. The ID-tail induces global changes in the structure and dynamics of hUGDH.
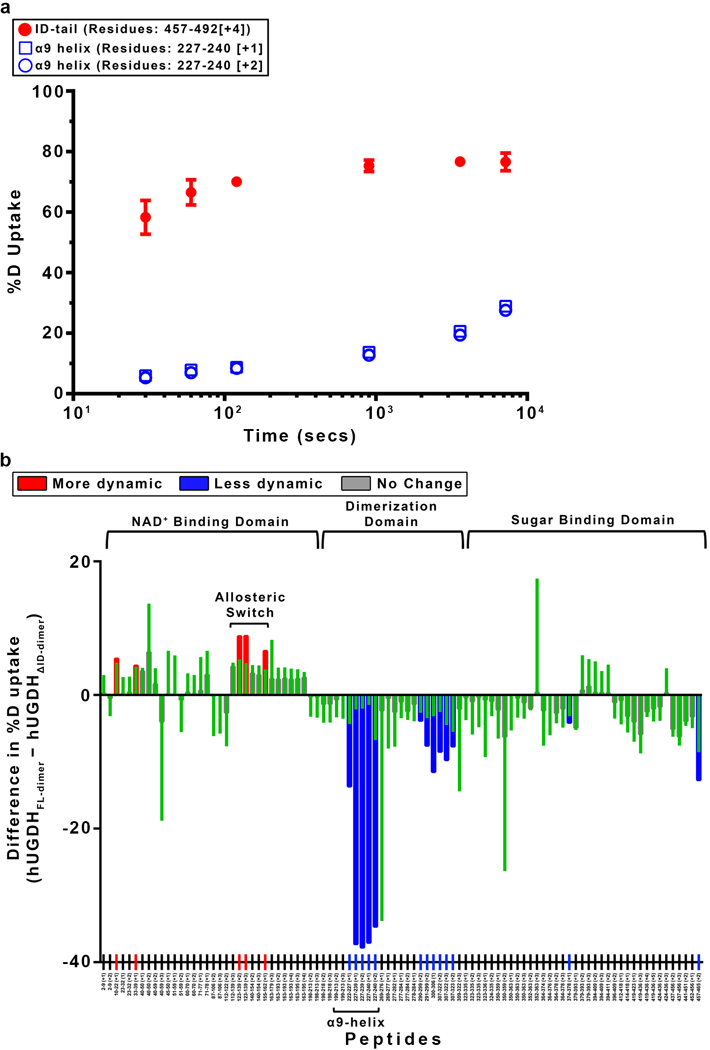
a, The %D uptake of the ID-tail peptide region (Residues: 457–492; red closed circles) saturates rapidly, which is consistent with an unfolded peptide31. For comparison, two peptides corresponding to the well-ordered α9 helix region (open blue squares and circles) saturate slowly. Data are the mean ± s.d. of independently replicated time points (n=4). For some points the standard deviation is less than the dimensions of the data symbol. b. The normalized cumulative changes in the hydrogen-deuterium exchange rates (hUGDHFL-dimer - hUGDHΔID-dimer). Most of the kinetics measurements consisted of six independently replicated time points (n = 4), processed to give the mean exchange (red, blue or green bars). Approximately 5% of the data displayed low Signal/Noise or was missing, and in those cases the means were derived from ≥ four time points. Results were normalized by dividing by the number of measurements. The propagation error for each peptide is equal to the square root of the sum of all squared standard deviation values for the collective measurement of hUGDHFL-dimer and hUGDHΔID-dimer.
Extended Data Figure 7|. Transient state analysis of hUGDHFL hUGDHΔID.
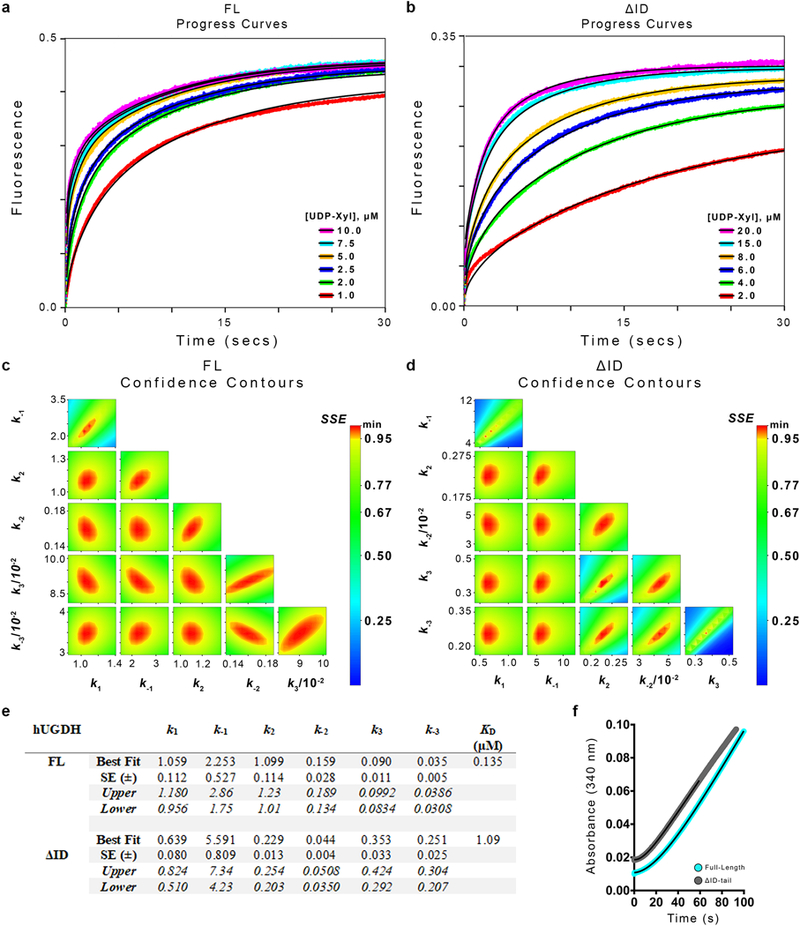
a-b, Transient state analysis of UDP-Xyl binding kinetics using intrinsic protein fluorescence. Six independent progress curves (colored traces) at different inhibitor concentrations were globally fit (black line) to the allosteric inhibition model (see Fig. 4b, c) for hUGDHFL and hUGDHΔID. Each progress curve was replicated (n ≥ 4) with similar results, and the final kinetic model was refined against the averaged progress curves (see panel e for fit parameters). c-d, Confidence contour plots depicting how constrained each globally fit parameter is relative to one another for all progress curves in panels a-b (parameters are listed in panel e). e, Table of the microscopic rate constants from global fitting of the progress curves described in panels a-b above. The best fit and standard error (SE) were obtained from global nonlinear regression based on the numerical integration of rate equations for the described model (see text and methods). Upper and lower limits were obtained from the confidence contour analysis. Kd = (K1K2K3)−1, where Kn = kn/k-n. f, Enzyme hysteresis is observed as a lag in progress curves. Representative progress curves (of n=6 independent measurements) of both hUGDHFL (cyan) and hUGDHΔID (grey) are fit to Equation 4(black line). Curves are displayed with the y-axis offset for clarity. Final results for all replicate curves are displayed in Figure 4a.
Extended Data Table 1|.
Data collection and refinement statistics
| Data collection | ||
|---|---|---|
| Protein Data Bank Entry | 5W4X | 5VR8 |
| E* hUGDHΔID | EΩ hUGDHFL | |
| Space group | C2 | P1211 |
| Unit cell dimensions a,b,c (β) | 178.19, 114.07, 97.24 | 89.08, 196.49, 111.26 |
| (116.9°) | (111.9°) | |
| Completeness (%) | 99.9 (91.1 )a | 93.2 (60.0)a |
| No. reflections | 324,675 | 2,730,154 |
| Redundancy | 6.4 (6.1) | 12.3(10.3) |
| II σ(I) | 21.9 (1.5) | 14.9 (2.5) |
| CC1/2b | 99.9 (64.9) | 99.7(79.3) |
| Rmeas(%)c | 6.5 (122.5) | 13.2(89.3) |
| Refinement | ||
| Resolution (Å) | 2.65 | 2.00 |
| Rwork / Rtree | 0.19/0.23 | 0.16/0.19 |
| No. atoms: Protein / Ligand / Water | 10887/33/36 | 21584/394/1097 |
| B-factors (Å2): Protein / Ligand / Water | 89.9/97.4/64.3 | 33.2/27.1/32.3 |
| Stereochemical Ideality | ||
| Bond lengths (Å2) | 0.004 | 0.008 |
| Bond angles (°) | 0.75 | 0.91 |
| φ,Ψ Preferred (%)d | 98.98 | 97.8 |
| φ,ΨAdditionally allowed (%) | 1.02 | 2.2 |
| φ,ΨDisallowed region (%) | 0.0 | 0.0 |
Extended Data Table 2|.
Kinetic Parameters of all hUGDH constructsa
| hUGDH |
KM (UDP-GIc, μM) |
Kcat
b (s-1) |
KiUDX (UDP-Xyl,μM) |
αUDGC | Δ ΔGe
(kcal•mol-1) |
# of Data Pointsh |
|---|---|---|---|---|---|---|
| ΔID | 17.8 ±0.9 | 0.7 ±0.01 | 5.44 ± 0.55 | ------ | 0.00 | 42 |
| FL | 12.7 ±0.6 | 0.8 ±0.01 | 0.52 ± 0.04 | ------ | −1.39 | 38 |
| R1 | 12.9 ±1.0 | 0.8 ±0.01 | 0.60 ±0.06 | ------ | −1.31 | 59 |
| 0.13×R1 | 12.8 ± 1.2 | 1.0 ±0.01 | 2.59 ±0.24 | ------ | −0.44 | 40 |
| 0.26×R1 | 12.4 ± 1.0 | 1.0 ±0.01 | 1.81 ±0.18 | ------ | −0.65 | 42 |
| 0.5×R1 | 11.1 ±0.8 | 1.0 ±0.01 | 1.09 ±0.08 | ------ | −0.95 | 47 |
| R2 | 43.7 ± 3.6 | 0.7 ±0.01 | 0.78 ±0.07 | ------ | −1.15 | 50 |
| −Lys | 30.1 ± 1.9 | 0.5 ±0.01 | 0.29 ±0.03 | ------ | −1.73 | 39 |
| −Pro | 13.1 ±0.9 | 0.9 ±0.01 | 0.72 ±0.07 | ------ | −1.20 | 26 |
| 0.13×FL | 18.8 ±0.9 | 1.0 ±0.01 | 2.76 ±0.15 | ------ | −0.40 | 46 |
| 0.26×FL | 18.3 ±0.7 | 0.8 ±0.01 | 1.99 ± 0.12 | ------ | −0.60 | 42 |
| 0.5×FL | 18.8 ±0.9 | 0.9 ±0.01 | 1.12 ± 0.08 | ------ | −0.94 | 50 |
| 2×FL | 15.2 ±0.7 | 0.6 ±0.01 | 0.30 ± 0.02 | ------ | −1.72 | 43 |
| 0.13×Ser | 16.9 ± 1.0 | 0.9 ±0.01 | 2.67 ± 0.24 | ------ | −0.42 | 49 |
| 0.26×Ser | 18.4 ± 1.0 | 0.9 ±0.01 | 1.76 ±0.18 | ------ | −0.67 | 43 |
| 0.5×Ser | 17.4 ± 1.3 | 0.8 ±0.01 | 1.09 ± 0.10 | ------ | −0.95 | 49 |
| Ser | 17.8 ±1.0 | 0.7 + 0.01 | 0.60 ±0.05 | ------ | −1.31 | 53 |
| ΔID-dimer | 286 ± 27 | 0.1 ±0.01 | 1.23 + 0.15d | 22 ± 12 | 0.00f | 36 |
| FL-dimer | 83.2 ±2.2 | 0.1 ±0.01 | 0.17 ±0.01d | 36 ±5 | −1.17f | 50 |
| ΔID-A136M | 9.9 ± 0.6 | 0.3 ±0.01 | 4.20 ±0.51 | ------ | 0.00g | 30 |
| FL-A136M | 8.5 ± 0.6 | 0.7 ±0.01 | 4.41 ±0.37 | ------ | 0.03g | 55 |
Kinetic parameters and associated standard errors (±) for all constructs were derived from global analyses of data in Extended Data Fig. 2
One catalytic turnover of UDP-GlcA produces two molecules of NADH per cycle
α describes the mode of mixed inhibition (Equation 8). An α > 1 in the UDP-Glc saturation curves shows that UDP-Xyl binds preferentially to the allosteric binding, and secondarily to the coenzyme binding site
Competitive Ki from the fit to the mixed inhibition Equation 8
Change in UDP-Xyl binding free energy (kcal•mol−1) of hUGDH constructs relative to hUGDHΔID (ΔΔG = RT ln()).
Change in UDP-Xyl binding free energy relative to the hUGDHΔID-dimer
Change in UDP-Xyl binding free energy relative to the hUGDHΔID-A136M
The number of independent data points used in global analysis (see Methods).
Extended Data Table 3|.
NAD+ kinetic parameters for hUGDHa
| hUGDH |
Km (NAD+, mM) |
K0.5b (NAD+, mM) |
Hill (h) |
Kcatc (S-1) |
UDX (Ki, μM) |
αnadd | # of Data Pointse |
|---|---|---|---|---|---|---|---|
| FL | ------------- | 0.8 ± 0.20 | 0.8 ± 0.1 | 0.9 ± 0.08 | ------------- | ------------- | 18 |
| ΔID | ------------- | 0.3 ±0.06 | 0.6 ± 0.1 | 0.7 ±0.03 | ------------- | ------------- | 12 |
| FL-dimer | 2.0 ± 0.26 | ------------- | ------------- | 0.1 ± 0.01 | 2.1 ±0.4 | 0.9 ±0.2 | 37 |
| ΔID-dimer | 3.2 ±0.10 | ------------- | ------------- | 0.2 ±0.01 | 3.6 ±0.8 | 0.6 ±0.2 | 47 |
| R1 | ------------- | 0.4 ± 0.03 | 0.9 ±0.1 | 0.7 ±0.01 | ------------- | ------------- | 17 |
| R2 | ------------- | 0.8 ±0.14 | 0.7 ± 0.1 | 0.7 ±0.01 | ------------- | ------------- | 15 |
| −Lys | ------------- | 2.9 ±0.61 | 0.8 ± 0.1 | 0.6 ±0.04 | ------------- | ------------- | 10 |
| −Pro | ------------- | 0.5 ±0.06 | 0.6 ± 0.1 | 1.2 ±0.03 | ------------- | ------------- | 12 |
| 0.13×FL | ------------- | 0.4 ±0.03 | 0.7 ± 0.1 | 1.0 ±0.03 | ------------- | ------------- | 13 |
| 0.26×FL | ------------- | 0.2 ± 0.03 | 0.8 ± 0.2 | 0.8 ±0.05 | ------------- | ------------- | 11 |
| 0.5×FL | ------------- | 0.3 ±0.03 | 0.9 ±0.1 | 0.9 ±0.02 | ------------- | ------------- | 12 |
| 2×FL | ------------- | 1.4 ±0.31 | 0.8 ±0.1 | 0.9 ±0.01 | ------------- | ------------- | 18 |
| 0.13×Ser | ------------- | 0.9 ±0.24 | 0.7 ±0.1 | 1.2 ±0.10 | ------------- | ------------- | 12 |
| 0.26×Ser | ------------- | 1.0 ± 0.27 | 0.7 ± 0.1 | 1.1 ± 0.09 | ------------- | ------------- | 15 |
| 0.5×Ser | ------------- | 1.2 ±0.34 | 0.7 ± 0.1 | 1.1 ± 0.09 | ------------- | ------------- | 13 |
| Ser | 1.3 ± 0.19 | 0.7 ± 0.1 | 1.0 ± 0.04 | ------------- | ------------- | 13 | |
Kinetic parameters and associated standard errors (±) for all constructs were derived from global analyses of data in Extended Data Fig. 2
Hexameric hUGDH displays negative cooperativity with NAD+ binding, which indicates a mix of high affinity and low affinity sites23–28. In previous work, we showed that the native hUGDHFL K0.5 of 0.8 mM NAD+ corresponds to a mix of high and low affinity sites of (KM of 88 μM and 1.8 mM, respectively)23. This is consistent with the published Kd of 30 μM for the coenzyme24.
One catalytic turnover of UDP-GlcA produces two molecules of NADH per cycle
α describes the mode of mixed inhibition (Equation 8). An α < 1 in the NAD+ saturation curves show that UDP-Xyl binds preferentially to the allosteric binding, and secondarily to the coenzyme binding site.
The number of independent data points used in nonlinear regression (see Methods).
Supplementary Material
Acknowledgements:
The authors would like to thank Professors Andrew P. Karplus, Brian W. Matthews, and Savvas N. Savvides, and the members of the Z.A.W. laboratory for helpful discussions. We also thank the reviewers for their contributions to the peer review of our manuscript, especially those of reviewer #3, who suggested that the ID-tail would generate an entropic force. Finally, we thank Dr. Richard Wang of Norclone for his heroic efforts in producing the R1 truncation constructs in record time. This work was supported by the NIH National Institute of General Medicine grants R01GM114298 awarded to Z.A.W. and P41GM103422 awarded to M.L.G.
Footnotes
The authors declare no competing financial interests. Readers are welcome to comment on the online version of the paper. Correspondence and requests for materials should be addressed to Z.A.W. (zaw@uga.edu). Publisher’s note: Springer Nature remains neutral with regard to jurisdictional claims in published maps and institutional affiliations.
DATA AVAILABILITY STATEMENT: The structure factors and coordinates described in this manuscript have been deposited and released (PDB entries: 5W4X and 5VR8). All data generated or analyzed in this study can be found within the Extended Data Files and the provided Source Data.
References (Main Text):
- 1.Frauenfelder H, Sligar SG & Wolynes PG The energy landscapes and motions of proteins. Science 254, 1598–1603 (1991). [DOI] [PubMed] [Google Scholar]
- 2.Henzler-Wildman K & Kern D Dynamic personalities of proteins. Nature 450, 964–972, doi: 10.1038/nature06522 (2007). [DOI] [PubMed] [Google Scholar]
- 3.Campbell E et al. The role of protein dynamics in the evolution of new enzyme function. Nat Chem Biol 12, 944–950, doi: 10.1038/nchembio.2175 (2016). [DOI] [PubMed] [Google Scholar]
- 4.Boehr DD, Nussinov R & Wright PE The role of dynamic conformational ensembles in biomolecular recognition. Nat Chem Biol 5, 789–796, doi: 10.1038/nchembio.232 (2009). [DOI] [PMC free article] [PubMed] [Google Scholar]
- 5.Kumar S, Ma B, Tsai CJ, Sinha N & Nussinov R Folding and binding cascades: dynamic landscapes and population shifts. Protein Sci 9, 10–19, doi: 10.1110/ps.9.1.10 (2000). [DOI] [PMC free article] [PubMed] [Google Scholar]
- 6.Oates ME et al. D(2)P(2): database of disordered protein predictions. Nucleic Acids Res 41, D508–516, doi: 10.1093/nar/gks1226 (2013). [DOI] [PMC free article] [PubMed] [Google Scholar]
- 7.van der Lee R et al. Classification of intrinsically disordered regions and proteins. Chem Rev 114, 6589–6631, doi: 10.1021/cr400525m (2014). [DOI] [PMC free article] [PubMed] [Google Scholar]
- 8.Papaleo E et al. The Role of Protein Loops and Linkers in Conformational Dynamics and Allostery. Chem Rev 116, 6391–6423, doi: 10.1021/acs.chemrev.5b00623 (2016). [DOI] [PubMed] [Google Scholar]
- 9.He B et al. Predicting intrinsic disorder in proteins: an overview. Cell Res 19, 929–949, doi: 10.1038/cr.2009.87 (2009). [DOI] [PubMed] [Google Scholar]
- 10.Bickel T, Jeppesen C & Marques CM Local entropic effects of polymers grafted to soft interfaces. Eur Phys J E 4, 33–43, doi: 10.1007/s101890170140 (2001). [DOI] [Google Scholar]
- 11.Bickel T, Marques C & Jeppesen C Pressure patches for membranes: the induced pinch of a grafted polymer. Phys Rev E Stat Phys Plasmas Fluids Relat Interdiscip Topics 62, 1124–1127 (2000). [DOI] [PubMed] [Google Scholar]
- 12.Waters JT & Kim HD Calculation of a fluctuating entropic force by phase space sampling. Phys Rev E 92, doi: 10.1103/PhysRevE.92.013308 (2015). [DOI] [PubMed] [Google Scholar]
- 13.Carmichael SP & Shell MS Entropic (de)stabilization of surface-bound peptides conjugated with polymers. J Chem Phys 143, doi: 10.1063/1.4929592 (2015). [DOI] [PubMed] [Google Scholar]
- 14.Ferreon AC, Ferreon JC, Wright PE & Deniz AA Modulation of allostery by protein intrinsic disorder. Nature 498, 390–394, doi: 10.1038/nature12294 (2013). [DOI] [PMC free article] [PubMed] [Google Scholar]
- 15.Hilser VJ An Ensemble View of Allostery. Science 327, 653–654, doi: 10.1126/science.1186121 (2010). [DOI] [PMC free article] [PubMed] [Google Scholar]
- 16.Hilser VJ & Thompson EB Intrinsic disorder as a mechanism to optimize allosteric coupling in proteins. P Natl Acad Sci USA 104, 8311–8315, doi: 10.1073/pnas.0700323104 (2007). [DOI] [PMC free article] [PubMed] [Google Scholar]
- 17.Sugase K, Dyson HJ & Wright PE Mechanism of coupled folding and binding of an intrinsically disordered protein. Nature 447, 1021–U1011, doi: 10.1038/nature05858 (2007). [DOI] [PubMed] [Google Scholar]
- 18.Li J et al. Genetically tunable frustration controls allostery in an intrinsically disordered transcription factor. Elife 6, doi: 10.7554/eLife.30688 (2017). [DOI] [PMC free article] [PubMed] [Google Scholar]
- 19.Egger S, Chaikuad A, Kavanagh KL, Oppermann U & Nidetzky B Structure and mechanism of human UDP-glucose 6-dehydrogenase. J Biol Chem 286, 23877–23887, doi: 10.1074/jbc.M111.234682 (2011). [DOI] [PMC free article] [PubMed] [Google Scholar]
- 20.Gainey PA & Phelps CF Interactions of Uridine-Diphosphate Glucose Dehydrogenase with Inhibitor Uridine-Diphosphate Xylose. Biochem J 145, 129–134, doi: 10.1042/bj1450129 (1975). [DOI] [PMC free article] [PubMed] [Google Scholar]
- 21.Neufeld EF & Hall CW Inhibition of Udp-D-Glucose Dehydrogenase by Udp-D-Xylose - A Possible Regulatory Mechanism. Biochem Bioph Res Co 19, 456-&, doi: 10.1016/0006-291x(65)90146-4 (1965). [DOI] [PubMed] [Google Scholar]
- 22.Beattie NR, Keul ND, Sidlo AM & Wood ZA Allostery and Hysteresis Are Coupled in Human UDP-Glucose Dehydrogenase. Biochemistry 56, 202–211, doi: 10.1021/acs.biochem.6b01044 (2017). [DOI] [PMC free article] [PubMed] [Google Scholar]
- 23.Kadirvelraj R, Sennett NC, Custer GS, Phillips RS & Wood ZA Hysteresis and negative cooperativity in human UDP-glucose dehydrogenase. Biochemistry 52, 1456–1465, doi: 10.1021/bi301593c (2013). [DOI] [PubMed] [Google Scholar]
- 24.Kadirvelraj R, Sennett NC, Polizzi SJ, Weitzel S & Wood ZA Role of packing defects in the evolution of allostery and induced fit in human UDP-glucose dehydrogenase. Biochemistry 50, 5780–5789, doi: 10.1021/bi2005637 (2011). [DOI] [PubMed] [Google Scholar]
- 25.Sennett NC, Kadirvelraj R & Wood ZA Conformational flexibility in the allosteric regulation of human UDP-alpha-D-glucose 6-dehydrogenase. Biochemistry 50, 9651–9663, doi: 10.1021/bi201381e (2011). [DOI] [PubMed] [Google Scholar]
- 26.Sennett NC, Kadirvelraj R & Wood ZA Cofactor binding triggers a molecular switch to allosterically activate human UDP-alpha-D-glucose 6-dehydrogenase. Biochemistry 51, 9364–9374, doi: 10.1021/bi301067w (2012). [DOI] [PubMed] [Google Scholar]
- 27.Kadirvelraj R et al. Hysteresis in Human UDP-Glucose Dehydrogenase Is Due to a Restrained Hexameric Structure That Favors Feedback Inhibition. Biochemistry 53, 8043–8051, doi: 10.1021/bi500594x (2014). [DOI] [PubMed] [Google Scholar]
- 28.Uversky VN The intrinsic disorder alphabet. III. Dual personality of serine. Intrinsically Disord Proteins 3, e1027032, doi: 10.1080/21690707.2015.1027032 (2015). [DOI] [PMC free article] [PubMed] [Google Scholar]
- 29.Theillet FX et al. The alphabet of intrinsic disorder: I. Act like a Pro: On the abundance and roles of proline residues in intrinsically disordered proteins. Intrinsically Disord Proteins 1, e24360, doi: 10.4161/idp.24360 (2013). [DOI] [PMC free article] [PubMed] [Google Scholar]
- 30.Busch DJ et al. Intrinsically disordered proteins drive membrane curvature. Nat Commun 6, 7875, doi: 10.1038/ncomms8875 (2015). [DOI] [PMC free article] [PubMed] [Google Scholar]
- 31.Balasubramaniam D & Komives EA Hydrogen-exchange mass spectrometry for the study of intrinsic disorder in proteins. Biochim Biophys Acta 1834, 1202–1209, doi: 10.1016/j.bbapap.2012.10.009 (2013). [DOI] [PMC free article] [PubMed] [Google Scholar]
- 32.Chen JZY Theory of wormlike polymer chains in confinement. Prog Polym Sci 54–55, 3–46, doi: 10.1016/j.progpolymsci.2015.09.002 (2016). [DOI] [Google Scholar]
- 33.Smyda MR & Harvey SC The entropic cost of polymer confinement. J Phys Chem B 116, 10928–10934, doi: 10.1021/jp302807r (2012). [DOI] [PMC free article] [PubMed] [Google Scholar]
- 34.Thielges MC, Chung JK, Axup JY & Fayer MD Influence of histidine tag attachment on picosecond protein dynamics. Biochemistry 50, 5799–5805, doi: 10.1021/bi2003923 (2011). [DOI] [PMC free article] [PubMed] [Google Scholar]
ADDITIONAL REFERENCES:
- 35.Wilkins MR et al. Protein identification and analysis tools in the ExPASy server. Methods Mol Biol 112, 531–552 (1999). [DOI] [PubMed] [Google Scholar]
- 36.Kabsch W Xds. Acta Crystallogr D Biol Crystallogr 66, 125–132, doi: 10.1107/S0907444909047337 (2010). [DOI] [PMC free article] [PubMed] [Google Scholar]
- 37.Brunger AT Free R value: cross-validation in crystallography. Methods Enzymol 277, 366–396 (1997). [DOI] [PubMed] [Google Scholar]
- 38.Adams PD et al. PHENIX: a comprehensive Python-based system for macromolecular structure solution. Acta Crystallogr D Biol Crystallogr 66, 213–221, doi: 10.1107/S0907444909052925 (2010). [DOI] [PMC free article] [PubMed] [Google Scholar]
- 39.Emsley P, Lohkamp B, Scott WG & Cowtan K Features and development of Coot. Acta Crystallogr D Biol Crystallogr 66, 486–501, doi: 10.1107/S0907444910007493 (2010). [DOI] [PMC free article] [PubMed] [Google Scholar]
- 40.Urzhumtsev A, Afonine PV & Adams PD TLS from fundamentals to practice. Crystallogr Rev 19, 230–270, doi: 10.1080/0889311X.2013.835806 (2013). [DOI] [PMC free article] [PubMed] [Google Scholar]
- 41.Karplus PA & Diederichs K Linking crystallographic model and data quality. Science 336, 1030–1033, doi: 10.1126/science.1218231 (2012). [DOI] [PMC free article] [PubMed] [Google Scholar]
- 42.Diederichs K & Karplus PA Improved R-factors for diffraction data analysis in macromolecular crystallography. Nat Struct Biol 4, 269–275 (1997). [DOI] [PubMed] [Google Scholar]
- 43.Frieden C Kinetic aspects of regulation of metabolic processes. The hysteretic enzyme concept. J Biol Chem 245, 5788–5799 (1970). [PubMed] [Google Scholar]
- 44.Laue TM, Shah BD, Ridgeway TM & Pelletier SL Analytical Ultracentrifugation. (The Royal Society of Chemistry, 1992). [Google Scholar]
- 45.Schuck P Size-distribution analysis of macromolecules by sedimentation velocity ultracentrifugation and lamm equation modeling. Biophys J 78, 1606–1619, doi: 10.1016/S0006-3495(00)76713-0 (2000). [DOI] [PMC free article] [PubMed] [Google Scholar]
- 46.Schuck P On the analysis of protein self-association by sedimentation velocity analytical ultracentrifugation. Anal Biochem 320, 104–124 (2003). [DOI] [PubMed] [Google Scholar]
- 47.Ortega A, Amoros D & Garcia de la Torre J. Prediction of hydrodynamic and other solution properties of rigid proteins from atomic- and residue-level models. Biophys J 101, 892–898, doi: 10.1016/j.bpj.2011.06.046 (2011). [DOI] [PMC free article] [PubMed] [Google Scholar]
- 48.Edgar RC MUSCLE: multiple sequence alignment with high accuracy and high throughput. Nucleic Acids Res 32, 1792–1797, doi: 10.1093/nar/gkh340 (2004). [DOI] [PMC free article] [PubMed] [Google Scholar]
- 49.Jones DT, Taylor WR & Thornton JM The rapid generation of mutation data matrices from protein sequences. Comput Appl Biosci 8, 275–282 (1992). [DOI] [PubMed] [Google Scholar]
- 50.Kumar S, Stecher G & Tamura K MEGA7: Molecular Evolutionary Genetics Analysis Version 7.0 for Bigger Datasets. Mol Biol Evol 33, 1870–1874, doi: 10.1093/molbev/msw054 (2016). [DOI] [PMC free article] [PubMed] [Google Scholar]
- 51.Ramachandran GN, Ramakrishnan C & Sasisekharan V Stereochemistry of polypeptide chain configurations. J Mol Biol 7, 95–99 (1963). [DOI] [PubMed] [Google Scholar]
- 52.Word JM, Lovell SC, Richardson JS & Richardson DC Asparagine and glutamine: Using hydrogen atom contacts in the choice of side-chain amide orientation. Journal of Molecular Biology 285, 1735–1747, doi: 10.1006/jmbi.1998.2401 (1999). [DOI] [PubMed] [Google Scholar]
- 53.Huynh K & Partch CL Analysis of protein stability and ligand interactions by thermal shift assay. Curr Protoc Protein Sci 79, 28 29 21–14, doi: 10.1002/0471140864.ps2809s79 (2015). [DOI] [PMC free article] [PubMed] [Google Scholar]
- 54.Fang J et al. Conformational dynamics of the Escherichia coli DNA polymerase manager proteins UmuD and UmuD’. J Mol Biol 398, 40–53, doi: 10.1016/j.jmb.2010.02.040 (2010). [DOI] [PMC free article] [PubMed] [Google Scholar]
- 55.Wales TE & Engen JR Hydrogen exchange mass spectrometry for the analysis of protein dynamics. Mass Spectrom Rev 25, 158–170, doi: 10.1002/mas.20064 (2006). [DOI] [PubMed] [Google Scholar]
- 56.Johnson B et al. Dimerization Controls Marburg Virus VP24-dependent Modulation of Host Antioxidative Stress Responses. J Mol Biol 428, 3483–3494, doi: 10.1016/j.jmb.2016.07.020 (2016). [DOI] [PMC free article] [PubMed] [Google Scholar]
- 57.Chen E et al. Broadly neutralizing epitopes in the Plasmodium vivax vaccine candidate Duffy Binding Protein. Proc Natl Acad Sci U S A 113, 6277–6282, doi: 10.1073/pnas.1600488113 (2016). [DOI] [PMC free article] [PubMed] [Google Scholar]
- 58.Yan Y, Grant GA & Gross ML Hydrogen-Deuterium Exchange Mass Spectrometry Reveals Unique Conformational and Chemical Transformations Occurring upon [4Fe-4S] Cluster Binding in the Type 2 L-Serine Dehydratase from Legionella pneumophila. Biochemistry 54, 5322–5328, doi: 10.1021/acs.biochem.5b00761 (2015). [DOI] [PMC free article] [PubMed] [Google Scholar]
- 59.Palmier MO & Van Doren SR Rapid determination of enzyme kinetics from fluorescence: overcoming the inner filter effect. Anal Biochem 371, 43–51, doi: 10.1016/j.ab.2007.07.008 (2007). [DOI] [PMC free article] [PubMed] [Google Scholar]
- 60.Johnson KA Fitting enzyme kinetic data with KinTek Global Kinetic Explorer. Methods Enzymol 467, 601–626, doi: 10.1016/S0076-6879(09)67023-3 (2009). [DOI] [PubMed] [Google Scholar]
- 61.Johnson KA, Simpson ZB & Blom T Global Kinetic Explorer: A new computer program for dynamic simulation and fitting of kinetic data. Analytical Biochemistry 387, 20–29, doi: 10.1016/j.ab.2008.12.024 (2009). [DOI] [PubMed] [Google Scholar]
- 62.Johnson KA, Simpson ZB & Blom T FitSpace explorer: an algorithm to evaluate multidimensional parameter space in fitting kinetic data. Anal Biochem 387, 30–41, doi: 10.1016/j.ab.2008.12.025 (2009). [DOI] [PubMed] [Google Scholar]
Associated Data
This section collects any data citations, data availability statements, or supplementary materials included in this article.