Abstract
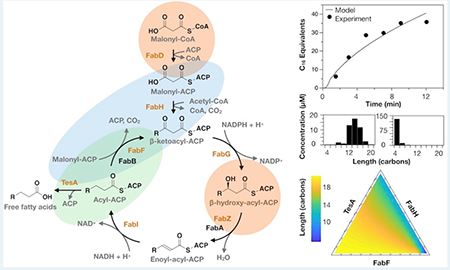
Biocatalytic systems (e.g., multienzyme pathways or complexes) enable the conversion of simple sugars into complex products under ambient conditions and, thus, represent promising platforms for the synthesis of renewable fuels and chemicals. Unfortunately, to date, many of these systems have proven difficult to engineer without a detailed understanding of the kinetic relationships that regulate the concerted action of their constituent enzymes. This study develops a mechanistic kinetic model of the fatty acid synthase (FAS) of Escherichia coli and uses that model to determine how different FAS components work together to control the production of free fatty acids—precursors to a wide range of oleochemicals. Perturbational analyses indicate that the modification or overexpression of a single FAS component can depress fatty acid production (a commonly observed phenomenon) by sequestering the proteins with which it interacts and/or by depleting common substrate pools. Compositional studies, in turn, suggest that simple changes in the ratios of FAS components can alter the average length of fatty acids but show that specialized enzymes (i.e., highly specific ketoacyl synthases or thioesterases) are required for narrow product profiles. Intriguingly, a sensitivity analysis indicates that two components primarily influence—and, thus, enable fine control over—total production, but suggests that the enzymes that regulate product profile are more broadly influential. Findings thus reveal the general importance of kinetic considerations in efforts to engineer fatty acid biosynthesis and provide strategies—and a kinetic model—for incorporating those considerations into FAS designs.
Keywords: fatty acid synthesis, biocatalytic networks, enzyme cascades, kinetic model, sensitivity analysis, oleochemicals, biocatalysis, metabolic engineering
INTRODUCTION
The biocatalysts that enable fatty acid synthesis in microbial cells offer a promising means of producing fuels and chemicals from renewable feedstocks. Fatty acid synthases (FASs)—multidomain complexes (type I) or multienzyme mixtures (type II) that convert glucose-derived metabolites into structurally varied fatty acids—can supply precursors to a wide range of oleochemicals (e.g., alcohols, alkyl esters, methyl ketones, and alkanes).1 To date, most efforts to engineer the product profiles of FASs have relied on changes in the identity or expression level of individual catalytic components;2,3 these approaches have enabled the synthesis of novel varieties of fatty acids, but by neglecting the kinetic relationships that allow different components to work together, they have struggled to achieve tight, yield-independent control over product distributions.4,5 The development of general strategies to tune the product profiles of FASs thus remains a longstanding challenge of applied biocatalysis.6
The fatty acid pathway of Escherichia coli (E. coli) is a well-studied type II FAS that demonstrates the difficulty of controlling fatty acid production in microbial cells.7,8 It builds fatty acids in three main steps (Figure 1): initiation, elongation, and termination. Initiation begins when FabD (a transacylase) transfers the malonyl group of malonyl-CoA to an acyl carrier protein (ACP), where FabH (a β-ketoacyl-ACP synthase) condenses it with acetyl-CoA to form acetoacyl-ACP. Elongation, two carbons at a time, occurs through repeated (i) reduction of acetoacyl-ACP to acyl-ACP by three enzymes—FabG (a β-ketoacyl-ACP reductase), FabZ or FabA (β-hydroxyacyl-ACP dehydratases), and FabI (an enoyl-acyl-ACP reductase)—and (ii) condensation of acyl-ACPs with malonyl-ACP by FabB or FabF (β-ketoacyl-ACP synthases). Termination—the release of free fatty acids—results from thioesterase-catalyzed hydrolysis of acyl-ACPs. The FAS of E. coli does not contain a thioesterase, per se, but it is often supplemented with one in engineered strains.9,10
Figure 1.
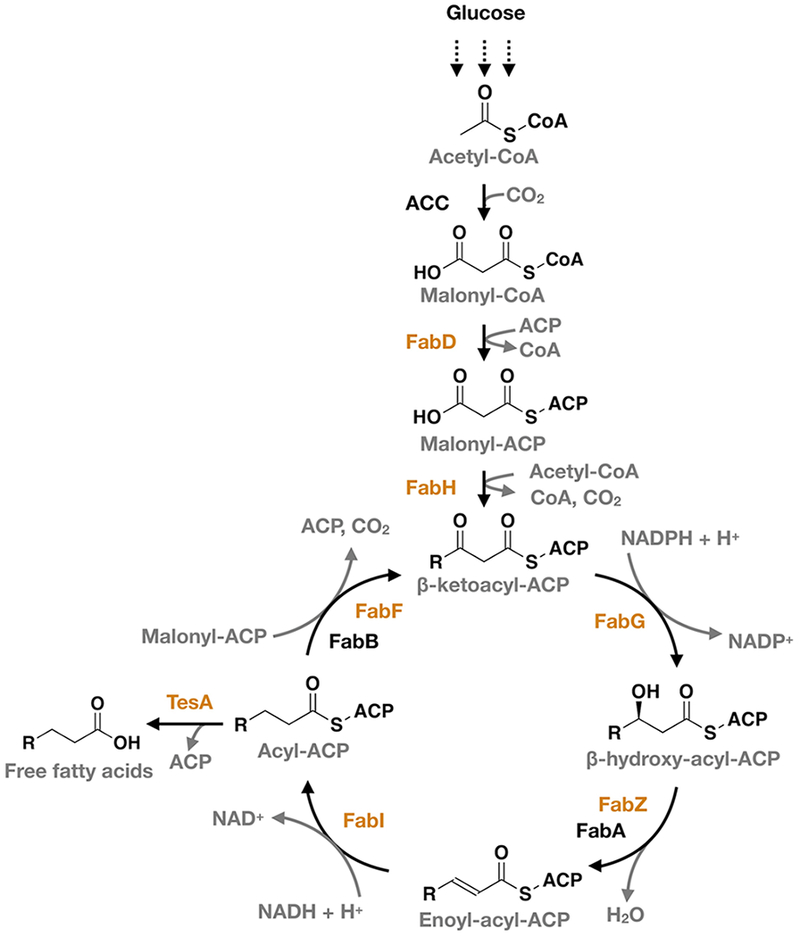
Fatty acid synthase (FAS) of E. coli. This type II FAS formally includes FabD, FabH, FabG, FabZ, FabA, FabI, FabB, FabF, and holo-ACP; many studies, however, supplement it with a periplasmic variant of TesA.9,19,23 Our model captures the activities of the seven enzymes (orange) necessary for de novo biosynthesis of saturated fatty acids from malonyl-CoA and acetyl-CoA.
ACPs are often overlooked as simple substrate carriers, but recent evidence suggests that they may play important regulatory roles.11 The archetypal type II ACP consists of an α-helical bundle with a central hydrophobic cleft.8 This cleft sequesters acyl chains in solution and, upon enzyme-ACP association, undergoes a conformational change that releases those chains into neighboring active sites.12 Differences in the strength—and conformational repercussions—of various ACP-substrate and ACP-enzyme interactions could, thus, modulate the flux of intermediates through the fatty acid pathway.
Most efforts to control fatty acid production in E. coli have incorporated enzymes with non-native activities.13,14 Examples include ketoacyl synthases with enhanced activities on branched acyl-CoAs,15 ketoacyl-ACP reductases that alter the location or stereochemistry of double bonds,16,17 and thioesterases that target short acyl-ACPs.4,18,19 These enzymes have enabled useful changes in product profiles (e.g., the enhanced synthesis of short or branched fatty acids); they have not, however, yielded precise control over product distributions (they have tended to generate broad distributions with numerous side products13,14,19) or afforded mechanistic insights that explain that lack of control.
Detailed studies of fatty acid synthesis in E. coli indicate that complex kinetic relationships between enzymes regulate FAS activity in a nonintuitive manner.20–22 For brevity, we will describe two: (i) In an investigation of the FAS reconstituted in vitro, Khosla and colleagues observed that high concentrations of FabH, FabF, thioesterase, or holo-ACP could reduce rates of fatty acid synthesis;23 they attributed this inhibitory effect to the sequestration of essential proteins (i.e., the removal of holo-ACP by excess enzymes that bind to this protein, or vice versa). (ii) In an analysis of E. coli engineered to express plant-derived thioesterases, Silver and colleagues showed that cerulenin, an inhibitor of FabF and FabB, could increase yields of medium-chain fatty acids;5 they hypothesized that this improvement resulted from both (i) the enhanced availability of medium-chain acyl-ACPs targeted by their chosen thioesterases and (ii) the reduced accumulation of long-chain acyl-ACPs that inhibit FabH.24 The results of these two studies show how the kinetics of interdependent catalytic steps control fatty acid production in a nonlinear manner that complicates the rational rewiring of FAS activity.
In this study, we developed a mechanistic kinetic model of the FAS of E. coli and used it to determine how different enzymes work together to control rates of fatty acid synthesis and overall product profiles. This analysis departs from previous quantitative investigations of fatty acid production (e.g., flux balance analyses, which incorporate cell-wide reaction stoichiometries but neglect reaction kinetics25) in its focus on the mechanistic and kinetic details of a small number of highly influential steps: the enzymatic reactions responsible for the synthesis of saturated fatty acids. We used our model to accomplish three tasks: (i) to test previously posited hypotheses concerning the mechanistic origin of unexpected experimental results (e.g., the inhibitory effect of high concentrations of FAS components), (ii) to carry out multiparameter studies of interdependent catalytic steps (i.e., studies that are experimentally intractable), and (iii) to develop new strategies to tune the product profiles of FASs. With these analyses, we sought to develop a general kinetic framework for engineering fatty acid synthesis in microbial systems.
RESULTS AND DISCUSSION
Development of a Mechanistic Kinetic Model.
We constructed a detailed kinetic model of the FAS of E. coli by incorporating the activities of seven enzymes necessary to convert malonyl-CoA and acetyl-CoA to saturated fatty acids (Figure 1 and Table 1): FabD, FabH, FabG, FabZ, FabI, FabF, and TesA. We included TesA, a periplasmic thioesterase from E. coli, because it generates large amounts of free fatty acids and is commonly included in engineered systems.9,10 (These systems include a cytosolic variant of TesA; we refer only to this variant in our analysis.) We excluded FabA and FabB, two jointly regulated enzymes required for the construction of unsaturated fatty acids,26 for two reasons: (i) they have overlapping activities with FabZ and FabF and, thus, complicate the systematic analysis of unique catalytic steps,27 and (ii) previous studies suggest that they exert a negligible influence on overall rates of synthesis.11,23,27 We based all rate equations on kinetic mechanisms reported in detailed experimental analyses of individual enzymes, and we avoided a priori equilibrium assumptions by including independent association and disassociation steps for each heteromeric complex (Tables 1 and Table S1). Our final model contained 154 equations and 83 unique kinetic constants (Appendix 1 in the Supporting Information).
Table 1.
Kinetic Mechanisms and Parametersa
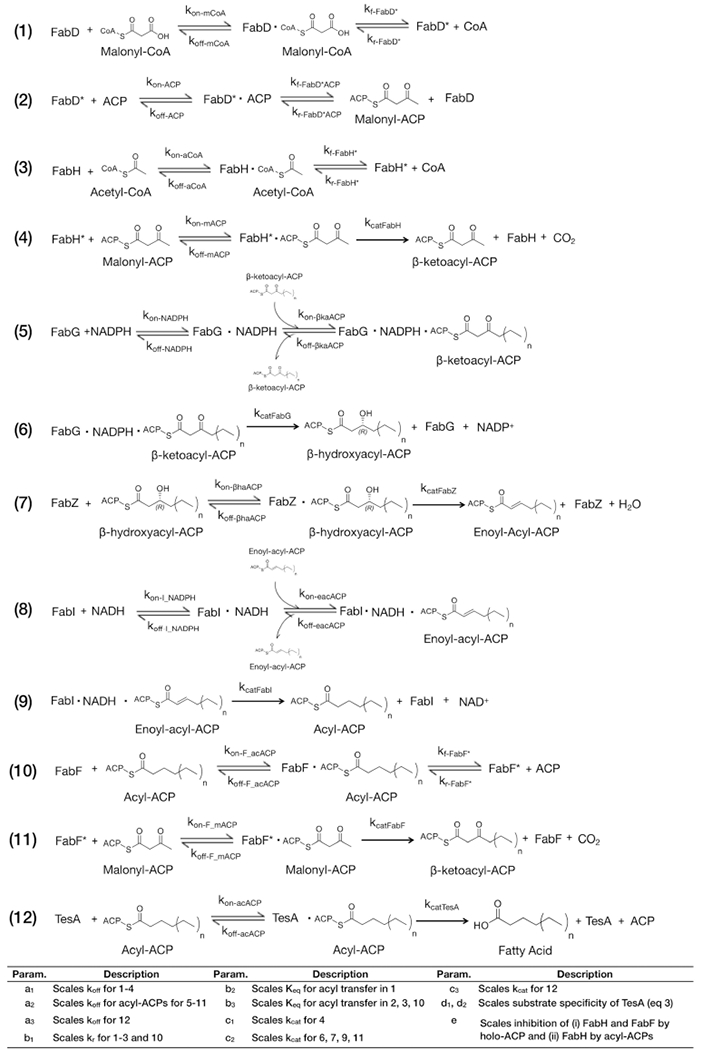 |
Legend: (†) FabD*, FabH*, and FabF* refer to acyl-enzyme intermediates. (‡) For the expanded sensitivity analysis, we divided scaling parameters as follows: b11 scales kr for (1) and (2); b12, kr for (3); b13, kr for (10); b31, Keq for (2); b32, Keq for (3); b33, Keq for (10); c21, kcat for (6); c22, kcat for (7); c23, kcat for (9); c24, kcat for (11).
We note that five of the modeled enzymes (FabH, FabG, FabZ, FabI, and FabF) form homooligomeric complexes that may give rise to cooperative interactions between complexed proteins;8 previous studies have observed such interactions in dimers of FabH and tetramers of FabG.28,29 By modeling all enzymes as monomers, we assumed that cooperative changes in binding constants were small, relative to both (i) differences in binding constants between enzymes and (ii) the precision afforded by model fits.
Parameterization of the Kinetic Model.
We based initial estimates of model parameters on the results of detailed kinetic studies. For most enzymes, we used a combination of (i) measured turnover numbers and equilibrium constants reported in the literature or (ii) fits to published kinetic data (Table S4). For TesA, we supplemented these fits with new kinetic measurements that allowed us to estimate its affinity for holo-ACP (Methods, Figure S2E and Table S3).
We optimized estimates of kinetic parameters by fitting our model to experimental measurements of FAS activity. In brief, we used 12 scaling parameters to link groups of similar kinetic terms to one another (e.g., c2 scales estimates of kcat for the four enzymes that constitute the elongation cycle; Table 1) and we optimized these parameters with a simultaneous fit to three data sets: (i) a time course of total fatty acids produced by a reconstituted FAS,23 (ii) the product distribution generated by a strain of E. coli overexpressing TesA,19 and (iii) initial rates of fatty acid synthesis exhibited by reconstituted FASs with varying concentrations of FabH (Figure 2).23 This diverse set of data helped to prevent overfitting and, thus, to ensure that the model could accurately predict fatty acid production under a broad range of FAS compositions. We note that the reference study for the third data set did not report the time used to measure initial rates;23 therefore, we assumed a measurement time of 2.5 min (i.e., the time taken for ~10 turnovers) and optimized our model against normalized initial rates (e.g., Figure 2C).
Figure 2.
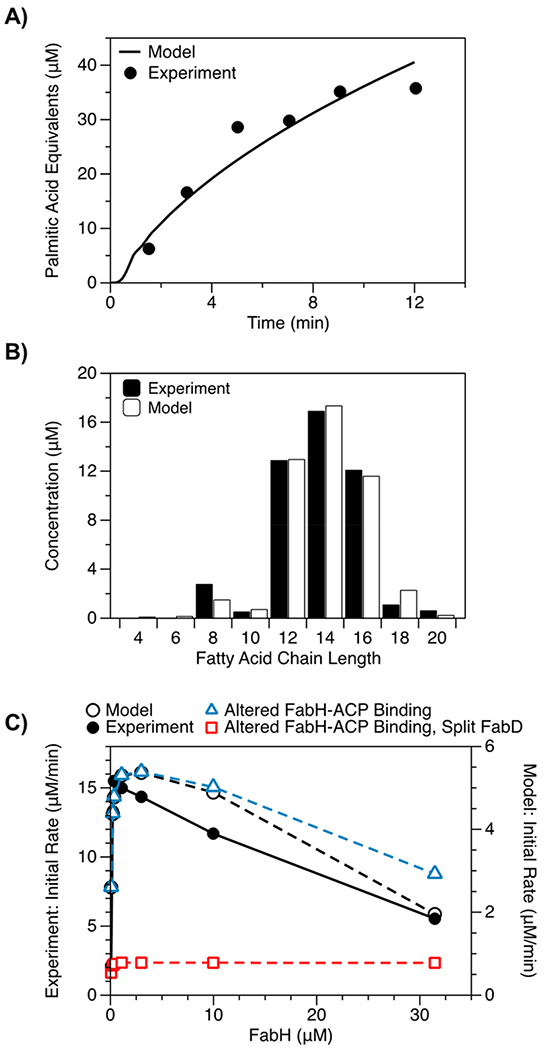
Optimization of the kinetic model. We optimized our model with simultaneous fits to three data sets: (A) a time course of total fatty acids generated by a reconstituted FAS (1 μM of each Fab, 10 μM holo-ACP, 10 μM TesA, 1 mM NADPH, 1 mM NADH, 0.5 mM malonyl-CoA, and 0.5 mM acetyl-CoA),23 (B) the product distribution generated by a strain of E. coli overexpressing TesA,19 and (C) initial rates of fatty acid synthesis (calculated over 2.5 min) exhibited by reconstituted FASs with varying concentrations of FabH (i.e., mixtures with 0.2 mM acetyl-CoA that are otherwise identical to the mixture from (A)).23 We used the in vivo product distribution (B) as an approximation for the in vitro distribution (not reported) at 12.5 min; for (C), we optimized our model against normalized initial rates. Panel (C) compares two modified models. In the first (triangles), FabH cannot bind to ACP or acyl-ACPs. In the second (squares), the first is further modified to include two FabDs that generate FabH- and FabF-specific pools of malonyl-ACP. Only the second modified model is insensitive to high concentrations of FabH, suggesting that inhibition results from competition between FabH and FabF for malonyl-ACP.
Excess FabH Inhibits Fatty Acid Synthesis by Depleting Malonyl-ACP.
We began our analysis of FAS kinetics by using our model to examine the inhibitory effect of high concentrations of FabH. Previous studies have posited that this effect might result from either (i) the sequestration of ACPs (i.e., high concentrations of FabH might bind to holo-ACP and/or acyl-ACPs and, thus, sequester them from the reaction mixture)23 or (ii) the depletion of malonyl-ACP, a substrate of FabF.30 To test the first explanation, we eliminated terms describing binding of FabH to holo- and acyl-ACPs (Table S1); this modification, however, yielded only a slight reduction in inhibition (Figure 2C), suggesting that component sequestration was not its primary cause. To test the second explanation, we altered our modified model further by adding variants of FabD that generate FabH- and FabF-specific pools of malonyl-ACP. This modification had two prominent effects: (i) It reduced initial rates (an expected outcome, given the reduced concentration of malonyl-ACP available for initiation), and (ii) it eliminated the inhibitory effect of high concentrations of FabH (Figure 2C). Our analysis, thus, indicates that high concentrations of FabH inhibit FAS activity by competing with FabF for malonyl-ACP.
Excess holo-ACP, FabF, and TesA Inhibit Fatty Acid Synthesis by Sequestering FAS Components.
We tested the ability of our model to capture trends in data to which it was not fit by examining the inhibitory effects of holo-ACP, FabF, and TesA reported by Khosla and colleagues.23 To our satisfaction, our model predicted these effects (i.e., fractional reductions in initial rates were similar to those observed in in vitro experiments; Figure 3A,C,E) and, thus, appeared to accurately capture the mechanisms by which FAS components influence overall activity.
Figure 3.
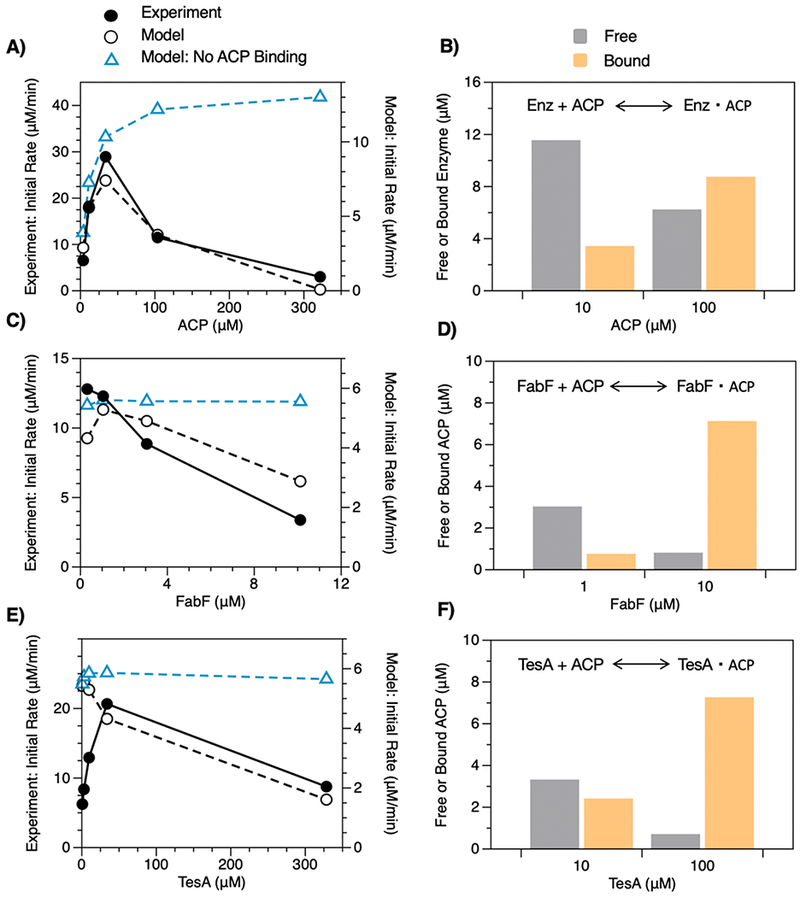
Influence of ACP, FabF, and TesA on FAS activity. Initial rates of fatty acid synthesis exhibited by reconstituted FASs (1 μM of each Fab, 10 μM TesA, 10 μM holo-ACP, 1 mM NADPH, 1 mM NADH, 0.5 mM malonyl-CoA, and 0.2 mM acetyl-CoA, 2.5 min) with varying concentrations of (A) ACP, (C) FabF, and (E) TesA. The model captures the inhibitory effects of each component and provides a mechanistic explanation. (A) High concentrations of ACP reduce initial rates by (B) sequestering enzymes from the reaction mixture. In (A), a modified model that lacks interactions between enzymes and holo-ACP shows no inhibition (dashed blue line). Similarly, high concentrations of (C) FabF and (E) TesA reduce initial rates by (D, F) sequestering ACP. Modified models that lack (D) FabF-ACP or (F) TesA-ACP interactions show no inhibition (dashed blue lines).
An inventory of bound and free forms of holo-ACP, FabH, and TesA indicate that excess concentrations of these species inhibit fatty acid synthesis by sequestering key proteins (Figures 3B,D,F). To examine this effect more directly, we removed terms describing the binding of (i) all enzymes to holo-ACP, (ii) FabF to holo-ACP, or (iii) TesA to holo-ACP. Unlike with FabH, these modifications eliminated inhibition (Figure 3A,C,E) and, thus, indicated that component sequestration was its primary cause. The results of this analysis are intriguing because they imply that the strength of enzyme-ACP interactions determines the optimal composition of FASs (an implication supported by previous observations that heterologous ACPs can reduce FAS activity30,31). Efforts to exchange or modify ACPs—or the enzymes with which they interact—are, thus, likely to require compositional reoptimization, a step rarely taken in metabolic engineering.
Excess FabI and FabZ Enhance Rates of Fatty Acid Synthesis.
Many studies of FASs seek to improve rates of fatty acid synthesis by identifying and removing metabolic bottlenecks.32,33 In one such study, Khosla and colleagues observed that high concentrations of FabZ and FabI (relative to a base system) could enhance FAS activity both in vitro and in vivo.23 Motivated by this result, we used our model to examine the influence of these two enzymes on rates of fatty acid synthesis. Our results revealed trends similar to those observed in vitro: as concentrations of FabI and FabZ increased, initial rates increased in a hyperbolic manner (Figure 4). Importantly, model-predicted optima occurred at lower enzyme concentrations than experimental optima, but a reduction in modeled values of kcat for both enzymes reduced this discrepancy; our model may thus overestimate activities of FabI and FabZ.
Figure 4.
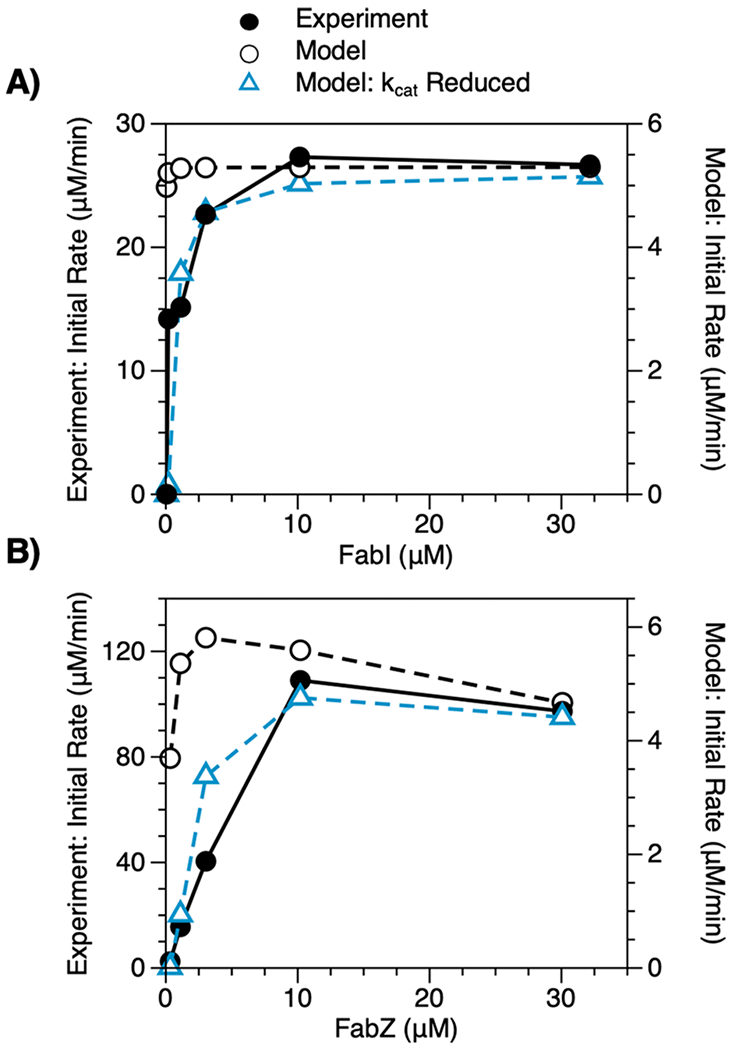
Influence of FabI and FabZ on FAS activity. Initial rates of fatty acid synthesis exhibited by reconstituted FASs (1 μM of each Fab, 10 μM TesA, 10 μM holo-ACP, 1 mM NADPH, 1 mM NADH, 0.5 mM malonyl-CoA, and 0.2 mM acetyl-CoA) with varying concentrations of (A) FabI and (B) FabZ. As enzyme concentrations increase, initial rates increase in a hyperbolic manner. Model-predicted optima occur at lower enzyme concentrations than experimental optima; however, when modeled values of kcat for FabI or FabZ are reduced by 100- and 10-fold, respectively, predicted and experimental trends agree well (dashed blue lines). FabZ improves initial rates over a wider range of enzyme concentrations than FabI and may, thus, limit FAS activity over a wider range of conditions.
Overall, trends in initial rates indicate that both FabZ and FabI can increase FAS activity but show that FabZ does so over a wider range of concentrations than does FabI (i.e., a range that may be more likely to include physiologically relevant conditions). The pronounced influence of FabZ likely results from the combined effects of its slow production of enoyl-ACP and the rapid consumption of enoyl-ACP by FabI; enoyl-ACP thus acts as a rate-limiting intermediate. A formal analysis of reaction intermediates supports this assertion: FabZ enhances rates of fatty acid synthesis until steady-state concentrations of enoyl-acyl-ACP plateau (Figure S4C,D). The “valve-like” behavior of FabZ, alongside previous reports of the titer-enhancing benefits of FabZ overexpression,23,25,34 suggests that this enzyme catalyzes a rate-limiting step in fatty acid synthesis.
Carbon Flux Affects Total Production and Chain Length.
Metabolic engineers often seek to improve the yields of biological products by increasing the flux of carbon to the pathways that make them.35–37 FASs are somewhat unique among metabolic pathways, however, because their cyclic structure enables carbon to enter simultaneously at two steps: initiation and elongation. Changes in flux are, thus, likely to alter total production and product profile in a simultaneous—and largely nonintuitive—manner. We used our model to explore this influence.
In brief, we modeled FAS compositions with different concentrations of malonyl-CoA (a surrogate for flux) and measured total production and average chain length at 12.5 min. At this biologically relevant time point (c.a., half the doubling time of E. coli38), differences in FAS outputs between compositions result from differences in the steady-state kinetics of fatty acid production (Note 3 in the Supporting Information). Figure 5A shows the results of our analysis. As concentrations of malonyl-CoA increase, both total production and average chain length increase in a hyperbolic manner. Associated changes in initiation and elongation events help to explain these trends (Figure 5B): a gradual increase in the number of initiation events (the number of acyl-ACPs that will eventually exit the FAS as fatty acids) enhances total production, while an abrupt increase in the ratio of elongation to initiation events (the relative activities of FabF and FabH on malonyl-ACP) causes abrupt elongation. These findings suggest two regimes of influence: (i) At low carbon fluxes, changes in flux modify chain length by altering the relative kinetics of initiation and elongation reactions. (ii) At medium to high fluxes, by contrast, they affect only overall rates of synthesis.
Figure 5.
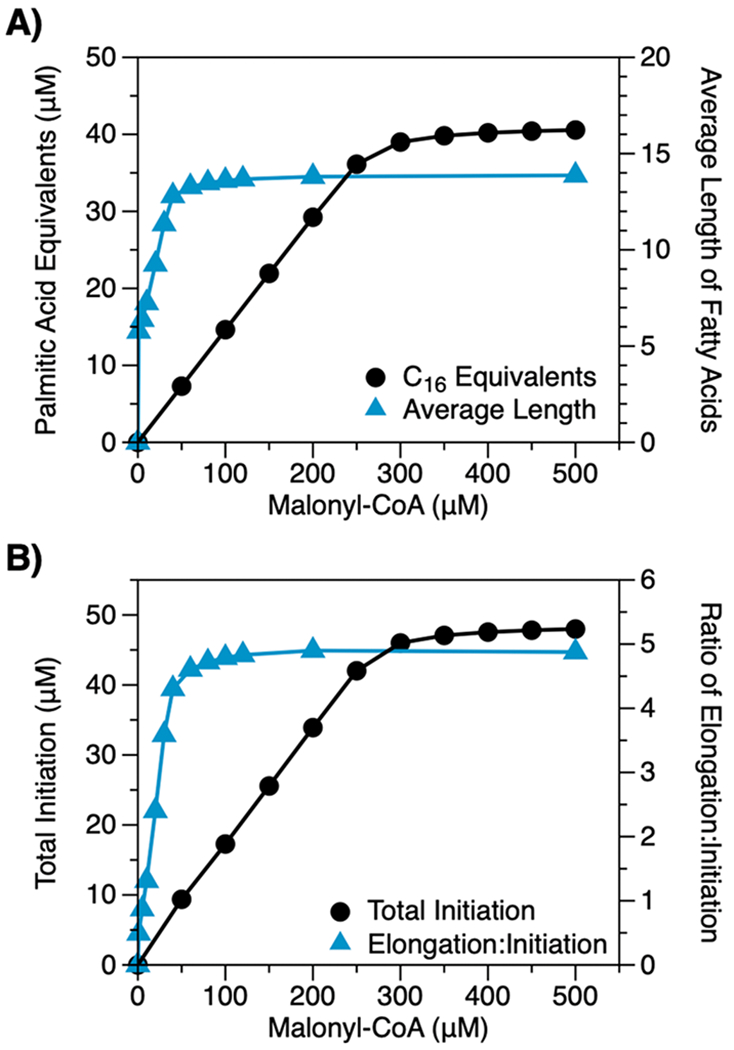
Influence of carbon flux on FAS outputs. (A) Total production and average length of fatty acids generated by modeled FASs (1 μM of each Fab, 10 μM TesA, 10 μM holo-ACP, 1 mM NADPH, 1 mM NADH, and 0.5 mM acetyl-CoA, 12.5 min) with varying concentrations of malonyl-CoA. As concentrations of malonyl-CoA increase, production levels increase gradually, while average length increases abruptly over a narrow range of concentrations. (B) Enhanced production levels correlate with an increase in initiation events; average chain length, with an increase in the ratio of elongation to initiation events (i.e., the relative activities of FabF and FabH on malonyl-ACP).
Coordinated Changes in the Concentrations of FabH, FabF, and TesA Enable Independent Tuning of Total Production and Chain Length.
The results of our analysis of carbon flux are intriguing because they indicate that changes in the relative rates of interdependent steps can have a pronounced influence on FAS outputs. To explore this effect further, we examined the influence of changes in the ratios of FabH, FabF, and TesA—three enzymes previously targeted in metabolic engineering studies5,18,39—on total production and chain length. To our surprise, simple adjustments in the relative concentrations of these enzymes yielded both (i) changes in average length that preserved total production (e.g., region 1 in Figure 6) and (ii) changes in total production that preserved average length (e.g., region 2 in Figure 6). Importantly, the breadth of compositions associated with each adjustment was length-specific, and few compositions could achieve lengths of 12 or below without reducing production levels (a result suggestive of the need for additional modifications to achieve short- or medium-chain products). The findings of our compositional analysis are striking because they indicate that simple changes in the ratios of FAS components (i.e., changes that might be introduced with modifications to ribosome binding sites40) may enable fine-tuning of FAS outputs.
Figure 6.
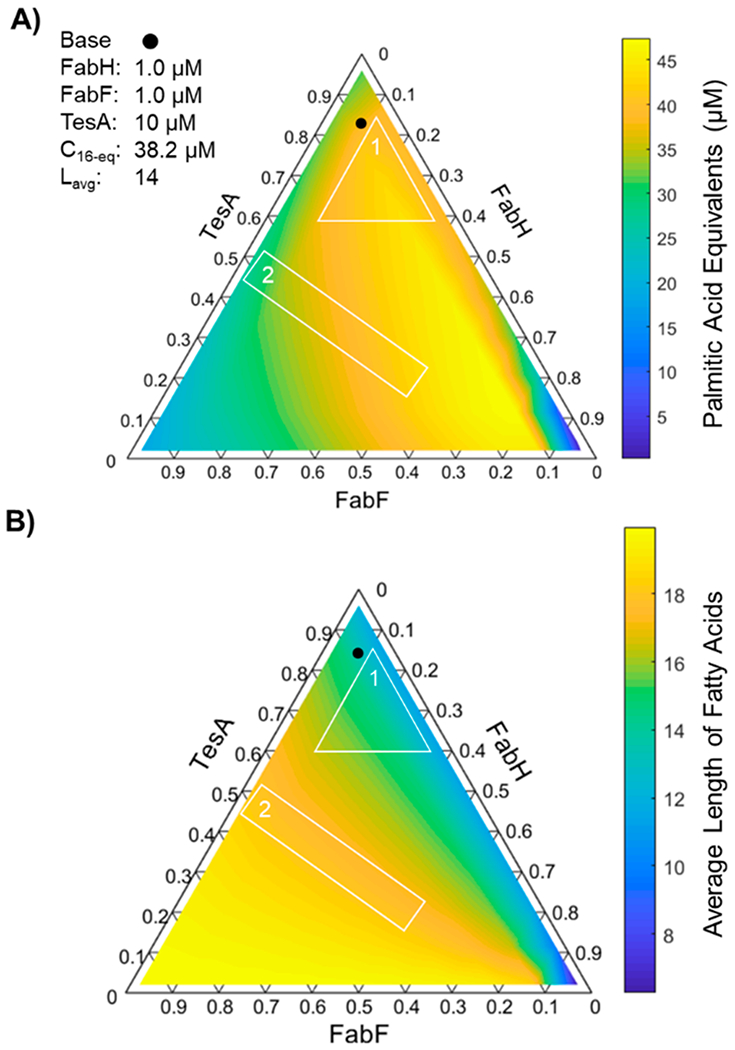
Influence of relative concentrations of FabH, FabF, and TesA on FAS outputs. Ternary diagrams show (A) total production and (B) average length of fatty acids generated by modeled FASs (1 μM of each Fab, 10 μM holo-ACP, 1 mM NADPH, 1 mM NADH, 0.5 mM malonyl-CoA, and 0.5 mM acetyl-CoA, 12.5 min) in which ratios of FabH, FabF, and TesA vary (i.e., [FabH] + [FabF] + [TesA] = 12 μM). Compositional adjustments in region 1 change average length (C12–C16) but leave production levels nearly unaltered (38–43 μM); adjustments in region 2, by contrast, alter production levels (25–44 μM) but not chain length (C18). The reference point (filled circle) denotes the composition examined in Figure 2A.
Optimal Concentrations of FabF Differ Among Thioesterases.
The limited natural supply of medium-chain fatty acids (i.e., 4–12 carbons) has motivated many efforts to synthesize these molecules in microbial hosts.18,19,41 Heterologous thioesterases specific for medium-chain acyl-ACPs can accomplish this feat, but they tend to reduce yields of fatty acids by rebalancing initiation, elongation, and/or termination rates.42–44 In one intriguing study of plant-derived thioesterases, Silver and colleagues adjusted this balance—and improved yields of medium-chain fatty acids in E. coli—by using an inhibitor of FabF to slow rates of elongation.5 Motivated by their work—and the desire to identify a “genetically encodable” (i.e., inhibitor-free) solution to the same problem—we used our model to optimize concentrations of FabF around different varieties of thioesterase.
Briefly, we parametrized the substrate specificities of plant-derived thioesterases specific for C4, C8, or C12 acyl-ACPs (Figure 7A) and examined their ability to generate fatty acids in the presence of varying concentrations of FabF. This analysis afforded two interesting observations. (i) Total fatty acid production by FASs with specialized thioesterases (e.g., CpFatB1 and UcFatB) showed a pronounced sensitivity to FabF concentration (Figure 7B). (ii) Optimal (i.e., production-maximizing) concentrations of FabF increased with the average chain length of FAS products (Figure 7C). The second observation is consistent with the results of in vivo studies, which indicate that optimal FabF activity scales with the length of thioesterase targets.5
Figure 7.

Analysis of the interdependence of thioesterase specificity and FabF concentration. (A) Product distributions for modeled FASs (1 μM of each Fab, 10 μM thioesterase, 10 μM holo-ACP, 1 mM NADPH, 1 mM NADH, 0.5 mM malonyl-CoA, and 0.5 mM acetyl-CoA, 12.5 min) containing thioesterases specific for C4 (BfTES), C8 (CpFatB1), C12 (UcFatB), and C14 acyl-ACPs (TesA). (B) Total production by FASs from (A) with varying concentrations of FabF. FASs that contain thioesterases with narrow substrate specificities (e.g., CpFatB1 and UcFatB) show a pronounced sensitivity to FabF concentration. (C) Optimal concentrations of FabF increase with the length of thioesterase targets in both (i) the base model and (ii) a modified model that lacks inhibition of FabH by acyl-ACPs. The similarity in trends generated by these two models suggests that optimal FabF concentrations do not minimize inhibition but, rather, maximize the availability of acyl-ACPs targeted by thioesterases.
Optimal FabF concentrations could plausibly (i) minimize FabH inhibition (i.e., reduce concentrations of long-chain acyl-ACPs that inhibit FabH24) or (ii) maximize substrate availability (i.e., increase the concentration of acyl-ACPs targeted by thioesterases). When we ran our model in the absence of FabH inhibition, however, optimal concentrations of FabF remained unchanged (Figure 7C). Our results thus indicate that FabF-derived improvements in the total production result from an increase in the concentration of acyl-ACPs targeted by thioesterases. This finding is consistent with both (i) the heightened sensitivity of highly specific thioesterases to FabF (i.e., suboptimal concentrations of FabF can easily shift substrate lengths away from the thioesterase-preferred length) and (ii) the high FabF requirements of thioesterases specific for long-chain acyl-ACPs (which require multiple elongation steps).
Narrow Distributions of Fatty Acids Require Specialized Enzymes.
Our analysis of FAS compositions highlights two approaches for modifying the length of fatty acids: (i) changes in the concentrations of catalytic components and (ii) changes in the identities of those components. To compare these two approaches to each other, we examined the product distributions afforded by each. We began by optimizing the enzyme concentrations of the FAS to build fatty acids with average lengths of 8, 10, 12, and 14 carbons (Figure 8A). As expected, compositions with high concentrations of TesA and high TesA/FabF ratios generated short fatty acids, while compositions with low concentrations of TesA and low TesA/FabF ratios generated long fatty acids. The distributions afforded by these compositions, however, were broad and, thus, suboptimal for the production of fine chemicals. To evaluate the ability of novel thioesterases to build narrow product profiles, we optimized FASs containing different thioesterases around narrow distributions centered at C8 and C12. Interestingly, only FASs with highly specific thioesterases could generate these distributions (Figure 8B). The results thus indicate that changes in component ratios are sufficient to control the mean—but not the width—of fatty acid profiles.
Figure 8.
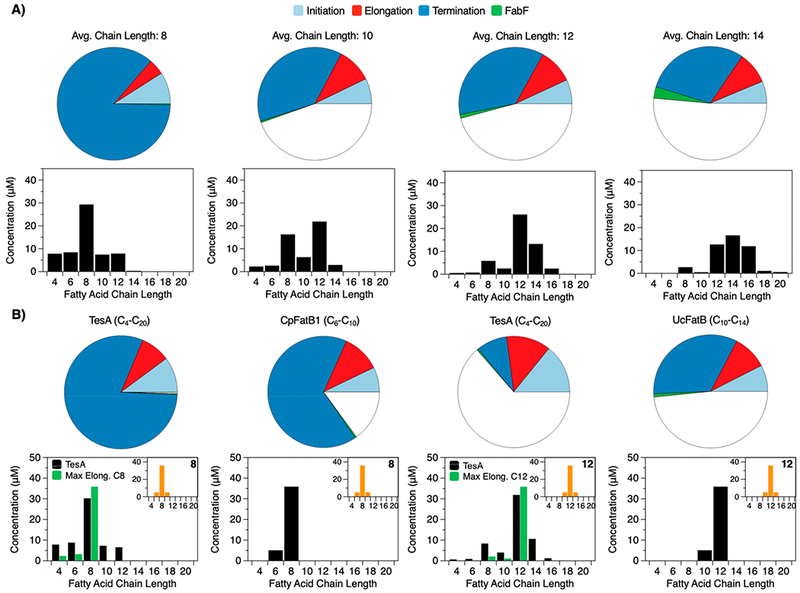
Analysis of product distributions. (A, B) Top: Modeled FAS compositions with enzyme concentrations optimized to generate different average chain lengths (base system: 10 μM holo-ACP, 1 mM NADPH, 1 mM NADH, 0.5 mM acetyl-CoA, and 0.5 mM malonyl-CoA). Differences in the total colored area of each plot reflect differences in total enzyme concentration between compositions. Bottom: product distributions associated with each composition (12.5 min). (B) Top: FAS compositions optimized to generate narrow product distributions (orange, bottom). Compositions are identical to those in (A) but, where indicated, include non-native components (i.e., CpFatB1, UcFatB, or versions of FabF that cannot elongate beyond 8 or 12 carbons) in place of native ones. Bottom: Narrow distributions require specialized thioesterases or elongation-restricted mutants of FabF.
Specialized variants of FabF provide an alternative—if less commonly explored—strategy for adjusting product distributions. In an early study, Dehesh and colleagues showed that steric obstructions in the binding site of this enzyme could prevent the elongation of long-chain acyl-ACPs.45 To evaluate the control afforded by these “elongation-restricted” mutants, we optimized the enzyme concentrations of mutant-containing FASs around narrow distributions of fatty acids; to our surprise, mutants of FabF could achieve these distributions (Figure 8B). Our analyses thus indicate that both highly specific thioesterases and sterically hindered ketoacyl synthases permit the production of narrow product profiles.
A Sensitivity Analysis Provides General Rules for Tuning FASs.
Having established the ability of our model to recreate—and help explain—trends from in vitro and in vivo data, we used it to develop general rules for tuning FAS outputs. In brief, we applied the Morris method, a global sensitivity analysis, to identify the kinetic parameters that most strongly influence (i) average chain length, (ii) total production, and (iii) a fitting objective (i.e., ObjA, a measure of the similarity of predicted and measured trends in Figure 2A,B). This method supplies a metric, termed the normalized “elementary effect”, for the sensitivity of a specified output to a model parameter. To begin, we examined the sensitivity of each output to the 12 fit parameters; several lumped parameters (e.g., c2, which scales kcat for multiple enzymes), however, were highly influential (Figure 9A), so we decomposed them into enzyme-specific terms and reran our analysis (Figure 9B). Results of this second test indicated that average chain length was most sensitive to the substrate specificity of TesA and to the activities of TesA and FabF, while total production was most sensitive to the activities of FabD and FabZ. The sensitivity of the fitting objective reflected a simple sum of the two sets of effects. The contributions of TesA and FabF to chain length are consistent with their reported ability to alter product profiles;5,18,19 the contributions of FabZ and FabD to production, in turn, agree with their observed effects on yield and titer.23,25,46
Figure 9.
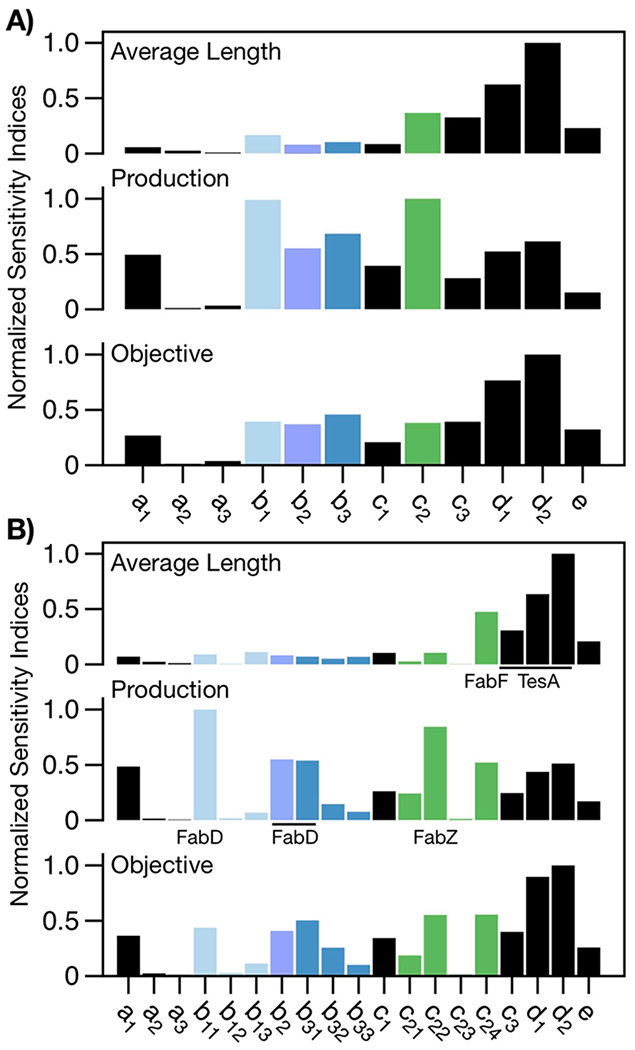
Sensitivity analysis. (A) Normalized mean elementary effect for each fit parameter (Table 1). The average chain length is most sensitive to c2, c3, d1, and d2, and total production is most sensitive to b1 b2, b3, and c2. (B) An expanded analysis shows mean elementary effects of enzyme-specific contributions: The average length is most sensitive to the substrate specificity of TesA (d1 and d2) and the activities of FabF and TesA (c24 and c3, respectively), while total production is most sensitive to the activities of FabD (b11, b2, and b31) and FabZ (c22; Table 1). The sensitivity of the fitting objective is simply additive. A comparison of the sensitivities indicates that FabD and FabZ primarily affect total production, while TesA and FabF affect both production and product profile.
The results of our sensitivity analysis suggest an important limit on the effects afforded by single-component adjustments to FAS compositions. TesA and FabF influence both chain length and total production, while FabD and FabZ affect only the latter. Changes in the identity and/or expression level of individual components thus enable fine-tuning of total production, but not product profile, which requires coordinated changes in multiple enzymatic steps.
CONCLUSIONS
Metabolic pathways use complex systems of interacting catalysts to convert simple inputs (e.g., glucose) into complex, dynamically adjustable outputs (e.g., the plasma membrane).47,48 Efforts to engineer these pathways thus require an understanding of the kinetic relationships that govern catalytic collaboration within them. In this study, we developed a mechanistic kinetic model of the E. coli FAS and used it to determine how different enzymes work together to control FAS outputs. The model’s ability to predict trends from a range of in vitro and in vivo data sets indicates that the reactions on which it focuses (i.e., those catalyzed by the seven enzymes necessary to build saturated fatty acids) are largely responsible for those trends.
The central findings help explain perplexing results from experimental studies and provide new strategies for controlling fatty acid production in microbial systems. Perturbational analyses indicate that the modification and/or overexpression of one FAS component can depress fatty acid production (a commonly observed phenomenon5,9,49) by sequestering the proteins with which it interacts and/or by depleting common substrate pools. Importantly, we show that suboptimal concentrations of FabF can reduce fatty acid synthesis by lowering concentrations of acyl-ACPs targeted by thioesterases—a common target of metabolic engineering. Compositional studies, in turn, suggest that both (i) coordinated changes in the concentrations of catalytic components and (ii) adjustments to the substrate specificities of those components can alter the average length of fatty acids but indicate that adjustments to the distributions of those lengths require thioesterases and/or ketoacyl synthases with appropriately focused substrate specificities.
The results of this study suggest two general rules for FAS design. (i) They indicate that the exchange of nonnative components with native ones (e.g., alternative versions of ACP, TesA, FabF, or FabH for wild-type variants) will likely require concomitant changes in concentration or activity of other FAS components. (ii) They suggest that single-component adjustments—at least within the FAS of E. coli—enable independent tuning of production levels but not product profiles. The relevance of the specific controls identified (i.e., FabD, FabZ, TesA, and FabF) to other FASs merits exploration in future work; the general ability of some components to adjust one output, while others influence several, however, is broadly interesting because the interdependence of different kinetic steps is rarely considered in engineering efforts. Broadly, the findings of this study highlight the precision afforded by coordinated changes in the composition of FASs and provide new strategies for building biocatalytic systems (and microbial hosts) with precisely defined product profiles.
MATERIALS AND METHODS
Assembly and Solution of the Kinetic Model.
Our mechanistic kinetic model captures the combined activities of the enzymes depicted in Figure 1 with a system of rate equations derived from the mechanisms depicted in Table 1 and Table S1 (Appendix 1 in the Supporting Information). Our model uses physiologically relevant concentrations of enzymes, substrates, and cofactors as described by Khosla and colleagues.23 We generated numerical solutions to our final system of differential equations (a system that is stiff at early time points) by using the MATLAB solver ode15s with a relative error tolerance of 1e-4 and an absolute error tolerance of 1e-6.
Parameterization of the Kinetic Model.
We based initial estimates of model parameters on the results of detailed experimental studies (Table S4). We used estimates of kcat as given, and we decomposed estimates of Kd and KM, which rely on equilibrium or steady-state assumptions, by using eqs 1 and 2, alongside literature-based estimates of koff. In our fitting routine, we adjusted values of koff by using eqs 1 and 2 to recalculate kon under the assumption that KM or Kd are constants.
| (1) |
| (2) |
Materials and Resources.
We purchased reagents for buffer and media from Thermo Fisher Scientific (Waltham, MA), substrates and cofactors for kinetic experiments from Sigma-Aldrich (St. Louis, MO), enzymes for cloning from New England Biolabs (Ipswich, MA), and kits for DNA extraction and purification from Qiagen (Hilden, Germany). We performed distributed computing with the Google Cloud Compute Engine (https://cloud.google.com/).
Design of Plasmids.
We used three plasmids to express apo-ACP, TesA, and Sfp (a 4′-phospho-pantetheinyl transferase from Bacillus subtilis) in E. coli. For TesA, we isolated genomic DNA from E. coli by using the DNeasy Blood and Tissue Kit (Qiagen); we amplified the TesA gene by using primers that add 6X polyhistidine tags to the N-terminus (we removed its native N-terminal signal sequence): ATATCCATGGGCAGCAGCCATCATCATCATCATCACATGGCGGACACGTTATTGATTCTG (forward) and TTTTTGGATCCATTATGAGTCATGATTTACTAAAGGCTGCAACTGCTTCGCCAT (reverse), and we cloned the amplified gene into pET16b (Novagen). For Sfp and apo-ACP, we used plasmids with N-terminal polyhistidine-tagged versions of each protein (i.e., pET29b and pET22b, respectively); these plasmids were supplied by the Barkart lab. We verified all sequences with Sanger sequencing (Quintara Bio).
Expression and Purification of Proteins.
We expressed TesA, apo-ACP, and Sfp by carrying out the following steps. (i) We transformed each plasmid into E. coli BL21(DE3) by using heat shock. (ii) We spread the transformed cells onto antibiotic-containing LB plates (100 μg/mL of carbenicillin or 50 μg/mL of kanamycin) and incubated them at 37 °C for 12 h. (iii) We used a single colony, thus generated, to inoculate 20 mL LB media (100 μg/mL of carbenicillin), and we placed this culture in an incubator shaker (37 °C, 150 rpm) for 4–5 h until it turned visibly cloudy. (iv) We used our initial culture to inoculate 1 L of expression media (20 g of tryptone, 10 g of yeast extract, 5 g of NaCl, 4 g of M9 salts, 4 g of glucose, and 100 mg of carbenicillin), and we placed this new culture in an incubator shaker (37 °C, 150 rpm) for 2–3 h until it reached an OD600 value of 0.5–0.8. (v) We induced expression by adding isopropyl β-d-1-thiogalactopyranoside (IPTG) at a concentration of 0.1–0.5 mM, and we returned the culture to an incubator shaker set to 20 °C. (vi) After 16–20 h, we pelleted the cells.
We purified all proteins with the following steps. (i) We lysed the cell pellets by incubating them (1 h, rocking platform) with lysis buffer (4 mL/g pellet): 4 mL of B-PER [Thermo Fisher], 1 mg of MgSO4, 2 mg of Nα-p-tosyl-l-arginine methyl ester hydrochloride, 3.5 mg of tris(2-carboxyethyl)phosphine (TCEP), 3.75 μL of phenylmethylsulfonyl fluoride, 0.5 mg of lysozyme, and 10 μL of DNase). (ii) We clarified the lysate by pelleting the cell debris and adding saturated ammonium sulfate at 20% (v/v), followed by immediate centrifugation. (iii) We exchanged the protein into Tris-HCl buffer (50 mM Tris-HCl, pH 7.5, 0.5 mM TCEP) by using a desalting column (HiPrep 26/10, GE Healthcare). (iv) We flowed the desalted lysate over a nickel column (HisTrap HP) and eluted the purified protein with imidazole (a step gradient of Tris-HCl buffer with 300 mM imidazole). (v) We exchanged the eluent back into Tris-HCl buffer (50 mM Tris-HCl, pH 7.5, 0.5 mM TCEP), flowed the resulting solution over an anion exchange column (HiPrep Q HP 16/10, GE Healthcare), and eluted the protein with NaCl (a gradient of Tris-HCl buffer with 1 M NaCl). (vi) We stored the final desalted proteins in 20% glycerol at −80 °C.
Synthesis of Holo-ACP.
We synthesized holo-ACP by using Sfp to transfer the 4′-phosphopantetheinyl moiety of coenzyme A to apo-ACP.50 In brief, we incubated apo-ACP, Sfp, and CoA at 37 °C for 3 h (50 μM ACP, 2 μM Sfp, 200 μM CoA, 1 mM MgCl2, 1 mM TCEP, 50 mM Tris HCl, pH 7.5), and we used anion exchange to separate holo-ACP and apo-ACP from the final mixture. We stored the purified holo-ACP as described above.
Parameterization of TesA Activity.
To parametrize the activity of TesA, we fit values of kcat and KM to previously collected kinetic data describing the activity of TesA on acyl-CoAs of different lengths (Figure S2A and Table S2),19 and we used eqs 1 and 2 to convert values of KM to estimates of Kd (for this effort, we estimated koff to be 2.0 s−1, an intermediate value; Table S4). For C4, C18, and C20 acyl-CoAs, we estimated values of kcat, KM, and Kd by extrapolating trends exhibited by values of kcat, KM, and Kd for C6–C16 acyl-CoAs (Figure S2B–D).
In our optimization routine, we adjusted the activity of TesA with three fit parameters. The first, c3, scales estimates of kcat by retaining their relative values (Figure S2B); the second two, d1 and d2, adjust a subset of Kd values with a linear free-energy relationship (eq 3, Figure S2D).
| (3) |
In brief, we retained original estimates of Kd for short substrates (≤C12) and used the linear free-energy relationship for long substrates (i.e., eq 3 passes through the point (C12, ln Kd-C12) with d1 and d2 as fit parameters). Interestingly, despite their different bases of estimation, final values of ln Kd for all acyl-ACPs fell onto a single line (Figure S2D).
Parameterization of Enzyme-holo-ACP Binding.
We measured the affinity of TesA for holo-ACP by examining TesA-catalyzed hydrolysis of p-nitrophenylbutyrate (pNP4) in the presence of holo-ACP (Figure S2E). In brief, we prepared a 96-well plate (100 μL, 50 mM Tris-HCl, pH 7.5, 0.1 mM TCEP, 0.1 μM TesA, 5% DMSO) with varying concentrations of pNP4 (100 μM to 10 mM) and holo-ACP (0, 2, and 10 μM), and we monitored hydrolysis by measuring absorbance at 405 nm (4-nitrophenol) with a SpectraMax M2 plate reader. To our surprise, the kinetic data fit well to an activation model in which the TesA-ACP complex had a Kd value of ~9 μM (Figure S2E and Table S3). The ability of holo-ACP to activate TesA-catalyzed hydrolysis of small substrates is intriguing, but because holo-ACP and acyl-ACPs likely share the same binding site, we used the Kd determined in our kinetic study as an estimate of KI for competitive inhibition.
Previous studies indicate that holo-ACP binds to FabG, FabZ, FabI, and FabF;51–54 data on the affinity of these interactions, however, is scarce. We used our estimate of Kd for the TesA-ACP complex as an initial estimate of the Kd values for complexes between holo-ACP and FabG, FabZ, FabI, and FabF. By contrast, for FabH, where the inhibitory effect of holo-ACP is ill-defined,15,54 we assumed a binding constant that is 100-fold weaker than those of other enzymes.
Parameterization of FabH Inhibition.
Long-chain acyl-ACPs regulate flux through the fatty acid pathway by inhibiting FabH—a form of negative feedback.48 We parametrized this inhibition in three steps. (i) We fit a detailed kinetic model of FabH-catalyzed condensation of acetyl-CoA and malonyl-ACP (lines (3) and (4) in Table 1) to previously reported initial rates measured at varying concentrations of these two substrates (Figures S3A,B)55. (ii) With this model as a starting point, we fit inhibition constants for palmitoyl-ACP (i.e., KI,1 and KI,2 as defined in Table S1) to initial rates measured under varying concentrations of this inhibitor (Figure S3C,D). (iii) We estimated length-specific values of inhibition constants by fitting them to data showing the inhibitory effects of acyl-ACPs of various lengths (Figure S3E).
Parameterization of FabZ.
The equilibrium of the dehydration reaction catalyzed by FabZ favors substrates over products by a ratio of ~4:1;56 however, to develop our model, we approximated this reaction as irreversible in the presence of FabI, which rapidly consumes enoyl-acyl-ACP.22 An examination of the concentrations of β-hydroxyacyl-ACP and enoyl-acyl-ACP, which are present at a ratio of ~60:1 in the base model and ~500:1 in the model with a reduced kcat value for FabZ (Figure 4B), supports this approximation (Figure S4A,B).
Optimization of the Kinetic Model.
We optimized estimates of scaling parameters by carrying out the following steps. (i) We used diffusion calculations (Note 1 in the Supporting Information) and previously reported kinetic measurements to estimate physically relevant ranges of each kinetic parameter (Table S5) and, subsequently, to estimate ranges of each scaling parameter (Table S6). (ii) We constructed 500 initial guesses of 11 scaling parameters (all but “e” as defined in Table 1) by randomly sampling the range associated with each (i.e., we sampled a uniform distribution defined by the logarithm of the upper and lower limits of each range). (iii) We used distributed computing to determine if the model, when parameterized with the 500 sets of guesses, could predict the time-course profile and product distribution depicted in Figure 2A,B. (We note that the experimental systems used to generate Figures 2A–C, 3, and 4 and Figure S5 include FabA and FabB, which are neglected by our model; our fits—and, later, our model predictions—assume that these enzymes make a negligible contribution to trends in production rates and length-specific product distributions of the FAS.) (iv) We compared predicted and measured trends with ObjA = SSEset1 × SSEset2; here, SSEset1 and SSEset2 represent the sums of squared errors for Figure 2A,B, respectively. (v) We used the 20 best-performing sets of guesses (i.e., those with the lowest values of ObjA) to fit our model to the data in Figure 2A,B. Here, we used MATLAB function “fminsearch” (an implementation of the Nelder–Mead simplex method) with ObjA. (vi) We used the two best optimized sets of parameters to assess our model’s ability to predict the inhibitory effects of FabH and FabF (i.e., Figures 2C and 3C); poor agreement between predicted and experimental trends, however, suggested that our model did not accurately capture the strength of interactions between enzymes and holo-ACP. (vii) We introduced a twelfth parameter—e, which scales values of Kd that describe the binding of both FabH and FabF to holo-ACP and FabH to acyl-ACPs—and we reoptimized our model to the data in Figure 2. Here, we used the two parameter sets from step vi and ObjB = SSEset1 × SSEset2 × SSEset3, where SSEset3 represents the sum of squared errors for Figure S2C. (vii) The set of fit parameters with the lowest value of ObjB served as our starting point for all analyses described in this study (Table S6).
Parameterization of Plant-Derived Thioesterases.
We parametrized the activity and substrate specificity of plant-derived thioesterases by using data sets from two in vivo studies. The first data set included total fatty acids generated by strains of E. coli containing TesA or UcFatB (Figure S9A).57 The second data set included product distributions generated by strains containing BfTES, CpFatB1, or UcFatB (Figure S9B–D).5 These two sets of data, when combined, allowed us to parametrize both the activities and substrate specificities of BfTES, CpFatB1, or UcFatB. For context, BfTES was most active on C4 acyl-ACP and showed slight activity on C6 and C8 acyl-ACPs (Figure S9B), CpFatB1 was most active on C8 acyl-ACP and showed minor activity on C6 and C10 acyl-ACPs (Figure S9C), and UcFatB was most active on C12 acyl-ACP and showed some activity on C10 and C14 acyl-ACPs (Figure S9D). We optimized kinetic parameters by fitting FASs with plant-derived thioesterases to the production levels depicted in Figure S9A. For BfTES, we adjusted absolute values of kcat and Kd but maintained their relative values between substrates (i.e., for C4, C6, and C8 acyl-ACPs, we based initial estimates of kcat and Kd on measurements of kcat and Kd for TesA activity on C16, C18, and C20 substrates, respectively; for all other substrates, we set values of kcat to zero). For CpFatB1 and UcFatB, we adjusted values of kcat and Kd for major substrates by simultaneously moving both parameters along the lines depicted in Figure S2B,D; for minor substrates, we held values of kcat and Kd constant. (We based initial estimates of kcat and Kd for major substrates on measurements of kcat and Kd for TesA activity on C6 acyl-CoA; for minor substrates, we used TesA activity on C20 acyl-CoA, and for all other substrates, we set values of kcat to zero.)
Parameterization of Mutants of FabF.
We modeled elongation-restricted mutants of FabF by eliminating their activity on substrates longer than the specified “restriction length”. For example, for the mutant incapable of elongating beyond eight carbons (Figure 8B, left), we set values of kcat for C8–C20 to zero; for the mutant incapable of elongating beyond 12 carbons (Figure 8B, right), we set values of kcat for C12–C20 to zero. This parametrization is consistent with the results of in vitro studies, which indicate that elongation-restricted mutants of FabF retain their activities on substrates shorter than the restriction length.45
Sensitivity Analysis of the Kinetic Model.
We performed a sensitivity analysis of scaling parameters (Figure 9A) and enzyme-specific decompositions of those parameters (Figure 9B) by calculating the mean elementary effects as defined by the Morris method.58 (An elementary effect is the mean of a set of derivatives calculated at semirandom points within a model’s parameter space.59) We restricted the values of parameters explored in the sensitivity analysis to ranges that spanned up to 3 orders of magnitude (centered at the initial fit parameters). We used the SAFE toolbox60 to implement the analysis with the radial method (r = 100 trajectories) as described previously.59 Figure S10, which illustrates the convergence of the mean elementary effects, provides additional details of our analysis.
Supplementary Material
ACKNOWLEDGMENTS
This work was supported by the United States Army Research Office (W911NF-18-1-0159, J.M.F. and A.R.), an NIH training grant (GM65103, A.R.), and startup funds provided by the University of Colorado, Boulder (J.M.F. and A.R.).
ASSOCIATED CONTENT
Supporting Information
The Supporting Information is available free of charge on the ACS Publications website at DOI: 10.1021/acscatal.8b03171.
Estimates of diffusion limits for intramolecular association, studies of alternative time points and substrate concentrations, a description of mechanisms of inhibition, analyses of TesA activity, FabZ kinetics, and FabH inhibition, titration data for FabD and FabG, a parametrization of plant-derived thioesterases, analysis of the convergence of mean elementary effects, tables of kinetic constants and scaling parameters, kinetic equations, and a description of MATLAB files (PDF) MATLAB code for the kinetic model (ZIP)
The authors declare no competing financial interest.
REFERENCES
- (1).Kung Y; Runguphan W; Keasling JD From Fields to Fuels: Recent Advances in the Microbial Production of Biofuels. ACS Synth. Biol 2012, 1, 498–513. [DOI] [PubMed] [Google Scholar]
- (2).Beld J; Lee DJ; Burkart MD Fatty Acid Biosynthesis Revisited: Structure Elucidation and Metabolic Engineering. Mol. BioSyst 2015, 11, 38–59. [DOI] [PMC free article] [PubMed] [Google Scholar]
- (3).White SW; Zheng J; Zhang Y; Rock. The Structural Biology of Type II Fatty Acid Biosynthesis. Annu. Rev. Biochem 2005, 74, 791–831. [DOI] [PubMed] [Google Scholar]
- (4).Steen EJ; Kang Y; Bokinsky G; Hu Z; Schirmer A; McClure A; Del Cardayre SB; Keasling JD Microbial Production of Fatty-Acid-Derived Fuels and Chemicals from Plant Biomass. Nature 2010, 463, 559–562. [DOI] [PubMed] [Google Scholar]
- (5).Torella JP; Ford TJ; Kim SN; Chen AM; Way JC; Silver PA Tailored Fatty Acid Synthesis via Dynamic Control of Fatty Acid Elongation. Proc. Natl. Acad. Sci. U. S. A 2013, 110, 11290–11295. [DOI] [PMC free article] [PubMed] [Google Scholar]
- (6).Sarria S; Kruyer NS; Peralta-Yahya P Microbial Synthesis of Medium-Chain Chemicals from Renewables. Nat. Biotechnol 2017, 35, 1158–1166. [DOI] [PubMed] [Google Scholar]
- (7).Rock CO; Cronan JE Escherichia Coli as a Model for the Regulation of Dissociable (Type II) Fatty Acid Biosynthesis. Biochim. Biophys. Acta, Lipids Lipid Metab 1996, 1302, 1–16. [DOI] [PubMed] [Google Scholar]
- (8).White SW; Zheng J; Zhang Y-M; Rock. The Structural Biology of Type II Fatty Acid Biosynthesis. Annu. Rev. Biochem 2005, 74, 791–831. [DOI] [PubMed] [Google Scholar]
- (9).Steen EJ; Kang Y; Bokinsky G; Hu Z; Schirmer A; McClure A; Del Cardayre SB; Keasling JD Microbial Production of Fatty-Acid-Derived Fuels and Chemicals from Plant Biomass. Nature 2010, 463, 559–562. [DOI] [PubMed] [Google Scholar]
- (10).Davis MS; Solbiati J; Cronan JE Overproduction of Acetyl-CoA Carboxylase Activity Increases the Rate of Fatty Acid Biosynthesis in Escherichia Coli. J. Biol. Chem 2000, 275, 28593–28598. [DOI] [PubMed] [Google Scholar]
- (11).Beld J; Lee DJ; Burkart MD Fatty Acid Biosynthesis Revisited: Structure Elucidation and Metabolic Engineering. Mol. BioSyst 2015, 11, 38–59. [DOI] [PMC free article] [PubMed] [Google Scholar]
- (12).Nguyen C; Haushalter RW; Lee DJ; Markwick PRL; Bruegger J; Caldara-Festin G; Finzel K; Jackson DR; Ishikawa F; O’Dowd B; McCammon JA; Opella SJ; Tsai SC; Bukart MD Trapping the Dynamic Acyl Carrier Protein in Fatty Acid Biosynthesis. Nature 2014, 505, 427–431. [DOI] [PMC free article] [PubMed] [Google Scholar]
- (13).d’Espaux L; Mendez-Perez D; Li R; Keasling JD Synthetic Biology for Microbial Production of Lipid-Based Biofuels. Curr. Opin. Chem. Biol 2015, 29, 58–65. [DOI] [PubMed] [Google Scholar]
- (14).Pfleger BF; Gossing M; Nielsen J Metabolic Engineering Strategies for Microbial Synthesis of Oleochemicals. Metab. Eng 2015, 29, 1–11. [DOI] [PubMed] [Google Scholar]
- (15).Choi KH; Heath RJ; Rock CO β-Ketoacyl-Acyl Carrier Protein Synthase III (FabH) Is a Determining Factor in Branched-Chain Fatty Acid Biosynthesis. J. Bacteriol 2000, 182, 365–370. [DOI] [PMC free article] [PubMed] [Google Scholar]
- (16).Aguilar PS; De Mendoza D Control of Fatty Acid Desaturation: A Mechanism Conserved from Bacteria to Humans. Mol. Microbiol 2006, 62, 1507–1514. [DOI] [PubMed] [Google Scholar]
- (17).Cahoon EB; Lindqvist Y; Schneider G; Shanklin J Redesign of Soluble Fatty Acid Desaturases from Plants for Altered Substrate Specificity and Double Bond Position. Proc. Natl. Acad. Sci. U. S. A 1997, 94, 4872–4877. [DOI] [PMC free article] [PubMed] [Google Scholar]
- (18).Youngquist JT; Schumacher MH; Rose JP; Raines TC; Politz MC; Copeland MF; Pfleger BF Production of Medium Chain Length Fatty Alcohols from Glucose in Escherichia Coli. Metab. Eng 2013, 20, 177–186. [DOI] [PMC free article] [PubMed] [Google Scholar]
- (19).Grisewood MJ; Hernández-Lozada NJ; Thoden JB; Gifford NP; Mendez-Perez D; Schoenberger HA; Allan MF; Floy ME; Lai RY; Holden HM; Pfleger BF; Maranas CD Computational Redesign of Acyl-ACP Thioesterase with Improved Selectivity toward Medium-Chain-Length Fatty Acids. ACS Catal 2017, 7, 3837–3849. [DOI] [PMC free article] [PubMed] [Google Scholar]
- (20).Marrakchi; Zhang; Rock. Mechanistic Diversity and Regulation of Type II Fatty Acid Synthesis. Biochem. Soc. Trans 2002, 30, 1050–1055. [DOI] [PubMed] [Google Scholar]
- (21).Heath RJ; Rock CO Regulation of Fatty Acid Elongation and Initiation by Acyl-Acyl Carrier Protein in Escherichia Coli. J. Biol. Chem 1996, 271, 1833–1836. [DOI] [PubMed] [Google Scholar]
- (22).Heath RJ; Li J; Roland GE; Rock CO Enoyl-Acyl Carrier Protein Reductase (FabI) Plays a Determinant Role in Completing Cycles of Fatty Acid Elongation in Escherichia Coli. J. Biol. Chem 1995, 275, 4654–4659. [DOI] [PubMed] [Google Scholar]
- (23).Yu X; Liu T; Zhu F; Khosla C In Vitro Reconstitution and Steady-State Analysis of the Fatty Acid Synthase from Escherichia Coli. Proc. Natl. Acad. Sci. U. S. A 2011, 108, 18643–18648. [DOI] [PMC free article] [PubMed] [Google Scholar]
- (24).Heath RJ; Rock CO; Chem COJB Inhibition of BKetoacyl-Acyl Carrier Protein Synthase III (FabH) by Acyl-Acyl Carrier Protein in Escherichia Coli. J. Biol. Chem 1996, 271, 10996–11000. [DOI] [PubMed] [Google Scholar]
- (25).Ranganathan S; Tee TW; Chowdhury A; Zomorrodi AR; Yoon JM; Fu Y; Shanks JV; Maranas CD An Integrated Computational and Experimental Study for Overproducing Fatty Acids in Escherichia Coli. Metab. Eng 2012, 14, 687–704. [DOI] [PubMed] [Google Scholar]
- (26).Campbell JW; Cronan JEJ Escherichia Coli FadR Positively Regulates Transcription of the FabB Fatty Acid Biosynthetic Gene. J. Bacteriol 2001, 183, 5982–5990. [DOI] [PMC free article] [PubMed] [Google Scholar]
- (27).Xiao X; Yu X; Khosla C Metabolic Flux between Unsaturated and Saturated Fatty Acids Is Controlled by the FabA:FabB Ratio in the Fully Reconstituted Fatty Acid Biosynthetic Pathway of Escherichia Coli. Biochemistry 2013, 52, 8304–8312. [DOI] [PMC free article] [PubMed] [Google Scholar]
- (28).Alhamadsheh MM; Musayev F; Komissarov AA; Sachdeva S; Wright HT; Scarsdale N; Florova G; Reynolds KA Alkyl-CoA Disulfides as Inhibitors and Mechanistic Probes for FabH Enzymes. Chem. Biol 2007, 14, 513–524. [DOI] [PubMed] [Google Scholar]
- (29).Price AC; Zhang YM; Rock CO; White SW Structure of β-Ketoacyl-[Acyl Carrier Protein] Reductase from Escherichia Coli: Negative Cooperativity and Its Structural Basis. Biochemistry 2001, 40, 12772–12781. [DOI] [PubMed] [Google Scholar]
- (30).Dehesh K; Tai H; Edwards P; Byrne J; Jaworski JG Overexpression of 3-Ketoacyl-Acyl-Carrier Protein Synthase IIIs in Plants Reduces the Rate of Lipid Synthesis. Plant Physiol 2001, 125, 1103–1114. [DOI] [PMC free article] [PubMed] [Google Scholar]
- (31).Beld J; Blatti JL; Behnke C; Mendez M; Burkart MD Evolution of Acyl-ACP-Thioesterases and β-Ketoacyl-ACP-Synthases Revealed by Protein-Protein Interactions. J. Appl. Phycol 2014, 26, 1619–1629. [DOI] [PMC free article] [PubMed] [Google Scholar]
- (32).Nguyen HT; Park H; Koster KL; Cahoon RE; Nguyen HTM; Shanklin J; Clemente TE; Cahoon EB Redirection of Metabolic Flux for High Levels of Omega-7 Monounsaturated Fatty Acid Accumulation in Camelina Seeds. Plant Biotechnol. J 2015, 13, 38–50. [DOI] [PubMed] [Google Scholar]
- (33).Xu P; Gu Q; Wang W; Wong L; Bower AGW; Collins CH; Koffas M. a G. Modular Optimization of Multi-Gene Pathways for Fatty Acids Production in E. Coli. Nat. Commun 2013, 4, 1–8. [DOI] [PubMed] [Google Scholar]
- (34).Tee TW; Chowdhury A; Maranas CD; Shanks JV Systems Metabolic Engineering Design: Fatty Acid Production as an Emerging Case Study. Biotechnol. Bioeng 2014, 111, 849–857. [DOI] [PMC free article] [PubMed] [Google Scholar]
- (35).Schilling CH; Palsson BO The Underlying Pathway Structure of Biochemical Reaction Networks. Proc. Natl. Acad. Sci. U. S. A 1998, 95, 4193–4198. [DOI] [PMC free article] [PubMed] [Google Scholar]
- (36).Edwards JS; Palsson BO Metabolic Flux Balance Analysis and the in Silico Analysis of Escherichia Coli K-12 Gene Deletions. BMC Bioinf 2000, 1, 1–10. [DOI] [PMC free article] [PubMed] [Google Scholar]
- (37).Xu P; Li L; Zhang F; Stephanopoulos G; Koffas M Improving Fatty Acids Production by Engineering Dynamic Pathway Regulation and Metabolic Control. Proc. Natl. Acad. Sci. U. S. A 2014, 111, 11299–11304. [DOI] [PMC free article] [PubMed] [Google Scholar]
- (38).Sezonov G; Joseleau-Petit D; D’Ari R Escherichia Coli Physiology in Luria-Bertani Broth. J. Bacteriol 2007, 189, 8746–8749. [DOI] [PMC free article] [PubMed] [Google Scholar]
- (39).Li Y; Florova G; Reynolds KA Alteration of the Fatty Acid Profile of Streptomyces Coelicolor by Replacement of the Initiation Enzyme 3-Ketoacyl Acyl Carrier Protein Synthase III (FabH). J. Bacteriol 2005, 187, 3795–3799. [DOI] [PMC free article] [PubMed] [Google Scholar]
- (40).Salis HM; Mirsky EA; Voigt CA Automated Design of Synthetic Ribosome Binding Sites to Control Protein Expression. Nat. Biotechnol 2009, 27, 946–950. [DOI] [PMC free article] [PubMed] [Google Scholar]
- (41).Sherkhanov S; Korman TP; Bowie JU Improving the Tolerance of Escherichia Coli to Medium-Chain Fatty Acid Production. Metab. Eng 2014, 25, 1–7. [DOI] [PubMed] [Google Scholar]
- (42).Voelker T. a; Davies HM Alteration of the Specificity and Regulation of Fatty Acid Synthesis of Escherichia Coli by Expression of a Plant Medium-Chain Acyl-Acyl Carrier Protein Thioesterase. J. Bacteriol 1994, 176, 7320–7327. [DOI] [PMC free article] [PubMed] [Google Scholar]
- (43).Dehesh K; Edwards P; Hayes T; Cranmer A; Fillatti J Two Novel Thioesterases Are Key Determinants of the Bimodal Distribution of Acyl Chain Length of Cuphea Palustris Seed Oil. Plant Physiol 1996, 110, 203–210. [DOI] [PMC free article] [PubMed] [Google Scholar]
- (44).Rock CO; Jackowski S Regulation of Phospholipid Synthesis in Escherichia Coli. Composition of the Acyl-Acyl Carrier Protein Pool in Vivo. J. Biol. Chem 1982, 257, 10759–10765. [PubMed] [Google Scholar]
- (45).Val D; Banu G; Seshadri K; Lindqvist Y; Dehesh K Re-Engineering Ketoacyl Synthase Specificity. Structure 2000, 8, 565–566. [DOI] [PubMed] [Google Scholar]
- (46).Jeon E; Lee S; Won JI; Han SO; Kim J; Lee J Development of Escherichia Coli MG1655 Strains to Produce Long Chain Fatty Acids by Engineering Fatty Acid Synthesis (FAS) Metabolism. Enzyme Microb. Technol 2011, 49, 44–51. [DOI] [PubMed] [Google Scholar]
- (47).Pedley AM; Benkovic SJ A New View into the Regulation of Purine Metabolism: The Purinosome. Trends Biochem. Sci 2017, 42, 141–154. [DOI] [PMC free article] [PubMed] [Google Scholar]
- (48).Ohlrogge JB; Jaworski JG Regulation of Fatty Acid Synthesis. Annu. Rev. Plant Physiol. Plant Mol. Biol 1997, 48, 109–136. [DOI] [PubMed] [Google Scholar]
- (49).Choi YJ; Lee SY Microbial Production of Short-Chain Alkanes. Nature 2013, 502, 571–574. [DOI] [PubMed] [Google Scholar]
- (50).Quadri LEN; Weinreb PH; Lei M; Nakano MM; Zuber P; Walsh CT Characterization of Sfp, a Bacillus Subtilis Phosphopantetheinyl Transferase for Peptidyl Carder Protein Domains in Peptide Synthetases. Biochemistry 1998, 37, 1585–1595. [DOI] [PubMed] [Google Scholar]
- (51).Zhang Y-M; Wu B; Zheng J; Rock CO Key Residues Responsible for Acyl Carrier Protein and Beta-Ketoacyl-Acyl Carrier Protein Reductase (FabG) Interaction. J. Biol. Chem 2003, 278, 52935–52943. [DOI] [PubMed] [Google Scholar]
- (52).Zhang L; Xiao J; Xu J; Fu T; Cao Z; Zhu L; Chen HZ; Shen X; Jiang H; Zhang L Crystal Structure of FabZ-ACP Complex Reveals a Dynamic Seesaw-like Catalytic Mechanism of Dehydratase in Fatty Acid Biosynthesis. Cell Res 2016, 26, 1330–1344. [DOI] [PMC free article] [PubMed] [Google Scholar]
- (53).Rafi S; Novichenok P; Kolappan S; Zhang X; Stratton CF; Rawat R; Kisker C; Simmerling C; Tonge PJ Structure of Acyl Carrier Protein Bound to FabI, the FASII Enoyl Reductase from Escherichia Coli. J. Biol. Chem 2006, 281, 39285–39293. [DOI] [PMC free article] [PubMed] [Google Scholar]
- (54).Zhang YM; Rao MS; Heath RJ; Price AC; Olson AJ; Rock CO; White SW Identification and Analysis of the Acyl Carrier Protein (ACP) Docking Site on β-Ketoacyl-ACP Synthase III. J. Biol. Chem 2001, 276, 8231–8238. [DOI] [PubMed] [Google Scholar]
- (55).Heath RJ; Rock CO Inhibition of Beta-Ketoacyl-Acyl Carrier Protein Synthase III (FabH) by Acyl-Acyl Carrier Protein in Escherichia Coli. J. Biol. Chem 1996, 271, 10996–11000. [DOI] [PubMed] [Google Scholar]
- (56).Heath RJ; Rock CO Roles of the FabA and FabZ β-Hydroxyacyl-Acyl Carrier Protein Dehydratases in Escherichia Coli Fatty Acid Biosynthesis. J. Biol. Chem 1996, 271, 27795–27801. [DOI] [PubMed] [Google Scholar]
- (57).Choi YJ; Lee SY Microbial Production of Short-Chain Alkanes. Nature 2013, 502, 571–574. [DOI] [PubMed] [Google Scholar]
- (58).Morris MD Factorial Sampling Plans for Preliminary Computational Experiments. Technometrics 1991, 33, 161–174. [Google Scholar]
- (59).Campolongo F; Cariboni J; Saltelli A An Effective Screening Design for Sensitivity Analysis of Large Models. Environ. Model. Softw 2007, 22, 1509–1518. [Google Scholar]
- (60).Pianosi F; Sarrazin F; Wagener T A Matlab Toolbox for Global Sensitivity Analysis. Environ. Model. Softw 2015, 70, 80–85. [Google Scholar]
Associated Data
This section collects any data citations, data availability statements, or supplementary materials included in this article.


