

Abstract
Extracellular vesicles (EVs) are secreted by myriad cells in culture and also by unicellular organisms, and their identification in mammalian fluids suggests that EV release also occurs at the organism level. However, although it is clearly important to better understand EVs' roles in organismal biology, EVs in solid tissues have received little attention. Here, we modified a protocol for EV isolation from primary neural cell culture to collect EVs from frozen whole murine and human neural tissues by serial centrifugation and purification on a sucrose gradient. Quantitative proteomics comparing brain-derived EVs from nontransgenic (NTg) and a transgenic amyotrophic lateral sclerosis (ALS) mouse model, superoxide dismutase 1 (SOD1)G93A, revealed that these EVs contain canonical exosomal markers and are enriched in synaptic and RNA-binding proteins. The compiled brain EV proteome contained numerous proteins implicated in ALS, and EVs from SOD1G93A mice were significantly depleted in myelin-oligodendrocyte glycoprotein compared with those from NTg animals. We observed that brain- and spinal cord–derived EVs, from NTg and SOD1G93A mice, are positive for the astrocyte marker GLAST and the synaptic marker SNAP25, whereas CD11b, a microglial marker, was largely absent. EVs from brains and spinal cords of the SOD1G93A ALS mouse model, as well as from human SOD1 familial ALS patient spinal cord, contained abundant misfolded and nonnative disulfide-cross-linked aggregated SOD1. Our results indicate that CNS-derived EVs from an ALS animal model contain pathogenic disease-causing proteins and suggest that brain astrocytes and neurons, but not microglia, are the main EV source.
Keywords: exosome (vesicle), amyotrophic lateral sclerosis (ALS) (Lou Gehrig disease), neurodegeneration, proteomics, astrocyte, extracellular vesicles, central nervous system (CNS), secretion, protein homeostasis
Introduction
Amyotrophic lateral sclerosis (ALS)2 is a fatal neurodegenerative disease resulting in the progressive loss of motor neurons in the brain, brainstem, and spinal cord. The disease is characterized by progressive propagation of pathology spreading from the CNS foci in which symptoms first appear (1). Neuroanatomical propagation may occur by two distinct pathways: 1) contiguous propagation, which occurs side-to-side regionally through the extracellular matrix independent of synaptic connection and 2) network propagation, which occurs end-to-end, dependent on synaptic connections and axonal transmission in connected neural networks (1). The molecular mechanisms responsible for the above observations are the subject of intense study, among which prion-like propagated protein misfolding has emerged as a prominent candidate. Discovery of dominant mutations resulting in the ALS syndrome has implicated a number of proteins responsible for cellular toxicity and perhaps also spreading of pathology in ALS. Whereas the vast majority of clinical ALS cases are sporadic, mutations in human copper-zinc superoxide dismutase (SOD1) cause about 20% of inherited cases of ALS, with mutations in other genes such as TARDBP (encoding the protein TDP-43), FUS, and C9ORF72 (reviewed in Ref. 2), each accounting for a sizable percentage of cases. At the moment, there is experimental evidence in vitro supporting propagation of pathological conformations in both SOD1 (3–6) and TDP-43 (7, 8). These proteins have been shown to induce a pathologic conformation on their natively folded counterparts in a template-directed manner. Our previous work with transfected immortalized cell lines suggests that misfolded SOD1 protein can be transferred from cell to cell via both exosome-dependent and -independent routes (6). However, cell culture studies in vitro may not recapitulate the pertinent mechanisms in a living organism.
All of the cells of the nervous system, including neurons (9), oligodendrocytes (10), astrocytes (11), and microglia (12), have been shown to release membrane-bound vesicles into the extracellular milieu. Such vesicles have the same membrane topology as the cell and range in diameter from 30 to 2000 nm. These extracellular vesicles (EVs), neuronal and otherwise, are currently the subjects of intense functional study worldwide. EVs mediate the secretion of an assortment of macromolecular cargo, including mRNAs, miRNAs, lipids, and proteins (13–16); interact with neighboring cells; and transmit their cargo from cell to cell (17–19). Likewise, an increasing body of work has demonstrated a functional role in health and disease of EVs (20–23), which are released by virtually all mammalian cells, as well as nonmammalian and bacterial cells (16).
Exosomes (EXs) and microvesicles (MVs) are the two main classes of EVs, characterized in part, and for the purpose of this study, by the centrifugation parameters at which they pellet, 100,000 × g and 15,000 × g, respectively. The most current studies, using nanoparticle tracking analysis, show these two vesicle pellets to be dominated by vesicles of the same size, ∼100 nm in diameter, whereas the MV population has a larger size range, up to 2 μm, and contains more large (0.5–2-μm) vesicles (24, 25). The mechanisms of vesicle biogenesis are not settled, with evidence for both direct budding from the plasma membrane (26) and release of vesicles from multivesicular endosomes (27). For recent comprehensive reviews of the various types of vesicles secreted by cells, see Refs. 16, 28, and 29).
In the past 5 years, investigations of EVs have been expanded from cell lines and mixed primary cell cultures to the collection of vesicles from the extracellular spaces within tissues (30, 31). These studies have focused on the EV population in Alzheimer's disease (AD), deriving either from human brains or AD mouse model brains. Few publications have examined the molecular mechanisms responsible for ALS and its spreading pathology from the tissue-derived EV perspective (32, 33).
To better understand the role of EVs in an ALS-affected central nervous system, we employed a method of whole-tissue vesicle isolation (30). Herein, we establish a phenotypic profile of vesicles from whole mouse brains and spinal cords and investigate how model motor neuron disease modifies this phenotype.
Results
Extracellular vesicles were collected from mouse brain and spinal cord tissues
In 2012, Perez-Gonzalez et al. (30) showed that it was possible to collect vesicles from the extracellular space of whole mouse brains and, by extension, from human brain tissue. We tested this technique on brains from the ALS mouse model overexpressing human SOD1 with the G93A mutation (SOD1G93A) and nontransgenic (NTg) littermates. NTg vesicles that had been pelleted at 100,000 × g (EX) floated through a sucrose gradient as canonical exosomes, primarily floating to ∼30% sucrose fractions (Fig. 1A). This fraction contained classic exosomal markers (34), including prion protein (PrP) and SOD1 (Fig. 1A). To test for contamination from intracellular vesicles released by the isolation procedure, we examined markers of the Golgi apparatus (GM130) and Bcl-2, a marker of the mitochondria as well as apoptotic cells and vesicles (35). We also compared known protein amounts of purified vesicle lysates with equal and higher protein amounts of whole-brain homogenates. Whereas exosome markers were detected in the vesicle sample (GRP78, PrP, and SOD1), the markers of contamination were only evident in the brain homogenates (Fig. 1B).
Figure 1.

Intact EVs are isolated from the extracellular spaces of whole mouse brains with minimal contamination. A, EVs were collected from whole brains from NTg animals, and 100,000 × g pellets were floated through a stepwise sucrose gradient (fraction 1 = 0%, fraction 6 = 60% sucrose). B, NTg-purified BDEVs were compared directly with equal and increasing amounts of NTg brain homogenate prepared with a wand homogenizer. GRP78, PrP, and SOD1 exposure was for 30 s; Bcl-2 and GM130 exposure was for 300 s. C, electron micrographs of BDEVs (100,000 × g pellets) from NTg– and human SOD1G93A–overexpressing animals show vesicular structures with canonical exosome morphology. Scale bar, 100 nm. D, BDEV 100,000 × g pellets were fractionated in an 11-step iodixanol gradient (fraction 1 = 0%, fraction 11 = 60%). E, electron micrographs of purified tissue-derived MVs, isolated at 15,000 × g, and EXs isolated at 100,000 × g. Brain MV scale bar = 200 nm. Brain EX, Spinal Cord MV and EX, and Brain and Spinal Cord MV inset scale bars, 100 nm.
EM confirmed a vesicular morphology of the 30% sucrose-purified vesicles (Fig. 1C). Vesicles were then floated through an iodixanol gradient for greater fractionation. For both NTg and SOD1G93A samples, the exosomal marker PrP was found in the center of the gradient, focused in and around fractions 5 and 6 (Fig. 1D). SOD1 showed a wider distribution, with strong signals in fractions 2 and 3 as well as 5–7, for both genotypes (Fig. 1D). In the SOD1G93A samples, two SOD1-reactive bands were evident (Fig. 1D, bottom), suggesting that both the human transgene and endogenous mouse SOD1 are present in the vesicles. Notably, SOD1 and PrP were also detected at the bottom of the gradient, in fraction 11 (Fig. 1D), which may represent dense debris from the digestion and extraction.
In ALS and mice transgenic for human mutant SOD1 (e.g. SOD1G93A), both upper and lower motor neurons were affected, with maximal pathology and motor neuron death occurring in the spinal cord (1, 36). We applied the methods for extracting brain-derived EXs (BDEXs) to mouse spinal cords, with the important modification that five spinal cords were pooled for every vesicle isolation. Moreover, we expanded our investigation to the sucrose gradient–purified MV as well, from both brains and spinal cords, to generate a comprehensive understanding of the CNS EV population. As can be seen in Fig. 1E, both brain and spinal cord–derived 100,000 × g (EX) and 15,000 × g (MV) pellets contained spherical structures with evident bilayers and morphology consistent with vesicles.
Immunoblotting of spinal cord MVs (Fig. S1) revealed a pattern of protein expression similar to that found in the BDEX (Fig. 1B), where vesicle markers SOD1, PrP, actin, GRP78/Bip, and CD9 were clearly represented, whereas contamination markers such as GM130, Bcl-2, and the neuronal nuclear protein NeuN were absent (Fig. S1).
Proteomic profiling describes a distinct vesicle surface proteome and demonstrates a loss of myelin oligodendrocyte glycoprotein in BDEX from SOD1G93A transgenic mice
To further characterize the BDEXs and potentially identify novel EV-associated proteins involved in SOD1-ALS, we performed advanced quantitative proteomics. Using a trilabel technique, we compared 1) the relative expression of proteins identified in the 100,000 × g pelleted and sucrose gradient–purified surface-depleted BDEXs from SOD1G93A and NTg mice (Fig. 2A); 2) proteins expressed on the surface of BDEXs from SOD1G93A and NTg mice (Fig. 2B); 3) the relative expression of proteins on the surface versus the BDEX for NTg mice (Fig. 2C); and 4) the relative expression of proteins on the surface of SOD1G93A vesicles versus NTg BDEXs (Fig. 2D). The relative quantitation is calculated as a ratio of expression for each protein and provided as the log2 -fold difference (1e-1). Significant enrichments of the ratios were calculated using a t test with false discovery rate corrections.
Figure 2.

Quantitative identification of BDEX and surface proteomes. A–D, quantitative proteomics data were analyzed using Perseus (89, 90). Data are presented as the -fold difference on the x axis and the negative log of the p values on the y axis. For each plot, proteins are marked with a different color and shape according to the significance of the enrichment in either sample. Pink squares, significant p values after applying Benjamin–Hochberg correction for false discovery rate; blue triangles, not significant with false discovery correction but have p values < 0.01; green diamonds, p values between 0.01 and 1. Select proteins are labeled. Significantly enriched KEGG terms, when present, are listed below the graphs. A, SOD1G93A BDEX over NTg BDEX. B, surface proteins from SOD1G93A BDEX over surface proteins from NTg BDEX. C, the relative abundance ratios for surface versus whole vesicles, where all of the proteins are from NTg samples. D, relative abundance ratios for SOD1G93A vesicle surface proteins versus NTg whole vesicles. E, Venn diagram of overlap between surface-depleted BDEX proteome and surface proteome. F, Venn diagrams showing overlap between mouse BDEX and vesicles found in human CSF (49) and vesicles secreted by human SH-SY5Y neuroblastoma cell line (50).
Approximately 1200 proteins were identified in the BDEX proteome (Table S1). Due to the remaining presence of transmembrane proteins, and likely incomplete surface trypsin digestion, these surface-depleted BDEX preparations were assumed to retain a signal from the majority of surface proteins, an assumption supported by our results (Fig. 2E). Of the 1200 BDEX proteins, 268 were assigned a ratio in at least six of eight experiments (Table S2). Human SOD1G93A did not receive a quantifiable ratio owing to its complete absence from the NTg sample. Only one protein was found to be significantly enriched after the false discovery rate corrections; myelin-oligodendrocyte glycoprotein (MOG) was significantly enriched in the NTg vesicles (Fig. 2A), at a NTg/SOD1G93A ratio of ∼1.29, prior to the log2 transform. This slight (<30%) although significant enrichment is consistent with studies demonstrating that oligogendrocytes are lost in neurodegeneration (37). Some other proteins approached significance, including the enrichment of protein-disulfide isomerase in SOD1G93A BDEX, which has been linked to ALS pathologies (38, 39), and SNAP25 in NTg BDEX. SNAP25 mediates axonal repair, calcium signaling, and vesicle fusion and recycling (40, 41) and therefore has an impact on at least three processes critical to ALS pathogenesis. However, the absence of a large significantly enriched protein population in the transgenic vesicles suggests that the SOD1G93A genotype has little effect on the BDEX proteome, at least at 3 months of age, the age of disease onset in this animal model.
In neither SOD1G93A nor NTg BDEX did we find the ALS-associated protein TDP-43 or the dipeptide repeated sequences of C9orf72 (Table S1). TDP-43 inclusions have been shown in 97% of sporadic (but not SOD1 familial) ALS (42, 43), and the hexanucleotide repeat expansion-prone C9orf72 (44) is the most common genetic determinant of TDP-43 pathology. However, the ALS-associated RNA-binding protein (RBP) MATR3 and candidate genes hnRNPU and SRSF2 (45, 46) were identified in both SOD1G93A and nontransgenic vesicles (Table S1); RBM6, a predicted but not yet validated ALS-associated RBP, was also identified.
The vesicle surface proteome showed a similar pattern of enrichment to the BDEX proteome. Approximately 800 proteins were identified in the surface protein preparations (Table S3). We observed significant overlap between the BDEX proteome and the surface proteome; ∼50% of the BDEX proteins were also identified on the surface (Fig. 2E). Of the 202 unique surface protein identifications (Fig. 2E), these were likely attributable to the surface-depleted nature of the BDEX sample.
Of these proteins, only 184 had quantifiable ratios in at least six of eight experiments (Fig. 2B and Table S4). None of these proteins displayed significant concentrations in vesicles from either transgenic or nontransgenic mice. We can conclude that the expression of human SOD1G93A does not globally modify the BDEX surface proteome.
Examination of the relative expression of vesicle proteins on the surface versus the whole vesicle (Fig. 2, C and D) clearly identified groups of significantly enriched proteins (Table S5 (SOD1G93A surface versus NTg vesicle) and Table S6 (NTg surface versus NTg vesicle)). In these comparisons, ∼150 proteins had quantifiable ratios in at least seven of eight experiments (Tables S5 and S6).
In both surface versus vesicle comparisons, ∼60 proteins were relatively enriched on the vesicle surface. These included known membrane proteins such as cadherin-13 and transmembrane proteins like alastin-1. Perhaps surprisingly, many of the surface-enriched proteins were ribosomal subunits (Tables S5 and S6). In fact, after gene ontology and KEGG annotation of the data, a one-dimensional annotation enrichment test showed significant enrichment of the KEGG term “ribosome” with the surface of SOD1G93A BDEX (Fig. 2D and Table S7). This term did not reach significant enrichment on the surface of NTg vesicles.
Whereas 60 proteins were enriched on the vesicle surface, only eight (Fig. 2C) and six (Fig. 2D) proteins were more concentrated in the NTg vesicle proteome. This may seem surprisingly low but is almost certainly because many proteins that are exclusively luminal (absent from the surface) cannot be analyzed by ratio analysis and are thus automatically excluded from the quantitative analysis. Interestingly, SNAP25 and synaptophysin were found to be enriched in the vesicle proteome in both comparisons (Fig. 2, C and D). This orientation is particularly meaningful; SNAP25 and synaptophysin coat the inner leaflet cytoplasmic side of the plasma membrane (47). Conversely, these proteins decorate the outer membrane surface of intracellular synaptic vesicles (47). Likewise, the concentration of SNAP25 and synaptophysin in the vesicle fraction militates against the possibility that the vesicles harvested by our technique represent synaptic vesicles released during tissue processing. Furthermore, the KEGG terms “phagosome,” “cytoplasmic vesicle,” and “rheumatoid arthritis” were statistically enriched in the NTg vesicles (Fig. 2, C and D and Table S7).
Many exosome proteomes have been published, and lists of common exosomal proteins have been compiled (48). The BDEX proteome contained 71% of the published top 100 exosome proteins. Previous work has described the proteomes of vesicles secreted by other CNS cell types, although the majority of these are from immortalized cell lines. A whole mouse brain contains blood and CSF, and we can assume that some of the vesicles collected in brain isolation would come from these biofluids as well as from the extracellular spaces between cells. Unfortunately, no proteomic analysis of mouse blood or CSF exosomes has been published; however, a detailed human CSF exosome proteome is available (49). The BDEX had 340 proteins in common with human CSF extracellular vesicles (Fig. 2F). SH-SY5Y cells are an immortalized human neuroblastoma cell line and are often used as neuronal surrogates in vitro. A proteomic description of exosomes secreted by SH-SY5Y cells (50) had 413 proteins in common with the mouse BDEX proteome (Fig. 2F). Together, the high percentage of overlap with previously published extracellular vesicle proteomes provides additional support for characterization of the vesicles collected form whole brains as extracellular.
Additionally, when we performed a gene ontology analysis of the BDEX proteome and surface proteome, the most overrepresented term, compared with the mouse genome, was “extracellular exosome” (Fig. 3). Many terms were found to be overrepresented (Tables S8 and S9), including RNA binding, ribosome, neuron part, and synapse (Fig. 3). The proteomic analysis suggested that these vesicles are similar to previously described exosomes, that they are of a neural origin, and that the expression of human SOD1G93A had a minimal impact on the wider vesicle proteome.
Figure 3.
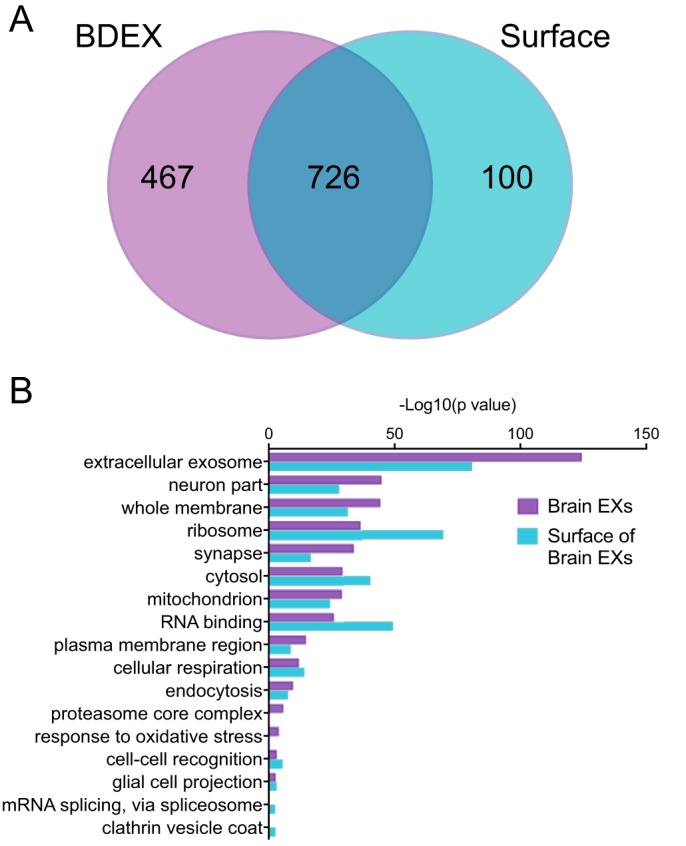
BDEXs and surface proteomes have significantly enriched gene ontology annotations that reflect their neuronal and vesicular origin. Enrichment of GO annotations in the BDEX proteome or the BDEX surface proteome, compared with the entire mouse genome, was performed using ErmineJ (91, 92). False discovery rate correction was used to determine significant enrichments. A, Venn diagram of the overlap in GO annotations between the BDEX and the surface proteome. B, a selection of significantly overrepresented GO terms is shown; the full list can be found in Tables S8 and S9.
Brain- and spinal cord–derived extracellular vesicles are primarily of astrocyte and neuronal origin
One of the goals of these studies was to determine the relative proportion of BDEXs that were derived from various CNS cell types (i.e. neurons, astrocytes, microglia, and oligodendrocytes). Due to differences in published proteome depth and limited information from primary cells, the proteomic comparisons did not provide significant insight into this question. Flow cytometry is often used to differentiate individual cell type contributions to a mixed cell population, such as whole blood. Whereas exosomes, at ∼100 nm in diameter, are below the lowest level of detection by a forward scatter laser for the currently available flow cytometers, fluorescent labeling of smaller particles is detectable (51, 52). We examined the proportion of vesicles that were positive for various CNS cell type markers. We used the astrocyte marker GLAST, also known as excitatory amino acid transporter 2 (EAAT2), the neuron marker NCAM/CD56, the microglia marker CD11b, the exosome marker CD81, and the synaptic protein SNAP25. Fig. 4A includes forward (FSC) and side scatter (SSC) plots illustrating the noise and how the BDEX and BDMV populations were affected by lysis; the left panels show 0.1-μm-filtered PBS, the middle panels show unlabeled vesicles purified after 100,000 × g (EX) or 15,000 × g (MV) centrifugation; and the right panels show the same after the vesicles had been lysed with 1.0% Nonidet P-40. After lysis, the events from side scatter 104-105 essentially disappeared, suggesting that these are true vesicles (Fig. 4A). Similar results are seen with spinal cord EVs (Fig. S2A). However, events that disappear with lysis appear as low as 103 in SSC; these events cannot be isolated from noise by gating on the scatter plot. As such, for calculation of the proportion of positive events for each marker, first we analyzed all of the events, including noise, and subtracted the events that were positive even after lysis. We performed additional confirmation that the markers were associated with bona fide vesicles by immuno-TEM (Fig. S2B). We found vesicular structures labeled with the canonical vesicle markers CD63 and CD81, the astrocyte marker GLAST, and the synaptic markers SNAP25 and VGAT (Fig. S2B).
Figure 4.

Flow cytometric analysis suggests that the majority of BDMV may be of astrocyte origin. A, forward-side scatter plots of BDEX and MVs before and after lysis in 1% Nonidet P-40 shows separation of vesicle signal from noise. Percentage of total events within an arbitrary gate is shown for illustrative purpose only. B and C, the percentage positive of total events (including noise) for an astrocyte marker (GLAST), neuronal marker NCAM (CD56), exosome marker (CD81), synaptic vesicle marker (SNAP25), and microglia marker (CD11b). The number of positive events found after lysis was subtracted. Data were analyzed by two-way ANOVA. No difference between G93A and NTg BDMV (B, p = 0.4012) or BDEX (C, p = 0.8095) marker expression was found. The percentage positive of all events collected, after subtraction of positive events in the lysed sample, is shown. Data are from 4–5 identical experiments. D, significant decreases in the percentage of positive events in NTg brain EXs for most markers are observed compared with NTg brain MVs. Data were analyzed by two-way ANOVA with Sidak's multiple-comparison test: p = 0.0002 (interaction), p < 0.0001 (marker), and p < 0.0001 (vesicle). E and F, the percentage positive of total events (including noise) after lysis subtraction in vesicles collected from spinal cords. Data were analyzed by two-way ANOVA. No difference between G93A and NTg spinal cord MV (E, p = 0.6218) and EX (F, p = 0.4530) marker expression was found. G, when spinal cord MVs are compared directly with the EXs by two-way ANOVA, p = 0.0007 (interaction), p < 0.0001 (marker), and p = 0.0321 (vesicle). Sidak's multiple-comparison test showed some significant differences within individual markers. H and I, comparison of percentage positive MV (H) and EX (I) events between brains and spinal cords (Sp. Cord). Data were analyzed by two-way ANOVA with Sidak's multiple-comparison test: for MVs (H), p = 0.0001 (interaction), p < 0.0001 (marker), and p < 0.0001 (tissue); for EXs (I), p < 0.0001 (interaction), p < 0.0001 (marker), and p = 0.7523 (tissue). Error bars, S.E.
When analyzing the EVs for cell type marker expression by flow cytometry, we saw little difference in the marker percentages between SOD1G93A and NTg BDEVs (Fig. 4, B and C). Moreover, no significant effect of genotype was found for vesicles harvested from spinal cords (Fig. 4, E and F). Within each vesicle population, the majority of markers existed at about the same level in the population (15–40% EX, 40–65% MV), with CD11b as the exception and at a much lower expression level (2–5%; Fig. 4, B–G). CD11b is a marker of microglia, and its low representation suggests that the brain and spinal cord EV populations, under these specific conditions, are primarily derived from neurons and astrocytes. The contribution of oligodendrocytes is yet to be determined.
A comparison of marker expression between MV and EX samples and between brain and spinal cord samples generated some interesting observations. We observed a statistically significant reduction in positive events in brain-derived EX samples compared with MV samples (Fig. 4D), likely corresponding to the smaller size of the EX compared with MVs. The larger MVs will have a greater number of fluorochrome-conjugated antibodies bound and as such will have a greater signal. The spinal cord EVs showed a slightly different pattern; only CD81 had a significant decrease in EX samples, and SNAP25 demonstrated a significant increase in the smaller EXs (Fig. 4G).
A similar pattern was observed when we compared brain and spinal cord MVs or EXs. For MVs, the brain-derived vesicles had significantly higher marker expression across all measured markers, excepting CD11b (Fig. 4H). In contrast, the EX vesicles from brains and spinal cords had equal levels of CD81 and CD56/NCAM, whereas spinal cord EXs had less GLAST expression and more SNAP25 expression than the brain EXs (Fig. 4I). The equivalent levels of CD81 suggested that the total number of vesicles is the same in brain and spinal cord EX samples. The reduction in GLAST and increase in SNAP25 suggests that fewer of the vesicles are derived from astrocytes and perhaps more are derived from neurons.
Mouse BDEVs reflect neurodegeneration occurring over time
The data presented thus far were derived from animals sacrificed at 3 months of age, the age of disease onset in human SOD1G93A-expressing mice. We hypothesized that as the animal ages and the disease progressed, the vesicle population would change along with the tissue. However, we did not observe clear evidence of this in the brain-derived EVs. We examined brain MVs from animals sacrificed at 2 and 5 months of age to determine whether the cell type marker phenotype is age-dependent. We found no effect of age on MVs from NTg animals within this range (Fig. 5, A–D). However, the GLAST MV population from SOD1G93A animals did have a significant decrease at 5 months, and CD11b was increased from 2 to 5 months of age (Fig. 5, A and B). The percentage of CD11b-positive vesicles remained below 5%, so the impact of this increase was minimal; however, the data do indicate that over the course of the disease, the MV population may be modified.
Figure 5.

Mouse brain EVs reflect neurodegeneration occurring over time. Brain microvesicles from mice sacrificed at 2 and 5 months of age (MOA) were probed with antibodies against GLAST (A), CD11b (B), CD56 (C), and CD81 (D), and the number of positive vesicles was determined by flow cytometry. Positive events are reported as the percentage of the total positive population (including noise) minus the percentage of positive events after vesicle lysis. Data were analyzed by two-way ANOVA with a Sidak multiple-comparison test for the effect of genotype and age: Glast (A), p = 0.0007 (interaction), p = 0.0511 (age), and p = 0.0206 (genotype); CD11b (B), p = 0.3539 (interaction), p = 0.0001 (age), and p = 0.03779 (genotype). C and D, results not significant. Error bars, S.E.
Brain and spinal cord EVs from mice overexpressing human SOD1G93A contain and are decorated by misfolded SOD1
We have previously shown misfolded SOD1 to be involved in intermolecular and intercellular prion-like template-directed misfolding (3, 6). As part of that investigation, we showed that exosomes secreted by a mouse motor neuron–like cell (NSC34) after transfection with various human SOD1 mutations were surface-decorated with misfolded SOD1 (6). The CNS–tissue vesicle isolations allowed us to determine ex vivo whether misfolded SOD1 associates with extracellular vesicles within neural tissues of ALS model mice.
We utilized antibodies specifically designed to bind only misfolded SOD1 (3, 53) to assay the association of misfolded SOD1 with tissue-derived EVs. Whole EXs harvested from brains and spinal cords of SOD1G93A and NTg mice were immunoprecipitated with the SOD1-misfolded antibodies 3H1 and 10C12 (Fig. 6A). Vesicles from both brains and (Fig. 6B) spinal cords (Fig. 6C) of SOD1G93A mice had significantly more misfolded SOD1 on the vesicle surface than NTg littermate mice. This finding is in agreement with our findings from exosomes secreted by cells in culture.
Figure 6.

Brain and spinal cord EVs from mice overexpressing human SOD1G93A contain and are decorated by misfolded SOD1. A, intact EXs immunoprecipitate with misfolded SOD1-specific antibodies 3H1 and 10C12 (3, 53). B and C, quantitation of the signal from three immunoprecipitation experiments: brain (B), Student's t test, p = 0.0447 (3H1) and p = 0.0170 (10C12); Spinal cord (C), Student's t test, p = 0.0070 (3H1) and p = 0.0159 (10C12). D, purified vesicle lysates from 100,000 × g pellet (EX) and 15,000 × g pellet (MV) from brains and spinal cords were assayed for misfolded SOD1 in a chemiluminescent ELISA. Anti-misfolded SOD1 antibody 3H1 was used as the capture antibody. Data are provided as raw luminescence units (RLU), as no standards of misfolded SOD1 were available for comparison. Data were analyzed by paired Student's t test. E, intact EXs from human spinal cord tissues, four each of control and SOD1 FALS (n = 3 SOD1-A4V, n = 1 SOD1-N139K), immunoprecipitated with misfolded SOD1-specific antibodies 3H1 and 10C12 (3, 53). Quantitation of the signal, normalized to the weight of source tissue, from four immunoprecipitation experiments is shown. Differences were determined by a Kruskal–Wallis nonparametric ANOVA (p = 0.0009) with Dunn's multiple-comparison test (p = 0.0496 for 3H1, p = 0.0219 for 10C12). F, purified MV lysates from human spinal cords, three control and two SOD1A4V FALS tissues, were assayed for misfolded SOD1 by ELISA. Anti-misfolded SOD1 antibody 3H1 was used as the capture antibody. Data were analyzed by Student's t test (p = 0.1003). IP, immunoprecipitation; IB, immunoblotting; error bars, S.E.
Misfolded SOD1 on vesicle surfaces is surprising, considering the cytosolic nature of SOD1 and the established topology of EVs, which recapitulate the cell of origin, with cytosolic components in the vesicle lumen and plasma membrane outer leaflet components exposed on the outer leaf of the vesicle membrane (19). Moving from immunoprecipitation to ELISA, we found that lysates of brain- and spinal cord–derived EXs from SOD1G93A mice were significantly enriched in misfolded SOD1, compared with vesicles from NTg animals (Fig. 6D). Moreover, we found that brain and spinal cord MVs (Fig. 6D) displayed a similar pattern, although they appeared to have lower total levels of misfolded SOD1 than the smaller EXs. No difference in misfolded SOD1 load is seen in the vesicles harvested from brains compared with spinal cords.
Vesicles from human spinal cord tissues from SOD1 FALS patients and control patients showed a similar pattern. When vesicles were immunoprecipitated, both misfolded SOD1-specific antibodies (3H1 and 10C12) had an increased signal from FALS patient vesicles compared with controls (Fig. 6E, 3H1 (p = 0.0496) and 10C12 (p = 0.0219)). Similar results were observed when vesicle lysates were subjected to ELISA (Fig. 6F); unfortunately, access to patient spinal cord tissue was limited, and only two samples were obtained, resulting in a clear trend toward increased misfolded SOD1 in the vesicles, but lacking in statistical significance (p = 0.1003).
Differential aggregation profiles of mutant SOD1 in mouse and human CNS EVs
We have previously demonstrated the prion-like capability of mutant human SOD1G127X to convert human WT SOD1 (HuWTSOD1) into a misfolded conformation and the subsequent spreading of this misfolded conformation from cell culture to cell culture successively (3, 6). SOD1-induced motor neuron disease has also been demonstrated in vivo using the spinal cord homogenate from mutant SOD1G93A as the seed (5). Under native cytosolic conditions, HuWTSOD1 forms a stable homodimer that does not aggregate. HuSOD1G93A is thought to be indistinguishable from HuWTSOD1 until late in disease progression (≥120 days in mice), at which point aggregates (54) and oligomers (55) have been observed. Conversely, the molecular state of SOD1G127X in cytosol is unclear, considering 1) the SOD1G127X truncation mutation, which results in the loss of β strand 8, a critical portion of the homodimer interface; 2) lack of Cys-146, which forms a monomer-stabilizing disulfide bond with Cys-57 required for native homodimer formation; and 3) lack of stoichiometric metal binding, which contributes significantly to stabilization. HuSOD1G127X has been shown to form intracellular aggregates (56), likely due to nonnative interchain disulfide bonds (57).
To identify the quaternary structure of the propagation-competent species of HuSOD1G127X and HuSOD1G93A in the CNS EVs, brain MVs from NTg mice with endogenous mouse SOD1 (mSOD1), HuSOD1G127X transgenic mice, SOD1 knockout mice (mSOD1−/−), mSOD1−/−/HuSOD1G127X crosses and HuSOD1G93A transgenic mice were subjected to SDS-PAGE under reducing and nonreducing conditions with and without iodoacetamide to block artifactual formation of disulfide bonds (Fig. 7A). HuSOD1G127X is a truncation mutation, and the truncation results in the loss of epitope for the misfolded SOD1-specific antibody used in the immunoprecipitations and ELISAs in Fig. 6 (3, 58). For this reason, nonreducing PAGE could produce the most information regarding the aggregation profile of mutant SOD1 in EVs.
Figure 7.

Differential aggregation profiles of mutant SOD1 in mice and human brain EVs. The protein cargo of microvesicles harvested from NTg and multiple ALS model mice (A–C) or human spinal cord tissue (D–F) was analyzed by reducing and nonreducing SDS-PAGE followed by SOD1 immunoblot. For representative immunoblots (A and D), reducing lanes include β-mercaptoethanol (β-merc.). Iodoacetamide (iodoact.) was included to block artifactual disulfide bonds from forming during sample processing. -mon., monomer band (∼17 kDa); *, aggregate band(s). B and C, quantitation of volume intensity of immunoblots from n = 2–4 brain MV samples per genotype normalized to the amount of protein analyzed. +β-merc./-iodoact., reducing lanes; −β-merc./+iodoact., nonreducing lanes. B, HuSOD1G93A reported on right y axis; C, aggregate; *, band at top of gel. Mean and S.E. (error bars) are shown. Differences were determined by two-way ANOVA with Sidak's multiple-comparison test. B, p = 0.2667 (interaction), p ≤ 0.0001 (genotype), and p = 0.0140 (reduction). C, p = 0.2003 (interaction), p = 0.0031 (genotype), and p = 0.4553 (reduction). E and F, quantitation of volume intensity of immunoblots from n = 4 FALS A4V samples and n = 4 control samples, normalized to the amount of protein analyzed. Mean and S.E. are shown. Aggregate signal (F) is the sum of the volume intensities for bands marked with an asterisk in D. +β-merc./−iodoact., reducing lanes; −β-merc./+iodoact., nonreducing lanes. Differences were determined by two-way ANOVA with Sidak's multiple-comparison test. E, p = 0.4012 (interaction), p = 0.5241 (disease status), and p = 0.0184 (reduction). F, p = 0.2204 (interaction), p = 0.0466 (disease status), and p = 0.0761 (reduction). Error bars, S.E.
The vesicles were collected at symptom onset, 90 days for HuSOD1G93A and 150 days for HuSOD1G127X. Under reducing conditions, all species of SOD1, mouse WT and human G127X and G93A, appeared as monomer bands around 17 kDa (Fig. 7A). However, under nonreducing conditions, where disulfide bonds were maintained, higher-order aggregates of HuSOD1G93A and, more robustly, HuSOD1G127X appeared in the very top of the gel, which included the stacking gel (Fig. 7A). Artifactual aggregation was observed in HuSOD1G93A without iodoacetamide. The bona fide disulfide-mediated aggregates were restricted to the expression of HuSOD1, as no such aggregates were observed in the NTg and no SOD1 bands were detected in the mSOD1−/− vesicles (Fig. 7A). Moreover, HuSOD1G127X expression was found to be relatively low; twice as much protein per well was required from the mSOD1−/−/HuSOD1G127X sample to visualize a clear signal (Fig. 7A). Volumetric quantitation of the SOD1 monomer band (Fig. 7B) and aggregate bands/smears (Fig. 7C) from replicate immunoblot analyses confirmed that EV SOD1G93A is predominantly monomeric under nonreducing conditions, in contrast to SOD1G127X, which takes the form of insoluble aggregates under these conditions. We can conclude that SOD1G127X mouse CNS EVs contain large insoluble aggregates of SOD1G127X as well as native mSOD1. In contrast, SOD1G93A mice at 3 months of age have fewer and lower-order aggregates of SOD1 in brain-derived EVs.
We confirmed these findings with EVs harvested from human spinal cords. Under reducing conditions, SOD1 signal was restricted to the monomeric range, as well as some lower-molecular weight degradation products, in EVs from control and FALS patients (Fig. 7D). However, FALS SOD1A4V patient–specific SOD1 aggregates at ∼70 and ∼140 kDa were observed under nonreducing conditions (Fig. 7D). After volumetric quantitation of replicate experiments with additional patient material, we observed that the monomeric SOD1 is equivalent in the control and FALS patients (Fig. 7E). Conversely, under nonreducing conditions, the FALS patient EVs show a concentration of aggregated SOD1 (Fig. 7F). In conclusion, both human ALS and mouse ALS-model CNS EVs contain aggregated SOD1 cargo.
Discussion
We developed methods to investigate the intra-organ extracellular vesicle population of the mouse brain and spinal cord (Figs. 1–7). At the onset of motor neuron disease in SOD1G93A mice, the vesicle proteome is largely unchanged compared with nontransgenic mice, except for the presence of human SOD1G93A on the surface and in the lumen of vesicles (Figs. 2–5). Microglia contribute little to the EV population, with the majority of vesicles likely being secreted by astrocytes and neurons (Figs. 4 and 5).
Understanding the cellular mechanisms of prion-like protein misfolding and neuroanatomical pathology propagation is essential for a comprehensive understanding of the etiology of neurodegenerative diseases and for effective therapeutic development. Using mouse models of disease, descriptions of brain EV seeding of Tau pathology in AD (31) and α-synuclein pathology in dementia with Lewy body disease (59) are demonstrating, ex vivo, a role for EVs in propagation of proteopathy. In this work, we show evidence that CNS-derived extracellular vesicles isolated from the SOD1G93A ALS mouse model and human SOD1-FALS neural tissues carry misfolded and aggregated SOD1 cargo. This finding indicates that mutant/misfolded SOD1 within EVs might be sufficient to induce misfolding of full-length WT protein in recipient cells, representing a potential mechanism for systematic spread of ALS pathogenesis. Follow-on functional studies are needed to fully elucidate the role of EVs in disease.
SOD1-induced motor neuron disease has been demonstrated in vivo using spinal cord homogenate from paralyzed SOD1G93A mice (5). We have demonstrated the ability of SOD1G127X to seed conversion of HuWTSOD1 into a misfolded conformation and the subsequent spreading of this misfolded conformation in cell cultures (3, 6). It is thought that both vesicles and free aggregates of pathogenic proteins may be involved in releasing SOD1 “seeds” from affected cells (6), consistent with contiguous propagation of clinical symptoms. However, it remains to be determined which mechanism, if any, is responsible for the spread of proteopathy. Moreover, as both SOD1 and TDP43 mutant-associated ALS have been shown to be non-cell-autonomous (60–63), the question of which cell is releasing the misfolded protein species and which cell is the recipient remains unclear.
Our data suggesting an overrepresentation of astrocyte-derived EVs in the brain are evocative of the large body of literature describing a toxic role of astrocytes in the context of SOD1-ALS (63–65). Additionally, mutant SOD1-expressing actrocytes have been found to increase exosome release and cause SOD1 pathology in naive recipient neurons (65). The lower levels of GLAST vesicles in the spinal cord compared with brain, and the increased SNAP25 surface decoration of EXs in the spinal cord, point to differing populations in these two tissues, the phenotypic effect of which is not yet understood.
In cell culture systems, we have previously reported that misfolded SOD1 aggregates are released from dead and dying cells, whereas EVs were released primarily from live cells early in the degenerating process (6). Here, we showed that mouse ALS-model CNS vesicles carry soluble mutant SOD1 as well as insoluble aggregates (Fig. 7, A–C) and confirmed those findings with human spinal cord EVs (Fig. 7, D–F). The age of the animal may also be relevant to the packing of EVs with aggregated SOD1; aggregates of SOD1G93A have previously been observed in disease-affected animals of ≥120 days of age, whereas little aggregation was seen in younger animals, in agreement with our findings (54, 55). In the context of the literature, our results suggest that astrocytes are primarily secreting vesicles carrying toxic cargo, including aggregated and soluble mutant SOD1, whereas free protein aggregates are also released from dead and dying neurons. One might speculate that both mechanisms play significant roles during disease, perhaps at different times, or simultaneously but in dynamic ratios.
Recent work has suggested that, in the context of the synapse, the release of vesicles packed with misfolded proteins is a proteostatic protective cellular function mediated by neuron-specific cysteine string protein (CSPα, DnaJC5) (32, 66). We identified this protein in the mouse brain–derived EXs, and it appears in similar levels in the SOD1G93A and NTg samples. In light of the demonstrated role for DnaJC5 in vesicle secretion of unfolded proteins (32), the lack of concentration of DnaJC5 in the SOD1G93A vesicles, which we know to be enriched in the mutant and misfolded SOD1 (Figs. 1, 2, and 6), supports our conclusion that perhaps the majority of these vesicles are derived from astrocytes.
The role of protein supersaturation in triggering toxicity and perhaps propagated misfolding has been investigated (67). In this elegant computational study, SOD1 and TDP-43 are shown to have orders of magnitude higher supersaturation values in motor neurons, compared with other cellular proteins. The authors suggest that supersaturation is responsible for protein aggregation or co-aggregation and gain of toxic function. We compared the list of supersaturated proteins found in human and mouse SOD1 inclusions with our mouse brain EX proteome and found relatively little overlap: 23 of the 77 human SOD1 inclusion proteins and 12 of the 58 mouse SOD1 inclusion proteins. This indicates that key proteins may dominate disease progression, rather than co-aggregation of multiple proteins, most consistent with a prion-like propagated misfolding mechanism of spreading.
SOD1 is widely thought to play an important role only in familial cases of ALS where SOD1 mutations occur, less than 2% of all ALS cases (68), although some literature supports a role for WT human SOD1 in sporadic ALS (69). In this light, it is interesting that SOD1 is a common EV marker, and future CNS vesicle studies in sporadic ALS may reveal misfolded SOD1, perhaps concentrated as a protective proteostatic cellular function. Our current findings on the baseline phenotype of mouse brain and spinal cord EVs may have bearing on the wider spectrum of ALS (70). The apparent significant enrichment of ribosome-associated proteins on the surface of only the ALS mouse model BDEV is reminiscent of the emerging consensus that dysregulation of translation is a hallmark of ALS and other neurodegenerative diseases like FTD (71, 72). RBPs like TDP-43 and FUS, as well as a growing list of others, are recognized as pathogenic markers of disease, although the exact mechanisms of pathogenicity are under intense investigation (73). A growing body of work is linking RBP and EVs to disease (8, 32, 74), and RNA and RBP cargo of exosomes is a well-established phenomenon (23). What remains to be determined is the interplay between RBP, stress granules, protein aggregation, vesicle release, and their summated toxicity. Our work supports the conclusion that RBPs are constitutively secreted in association with brain and spinal cord vesicles but that the mouse RBPs are not recruited to the vesicles by mutant SOD1. Additionally, the enrichment of synaptic and synaptic vesicle proteins in the brain EVs suggests a role for these vesicles in regulation of synaptic transmission, supported by a small body of literature (75, 76).
Only one protein, besides human SOD1G93A, had significantly modified representation in the SOD1G93A BDEXs, MOG (Fig. 2A). Antibodies targeting MOG are thought to play a role in some demyelinating diseases (77). The biological significance of MOG's reduced abundance in the SOD1G93A vesicles is unclear and may simply reflect the process of neurodegeneration occurring in the transgenic mice (78). However, it is tempting to speculate that effective therapies would protect against the loss of this protein, and as such, it may have value as a biomarker for therapeutic efficacy. The field of cancer diagnosis has turned to vesicles as potent and plentiful markers of migrating tumor cells and, by screening for multiple disease-associated proteins, has been able to drastically improve diagnostic potential for prostate and breast cancer (79). Our work has identified at least one attractive candidate protein (and, including protein-disulfide isomerase, perhaps two) for similar sorting of patients with early signs of ALS or neurologic dysfunction.
In conclusion, extracellular vesicles collected from whole tissues provide an ex vivo platform for the investigation of intra-organ intercellular communication. It is of great interest to perform additional characterization studies on vesicles from human tissue to assess the baseline phenotype of tissue EVs and the complex modifications that occur in disease.
Experimental procedures
Animals
Animals used in this study, C57 BL/6 and HuSOD1G93A, mSOD1−/− (strains: B6SJL, Cg-Tg(Sod1-G93A)1Gur/JB6, and B6;129S-Sod1tm1Leb/J purchased from Jackson Laboratories (Bar Harbor, ME)), and HuSOD1G127X mice (Tg(SOD1*G127X)716Mrkl; a gift from Stefan Marklund) (80–82) were housed in accredited facilities in accordance with University of British Columbia and international animal ethics guidelines. All animals were sacrificed early in disease onset to avoid unnecessary suffering: HumanWTSOD1 mice and G93A mice and WT littermates at 3 months of age, G127X mice and WT littermates at 5 months of age. The studies were reviewed and approved by the University of British Columbia Animal Care Committee.
Human tissue
The human tissues used in this study were obtained from brain banks affiliated with the University of British Columbia and the Target ALS–Johns Hopkins School of Medicine. Consent for autopsy was obtained from the legal representative in accordance with local institutional review boards. The studies were reviewed and approved by the University of British Columbia Ethics Board and are in accordance with the Declaration of Helsinki principles. Cases included nonneurodegenerative control patients (n = 4) and cases with FALS with confirmed SOD1 mutations (n = 6). Sequencing of SOD1 had previously been performed at each of these centers using methods described elsewhere (42).
Vesicle isolation
The isolation of vesicles from whole tissues was adopted and modified from Ref. 30. Frozen tissue, brain, and spinal cord from SOD1-G93A and NTg littermates and human spinal cords were first weighed. Whole mouse brains (0.4–0.6 g) were used. Five murine spinal cords, ∼100 mg/cord, were pooled for the isolation. 0.3–0.75 g of human spinal cord tissue was employed for each isolation. The tissue was sliced minimally in Hibernate A solution (Brain Bits, Springfield, IL) and treated with papain (20 units/ml) or collagenase III (75–125 units/ml) at 37 °C for 15 min to digest connective tissue. Tissue was further disassociated by up-and-down aspiration in 2 volumes of cold Hibernate A solution plus protease inhibitor (Roche, Mississauga, Canada). The disassociated tissue was then sequentially centrifuged at 2000 × g to separate cell debris and collect extracellular material and at 15,000 × g to collect large vesicles, such as microvesicles. EVs were collected by centrifugation at 100,000 × g for 1 h.
Sucrose gradients
The EV pellet was purified by density gradient centrifugation in a sucrose step gradient, with concentrations ranging from 2.0 m (∼60% sucrose) to 0.25 m (∼7.5% sucrose) in 0.35 m increments and centrifuged at 200,000 × g for 16 h at 4 °C in a Beckman L90 Ultracentrifuge (Beckman Coulter, Mississauga, Canada). Fractions of equal volume are collected, diluted in PBS, and centrifuged again at 100,000 × g for 70 min at 4 °C. Sucrose gradient fraction pellets were resuspended in PBS and stored at −80 °C. Where appropriate, protease inhibitors were added to storage buffer.
OptiPrep gradients
BDEVs were purified on OptiPrepTM density gradient following previously published protocols (35, 83). Briefly, a discontinuous iodixanol (OptiPrepTM, MilliporeSigma, Oakville, Canada) gradient was prepared by diluting stock solutions of OptiPrepTM (60% (w/v) aqueous iodixanol) with 0.25 m sucrose, 10 mm Tris, pH 7.5. The 100,000 × g pellet was overlaid onto the top of the gradient and centrifuged at 100,000 × g for 18 h at 4 °C. 0.6-ml gradient fractions were collected manually from the top (with increasing density). Fractions were diluted with PBS and centrifuged at 100,000 × g for 3 h at 4 °C, washed in PBS, and resuspended in PBS and stored at −80 °C until further use.
Sucrose cushion
For quantitative proteomics and flow cytometric studies, BDEVs were purified using a sucrose cushion system. A cushion of 0.5 ml of 2 m sucrose overlaid with 0.25 ml of 1 m sucrose followed by 0.6 ml of PBS was constructed in 1.5-ml ultracentrifuge tubes. Resuspended EV pellets (0.2–0.4 ml) were layered on top of the gradient followed by ultracentrifugation at 150,000 × g at 4 °C for 2 h in a Hitachi CX 150NS Micro Ultracentrifuge. 0.7 ml was removed from the top of the gradient and discarded. 0.4 ml, including the ∼1 m EV fraction was removed and resuspended in PBS followed by additional ultracentrifugation, 100,000 × g 4 °C for 1 h. Pellets were resuspended in PBS and stored at −80 °C until further use.
Immunoblotting
Equal volumes of either sucrose or OptiPrep fraction samples were boiled in SDS sample buffer containing 1% β-mercaptoethanol and subjected to SDS-PAGE, followed by immunodetection with a pan-SOD1 rabbit polyclonal antibody (SOD100; ENZO Life Sciences, Plymouth Meeting, PA), prion protein (PrP 6D11; Santa Cruz Biotechnology, Inc., Dallas, TX), CD9 (clone EPR2949, Abcam Inc., Cambridge, MA), or GRP78/BiP (clone 40/BiP, BD Biosciences, Mississauga, Canada) to confirm the presence of exosome vesicles. Fractions were also blotted for markers of other organellar membranes, such as Bcl-2 (clone 7/Bcl-2) and GM-130 (clone 35/GM130), all purchased from BD Biosciences, to assess the purity of the EV pellets. Vesicles were also blotted for GLAST (clone ACSA-1, Miltenyi Biotech, Auburn, CA), SNAP25 (clone SMI 81, BioLegend, San Diego, CA), NeuN (clone A60, MilliporeSigma), GFAP (polyclonal, ab7260; Abcam), and synaptophysin (clone YE269; Abcam).
Electron microscopy
Transmission EM of sucrose-purified EVs was performed essentially as described (84). Briefly, EVs were fixed in 2% glutaraldehyde and 4% paraformaldehyde in 0.1 m cacodylate buffer for 2 h at room temperature. Vesicles were collected by ultracentrifugation and washed in 0.1 m cacodylate buffer. Fixed vesicles were absorbed onto Formvar-coated 200-mesh nickel grids (Electron Microscopy Sciences, Hatfield, PA). For immunoelectron microscopy, grids were blocked with 1% milk in PBS followed by probing with primary antibodies overnight in blocking buffer. After washing, grids were incubated with secondary antibodies in 1% milk and 0.5% PEG. All grids were negatively stained with 0.5% aqueous uranyl acetate for 30 s and viewed on a FEI Tecnai G2 Spirit transmission electron microscope.
Antibodies were purchased from the following sources: mouse anti-CD63 (clone H5C6) and mouse anti-SNAP25 both from BioLegend; mouse anti-GLAST (clone ACSA-1) and hamster anti-CD81-biotinylated (clone EAT2) both from Miltenyi; guinea pig anti-VGAT (Synaptic Systems, Goettingen Germany); all secondary antibodies (anti-mouse 15-nm gold, anti-biotin 25-nm gold, anti-guinea pig 10-nm gold) from Electron Microscopy Sciences.
Immunoprecipitation
Quantitative immunoprecipitation of misfolded SOD1 was performed as described previously (3, 6) using the resuspended pellet fractions in PBS alone so as not to disrupt vesicles; pulldown of misfolded SOD1 therefore only occurred if it presented on the vesicle surface. The following antibodies were coupled to magnetic Dynabeads (Invitrogen) following the manufacturer's instructions: mouse IgG2A isotype control (Abcam Inc.), SOD100, and misfolded SOD1-specific antibodies 3H1 and 10C12 (3). An equal amount of EV sample, 10–20 μg, was added to each antibody bead combination and incubated for 24 h at 4 °C with constant rotation, followed by three brief washes in PBS. Samples were boiled in SDS sample buffer containing 1% β-mercaptoethanol and subjected to SDS-PAGE, followed by immunodetection with a pan-SOD1 rabbit polyclonal antibody (SOD100).
ELISA
96-well Nunc ELISA plates (Thermo Fisher Scientific) were coated with 7.38 μg/well of the anti-misfolded SOD1 mAb 3H1 overnight at 4 °C. Plates were washed with TBS containing 0.1% Tween 20 and blocked with filtered PBS + 0.1% Tween 20 with 3% normal goat serum (MilliporeSigma) overnight at 4 °C and washed again. Samples were prepared by measuring total protein concentration using the Pierce BCA assay kit (Thermo Fisher Scientific). Equal protein amounts (MV and EX = 0.05 μg/μl) of EV lysates, lysed in 1% Triton X-100 for 20 min on ice, were incubated with the captured 3H1 antibody for 1 h at room temperature. Plates were washed and incubated with 2 μg/ml rabbit polyclonal SOD100 antibody at room temperature for 1 h. Finally, the plate was washed and incubated with HRP-linked anti-rabbit IgG (GE Healthcare) diluted 1:5000 for 1 h at room temperature, followed by five final washes. The plates were incubated with SupersignalTM ELISA Femto substrate (Thermo Fisher Scientific) for 5 min at room temperature. Total chemiluminescence at all wavelengths was read on a SpectraMax M2 Molecular Devices instrument.
Quantitative proteomics
When isolating BDEX for proteomics, TBS was substituted for PBS at all steps, and at the final pelleting step, vesicles were resuspended in TBS without protease inhibitor. Protein concentration was determined using a Pierce BCA kit (Thermo Fisher Scientific).
To remove surface proteins from BDEX for separate analysis, it was assumed that the surface protein content was 1% of total vesicle protein content, as is generally assumed for eukaryotic cells (48). Trypsin (Promega, Madison, WI) was added to BDEX at a 1:50 protein ratio in TBS and incubated at 37 °C for 4 h, after which vesicles were acidified to pH 2 with 10% acetic acid to kill trypsin activity. TBS was added to the trypsinized BDEX followed by ultracentrifugation at 100,000 × g at 4 °C for 1 h. Tryptic peptides from surface proteins remained in the supernatant while intact vesicles were pelleted and resuspended in 50 mm ammonium bicarbonate, 1% sodium deoxycholate and stored at −80 °C.
The resulting surface-depleted vesicle pellet and surface peptide preparations were reduced and alkylated as per (85) and further digested with trypsin at 37 °C overnight. Peptide samples were purified by solid-phase extraction on C-18 STop And Go Extraction (STAGE) tips (86), and each treatment was chemically labeled by reductive demethylation using formaldehyde isotopologues (87). The final product was purified again by C-18 STAGE tips and run on a Bruker Impact II Q-TOF coupled to an Easy-Nano LC 1000 HPLC (Thermo Fisher Scientific) (88).
MaxQuant was used to assign peptide and protein identifications and relative abundance ratios (89). Perseus was used to analyze relative abundance ratios and determine significantly enriched proteins (90). ErmineJ was used to determine statically enriched gene ontology (GO) annotations in the BDEX and surface proteomes compared with the entire mouse genome (91, 92).
Flow cytometry
Flow cytometry analysis of 15,000 × g and 100,000 × g pellets was performed with modifications following published protocols (51, 52, 93, 94). All buffers are passaged through a 0.1-μm polyvinylidene difluoride filter (Corning Life Sciences, Tewksbury MA) prior to use. BDEVs and BDMVs were resuspended in 0.4% BSA in PBS. EVs and MVs were probed with the following antibodies at the manufacturer's recommended concentration. Anti-GLAST (phycoerythrin and allophycocyanine, clone ACSA-1), anti-CD81 (phycoerythrin, clone EAT2), and anti-CD11b (FITC, clone M1/70.15.11.5) were purchased from Miltenyi Biotech. Anti-CD56/NCAM (allophycocyanine, clone FAB7820A) was purchased from R&D Systems (Minneapolis, MN). All isotype control antibodies and anti-SNAP25 were purchased from Biolegend. Anti-mouse Alexa-488 secondary antibody was purchased from Life Technologies (Thermo Fisher Scientific). Antibodies were centrifuged at 20,000 × g for 20 min prior to incubation with vesicles for 1 h at room temperature in the dark. Unbound antibody was removed from vesicles after resuspension in 1 ml of PBS by ultracentrifugation at either 15,000 × g for 30 min or 100,000 × g for 1 h for BDMV and BDEX, respectively. Vesicle pellets were resuspended in 100–500 μl of PBS and then diluted further to 1:250 for BDMV and 1:10 for BDEV in PBS and PBS + 1.0% Nonidet P-40. Vesicles were analyzed on a MACSQuant analyzer (Miltenyi Biotech) after thorough washing of the machine with 1% bleach. Samples were collected on the lowest flow setting for 2 min each. Between each sample, PBS was run on the high flow setting. Data were analyzed with FlowJo (Ashland, OR). Statistical analysis was performed with GraphPad Prism versions 5–7.
Nonreducing SDS-PAGE
Purified vesicles were thawed on ice, and the total protein concentration was measured using the Pierce BCA assay kit. Reducing and nonreducing SDS-PAGE was carried out using 15 μg of protein from mouse MVs (30 μg for mSOD1−/−/HuSOD1G127X MVs) and 5 μg from human MVs, with and without the presence of 100 mm iodoacetamide. The vesicles were mixed with 5 μl of 1× NuPAGE sample buffer (Thermo Fisher Scientific) with one of four possible treatments and buffered with PBS (pH 7.4) to a total volume of 15 μl. The treatments were as follows: 2.5% β-mercaptoethanol, 2.5% β-mercaptoethanol with 100 mm iodoacetamide, 100 mm iodoacetamide, and no treatment. Samples were heated for 5 min at 95 °C and electrophoresed on NuPAGE 4–12% BisTris gels (Thermo Fisher Scientific) before being transferred onto polyvinylidene difluoride membranes. After transfer, the membranes were probed with rabbit polyclonal SOD100 antibody followed by horseradish peroxidase anti-rabbit IgG (GE Healthcare). Membranes were exposed to SupersignalTM West Femto substrate (Thermo Fisher Scientific), and the chemiluminescence was measured using a ChemiDoc system (Bio-Rad). The relative intensity of the bands was measured using ImageLab, and the percentage of aggregate signal compared with the total band signal was calculated.
Author contributions
J. M. S. proposed the hypothesis, designed and performed experiments, and drafted the manuscript. D. C., C. C. S., Y. B., S. F., Z. G., and L. M. contributed to optimization and performed vesicle collection and immunoblotting, proteomics, flow cytometric, and ELISA experiments. K. M. M. performed quantitative mass spectrometry, and R. G. S. assisted in quantitative proteomics analysis. L. I. G. contributed to experimental design and performed immunoprecipitation experiments. Z. G. and C. M. C. performed TEM experiments. I. R. M. contributed to experimental design and provided human ALS tissue. L. J. F. and N. R. C. contributed to the hypothesis, experimental design, and manuscript drafting.
Supplementary Material
Acknowledgments
We thank Dr. Lyle Ostrow (Target ALS–Johns Hopkins School of Medicine) for human patient tissue. We thank Dr. Andy Hill and Dr. Laura Jayne Vella for technical assistance and thoughtful scientific discussions. We thank Dr. Wayne Vogle for technical TEM assistance. We thank Andy Johnson and Justin Wong (University of British Columbia Flow Core) for technical assistance and support with flow cytometry. We thank Dr. Emma Guns for critical reading of the manuscript.
This work was supported by a Bernice Ramsay ALS Canada grant, along with funding from the Paul Heller Memorial Fund (to J. M. S.). N. R. C. is the Chief Scientific Officer of ProMIS Neurosciences, which has licensed the 3H1 misfolded SOD1–specific antibody technology.
This article contains Figs. S1 and S2 and Tables S1–S9.
- ALS
- amyotrophic lateral sclerosis
- CNS
- central nervous system
- SOD1
- superoxide dismutase 1
- EV
- extracellular vesicle
- MV
- microvesicle
- EX
- exosome
- AD
- Alzheimer's disease
- NTg
- nontransgenic
- RBP
- RNA-binding protein
- PrP
- prion protein
- BDEX
- brain-derived EX
- BDEV
- brain-derived EV
- BDMV
- brain-derived MV
- BisTris
- 2-[bis(2-hydroxyethyl)amino]-2-(hydroxymethyl)propane-1,3-diol
- TEM
- transmission EM
- GO
- gene ontology
- ANOVA
- analysis of variance.
References
- 1. Ravits J. (2014) Focality, stochasticity and neuroanatomic propagation in ALS pathogenesis. Exp. Neurol. 262, 121–126 10.1016/j.expneurol.2014.07.021 [DOI] [PubMed] [Google Scholar]
- 2. Renton A. E., Chiò A., and Traynor B. J. (2014) State of play in amyotrophic lateral sclerosis genetics. Nat. Neurosci. 17, 17–23 10.1038/nn.3584 [DOI] [PMC free article] [PubMed] [Google Scholar]
- 3. Grad L. I., Guest W. C., Yanai A., Pokrishevsky E., O'Neill M. A., Gibbs E., Semenchenko V., Yousefi M., Wishart D. S., Plotkin S. S., and Cashman N. R. (2011) Intermolecular transmission of superoxide dismutase 1 misfolding in living cells. Proc. Natl. Acad. Sci. U.S.A. 108, 16398–16403 10.1073/pnas.1102645108 [DOI] [PMC free article] [PubMed] [Google Scholar]
- 4. Münch C., O'Brien J., and Bertolotti A. (2011) Prion-like propagation of mutant superoxide dismutase-1 misfolding in neuronal cells. Proc. Natl. Acad. Sci. U.S.A. 108, 3548–3553 10.1073/pnas.1017275108 [DOI] [PMC free article] [PubMed] [Google Scholar]
- 5. Ayers J. I., Fromholt S., Koch M., DeBosier A., McMahon B., Xu G., and Borchelt D. R. (2014) Experimental transmissibility of mutant SOD1 motor neuron disease. Acta Neuropathol. 128, 791–803 10.1007/s00401-014-1342-7 [DOI] [PubMed] [Google Scholar]
- 6. Grad L. I., Yerbury J. J., Turner B. J., Guest W. C., Pokrishevsky E., O'Neill M. A., Yanai A., Silverman J. M., Zeineddine R., Corcoran L., Kumita J. R., Luheshi L. M., Yousefi M., Coleman B. M., Hill A. F., et al. (2014) Intercellular propagated misfolding of wild-type Cu/Zn superoxide dismutase occurs via exosome-dependent and -independent mechanisms. Proc. Natl. Acad. Sci. U.S.A. 111, 3620–3625 10.1073/pnas.1312245111 [DOI] [PMC free article] [PubMed] [Google Scholar]
- 7. Nonaka T., Masuda-Suzukake M., Arai T., Hasegawa Y., Akatsu H., Obi T., Yoshida M., Murayama S., Mann D. M., Akiyama H., and Hasegawa M. (2013) Prion-like properties of pathological TDP-43 aggregates from diseased brains. Cell Rep. 4, 124–134 10.1016/j.celrep.2013.06.007 [DOI] [PubMed] [Google Scholar]
- 8. Ding X., Ma M., Teng J., Teng R. K., Zhou S., Yin J., Fonkem E., Huang J. H., Wu E., and Wang X. (2015) Exposure to ALS-FTD-CSF generates TDP-43 aggregates in glioblastoma cells through exosomes and TNTs-like structure. Oncotarget 6, 24178–24191 [DOI] [PMC free article] [PubMed] [Google Scholar]
- 9. Fauré J., Lachenal G., Court M., Hirrlinger J., Chatellard-Causse C., Blot B., Grange J., Schoehn G., Goldberg Y., Boyer V., Kirchhoff F., Raposo G., Garin J., and Sadoul R. (2006) Exosomes are released by cultured cortical neurones. Mol. Cell Neurosci. 31, 642–648 10.1016/j.mcn.2005.12.003 [DOI] [PubMed] [Google Scholar]
- 10. Krämer-Albers E. M., Bretz N., Tenzer S., Winterstein C., Möbius W., Berger H., Nave K. A., Schild H., and Trotter J. (2007) Oligodendrocytes secrete exosomes containing major myelin and stress-protective proteins: trophic support for axons? Proteomics Clin. Appl. 1, 1446–1461 10.1002/prca.200700522 [DOI] [PubMed] [Google Scholar]
- 11. Guescini M., Genedani S., Stocchi V., and Agnati L. F. (2010) Astrocytes and glioblastoma cells release exosomes carrying mtDNA. J. Neural Transm. 117, 1–4 10.1007/s00702-009-0288-8 [DOI] [PubMed] [Google Scholar]
- 12. Potolicchio I., Carven G. J., Xu X., Stipp C., Riese R. J., Stern L. J., and Santambrogio L. (2005) Proteomic analysis of microglia-derived exosomes: metabolic role of the aminopeptidase CD13 in neuropeptide catabolism. J. Immunol. 175, 2237–2243 10.4049/jimmunol.175.4.2237 [DOI] [PubMed] [Google Scholar]
- 13. Pant S., Hilton H., and Burczynski M. E. (2012) The multifaceted exosome: biogenesis, role in normal and aberrant cellular function, and frontiers for pharmacological and biomarker opportunities. Biochem. Pharmacol. 83, 1484–1494 10.1016/j.bcp.2011.12.037 [DOI] [PMC free article] [PubMed] [Google Scholar]
- 14. Li C. C., Eaton S. A., Young P. E., Lee M., Shuttleworth R., Humphreys D. T., Grau G. E., Combes V., Bebawy M., Gong J., Brammah S., Buckland M. E., and Suter C. M. (2013) Glioma microvesicles carry selectively packaged coding and non-coding RNAs which alter gene expression in recipient cells. RNA Biol. 10, 1333–1344 10.4161/rna.25281 [DOI] [PMC free article] [PubMed] [Google Scholar]
- 15. Pelchen-Matthews A., Raposo G., and Marsh M. (2004) Endosomes, exosomes and Trojan viruses. Trends Microbiol. 12, 310–316 10.1016/j.tim.2004.05.004 [DOI] [PubMed] [Google Scholar]
- 16. Raposo G., and Stoorvogel W. (2013) Extracellular vesicles: exosomes, microvesicles, and friends. J. Cell Biol. 200, 373–383 10.1083/jcb.201211138 [DOI] [PMC free article] [PubMed] [Google Scholar]
- 17. Valadi H., Ekström K., Bossios A., Sjöstrand M., Lee J. J., and Lötvall J. O. (2007) Exosome-mediated transfer of mRNAs and microRNAs is a novel mechanism of genetic exchange between cells. Nat. Cell Biol. 9, 654–659 10.1038/ncb1596 [DOI] [PubMed] [Google Scholar]
- 18. Pegtel D. M., Cosmopoulos K., Thorley-Lawson D. A., van Eijndhoven M. A., Hopmans E. S., Lindenberg J. L., de Gruijl T. D., Würdinger T., and Middeldorp J. M. (2010) Functional delivery of viral miRNAs via exosomes. Proc. Natl. Acad. Sci. U.S.A. 107, 6328–6333 10.1073/pnas.0914843107 [DOI] [PMC free article] [PubMed] [Google Scholar]
- 19. Colombo M., Raposo G., and Théry C. (2014) Biogenesis, secretion, and intercellular interactions of exosomes and other extracellular vesicles. Annu. Rev. Cell Dev. Biol. 30, 255–289 10.1146/annurev-cellbio-101512-122326 [DOI] [PubMed] [Google Scholar]
- 20. Robbins P. D., and Morelli A. E. (2014) Regulation of immune responses by extracellular vesicles. Nat. Rev. Immunol. 14, 195–208 10.1038/nri3622 [DOI] [PMC free article] [PubMed] [Google Scholar]
- 21. Safdar A., Saleem A., and Tarnopolsky M. A. (2016) The potential of endurance exercise-derived exosomes to treat metabolic diseases. Nat. Rev. Endocrinol. 12, 504–517 10.1038/nrendo.2016.76 [DOI] [PubMed] [Google Scholar]
- 22. EL Andaloussi S., Mäger I., Breakefield X. O., and Wood M. J. (2013) Extracellular vesicles: biology and emerging therapeutic opportunities. Nat. Rev. Drug Discov. 12, 347–357 10.1038/nrd3978 [DOI] [PubMed] [Google Scholar]
- 23. Budnik V., Ruiz-Cañada C., and Wendler F. (2016) Extracellular vesicles round off communication in the nervous system. Nat. Rev. Neurosci. 17, 160–172 10.1038/nrn.2015.29 [DOI] [PMC free article] [PubMed] [Google Scholar]
- 24. Jeppesen D. K., Hvam M. L., Primdahl-Bengtson B., Boysen A. T., Whitehead B., Dyrskjøt L., Orntoft T. F., Howard K. A., and Ostenfeld M. S. (2014) Comparative analysis of discrete exosome fractions obtained by differential centrifugation. J. Extracell. Vesicles 3, 25011 10.3402/jev.v3.25011 [DOI] [PMC free article] [PubMed] [Google Scholar]
- 25. Vestad B., Llorente A., Neurauter A., Phuyal S., Kierulf B., Kierulf P., Skotland T., Sandvig K., Haug K. B. F., and Øvstebø R. (2017) Size and concentration analyses of extracellular vesicles by nanoparticle tracking analysis: a variation study. J. Extracell. Vesicles 6, 1344087 10.1080/20013078.2017.1344087 [DOI] [PMC free article] [PubMed] [Google Scholar]
- 26. Booth A. M., Fang Y., Fallon J. K., Yang J.-M., Hildreth J. E. K., and Gould S. J. (2006) Exosomes and HIV Gag bud from endosome-like domains of the T cell plasma membrane. J. Cell Biol. 172, 923–935 10.1083/jcb.200508014 [DOI] [PMC free article] [PubMed] [Google Scholar]
- 27. Raposo G., Tenza D., Mecheri S., Peronet R., Bonnerot C., and Desaymard C. (1997) Accumulation of major histocompatibility complex class II molecules in mast cell secretory granules and their release upon degranulation. Mol. Biol. Cell 8, 2631–2645 10.1091/mbc.8.12.2631 [DOI] [PMC free article] [PubMed] [Google Scholar]
- 28. Bobrie A., Colombo M., Raposo G., and Théry C. (2011) Exosome secretion: molecular mechanisms and roles in immune responses. Traffic 12, 1659–1668 10.1111/j.1600-0854.2011.01225.x [DOI] [PubMed] [Google Scholar]
- 29. Théry C., Ostrowski M., and Segura E. (2009) Membrane vesicles as conveyors of immune responses. Nat. Rev. Immunol. 9, 581–593 10.1038/nri2567 [DOI] [PubMed] [Google Scholar]
- 30. Perez-Gonzalez R., Gauthier S. A., Kumar A., and Levy E. (2012) The exosome secretory pathway transports amyloid precursor protein carboxyl-terminal fragments from the cell into the brain extracellular space. J. Biol. Chem. 287, 43108–43115 10.1074/jbc.M112.404467 [DOI] [PMC free article] [PubMed] [Google Scholar]
- 31. Asai H., Ikezu S., Tsunoda S., Medalla M., Luebke J., Haydar T., Wolozin B., Butovsky O., Kügler S., and Ikezu T. (2015) Depletion of microglia and inhibition of exosome synthesis halt tau propagation. Nat. Neurosci. 18, 1584–1593 10.1038/nn.4132 [DOI] [PMC free article] [PubMed] [Google Scholar]
- 32. Deng J., Koutras C., Donnelier J., Alshehri M., Fotouhi M., Girard M., Casha S., McPherson P. S., Robbins S. M., and Braun J. E. A. (2017) Neurons export extracellular vesicles enriched in cysteine string protein and misfolded protein cargo. Sci. Rep. 7, 956 10.1038/s41598-017-01115-6 [DOI] [PMC free article] [PubMed] [Google Scholar]
- 33. Sproviero D., La Salvia S., Giannini M., Crippa V., Gagliardi S., Bernuzzi S., Diamanti L., Ceroni M., Pansarasa O., Poletti A., and Cereda C. (2018) Pathological proteins are transported by extracellular vesicles of sporadic amyotrophic lateral sclerosis patients. Front. Neurosci. 12, 487 10.3389/fnins.2018.00487 [DOI] [PMC free article] [PubMed] [Google Scholar]
- 34. Simpson R. J., Lim J. W., Moritz R. L., and Mathivanan S. (2009) Exosomes: proteomic insights and diagnostic potential. Expert Rev. Proteomics 6, 267–283 10.1586/epr.09.17 [DOI] [PubMed] [Google Scholar]
- 35. Coleman B. M., Hanssen E., Lawson V. A., and Hill A. F. (2012) Prion-infected cells regulate the release of exosomes with distinct ultrastructural features. FASEB J. 26, 4160–4173 10.1096/fj.11-202077 [DOI] [PubMed] [Google Scholar]
- 36. Song F., Chiang P., Ravits J., and Loeb J. A. (2014) Activation of microglial neuregulin1 signaling in the corticospinal tracts of ALS patients with upper motor neuron signs. Amyotroph. Lateral Scler. Frontotemporal Degener. 15, 77–83 10.3109/21678421.2013.853802 [DOI] [PubMed] [Google Scholar]
- 37. Kang S. H., Li Y., Fukaya M., Lorenzini I., Cleveland D. W., Ostrow L. W., Rothstein J. D., and Bergles D. E. (2013) Degeneration and impaired regeneration of gray matter oligodendrocytes in amyotrophic lateral sclerosis. Nat. Neurosci. 16, 571–579 10.1038/nn.3357 [DOI] [PMC free article] [PubMed] [Google Scholar]
- 38. Woehlbier U., Colombo A., Saaranen M. J., Pérez V., Ojeda J., Bustos F. J., Andreu C. I., Torres M., Valenzuela V., Medinas D. B., Rozas P., Vidal R. L., Lopez-Gonzalez R., Salameh J., Fernandez-Collemann S., et al. (2016) ALS-linked protein disulfide isomerase variants cause motor dysfunction. EMBO J. 35, 845–865 10.15252/embj.201592224 [DOI] [PMC free article] [PubMed] [Google Scholar]
- 39. Jaronen M., Vehviläinen P., Malm T., Keksa-Goldsteine V., Pollari E., Valonen P., Koistinaho J., and Goldsteins G. (2013) Protein disulfide isomerase in ALS mouse glia links protein misfolding with NADPH oxidase-catalyzed superoxide production. Hum. Mol. Genet. 22, 646–655 10.1093/hmg/dds472 [DOI] [PubMed] [Google Scholar]
- 40. Noor A., and Zahid S. (2017) A review of the role of synaptosomal-associated protein 25 (SNAP-25) in neurological disorders. Int. J. Neurosci. 127, 805–811 10.1080/00207454.2016.1248240 [DOI] [PubMed] [Google Scholar]
- 41. Lederer C. W., Torrisi A., Pantelidou M., Santama N., and Cavallaro S. (2007) Pathways and genes differentially expressed in the motor cortex of patients with sporadic amyotrophic lateral sclerosis. BMC Genomics 8, 26 10.1186/1471-2164-8-26 [DOI] [PMC free article] [PubMed] [Google Scholar]
- 42. Mackenzie I. R., Bigio E. H., Ince P. G., Geser F., Neumann M., Cairns N. J., Kwong L. K., Forman M. S., Ravits J., Stewart H., Eisen A., McClusky L., Kretzschmar H. A., Monoranu C. M., Highley J. R., et al. (2007) Pathological TDP-43 distinguishes sporadic amyotrophic lateral sclerosis from amyotrophic lateral sclerosis with SOD1 mutations. Ann. Neurol. 61, 427–434 10.1002/ana.21147 [DOI] [PubMed] [Google Scholar]
- 43. Neumann M., Sampathu D. M., Kwong L. K., Truax A. C., Micsenyi M. C., Chou T. T., Bruce J., Schuck T., Grossman M., Clark C. M., McCluskey L. F., Miller B. L., Masliah E., Mackenzie I. R., Feldman H., et al. (2006) Ubiquitinated TDP-43 in frontotemporal lobar degeneration and amyotrophic lateral sclerosis. Science 314, 130–133 10.1126/science.1134108 [DOI] [PubMed] [Google Scholar]
- 44. Grad L. I., Fernando S. M., and Cashman N. R. (2015) From molecule to molecule and cell to cell: prion-like mechanisms in amyotrophic lateral sclerosis. Neurobiol. Dis. 77, 257–265 10.1016/j.nbd.2015.02.009 [DOI] [PubMed] [Google Scholar]
- 45. Bakkar N., Kovalik T., Lorenzini I., Spangler S., Lacoste A., Sponaugle K., Ferrante P., Argentinis E., Sattler R., and Bowser R. (2018) Artificial intelligence in neurodegenerative disease research: use of IBM Watson to identify additional RNA-binding proteins altered in amyotrophic lateral sclerosis. Acta Neuropathol. 135, 227–247 10.1007/s00401-017-1785-8 [DOI] [PMC free article] [PubMed] [Google Scholar]
- 46. Johnson J. O., Pioro E. P., Boehringer A., Chia R., Feit H., Renton A. E., Pliner H. A., Abramzon Y., Marangi G., Winborn B. J., Gibbs J. R., Nalls M. A., Morgan S., Shoai M., Hardy J., et al. (2014) Mutations in the Matrin 3 gene cause familial amyotrophic lateral sclerosis. Nat. Neurosci. 17, 664–666 10.1038/nn.3688 [DOI] [PMC free article] [PubMed] [Google Scholar]
- 47. Antonucci F., Corradini I., Fossati G., Tomasoni R., Menna E., and Matteoli M. (2016) SNAP-25, a known presynaptic protein with emerging postsynaptic functions. Front. Synaptic Neurosci. 8, 7 [DOI] [PMC free article] [PubMed] [Google Scholar]
- 48. Mathivanan S., Ji H., and Simpson R. J. (2010) Exosomes: extracellular organelles important in intercellular communication. J. Proteomics 73, 1907–1920 10.1016/j.jprot.2010.06.006 [DOI] [PubMed] [Google Scholar]
- 49. Chiasserini D., van Weering J. R., Piersma S. R., Pham T. V., Malekzadeh A., Teunissen C. E., de Wit H., and Jiménez C. R. (2014) Proteomic analysis of cerebrospinal fluid extracellular vesicles: a comprehensive dataset. J. Proteomics 106, 191–204 10.1016/j.jprot.2014.04.028 [DOI] [PubMed] [Google Scholar]
- 50. Keerthikumar S., Gangoda L., Liem M., Fonseka P., Atukorala I., Ozcitti C., Mechler A., Adda C. G., Ang C. S., and Mathivanan S. (2015) Proteogenomic analysis reveals exosomes are more oncogenic than ectosomes. Oncotarget 6, 15375–15396 [DOI] [PMC free article] [PubMed] [Google Scholar]
- 51. van der Pol E., Coumans F. A., Grootemaat A. E., Gardiner C., Sargent I. L., Harrison P., Sturk A., van Leeuwen T. G., and Nieuwland R. (2014) Particle size distribution of exosomes and microvesicles by transmission electron microscopy, flow cytometry, nanoparticle tracking analysis, and resistive pulse sensing. J. Thromb. Haemost. 12, 1182–1192 10.1111/jth.12602 [DOI] [PubMed] [Google Scholar]
- 52. Nolte-'t Hoen E. N. M., van der Vlist E. J., Aalberts M., Mertens H. C. H., Bosch B. J., Bartelink W., Mastrobattista E., van Gaal E. V. B., Stoorvogel W., Arkesteijn G. J. A., and Wauben M. H. M. (2012) Quantitative and qualitative flow cytometric analysis of nanosized cell-derived membrane vesicles. Nanomedicine 8, 712–720 10.1016/j.nano.2011.09.006 [DOI] [PMC free article] [PubMed] [Google Scholar]
- 53. Rakhit R., Robertson J., Vande Velde C., Horne P., Ruth D. M., Griffin J., Cleveland D. W., Cashman N. R., and Chakrabartty A. (2007) An immunological epitope selective for pathological monomer-misfolded SOD1 in ALS. Nat. Med. 13, 754–759 10.1038/nm1559 [DOI] [PubMed] [Google Scholar]
- 54. Johnston J. A., Dalton M. J., Gurney M. E., and Kopito R. R. (2000) Formation of high molecular weight complexes of mutant Cu,Zn-superoxide dismutase in a mouse model for familial amyotrophic lateral sclerosis. Proc. Natl. Acad. Sci. U.S.A. 97, 12571–12576 10.1073/pnas.220417997 [DOI] [PMC free article] [PubMed] [Google Scholar]
- 55. Tokuda E., Anzai I., Nomura T., Toichi K., Watanabe M., Ohara S., Watanabe S., Yamanaka K., Morisaki Y., Misawa H., and Furukawa Y. (2017) Immunochemical characterization on pathological oligomers of mutant Cu/Zn-superoxide dismutase in amyotrophic lateral sclerosis. Mol. Neurodegener. 12, 2 10.1186/s13024-016-0145-9 [DOI] [PMC free article] [PubMed] [Google Scholar]
- 56. Jonsson P. A., Ernhill K., Andersen P. M., Bergemalm D., Brännström T., Gredal O., Nilsson P., and Marklund S. L. (2004) Minute quantities of misfolded mutant superoxide dismutase-1 cause amyotrophic lateral sclerosis. Brain 127, 73–88 10.1093/brain/awh005 [DOI] [PubMed] [Google Scholar]
- 57. McAlary L., Aquilina J. A., and Yerbury J. J. (2016) Susceptibility of mutant SOD1 to form a destabilized monomer predicts cellular aggregation and toxicity but not in vitro aggregation propensity. Front. Neurosci. 10, 499 [DOI] [PMC free article] [PubMed] [Google Scholar]
- 58. Grad L. I., Pokrishevsky E., Silverman J. M., and Cashman N. R. (2014) Exosome-dependent and independent mechanisms are involved in prion-like transmission of propagated Cu/Zn superoxide dismutase misfolding. Prion 8, 331–335 10.4161/19336896.2014.983398 [DOI] [PMC free article] [PubMed] [Google Scholar]
- 59. Ngolab J., Trinh I., Rockenstein E., Mante M., Florio J., Trejo M., Masliah D., Adame A., Masliah E., and Rissman R. A. (2017) Brain-derived exosomes from dementia with Lewy bodies propagate α-synuclein pathology. Acta Neuropathol. Commun. 5, 46 10.1186/s40478-017-0445-5 [DOI] [PMC free article] [PubMed] [Google Scholar] [Retracted]
- 60. Ditsworth D., Maldonado M., McAlonis-Downes M., Sun S., Seelman A., Drenner K., Arnold E., Ling S. C., Pizzo D., Ravits J., Cleveland D. W., and Da Cruz S. (2017) Mutant TDP-43 within motor neurons drives disease onset but not progression in amyotrophic lateral sclerosis. Acta Neuropathol. 133, 907–922 10.1007/s00401-017-1698-6 [DOI] [PMC free article] [PubMed] [Google Scholar]
- 61. Zhao W., Beers D. R., Henkel J. S., Zhang W., Urushitani M., Julien J. P., and Appel S. H. (2010) Extracellular mutant SOD1 induces microglial-mediated motoneuron injury. Glia 58, 231–243 10.1002/glia.20919 [DOI] [PMC free article] [PubMed] [Google Scholar]
- 62. Ilieva H., Polymenidou M., and Cleveland D. W. (2009) Non-cell autonomous toxicity in neurodegenerative disorders: ALS and beyond. J. Cell Biol. 187, 761–772 10.1083/jcb.200908164 [DOI] [PMC free article] [PubMed] [Google Scholar]
- 63. Nagai M., Re D. B., Nagata T., Chalazonitis A., Jessell T. M., Wichterle H., and Przedborski S. (2007) Astrocytes expressing ALS-linked mutated SOD1 release factors selectively toxic to motor neurons. Nat. Neurosci. 10, 615–622 10.1038/nn1876 [DOI] [PMC free article] [PubMed] [Google Scholar]
- 64. Meyer K., Ferraiuolo L., Miranda C. J., Likhite S., McElroy S., Renusch S., Ditsworth D., Lagier-Tourenne C., Smith R. A., Ravits J., Burghes A. H., Shaw P. J., Cleveland D. W., Kolb S. J., and Kaspar B. K. (2014) Direct conversion of patient fibroblasts demonstrates non-cell autonomous toxicity of astrocytes to motor neurons in familial and sporadic ALS. Proc. Natl. Acad. Sci. U.S.A. 111, 829–832 10.1073/pnas.1314085111 [DOI] [PMC free article] [PubMed] [Google Scholar]
- 65. Basso M., Pozzi S., Tortarolo M., Fiordaliso F., Bisighini C., Pasetto L., Spaltro G., Lidonnici D., Gensano F., Battaglia E., Bendotti C., and Bonetto V. (2013) Mutant copper-zinc superoxide dismutase (SOD1) induces protein secretion pathway alterations and exosome release in astrocytes: implications for disease spreading and motor neuron pathology in amyotrophic lateral sclerosis. J. Biol. Chem. 288, 15699–15711 10.1074/jbc.M112.425066 [DOI] [PMC free article] [PubMed] [Google Scholar]
- 66. Bowyer J. F., and Davies D. L. (1999) Changes in mRNA levels for heat-shock/stress proteins (Hsp) and a secretory vesicle associated cysteine-string protein (Csp1) after amphetamine (AMPH) exposure. Ann. N.Y. Acad. Sci. 890, 314–329 10.1111/j.1749-6632.1999.tb08009.x [DOI] [PubMed] [Google Scholar]
- 67. Ciryam P., Lambert-Smith I. A., Bean D. M., Freer R., Cid F., Tartaglia G. G., Saunders D. N., Wilson M. R., Oliver S. G., Morimoto R. I., Dobson C. M., Vendruscolo M., Favrin G., and Yerbury J. J. (2017) Spinal motor neuron protein supersaturation patterns are associated with inclusion body formation in ALS. Proc. Natl. Acad. Sci. U.S.A. 114, E3935–E3943 10.1073/pnas.1613854114 [DOI] [PMC free article] [PubMed] [Google Scholar]
- 68. Da Cruz S., Bui A., Saberi S., Lee S. K., Stauffer J., McAlonis-Downes M., Schulte D., Pizzo D. P., Parone P. A., Cleveland D. W., and Ravits J. (2017) Misfolded SOD1 is not a primary component of sporadic ALS. Acta Neuropathol. 134, 97–111 10.1007/s00401-017-1688-8 [DOI] [PMC free article] [PubMed] [Google Scholar]
- 69. Rotunno M. S., and Bosco D. A. (2013) An emerging role for misfolded wild-type SOD1 in sporadic ALS pathogenesis. Front. Cell Neurosci. 7, 253 [DOI] [PMC free article] [PubMed] [Google Scholar]
- 70. Grad L. I., Rouleau G. A., Ravits J., and Cashman N. R. (2017) Clinical spectrum of amyotrophic lateral sclerosis (ALS). Cold Spring Harb. Perspect. Med. 7, a024117 10.1101/cshperspect.a024117 [DOI] [PMC free article] [PubMed] [Google Scholar]
- 71. Cestra G., Rossi S., Di Salvio M., and Cozzolino M. (2017) Control of mRNA translation in ALS proteinopathy. Front. Mol. Neurosci. 10, 85 [DOI] [PMC free article] [PubMed] [Google Scholar]
- 72. Kapur M., Monaghan C. E., and Ackerman S. L. (2017) Regulation of mRNA translation in neurons—a matter of life and death. Neuron 96, 616–637 10.1016/j.neuron.2017.09.057 [DOI] [PMC free article] [PubMed] [Google Scholar]
- 73. Ito D., Hatano M., and Suzuki N. (2017) RNA binding proteins and the pathological cascade in ALS/FTD neurodegeneration. Sci. Transl. Med. 9, eaah5436 10.1126/scitranslmed.aah5436 [DOI] [PubMed] [Google Scholar]
- 74. Paschon V., Takada S. H., Ikebara J. M., Sousa E., Raeisossadati R., Ulrich H., and Kihara A. H. (2016) Interplay between exosomes, microRNAs and Toll-like receptors in brain disorders. Mol. Neurobiol. 53, 2016–2028 10.1007/s12035-015-9142-1 [DOI] [PubMed] [Google Scholar]
- 75. An K., Klyubin I., Kim Y., Jung J. H., Mably A. J., O'Dowd S. T., Lynch T., Kanmert D., Lemere C. A., Finan G. M., Park J. W., Kim T. W., Walsh D. M., Rowan M. J., and Kim J. H. (2013) Exosomes neutralize synaptic-plasticity-disrupting activity of Aβ assemblies in vivo. Mol. Brain 6, 47 10.1186/1756-6606-6-47 [DOI] [PMC free article] [PubMed] [Google Scholar]
- 76. Lachenal G., Pernet-Gallay K., Chivet M., Hemming F. J., Belly A., Bodon G., Blot B., Haase G., Goldberg Y., and Sadoul R. (2011) Release of exosomes from differentiated neurons and its regulation by synaptic glutamatergic activity. Mol. Cell Neurosci. 46, 409–418 10.1016/j.mcn.2010.11.004 [DOI] [PubMed] [Google Scholar]
- 77. Peschl P., Bradl M., Höftberger R., Berger T., and Reindl M. (2017) Myelin oligodendrocyte glycoprotein: deciphering a target in inflammatory demyelinating diseases. Front. Immunol. 8, 529 10.3389/fimmu.2017.00529 [DOI] [PMC free article] [PubMed] [Google Scholar]
- 78. Yoshihara T., Ishigaki S., Yamamoto M., Liang Y., Niwa J., Takeuchi H., Doyu M., and Sobue G. (2002) Differential expression of inflammation- and apoptosis-related genes in spinal cords of a mutant SOD1 transgenic mouse model of familial amyotrophic lateral sclerosis. J. Neurochem. 80, 158–167 10.1046/j.0022-3042.2001.00683.x [DOI] [PubMed] [Google Scholar]
- 79. Brett S. I., Lucien F., Guo C., Williams K. C., Kim Y., Durfee P. N., Brinker C. J., Chin J. I., Yang J., and Leong H. S. (2017) Immunoaffinity based methods are superior to kits for purification of prostate derived extracellular vesicles from plasma samples. Prostate 77, 1335–1343 10.1002/pros.23393 [DOI] [PubMed] [Google Scholar]
- 80. Dal Canto M. C., and Gurney M. E. (1994) Development of central nervous system pathology in a murine transgenic model of human amyotrophic lateral sclerosis. Am. J. Pathol. 145, 1271–1279 [PMC free article] [PubMed] [Google Scholar]
- 81. Gurney M. E., Pu H., Chiu A. Y., Dal Canto M. C., Polchow C. Y., Alexander D. D., Caliendo J., Hentati A., Kwon Y. W., and Deng H. X. (1994) Motor neuron degeneration in mice that express a human Cu,Zn superoxide dismutase mutation. Science 264, 1772–1775 10.1126/science.8209258 [DOI] [PubMed] [Google Scholar]
- 82. Gurney M. E. (1994) Transgenic-mouse model of amyotrophic lateral sclerosis. N. Engl. J. Med. 331, 1721–1722 10.1056/NEJM199412223312516 [DOI] [PubMed] [Google Scholar]
- 83. Tauro B. J., Greening D. W., Mathias R. A., Ji H., Mathivanan S., Scott A. M., and Simpson R. J. (2012) Comparison of ultracentrifugation, density gradient separation, and immunoaffinity capture methods for isolating human colon cancer cell line LIM1863-derived exosomes. Methods 56, 293–304 10.1016/j.ymeth.2012.01.002 [DOI] [PubMed] [Google Scholar]
- 84. Silverman J. M., Clos J., de'Oliveira C. C., Shirvani O., Fang Y., Wang C., Foster L. J., and Reiner N. E. (2010) An exosome-based secretion pathway is responsible for protein export from Leishmania and communication with macrophages. J. Cell Sci. 123, 842–852 10.1242/jcs.056465 [DOI] [PubMed] [Google Scholar]
- 85. Foster L. J., De Hoog C. L., and Mann M. (2003) Unbiased quantitative proteomics of lipid rafts reveals high specificity for signaling factors. Proc. Natl. Acad. Sci. U.S.A. 100, 5813–5818 10.1073/pnas.0631608100 [DOI] [PMC free article] [PubMed] [Google Scholar]
- 86. Ishihama Y., Rappsilber J., Andersen J. S., and Mann M. (2002) Microcolumns with self-assembled particle frits for proteomics. J. Chromatogr. A 979, 233–239 10.1016/S0021-9673(02)01402-4 [DOI] [PubMed] [Google Scholar]
- 87. Parker R., Guarna M. M., Melathopoulos A. P., Moon K. M., White R., Huxter E., Pernal S. F., and Foster L. J. (2012) Correlation of proteome-wide changes with social immunity behaviors provides insight into resistance to the parasitic mite, Varroa destructor, in the honey bee (Apis mellifera). Genome Biol. 13, R81 10.1186/gb-2012-13-9-r81 [DOI] [PMC free article] [PubMed] [Google Scholar]
- 88. Gibbs M. R., Moon K. M., Chen M., Balakrishnan R., Foster L. J., and Fredrick K. (2017) Conserved GTPase LepA (elongation factor 4) functions in biogenesis of the 30S subunit of the 70S ribosome. Proc. Natl. Acad. Sci. U.S.A. 114, 980–985 10.1073/pnas.1613665114 [DOI] [PMC free article] [PubMed] [Google Scholar]
- 89. Cox J., and Mann M. (2008) MaxQuant enables high peptide identification rates, individualized p.p.b.-range mass accuracies and proteome-wide protein quantification. Nat. Biotechnol. 26, 1367–1372 10.1038/nbt.1511 [DOI] [PubMed] [Google Scholar]
- 90. Tyanova S., Temu T., Sinitcyn P., Carlson A., Hein M. Y., Geiger T., Mann M., and Cox J. (2016) The Perseus computational platform for comprehensive analysis of (prote)omics data. Nat. Methods 13, 731–740 10.1038/nmeth.3901 [DOI] [PubMed] [Google Scholar]
- 91. Gillis J., Mistry M., and Pavlidis P. (2010) Gene function analysis in complex data sets using ErmineJ. Nat. Protoc. 5, 1148–1159 10.1038/nprot.2010.78 [DOI] [PubMed] [Google Scholar]
- 92. Lee H. K., Braynen W., Keshav K., and Pavlidis P. (2005) ErmineJ: tool for functional analysis of gene expression data sets. BMC Bioinformatics 6, 269 10.1186/1471-2105-6-269 [DOI] [PMC free article] [PubMed] [Google Scholar]
- 93. Pospichalova V., Svoboda J., Dave Z., Kotrbova A., Kaiser K., Klemova D., Ilkovics L., Hampl A., Crha I., Jandakova E., Minar L., Weinberger V., and Bryja V. (2015) Simplified protocol for flow cytometry analysis of fluorescently labeled exosomes and microvesicles using dedicated flow cytometer. J. Extracell. Vesicles 4, 25530 10.3402/jev.v4.25530 [DOI] [PMC free article] [PubMed] [Google Scholar]
- 94. Inglis H., Norris P., and Danesh A. (2015) Techniques for the analysis of extracellular vesicles using flow cytometry. J. Vis. Exp. 10.3791/52484 10.3791/52484 [DOI] [PMC free article] [PubMed] [Google Scholar]
Associated Data
This section collects any data citations, data availability statements, or supplementary materials included in this article.