

Environmental genotoxic factors pose a serious and constant peril to the genomic integrity of cells at barrier surfaces with the environment. They can induce mutations that, if they occur in epithelial stem cells, contribute to malignant transformation and cancer development1–3. Genome integrity in epithelial stem cells is closely guarded by an evolutionary conserved, cellular response pathway, the DNA damage response (DDR). The DDR culminates in either transient cell cycle arrest and DNA repair or elimination of damaged cells by apoptosis4,5. Here we show, that the cytokine interleukin (IL-)22 produced by group 3 innate lymphoid cells (ILC3) and γδ T cells is an important rheostat of the DDR machinery in intestinal epithelial stem cells. Using a new mouse model allowing for the sporadic inactivation of the IL-22 receptor in colon epithelial stem cells, we demonstrate that IL-22 is required for an effective initiation of the DDR following DNA damage. In consequence, stem cells deprived of IL-22 signals and exposed to carcinogens escaped DDR-controlled apoptosis, contained more mutations, and were more likely to give rise to colon cancer. We identified metabolites of glucosinolates, a group of phytochemicals contained in cruciferous vegetables, to be an commonplace source of genotoxic stress in intestinal epithelial cells. Glucosinolate metabolites are ligands of the aryl hydrocarbon receptor (AhR)6 and AhR signaling in ILC3 and γδ T cells controlled their production of IL-22. Mice fed with diets deprived of glucosinolates produced only very low levels of IL-22 and, consequently, the DDR in epithelial cells of mice on a glucosinolate-free diet was crippled. Collectively, we identify a homeostatic network protecting stem cells against perils to their genome integrity by AhR-mediated “sensing” of genotoxic components contained in diets. AhR signaling in turn ensures on-demand production of IL-22 by innate lymphocytes directly regulating components of the DDR in epithelial stem cells.
To model colitis-associated colon cancer (CAC), we challenged mice with the pro-carcinogen azoxymethane (AOM), and then treated with dextran sodium sulfate (DSS) resulting in intestinal inflammation fueling tumor growth. AOM is an alkylating agent that generates mutagenic O6-methylguanine (O6meG) adducts in DNA that lead to O6meG:T mispairings and eventually to mutations7. These mutations often affect the glycogen synthase kinase (GSK)-3β phosphorylation site in exon 3 of the β-catenin gene similar to the mutations8–10 found in the majority of human colon cancers. Mice genetically and constitutively lacking IL-22 developed more tumors11 (Extended Data Fig. 1a,b), that were mainly found in the distal part of the colon (Extended Data Fig. 1c). IL-22 is a cytokine selectively acting on non-hematopoietic cells including epithelial stem cells12. While the results may suggest that IL-22 restrains tumor development, these data were difficult to interpret since Il22-/- mice have dysbiotic changes in microbial communities13 and show increased inflammation11 after DSS application (Extended Data Fig. 1d-f). Thus, the enhanced inflammation itself could explain the higher number of tumors in Il22-/- mice.
Il22-/- mice also developed more tumors when treated with AOM injections only (Fig. 1a). To differentiate direct effects of IL-22 signaling on tumor transformation in colon stem cells from confounding differences in inflammation, microbiota, and/or other stem cell extrinsic factors inherent to the comparison of mutant and wildtype mice, we conceived a mouse model allowing for the inducible and sporadic deletion of the gene encoding IL-22 receptor a1 (Il22ra1) in intestinal epithelial stem cells (Fig. 1b, Extended Data Fig. 1g), the primary target of carcinogenesis14. To achieve this, we first generated Il22ra1fl/fl mice (Extended Data Fig. 2 a-g) and crossed these to Lgr5CreERt2/+ mice allowing for tamoxifen-inducible Cre activity in crypt-based columnar stem cells15. To report Cre activity and gene inactivation, Il22ra1fl/fl;Lgr5CreERt2/+ mice were further mated to Rosa26R-Confetti mice, containing four colors that are stochastically activated after Cre-mediated removal of a transcriptional roadblock16. After tamoxifen application, we targeted on average 15-30% of crypts (Fig. 1c) and the fraction of crypts with one or more colors was not affected by Il22ra1 expression (Extended Data Fig. 2h,i). In contrast to the comparison of mutant and wildtype mice (Extended Data Fig. 1d), we did not detect any differences in DSS-induced weight loss between Il22ra1fl/fl;Lgr5CreERt2/+;R26R-Confetti and Il22ra1fl/+;Lgr5CreERt2/+;R26R-Confetti mice (Extended Data Fig. 2j). Importantly, Confetti+ tumors from Il22ra1fl/fl;Lgr5CreERt2/+;R26R-Confetti mice did not express IL-22Ra1 whereas Confetti- tumors in the same mouse were IL-22Ra1-positive (Extended Data Fig. 3 a-e). This approach allowed us to interrogate IL-22-dependent programs in stem cells within the same mouse by creating a mosaic of IL-22Ra1+ and IL-22Ra1- crypts (Fig. 1b).
Figure 1. IL-22 protects stem cells against malignant transformation.

(a) Colon tumors in mice injected with AOM only (Il22+/+ n=9, Il22-/- n=10, mean±SEM, p=0.0059).
(b-f) Indicated strains were treated 2 weeks with tamoxifen diets and subjected to AOM/DSS. (b) Sporadic deletion of IL-22R after Cre activation. (c) Labeling efficiency (%) of crypts (Il22ra1fl/+ n=27, Il22ra1fl/fl n=29 visual fields, mean±SEM, p=0.7256). (d) Fraction of Confetti-positive tumors (Il22ra1fl/+ n=7, Il22ra1fl/fl n=9, mean±SEM, p=0.0001). (e) Quantification of all tumors (Il22ra1fl/+ n=10, Il22ra1fl/fl n=19, mean±SEM, p=0.0003). Scale bar=1cm. (f) Representative immunohistology of colon carcinomas. Scale bar=200μm.
Data are representative of two (a,d-f) and three (c) biologically independent experiments
Considering the labelling efficiency (Fig. 1c, Extended Data Fig. 2h,i), we would expect 15-30% of Confetti+ tumors which is what we observed in mice having one functional allele of Il22ra1 (Fig. 1d). In striking contrast, the fraction of Confetti+ tumors in mice with sporadic inactivation of the Il22ra1 gene was substantially increased, demonstrating that absence of IL-22 signaling in colon epithelial cells pre-disposes them for tumor development (Fig. 1d-f). In the colon, roughly half of the IL-22 producers were CD4+ T cells, a third ILC3 and ca. 6% each, Foxp3+ CD4+ T cells and γδ T cells (Extended Data Fig. 4a). ILC3 were the dominant source of IL-22 in the small intestine (Extended Data Fig. 4b). Less sheltered mice showed a larger fraction (79-88%) of CD4+ T cells among IL-22 producers (Extended Data Fig. 4c). Collectively, the data demonstrate that IL-22 signaling in colon epithelial cells is a significant barrier to tumor development.
Stem cells are the origin of cancer4,14. IL-22 is continuously produced at the steady-state17 but the IL-22-controlled transcriptional networks in colon stem cells are unknown. Using RNA-seq, we found that during the steady-state 350 genes (with FC>2) were changed in expression between Lgr5+ colon stem cells of Il22+/+ and Il22-/- mice (Extended Data Fig. 5a,b). Gene Set Enrichment Analysis (GSEA) revealed, that stem cells from Il22-/- mice were depleted of transcripts associated with ‘DNA Repair’ (Fig. 2a) and ‘DNA double-strand break processing’ (Extended Data Fig. 5c). Considering these biological pathways, we performed RNA-seq of sorted colonic Lgr5+ stem cells from Il22+/+ and Il22-/- mice 24 hours after inducing DNA double strand breaks when the cellular response to DNA damage was maximal (Extended Data Fig. 5d). GSEA of the expressed genes showed significant enrichment of gene signatures such as ‘Hallmark Apoptosis’ and ‘DNA damage response effector genes’ in Lgr5+ stem cells from Il22+/+ but not from Il22-/- mice (Fig. 2b, Extended Data Fig. 5e). IL-22BP is an antagonist of IL-22 produced to blunt excessive and potentially pathologic IL-22 production11. IL-22BP production was reduced following DNA damage allowing for higher concentrations of bioactive IL-22 (Extended Data Fig. 5f). These data indicate that stem cells deprived of IL-22 signals lack transcriptional signatures of the DDR and DNA repair pathways.
Figure 2. IL-22 regulates key components of the DDR.

(a-b) Il22+/+;Lgr5Egfp/+ and Il22-/-;Lgr5Egfp/+ mice (n=3) untreated (a) or irradiated with 8 Gy (b). Lgr5 (GFP)+ colon epithelial stem cells were purified. Gene expression was analyzed by RNA-seq. Gene set enrichment analysis (GSEA) on all expressed transcripts at steady-state (a) or 24 h after irradiation (b). Nominal p-value (Kolmogorov-Smirnov test) was calculated for Kauffmann_DNA_Repair_Genes (p=0.009), Hallmark_Apoptosis (p=0.05), DDR_Effector_Genes (p=0.004).
(c) Atm gene expression in untreated colon epithelial stem cells determined by qRT-PCR (Il22+/+ n=8, Il22-/- n=5 (p=0.005), Il22ra1fl/fl;Vil1-Cre n=6 (p=0.0009), mean±SEM).
(d) ATM expression in untreated colon epithelial (EpCam+) cells or after IL-22 injection. MFI (Il22+/+ n=6, Il22-/- n=3 (p=0.04), Il22+/++IL-22 n=3 (p=0.0001), mean±SEM).
(e,f) Mice were irradiated with 8 Gy. γH2AX formation in colon epithelial (EpCam+) cells 4 h and 8 h after irradiation. (e) Quantification of γH2AX+ nuclei (Il22+/+ 8h n=6, Ahrfl/fl;Rorc(γt)-Cre 8h n=7, other n=3, mean±SEM). (f) Representative immunohistology 8 h after irradiation. Scale bar=50μm.
Data are representative of two (c-f) biologically independent experiments
To pinpoint the IL-22-dependent processes within the DDR, we performed a systematic analysis of critical checkpoints. Expression of MRN complex genes (Mre11, Rad50, Nbn), which sense DNA damage, was independent of IL-22 (Extended Data Fig. 5g). The MRN complex recruits and activates a group of kinases (i.e., ATM, ATR, DNA-PK) which initiate the DDR cascade and are expressed in almost all living cells for an immediate response to genotoxic stress18. We found a reduction of Atm expression in colon stem cells from Il22-/- mice already in the absence of genotoxic stress (Fig. 2c,d, Extended Data Fig. 5h,6a). Atm is a STAT3 target gene19 and IL-22 induces STAT3 signaling in epithelial cells20. STAT3 ChIP using primers for three STAT3 binding sites in the Atm gene regulatory elements (Extended Data Fig. 6b) revealed reduced STAT3 occupancy at all three binding sites in epithelial cells from Il22-/- mice during the steady-state (Extended Data Fig. 6c). Exogenous in vivo application of IL-22 significantly enhanced STAT3 binding (Extended Data Fig. 6c) and increased ATM levels in colon epithelial stem cells (Fig. 2d). After DNA damage, ATM phosphorylates histone variant H2AX (referred to as γH2AX) which flanks the break site21. While Il22+/+ mice showed maximal γH2AX levels in colon crypts 8 hours after irradiation, there was virtually no increase in Il22-/- or Il22ra1fl/fl;Vil1-Cre mice at any time point investigated (Fig. 2e,f and Extended Data Fig. 6d,e). H2AX protein levels did not differ between Il22+/+ and Il22-/- mice (Extended Data Fig. 6f). While we used irradiation here as the paradigm to cause double strand DNA breaks, AOM treatment led to the same extent of IL-22-dependent γH2AX formation (Extended Data Fig. 6g,h). Collectively, our data demonstrate that during the steady-state IL-22 regulates the expression of ATM via STAT3 in colon epithelial stem cells, supervising the initiation of the DDR following genotoxic stress.
Phosphorylation of p53 and SMC (structural maintenance of chromosome) proteins, both direct targets of ATM4,5,18, was reduced in colon epithelial cells of irradiated Il22-/- mice (Extended Data Fig. 7a). Based on our RNA-seq data, expression of various p53 target genes (e.g., p21, Puma, hnRNPK, Susd6, Btg2 and Mdm2)22,23 was diminished in colon stem cells of Il22-/- mice (Fig. 2a,b, Extended Data Fig 5b). In particular, p21, a cell cycle arrest gene, and Puma, a pro-apoptotic gene24 were not efficiently induced in Il22-/- mice following irradiation (Fig. 3a,b, Extended Data Fig. 7b) or AOM treatment (Extended Data Fig. 7c). Increased expression of these genes after DNA damage required IL-22 signaling in epithelial cells as documented in mice with deletion of IL-22Ra1 or STAT3 in all intestinal epithelial cells (Fig. 3b, Extended Data Fig. 7d). Exogenous application of IL-22 rescued Puma levels in colon stem cells depending on IL-22R expression (Fig. 3c).
Figure 3. IL-22 controls DNA damage-induced apoptosis of colon stem cells.

(a-g) Mice were irradiated with 8Gy. (a) Fold induction of p21 and Puma gene expression. (Il22+/+ n=9, Il22-/- n=8, Il22ra1fl/fl;Vil1-Cre n=7, mean±SEM). (b) Densitometric quantification of indicated proteins in primary colon epithelium 24h after irradiation (n=3, mean±SEM). (c) Treatment with IL-22 or PBS prior to irradiation. Fold induction of Puma gene expression (n[Ctrl:Treated], Il22+/+ n=8:4, Il22-/- n=6:5, Il22ra1fl/fl;Vil1-Cre n=2:3, Ahrfl/fl;Rorc(γt)-Cre n=3:5, mean±SEM). (d) Percentage of cCasp-3+ Lgr5+ cells determined by flow cytometry (n=3, mean±SEM, p=0.0092). (e) Percentage of cCasp-3+ crypts (Il22+/+ n=4, Il22-/- n=3, mean±SEM, p=0.0024).
(f,g) Indicated lines were fed for two weeks with tamoxifen diets and subsequently irradiated. (f) Percentage of cCasp-3+ crypts (Il22ra1fl/+ n=27, Il22ra1fl/fl n=29 visual fields, mean±SEM). (g) Representative images 8h after irradiation (arrows indicate apoptotic cells). Scale bar=30μm.
(h) Indicated mice were treated with AOM/DSS and pan-caspase inhibitor (zVAD). Quantification of tumors at day 90 (Il22+/+ n=7, Il22+/++zVAD n=9 Il22-/- n=7, mean±SEM).
(i) Mice were untreated or irradiated with 2Gy. Colon epithelial cells were isolated 48h later. Cells containing one or more micronuclei were quantified (Ctrl n=3, irradiated n=4, mean±SEM).
(j) Mice received three doses of AOM in weekly intervals. Genomic DNA was isolated from colon epithelial cells on day 75. Frequency of three common mutations in exon 3 of the Ctnnb1 gene determined by castPCR (Il22+/+ n=7, Il22-/- n=5, mean, p=0.027).
Data are representative of two (c,f-j), three (b,d,e) or five (a) biologically independent experiments.
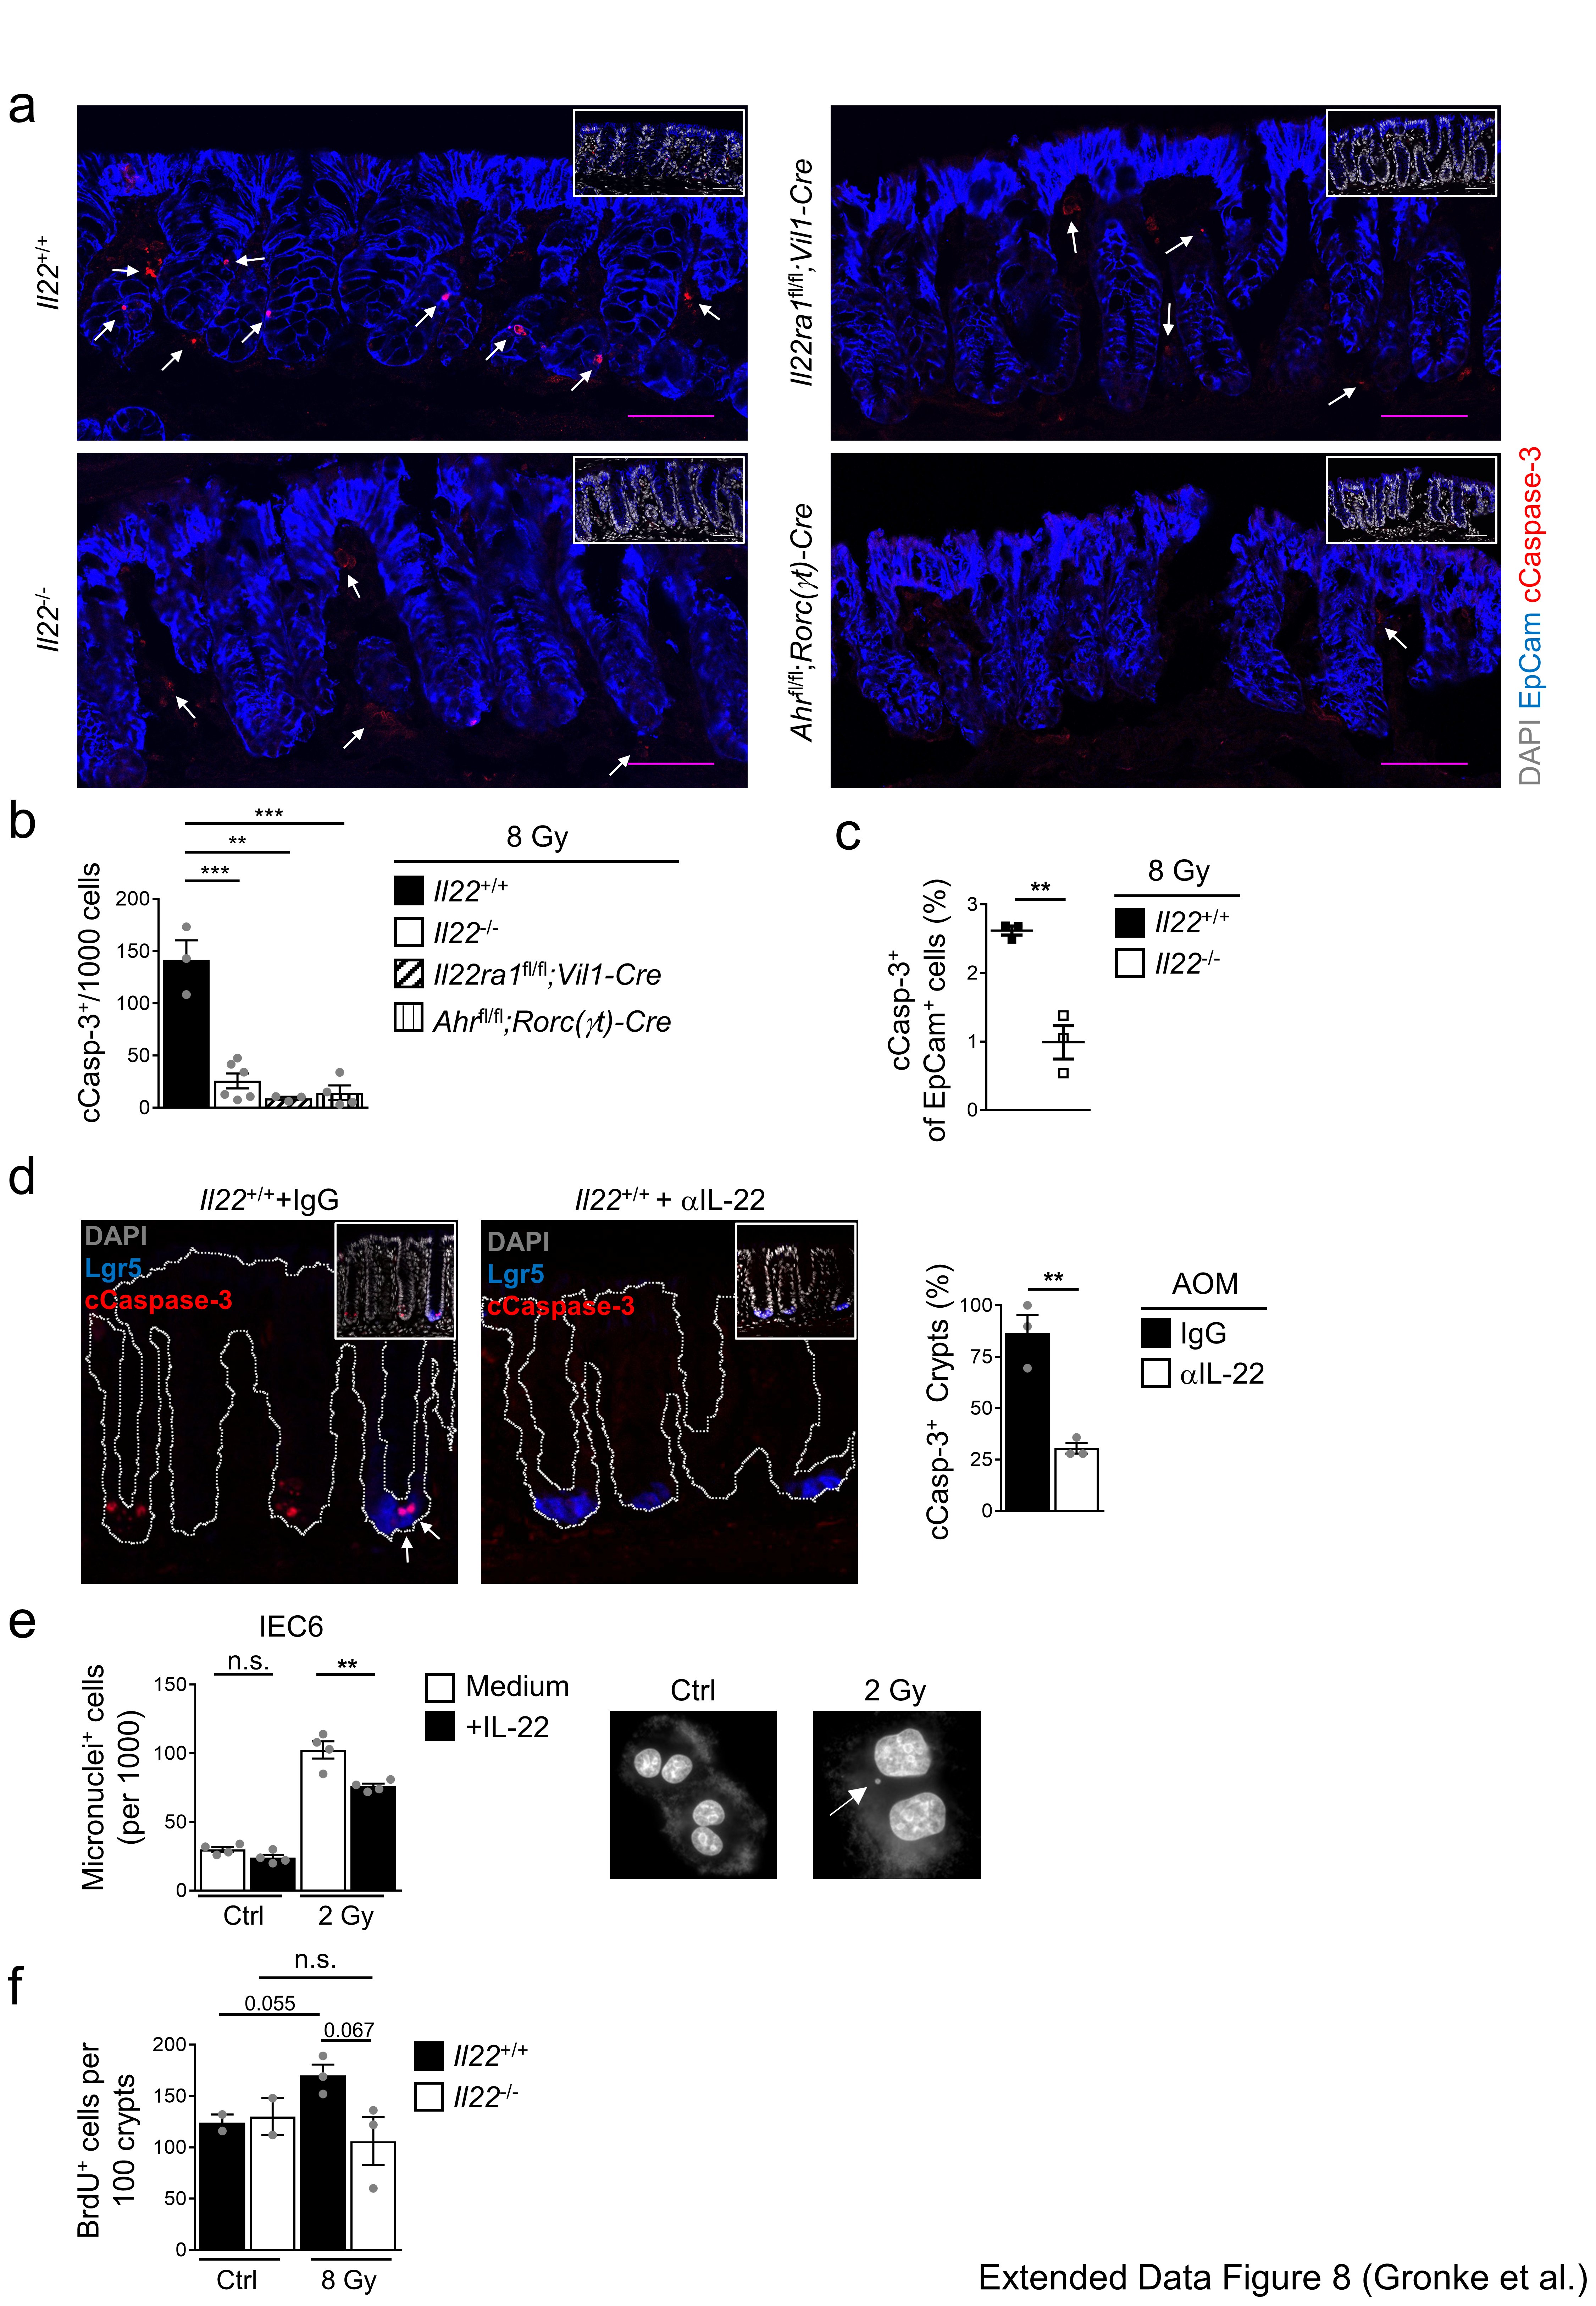
We hypothesized that colon stem cells experiencing DNA damage in the absence of IL-22 signals, do not undergo PUMA-mediated apoptosis or p21-controlled cell cycle arrest. Genetic inactivation of IL-22Ra1 in epithelial cells or antibody-mediated neutralization of IL-22 resulted in a lower fraction of apoptotic (i.e., cleaved (c)Caspase 3+) Lgr5+ stem cells in colon crypts following irradiation (Fig. 3d,e, Extended Data Fig. 7e-g, and 8a-d). Using sporadic inactivation of IL-22Ra1 in colon epithelial stem cells, we found a highly significant reduction of apoptosis in IL-22Ra1-deficient crypts (i.e., Confetti+ crypts) compared to IL-22Ra1-proficient crypts (i.e., Confetti-) within the same mouse (Fig. 3f,g). Inhibition of apoptosis with zVAD, a pan-caspase inhibitor, in Il22+/+ mice led to significantly increased numbers of tumors comparable to Il22-/- mice (Fig. 3h). These data demonstrate that the reduced rate of apoptosis observed after DNA damage in IL-22-deprived colon stem cells may explain the higher number of tumors.
Cells that continue to cycle in the presence of DNA breaks are prone to mitotic defects leading to the formation of micronuclei, a sign of genomic instability. Colonic epithelial cells of irradiated Il22-/- mice showed increased numbers of micronuclei when compared to wildtype controls (Fig. 3i). Conversely, treatment of an intestinal epithelial cell line with IL-22 reduced the numbers of micronuclei after irradiation (Extended Data Fig. 8e). IL-22 has also been described as promoting proliferation of damaged stem cells12 and sustaining proliferation of already transformed cells25. We found an increase in proliferation after DNA damage in Il22+/+ mice which was absent in Il22-/- mice (Extended Data Fig. 8f). The DDR is a powerful cellular program that prevents accumulation of mutations after genotoxic stress. We isolated colon epithelial cells from mice eight weeks after AOM administration and quantified the frequency of exon 3 mutations in the Ctnnb1 gene which are strongly associated with various forms of human cancer including colon cancer9,10. Colon epithelial cells from Il22-/- mice accumulated a much higher frequency of Ctnnb1 mutations than cells from Il22+/+ mice (Fig. 3j). Thus, IL-22, a cytokine produced by lymphocytes, acts as an important, epithelial cell-extrinsic regulator of the DDR in colon stem cells preventing the accumulation of potentially dangerous mutations.
Mutations accumulate in colon stem cells during life, partially due to environmental genotoxic compounds3. Cruciferous vegetables of the Brassicaceae family contain large amounts of a group of phytochemicals referred to as glucosinolates6, some of their metabolites are potent genotoxins26. For example, the glucosinolate metabolite 1-methoxy-3-indolylmethyl alcohol (1-MIM-OH) leads to the formation of DNA adducts and activates the DDR26 (Extended Data Fig. 9a). We applied a single dose of 1-MIM-OH by gavage and monitored the expression of PUMA and p21 (Fig. 4a, Extended Data Fig. 9b), which were induced in colon epithelial stem cells in an IL-22-dependent manner. Indole 3-carbinol (I3C), a glucosinolate metabolite without DNA damaging qualities, did not trigger the DDR (Fig. 4b). Regardless of their DNA-damaging qualities, a single application of 1-MIM-OH or I3C significantly increased the production of IL-22 by ILC3 and γδ T cells but not by CD4+ T cells (Fig. 4c,d and Extended Data Fig. 9c,d). IL-10 production by FoxP3+ T cells was not affected either (Extended Data Fig. 9e). Glucosinolate-induced IL-22 expression enhanced expression of Reg3g, an antimicrobial gene regulated by IL-22 (Extended Data Fig. 9f,g).
Figure 4. Dietary AhR ligands control IL-22 production and the DDR.

(a-d) Mice received either 1-MIM-OH, I3C or Corn Oil (Ctrl) per gavage and were analyzed after 8h. (a,b) Fold induction of p21 and Puma gene expression in colon epithelial cells (Ctrl n=5, Il22-/- n=6, Ahr-/- n=4, mean±SEM). (c,d) Percentage of IL-22+ cells among indicated lymphocyte subsets. ((c) n=8, (d) n=5, mean±SEM).
(e-f) Gene expression in colon epithelial cells (e) of Atm at steady state (Ahrfl/fl n=11, Ahrfl/fl;Rorc(γt)-Cre n=8, mean±SEM, p<0.0001) (f) of p21 and Puma after 24h (Ahrfl/fl n=7, Ahrfl/fl;Rorc(γt)-Cre n=5, mean±SEM).
(g-k) Mice were fed 6 weeks with the indicated diets. (g) Percentage of IL-22+ cells among indicated lymphocyte subsets (n=5, mean±SEM). (h) Atm gene expression in colon epithelial cells at steady-state. (CD n=5, EDD- n=6, EDD+ n=7, mean±SEM). (i-k) Diet-treated mice were irradiated with 8 Gy. Quantification of γH2AX+ EpCam+ (i) and cCasp-3+ EpCam+ cells (k) 8h after irradiation (n=5, mean±SEM). (j) Fold induction of p21 and Puma gene expression in colon epithelial cells after 24h (n=7, mean±SEM).
Data are representative of two (a-d and i-k) and three (e-h) biologically independent experiments.
The increase of IL-22 production in response to 1-MIM-OH or I3C required AhR expression in ILC3 and T cells (Extended Data Fig. 9h)27–29. Mice genetically lacking AhR in ILC3 and T cells had a phenotype comparable to IL-22-deficient mice with reduced expression of ATM (Fig. 4e), and, following genotoxic stress, with diminished phosphorylation of H2AX (Fig. 2e,f, Extended Data Fig. 6d), absent induction of p21 and PUMA expression (Fig. 4f) and reduced apoptosis of crypt-resident stem cells (Extended Data Fig. 8a,b). Importantly, IL-22 application to Ahrfl/fl;Rorc(γt)-CreTg mice restored PUMA expression (Fig. 3c).
We wondered whether glucosinolate-deprived diets would be disadvantageous to the host to deal with consecutive genotoxic stress. We fed adult mice, either with an experimental defined diet (EDD) that lacks phytochemicals (including glucosinolates; EDD-) or with a defined diet supplemented with I3C, EDD+ (Extended Data Fig 9b). Normal mouse chow, naturally containing bioactive concentrations of AhR ligands, served as control diet (CD). Colon ILC3 and γδ T cells from mice on EDD- did not produce IL-22, whereas they produced high levels of IL-22 when mice were fed EDD+ or CD (Fig. 4g and Extended Data Fig. 10a,b). Epithelial cells from mice on EDD- showed reduced expression of ATM (Fig. 4h), and, following DNA damage, a profound reduction in γH2AX (Fig. 4i, Extended Data Fig. 10c), in induction of p21 and Puma expression (Fig. 4j) and in apoptosis observed in colon crypts (Fig. 4k, Extended Data Fig. 10d). Importantly, I3C addition to the diet restored all of these functions. Thus, AhR-mediated regulation of IL-22 provided a substantial barrier against DNA damaging agents as part of our diets.
Collectively, we uncovered a novel homeostatic control circuit by which IL-22-producing and tissue-resident innate lymphocytes regulate the response of epithelial stem cells to genotoxic dietary compounds at border surfaces with the environment, thereby effectively limiting the number of mutations (Extended Data Fig. 10e). The AhR expressed by ILC3 and γδ T cells serves as a “sensor” of genotoxic phytochemicals for on-demand production of IL-22 supervising the DDR machinery in epithelial stem cells. The AhR may turn out to be an important node for cancer development as AhR signaling within epithelial cells was recently shown to reduce colon cancer development30. Finally, we expect such communication between innate lymphocytes and their tissue client cells to be operative at other border surfaces which may be exploited as an adjunctive therapy to avoid genotoxic sequelae associated with various forms of clinical therapy such as chemotherapy, radiation therapy and bone marrow transplantation.
Methods (online only)
Mice
Conventional (specific pathogen-free) C57BL/6N mice were purchased from Janvier Laboratories. Lgr5EGFP-IRES-CreERt2/+ (here referred to as Lgr5CreERt2/+ or Lgr5Egfp/+ mice)15, Rosa26R-Confetti16 and Rorc(γt)-CreTg mice31 were purchased from Jackson Laboratories and crossed in our animal facility. Il22-/- mice were a kind gift of Jean-Christophe Renauld and Laure Dumoutier (Ludwig Institute for Cancer Research, Brussels, Belgium)32. Mice with a floxed Stat3 allele33 were kindly provided by Veronika Sexl (University of Veterinary Medicine Vienna) with permission of Valeria Poli (Universita di Torino, Torino, Italy). Villin1-CreTg mice34 were kindly provided by Marc Stemmler (Max-Planck-Institute of Immunobiology & Epigenetics, Freiburg, Germany) with permission of Sylvie Robine (Institute Curie, Paris, France). Mice with an IEC-specific deletion of Stat3 (Stat3fl/fl;Vil1-Cre) were generated by breeding Stat3fl/fl mice with Villin1-CreTg mice. Il22ra1fl/fl;Vil1-Cre mice were generated by crossing of Il22ra1fl/fl mice to Villin1-CreTg mice. Ahr-/- mice35 and Ahrfl/fl mice36 were kindly provided by Charlotte Esser (Leibniz Research Institute for Environmental Medicine, Düsseldorf, Germany). Ahrfl/fl;Rorc(γt)-Cre mice were obtained by crossing Ahrfl/fl mice with Rorc(γt)-CreTg mice27. To identify Lgr5+ stem cells, we backcrossed Il22+/+ and Il22-/- mice to Lgr5EGFP-IRES-CreERt2/+ mice (referred to as Il22-/-; Lgr5Egfp/+ mice or Il22+/+; Lgr5Egfp/+ mice). Mice were 8 to 10 weeks of age, unless indicated otherwise. Cohoused littermates were used as controls whenever possible. Animals were housed in accordance with the guidelines by the Federation for Laboratory Animal Science Associations and the national animal welfare body Gesellschaft für Versuchstierkunde. Experiments were in compliance with the German animal protection law (TierSchG) and were approved by the local animal care committee (G15-1-034, Landesuntersuchungsamt Rheinland-Pfalz, Koblenz).
Generation of Il22ra1fl/fl mice
Il22ra1fl/fl mice were generated using EUCOMM ES cells subclone JM8.N4 (Il22ra1tm1a(EUCOMM)Wtsi)37. In brief, a floxed Il22ra1 allele was created by inserting an FRT-flanked IRES-LacZ-Neo resistance cassette into intron 1 of the Il22ra1 gene. LoxP sites were inserted to flank exon 2 (Extended Data Fig. 2a-g). After germ-line transmission, the FRT cassette was removed by crossing to FLPe deleter mice38. For inactivation of the Il22ra1 allele in intestinal stem cells, Il22ra1fl/fl;Lgr5CreERt2/+;Rosa26R-Confetti mice were fed for two weeks with diets containing 400 mg/kg tamoxifen citrate (Envigo). Tamoxifen was stopped seven days before tumor induction.
DNA damage
Acute DNA damage was induced by i.p. injection of 25 mg/kg (body weight) azoxymethane (AOM) or by exposure of cells or mice to a 137Caesium (Cs) source in an OB58/905-2 irradiator (Buchler, Germany). For acute DNA damage, mice were exposed to 8Gy of irradiation if not indicated otherwise. For the analysis of IL-22 production, mice were injected with 25mg/kg (body weight) AOM and lamina propria lymphocytes were analysed 24h later.
IL-22 neutralization and reconstitution
Monoclonal anti-IL-22 (Clone 8E11) blocking antibody was kindly provided by Genentech (South San Francisco, USA). Anti-IL-22 (150μg/mouse) or control IgG were injected 36h, 12h before and 12h after inducing DNA damage. For reconstitution, mice were injected with recombinant IL-22 (400ng/mouse, Peprotech) i.p. every 8h for three days prior to the damage induction and at 8h and 16h afterwards. Epithelial cells were isolated 24h after damage. For the stimulation of ATM expression, mice were injected with recombinant IL-22 (500 ng/mouse, Peprotech) i.p. 12h and 2h prior to epithelial isolation.
Colitis-associated cancer
Mice of various genotypes were co-housed and injected with 10mg/kg body weight azoxymethane (AOM, Sigma-Aldrich) i.p. on day 1. Starting from day 7, mice were given 2% Dextrane Sulfate Sodium (DSS) in the drinking water for 7 days. The weight of the mice was monitored weekly. The approved experimental procedures limited maximal colorectal tumor burden to a 20% decrease in body weight. None of the experimental animals reached this threshold. Tumor formation was assessed starting from day 80 after AOM treatment. For AOM-only induced cancer, mice were injected three times in weekly intervals with 10mg/kg AOM i.p.. No DSS was given in the drinking water and tumor formation was assessed 4 months after the first AOM application. For the blockade of apoptosis, a pan-Caspase inhibitor zVAD-FMK (Invivogen) was injected at 2mg/kg i.p. daily on day 0 - day 5, with AOM being injected on day 1. Tumor formation was assessed on day 90.
Epithelial cell isolation and quantitative PCR
The colon, including the anorectal section, was opened longitudinally and cleaned from feces and fat tissue. Epithelial cells were harvested by incubating the tissue for 45 min in Hank’s Balanced Salt Solution (HBSS) supplemented with 5 mM EDTA and 10 mM HEPES at 37 °C. Cells were pelleted and resuspended in 500 μl Trizol (Life Technologies) and macerated using MP FastPrep-24 (MP Biomedicals). RNA was extracted according to the ImmGen protocol (https://www.immgen.org/Protocols/Total%20RNA%20Extraction%20with%20Trizol.pdf) and cDNA was transcribed using High Capacity cDNA Reverse Transcription Kit (Applied Biosystems). Quantitative PCR was performed using qPCR SYBR Green Master Mix (Applied Biosystems) on a 7900HT Fast Real-Time PCR System (Applied Biosystems). Primer sequences are in Supplementary Information Table 1.
Lamina propria lymphocyte isolation
Lamina propria lymphocytes were isolated as described previously39. In brief, small intestine or colon was removed and cleaned from feces and fat tissue. Peyer’s patches were removed and epithelial tissue was dissociated by incubation in HBSS supplemented with 5mM EDTA and 10mM HEPES at 37°C. Tissue was minced and subsequently digested in HBSS containing Dispase (5U/ml; BD Biosciences), collagenase D (0.5mg/ml; Roche) and DNaseA (0.5mg/ml; Sigma-Aldrich) and 3% FCS for 1h at 37°C. Lymphocytes were enriched using an 80/40 Percoll gradient (Sigma-Aldrich). For cytokine staining, cells were resuspended in RPMI medium with 10% FCS, 80μM 2-mercaptoethanol, 10mM HEPES, 1mM sodium pyruvate, non-essential amino acids (Gibco), 100units/ml penicillin, 0.4mg/ml gentamicin and 100mg/ml streptomycin and 8mg/ml glutamine and stimulated for 4h at 37°C in the presence of brefeldin A (Sigma-Aldrich), IL-1β (10ng/mL, Peprotech) and IL-23 (20ng/mL, Thermo Fisher) or for IL-10 production with PMA (25ng/mL, Sigma-Aldrich) and ionomycin (500ng/mL, Sigma-Aldrich). Cells were fixed with FoxP3 fixation/permeabilization kit (eBioscience) overnight and stained with fluorochrome coupled antibodies for 2h at 4°C. Cells were washed and analyzed on a FACS Canto II flow cytometer (BD Biosciences)40. Data was analyzed using FlowJo Software V10.3 (Treestar). All antibodies used are listed in Supplementary Information Table 2.
Histology
Colon was opened longitudinally and cleaned from feces and fat tissue. “Swiss rolls” were prepared by winding the tissue on a wooden toothpick and tissue was fixed for 2h in 4% paraformaldehyde at 4°C. The tissue was washed and incubated overnight in 30% sucrose in phosphate buffer. Rolls were frozen in O.C.T. Tissue Tek (Sakura) and stored at -80°C. For analysis, 6μm sections were cut using a CM1950 Cryotome (Leica). Sections were dried, rehydrated and blocked for 1h with 10% bovine serum albumin (BSA). Primary antibodies specific for cleaved Caspase-3 (Asp175; 5A1E; Cell Signaling Technology), IL-22ra1 (496514, Thermo Fisher) and γH2AX (20E3; Cell Signaling Technology) in 0.1% Triton X-100 in PBS were incubated overnight at 4°C. Secondary (α-rabbit-Alexa555, α-rabbit-APC, α-rat-Alexa647; Life Technologies) and directly conjugated antibodies (α-EpCam-APC; eBioscience) were incubated 1h at room temperature. Slides were mounted using PermaFluor Aqueous Mounting Medium (Thermo Scientific) and imaged on an AF7000 or a TCS SP5 microscope (Leica). Image analysis was done using ImageJ analysis software41. For quantification of cleaved Caspase-3 and γH2AX, whole colon sections were filtered for EpCam-positive cells and within these, marker-positive cells were counted. Positive cells were normalized to the total amount of epithelial cells (i.e., DAPI+ EpCam+ cells).
RNA-seq analysis of Lgr5+ colon stem cells
The colon, including the anorectal section, was removed, opened longitudinally and cleaned from feces and fat tissue. Epithelial cells were harvested by incubating the tissue for 45min in HBSS supplemented with 5mM EDTA and 10mM HEPES at 37°C. Supernatant was collected, pelleted and afterwards digested for 30min at 37°C in HBSS containing 3% FCS, Dispase (5U/ml; BD Biosciences), collagenase D (0.5mg/ml; Roche) and DNaseA (0.5mg/ml; Sigma-Aldrich). For flow cytometry analysis, cells were stained in PBS containing 2% FCS. Colon stem cells were identified as DAPI- EpCam+ CD45- CD24int Lgr5+ cells (Extended Data Fig. 5a), were highly purified using a FACS Aria III Cell Sorter (BD Biosciences) and taken up in Trizol (Life Technologies). RNA was extracted, and libraries were prepared with SMARTer Ultra Low Input RNA (Clontech), according to the manufacturer’s instructions. Material was enriched for polyA sequences and Next Generation Single-end sequencing was done on a HiSeq 2500 machine (Illumina) with a maximal readlength of 50 bases. Bioinformatic processing was performed using the Cufflinks pipeline42. Fragments Per Kilobase Million (FPKM) values were used for transcriptional comparison. Computational processing was done using RStudio Software (The R Foundation). Genes without any mappable reads were excluded from the analysis. Gene Set Enrichment Analysis (GSEA) was done with Broad Institute GSEA Software43. Genesets were taken from MSigDB. The “DNA Damage Response Effector Genes” geneset was created from the literature4 (Extended Data Fig. 5e). Full lists of Gene Sets with expression heatmaps can be found in Supplementary Information Table 3.
Western blot analysis
Epithelial cells were harvested as described above. Cells were lysed using NP-40 lysis buffer (20 mM TRIS-HCl, 150 mM NaCl, 1% Triton X-100, 0.5% NP-40, Protease & Phosphatase Inhibitor w/o EDTA; Thermo Fisher) for 1h on ice and additionally sonicated for 3 cycles using Bioruptor Plus (Diagenode). SDS-PAGE was performed with gels containing 5% or 10% polyacrylamide and blotted 16h with 40mA on a PVDF membrane (Carl Roth). Detection antibodies p21 (F5; Santa Cruz), PUMA, p-p53 (all Abcam), Actin (AC15; Sigma-Aldrich), p-SMC (D7S8Y), mouse ATM (D2E2), SMC (8E6), γH2AX (D17A3) (all Cell Signaling Technology) were diluted in 5% BSA and incubated overnight at 4°C. Secondary antibodies were coupled to HRP (α-mouse-HRP, α-rabbit-HRP; Jackson Immuno Research) and visualized using enhanced chemiluminescence (PerkinElmer) and Hyperfilm (GE Healthcare). All antibodies used are listed in Supplementary Information Table 2.
STAT3 ChIP
Mice were injected 1 μg recombinant IL-22 (Peprotech) or PBS i.p. 1h prior to epithelial cell isolation. Epithelial cells were isolated as described above. Cells were resuspended in PBS and fixed with 0.75% paraformaldehyde. Fixation was stopped with glycine and cells were washed and lysed in 50mM Tris, 2.5mM EDTA, 0.1% NP-40 and 10 % Glycerol. Nuclei were lysed in 50mM Tris, 5mM EDTA and 0.25% SDS and subsequently sonicated in a Bioruptor Plus (Diagenode). Lysates were cleared by centrifugation and stored at -80°C. Protein-A-coated magnetic beads (Diagenode) were blocked with yeast tRNA (Life Technologies) and BSA (New England Biolab). Nuclear lysates were split in 10% input and 90% immunoprecipitation solutions. The latter was incubated with α-STAT3 (C-20; Santa Cruz Biotechnology) overnight rotating at 4°C. Protein-A coded magnetic beads were added and incubated for another 30min rotating at 4°C. Beads were purified and washed repeatedly. Bound DNA was eluted in 10mM TRIS, 1 mM EDTA and 2% SDS at 37°C for 15min. De-crosslinking was performed overnight at 65°C. RNA was removed by 1h incubation with RNAse A (Peqlab) at 37°C, followed by 1h incubation with Proteinase K (Peqlab) at 42°C. DNA was purified using PCR Purification Kit (Qiagen) according to the manufacturer’s instructions. All antibodies used are listed in Supplementary Information Table 2.
Micronucleus Assay
IEC6 cells44 were cultured for 48h in DMEM (Life Technologies) with 10% FCS, 80μM 2-mercaptoethanol, 10mM HEPES, 1mM sodium pyruvate, non-essential amino acids (Gibco), 100units/ml penicillin, 0.4mg/ml gentamicin and 100mg/ml streptomycin and 8mg/ml glutamine and 0.1U/ml insulin (Sigma-Adrich), with or without 100ng/mL IL-22 (Peprotech). After culturing cells in the presence of IL-22 for three days, cells were irradiated with 2Gy. Afterwards they were cultured for another 48h in the presence of cytochalasin B (4.5μg/ml, Sigma-Aldrich) to stop cytokinesis. Nuclei of cells that had undergone division, and the occurrence of micronuclei within these cells, were counted under a fluorescent microscope. Between 500 and 1000 Nuclei per replicate were analysed. For analysis of primary epithelium ex vivo, mice were irradiated with 2Gy and epithelial cells were isolated by EDTA-based dissociation as described above. For micronucleus assessment cells were settled on glass slides and fixed for 2min in ice-cold methanol. DNA was stained with DAPI (Sigma-Aldrich) and images were acquired on an Axiovert 200M microscope (Zeiss).
Ctnnb1 Mutations
Mice were co-housed and injected 10mg/kg body weight azoxymethane (Sigma-Aldrich) i.p. on day 1, day 8 and day 15. Mice were sacrificed on day 75, when no macroscopic tumor development could be observed. Epithelial cells from the colon were isolated as described above and genomic DNA was extracted using QIAamp Fast DNA Tissue Kit (Qiagen) according to the manufacturer’s instructions. Competitive Allele-Specific TaqMan (cast) PCR (Thermo Fisher) was used to detect single basepair mutations in the Ctnnb1 gene. AOM-induced mutations were derived from the literature45 and compared to OMIM database to find conserved mutations and high frequency targets were chosen (CTNNB1_5676_mu, b.C122I, p.T41I; CTNNB1_5671_mu, b.G101A, p.G34E; CTNNB1_5672_mu, b.G94A p.D32N). For reference quantification of total Ctnnb1 gene expression, quantitative RT-PCR was performed as described above. TaqMan PCR was carried out according to the manufacturer’s instructions (Thermo Fisher).
Mouse diets
Mice were generally fed ad libitum with standard grain-based rodent diet (R/M-H Extrudat, sniff). This diet is also referred to as control diet (CD) during the experiments with defined diets. To analyze the impact of dietary glucosinolates, mice were switched to an experimental defined diet at the age of 6 weeks and fed with this diet for 6 weeks when the analyses were performed. The defined diet (EDD-) (EF/RM low chlorophyll; sniff) is devoid of any plant-derived phytochemicals and is regularly tested to be free of chlorophyll, flavonoids and glucosinolates. The defined diet was supplemented with 2g/kg indole-3-carbinol (EDD+) (I3C, Sigma-Aldrich). All diets contained the same amount of metabolizable energy and equivalent compositions of proteins, carbohydrates, fat, trace elements, minerals and vitamins27.
Treatment with AhR ligands
1-methoxy-3-indolylmethyl alcohol (1-MIM-OH, synthesized as described elsewhere26) and I3C were dissolved in corn oil (Sigma-Aldrich) and gavaged at a concentration of 106mg/kg body weight. After the indicated timepoints, mice were sacrificed and small intestine and colon were processed, as described above. Caecum was removed, cleaned and snap frozen in liquid nitrogen. Tissue was later homogenized and genomic DNA was extracted using QIAamp Fast DNA Tissue Kit (Qiagen) according to the manufacturer’s instructions.
DNA adduct analysis
Caecal tissue was harvested as described before and genomic DNA was extracted using QIAamp Fast DNA Tissue Kit (Qiagen) according to the manufacturer’s instructions. 25μg of isolated DNA were spiked with stable isotopically labeled adduct standards and hydrolyzed to 2’-deoxynucleosides (dN) according to our optimized protocol46. After analyte enrichment by C18 solid phase extraction, the predominant DNA adducts after 1-MIM-OH exposure, namely N2-(1-MIM)-dG and N6-(1-MIM)-dA, were analyzed by isotope-dilution liquid chromatography tandem-mass spectrometry (LC-MS/MS) as described previously47 using an Agilent 1260 Infinity LC system coupled to an Agilent 6490 triple quadrupole-mass spectrometer (Agilent Technologies) interfaced with an electrospray ion source operating in the positive ion mode (ESI+). Further, in the DNA hydrolyzate prior to sample purification, we analyzed the amounts of dC and 5mdC (5-methyl-2’-deoxycytidine) by isotope-dilution LC-MS/MS as recently published48. We calculated the amount of DNA that was actually used for the adduct analysis knowing that dC (in fact the sum of dC and 5mdC) accounts for 21% of the total dN in the mouse genome.
Statistical Analysis
p-value of data sets was determined by unpaired two-tailed Student’s t-test with 95% confidence interval. Normal distribution was assumed. All statistical tests were performed with Graph Pad Prism V7 software. (*p ≤ 0.05, **p ≤ 0.01, and ***p ≤ 0.001; n.s., not significant). All plots are shown as mean ± SEM.
Extended Data
Extended Data Figure 1. Increased inflammation in Il22-/- mice during AOM/DSS carcinogenesis.

(a-f) Mice were given one dose of AOM i.p. followed by one week of 2% DSS in drinking water. (a) Tumor development in Il22+/+ and Il22-/- mice. Scale bar=1cm. Tumor number (b) (Il22+/+ n=9, Il22-/- n=8, mean±SEM; p=0.022) and regional distribution of tumors (c) (Il22+/+n=7, Il22-/-n=10, mean±SEM; pRectum=0.0007, pTotal=0.0078). (d) Body weight as percent of initial weight (Il22+/+ n=7, Il22-/- n=10, mean±SEM). (e) Expression of the indicated inflammatory and tumor-promoting genes (n=4-6, mean±SEM) in colonic mucosa was assessed by qRT-PCR two days after DSS treatment was stopped. (f) Expression of the indicated genes was analyzed by qRT-PCR within tumors (n=3-9, mean±SEM).
(g) Schematic representation of the CAC treatment regimen in mice with sporadic inactivation of the Il22ra1 gene (Il22ra1fl/fl;Lgr5CreERt2/+;R26R-Confetti and Il22ra1fl/+;Lgr5CreERt2/+;R26R-Confetti).
Data are representative of two biologically independent experiments.
Extended Data Figure 2. Generation and validation of Il22ra1flox mice.

(a) Schematic representation of the Il22ra1tm1a(EUCOMM)Wtsi allele in targeted ES cells. The position of PCR primers and Southern blot probes is indicated.
(b) Verification of construct integration into JM8.N4 ES cells by genomic PCR. DNA from untargeted ES cells (Bruce4) served as a control.
(c) Southern blot after BamHI digestion confirming the correct integration of the construct, which introduced a novel BamHI recognition site into the genomic DNA.
(d) Germline transmission was assessed by genomic PCR in the F1 generation.
(e) LacZ reporter activity was assessed in F1 mice.
(f) Gene expression of the IL-22Ra1 binding partners in colonic epithelial cells of the indicated mouse strains was assessed by qRT-PCR (Il22+/+ n=5, Il22-/- n=4, Il22ra1fl/fl;Vil1-Cre n=4, Ahrfl/fl;Rorc(γt)-Cre n=3, mean±SEM).
(g) Representative immunofluorescence images of IL-22Ra1 (red) in colonic epithelial cells. Scale bar=50 μm.
(h-i) Il22ra1fl/fl;Lgr5CreERt2/+;R26R-Confetti or Il22ra1fl/+;Lgr5CreERt2/+;R26R-Confetti mice were fed with a tamoxifen-containing diet for two weeks. (h) Labeling efficiency (%) of colon crypts at different time points after stopping the tamoxifen treatment (Il22ra1fl/fl: Il22ra1fl/+; day1 n=8:10; day7 n=7:8; day14 n=7:7 visual fields, mean±SEM). (i) Fraction (%) of Confetti+ crypts (mean) with one, two or three colors.
(j) The indicated mouse strains were fed with tamoxifen-containing diets and subjected to AOM/DSS treatment as indicated. Body weight as percent of initial weight (Il22ra1fl/+ n=6, Il22ra1fl/fl n=10, mean±SEM).
Data are representative of two (f-j) biologically independent experiments.
Extended Data Figure 3. IL-22Ra1 expression in tumors from Il22ra1fl/fl;Lgr5CreERt2/+;R26R-Confetti mice.

(a-d) Representative immunofluorescence images for IL-22Ra1 expression (violet) by Confetti-negative (a,c) and Confetti-positive (b,d) colon tumors from Il22ra1fl/+;Lgr5CreERt2/+;R26R-Confetti (a,b) and Il22ra1fl/fl;Lgr5CreERt2/+;R26R-Confetti (c,d) mice.
(e) Mean Fluorescence Intensity (MFI) of IL-22Ra1 fluorescende across tumor area of the indicated mouse strains with and without prior Cre-activation (n=7; except Il22ra1fl/fl Confetti-negative n=8, mean±SEM).
Extended Data Figure 4. Identification of IL-22-producing lymphocytes.

(a-c) Mice of the indicated genotypes or strains were injected with AOM or PBS (Ctrl). 24h later, IL-22+ cells among the indicated lymphocyte subsets and absolute numbers of IL-22+ cells were determined. (a) Colon C57BL/6 mice (n=6, mean±SEM, p=0.0154), (b) small intestine C57BL/6 (n=6, mean±SEM). (c) Colon (n=2, mean±SEM).
Data are representative of two (a-c) biologically independent experiments.
Extended Data Figure 5. Initiation of the DDR is impaired in Il22-/- mice.

(a-c) Il22+/+;Lgr5Egfp and Il22-/-;Lgr5Egfp mice (n=3 each) were irradiated with 8 Gy (“DNA damage”) or left untreated (“steady-state”). Lgr5 (GFP)+ colon epithelial stem cells were highly purified and gene expression was analyzed by RNA-seq. (a) Sorting strategy for colonic Lgr5+ stem cells. Stem cells were highly purified (>98%) for RNA-seq analysis. (b) Modified Venn diagram. All expressed genes with FC>2 were extracted and plotted. Bottom half represents genes differentially expressed between Il22+/+ and Il22-/- mice at the steady-state. “Core expression” contains all genes with detectable transcripts that were not differentially expressed. Upper half depicts genes differentially expressed 24h after irradiation in comparison to untreated mice. Of these, 596 genes differed in both genotypes, whereas 638 genes were only regulated in stem cells of Il22+/+ mice and 392 in Il22-/- mice. (c) Gene set enrichment analysis (GSEA) was performed on all expressed transcripts represented in Lgr5+ colon stem cells from Il22+/+ (n=3) and Il22-/- (n=3) mice at the steady-state. Nominal p-value (Kolmogorov-Smirnov) was calculated for GO_DNA_Double_Strand_Break_Processing (p=0.01).
(d) Mice were were irradiated with 8 Gy. Expression (n=3, mean±SEM) of DDR effector genes p21 and Puma in colonic epithelial cells was determined by qRT-PCR at the indicated timepoints after irradiation.
(e) List of genes included in the GSEA gene set “DDR_Effector_Genes” (Fig. 2b)4.
(f) Mice were irradiated with 8 Gy. Il22bp (Il22ra2) gene expression in lamina propria cells or colon epithelial cells was determined by qRT-PCR at the indicated timepoints (n=3, mean±SEM).
(g,h) Expression of the indicated genes in colon epithelial cells was determined by qRT-PCR at steady-state. (g) MRN-complex genes (Il22+/+ n=7, Il22-/- n=6, mean±SEM) (h) DDR transducer genes (Il22+/+ n=10, except Atmin n=7 and Parp1 n=5, Il22-/- n=7, except Atmin n=4 and Parp1 n=5, mean±SEM).
Extended Data Figure 6. IL-22 regulates ATM expression and formation of γH2AX.

(a) Immunoblot analysis of ATM from colon epithelial cells. Densitometric quantification of signal intensity normalized to loading controls (n=3, mean±SEM; p=0.004).
(b) Schematic representation of STAT3 binding sites in the Atm gene locus.
(c) STAT3 ChIP was performed to determine specific pulldown at the transcription factor binding sites (Start, Mid, End) in the promoter regions of the Atm gene and at a control site within the Stat3 gene (Cold). Genomic DNA from colon epithelial cells of Il22+/+ and Il22-/- mice before and after in vivo stimulation with recombinant IL-22. Results represent specific pull down relative to a DNA input sample (Start n=14, Mid n=7, End n=12, Cold n=8, mean±SEM).
(d,e) Mice of the indicated genotypes were irradiated with 8 Gy. (d) Immunofluorescence analysis of γH2AX (red) and of EpCam (blue) of the entire colon was performed 8h after irradiation. Scale bar=500μm. (e) Quantification (Ctrl, 4h and 24h n=2, 8h n=3, mean±SEM) of γH2AX+ nuclei per colon before and at the indicated timepoints after irradiation.
(f) Immunoblot analysis of H2AX protein and densitometric quantification of signal intensity (normalized to loading controls) in primary colon epithelial cells of Il22+/+ and Il22-/- mice (mean±SEM, n=2).
(g,h) Mice were irradiated with 8 Gy or injected with AOM i.p. Immunofluorescence analysis of colon sections was performed 8h after damage. Quantification (g) (n=3, mean±SEM) of γH2AX+ EpCam+cells and representative immunofluorescence images (h) after γH2AX (red) and EpCam (blue) staining. Scale bar=25μm.
Extended Data Figure 7. Impairment of p53 activation and DDR effector genes in Il22-/- mice.

(a-g) Mice were irradiated with 8 Gy or injected with AOM. (a,b) Immunoblot analysis of the indicated proteins from primary colon epithelial cells 24h after irradiation. Densitometric quantification of signal intensity (mean±SEM, n=2). p-p53 and Actin, p-SMC and SMC, PUMA and Actin, and p21 immunoblots were derived from one gel each. Normalization was done to loading (p-p53, PUMA) or sample processing (p-SMC, SMC, p21) controls. (c,d) Fold induction of p21 and Puma gene expression in colon epithelial cells 24h after irradiation or AOM treatment was determined by qRT-PCR (AOM n=10, 8 Gy n=5, Stat3fl/fl n=4, Stat3fl/fl;Vil1-Cre n=5, mean±SEM). (e) Apoptosis (red: cleaved (c)Caspase-3) in Lgr5+ (blue) colon stem cells (arrows). Representative immunofluorescence images 8h after irradiation. (f,g) Quantification of cleaved Caspase-3+ EpCam+ colonic epithelial cells 8h after treatment with AOM or 8 Gy (f) (n=3, mean±SEM) and representative immunofluorescence images (g) (cleaved Caspase-3, red and EpCam, blue). Scale bar=25μm
Data are representative of two (d-g) or three (a-c) biologically independent experiments
Extended Data Figure 8. Impairment of DDR-triggered apoptosis in Il22-/- mice.

(a-c) Mice of the indicated genotypes were irradiated with 8 Gy and analyzed 8h later. (a) Immunofluorescence for cleaved Caspase-3 (red) and EpCam (blue). Scale bar=50μm. Quantification of cCasp-3+ cells by histology (b) (Il22+/+ n=3, Il22-/- n=6, Il22ra1fl/fl;Vil1-Cre n=3, Ahrfl/fl;Rorc(γt)-Cre n=4, mean±SEM) or by flow cytometry (c) (n=3, mean±SEM, p=0.003).
(d) IL-22 neutralizing antibody or control IgG was injected i.p. 36h, 12h before and 12h after AOM application. Representative immunofluorescence images of the colon 24h after AOM treatment stained for Lgr5 (blue) and cleaved Caspase-3 (red; arrows indicate apoptotic stem cells). Quantification of cCasp-3+ crypts (n=3, mean±SEM, p=0.0039).
(e) IL-22-responsive IEC6 cells were cultured with or without recombinant IL-22. Cells were irradiated with 2 Gy or left untreated and cultured in the presence of cytochalasin B. DNA was visualized with DAPI 48h after irradiation. Number of cells containing one or more micronuclei (n=4, mean±SEM). Representative images of untreated (Ctrl) or irradiated (2 Gy) IEC6 cells. Arrow illustrates a micronucleus.
(f) Mice of the indicated genotypes were irradiated with 8 Gy. Quantification of BrdU+ cells in colonic crypts. (n=3, mean±SEM)
Data are representative of two biologically independent experiments
Extended Data Figure 9. Dietary AhR-ligands promote IL-22 production.

(a) Wildtype mice were given 1-MIM-OH or carrier control (Ctrl) by gavage. Quantification of DNA adducts at the indicated time points (Ctrl 4h n=2, Ctrl 8h n=4, Ctrl 24h n=2, 1-MIM-OH 4h n=4, 1-MIM-OH 8h n=8, 1-MIM-OH 24h n=6, mean±SEM).
(b) Schematic representation of the different treatment regimens.
(c-g) Mice of the indicated genotypes were exposed to 1-MIM-OH (c,f) or I3C (d,e,g) by gavage and analyzed 8h later. (c,d) Representative flow cytometry analysis of IL-22 production by the indicated lymphocyte populations after gavage with 1-MIM-OH or I3C. CD4+ T cells were defined as CD45+ lineage marker (Lin)+ CD4+ cells, ILC3 as CD45+ Lin- RORγt+ cells, and γδ T cells as CD45+ Lin+ γδTCR+ cells. Numbers indicate percent of cells in gate. (e) Representative flow cytometry analysis and quantification of IL-22 and IL-10 production by Lin+ CD4+FoxP3+ T regulatory cells 8h after gavage with I3C (Ctrl n=4, I3C n=4, mean±SEM). (f,g) Expression of the IL-22 response gene Reg3g in primary colon epithelial cells was determined by qRT-PCR 8h after gavage with 1-MIM-OH (Ctrl:1-MIM-OH, Il22+/+ n=5:4, Il22-/- n=3:6, mean±SEM) or I3C (n=5, mean±SEM).
(h) Percentage of IL-22+ cells among the indicated lymphocyte subsets 8h after 1-MIM-OH treatment of Ahr-/- mice (Ctrl n=3, 1-MIM-OH n=4, mean±SEM).
(i) Numbers of IL-22+ ILC3 at different time points after 1-MIM-OH gavage (Ctrl n=2, 1-MIM-OH n=4, 1-MIM-OH 24h n=6, mean±SEM).
Data are representative of two biologically independent experiments.
Extended Data Figure 10. Diet-derived AhR-ligands control IL-22 production.

(a-d) Mice were fed for 6 weeks with either normal, grain-based chow (CD), a phytochemical-free, experimental defined diet (EDD-) or EDD supplemented with the AhR-ligand I3C (EDD+). (a) Representative flow cytometry analysis of IL-22 production by the indicated lymphocyte populations. Numbers indicate percent of cells in gate. (b) Expression of the IL-22 responsive gene Reg3g in primary colon epithelial cells was determined by qRT-PCR (n=5, mean±SEM). (c,d) Representative colon immunofluorescence images 8h after irradiation and stained for γH2AX (red) (c) or cCasp-3+ (red) (d) and EpCam (blue). Scale bar=50μm.
Data are representative of three biologically independent experiments.
(e) Model of IL-22-mediated protection of epithelial stem cells against genotoxic stress. Epithelial stem cells at the intestinal barrier are continuously exposed to a variety of insults. Among them are threats to genomic integrity represented by genotoxins, contained in diets or produced by bacteria. Genome integrity in stem cells requires a functioning DNA damage response pathway to limit damage to the genetic code in order to prevent malignant transformation. Our data implicate a homeostatic regulatory loop that assesses the degree of “genotoxic danger” by AhR-mediated sensing of nutrient-derived genotoxins that serve as AhR ligands. AhR signaling in ILC3 and γδ T cells controls IL-22 production. IL-22 signaling in intestinal epithelial stem cells in turn controls components of the DDR. In particular ATM, a PI3-kinase-like molecule and an important upstream transducer of the DDR, was tuned-up by IL-22 signaling in stem cells. Following genotoxic stress, ATM controls downstream events of the DDR such as p53 activation and expression of the DDR effector molecules p21 and PUMA that control DNA repair and apoptosis, respectively. Disturbances of this pathway in mice genetically lacking IL-22, the IL-22 receptor or the AhR led to an impaired DDR to various forms of genotoxic stress. Consequently, intestinal epithelial stem cells from mice with impairment of IL-22 signaling or production accumulated cancer-promoting mutations and showed accelerated development of cancer.
Supplementary Material
Acknowledgements
We thank M.Di Virgilio, B.Epe, T.Nikolova, J.Ommer and the members of the Diefenbach laboratory for valuable discussions, and K.Oberle for excellent technical assistance. We are thankful to the IMB Flow Cytometry Core Facility (J.Hartwig, I.Schäfer and S.Möckel), the IMB Microscopy Core Facility (S.Ritz and J.Schwirz), the Deep Sequencing Facility at the MPI Immunobiology & Epigenetics Freiburg and EUCOMM for providing targeted ES cells. The work was supported by the European Research Council (ERC StG #311377 to A.D.), the European Union’s Horizon 2020 programme (Marie Skłodowska-Curie Grant Agreement No. 744257 to J.Z.), Deutsche Forschungsgemeinschaft (TR-SFB156/A02, TR-SFB241/A01, SPP1937-DI764/9 to A.D. and KL2963/1-1 to C.S.N.K.), Einstein Foundation Berlin (Einstein Professorship to A.D.), the German Rheumatism Research Centre (to A.D. and A.T.) and the Max-Planck Society (IMPRS-MCB, MPI Freiburg to K.G., M.K-B. and P.H.).
Footnotes
Data availability
RNA-Seq data is available at the ArrayExpress (http://www.ebi.ac.uk/arrayexpress/) with the accession number E-MTAB-6723. All datasets generated and/or analysed during the current study are presented in this published article, the accompanying Source Data or Supplementary Information files, or are available from the corresponding author upon reasonable request.
Author Contribution
K.G and P.H. carried out most experiments and analyzed the data. J.Z., M.K-B., F.G-R., M.W., C.T., L.A., and A.T. helped with experiments and analysis. C.S.N.K. generated Il22ra1fl/fl mice. F.S. and H.G. provided 1-MIM-OH and performed LC-MS/MS analyses. K.G., P.H. and A.D. designed the experiments and analyzed data. A.D. directed the research and wrote the manuscript with input from co-authors.
Author Information
Reprints and permissions information is available at www.nature.com/reprints. RNA-seq data is available at the ArrayExpress (http://www.ebi.ac.uk/arrayexpress/) with the accession number E-MTAB-6723.
The authors declare no competing financial interests.
References
- 1.Hanahan D, Weinberg RA. Hallmarks of cancer: the next generation. Cell. 2011;144:646–674. doi: 10.1016/j.cell.2011.02.013. [DOI] [PubMed] [Google Scholar]
- 2.Wu S, Powers S, Zhu W, Hannun YA. Substantial contribution of extrinsic risk factors to cancer development. Nature. 2016;529:43–47. doi: 10.1038/nature16166. [DOI] [PMC free article] [PubMed] [Google Scholar]
- 3.Blokzijl F, et al. Tissue-specific mutation accumulation in human adult stem cells during life. Nature. 2016;538:260–264. doi: 10.1038/nature19768. [DOI] [PMC free article] [PubMed] [Google Scholar]
- 4.Blanpain C, Mohrin M, Sotiropoulou PA, Passegue E. DNA-damage response in tissue-specific and cancer stem cells. Cell Stem Cell. 2011;8:16–29. doi: 10.1016/j.stem.2010.12.012. [DOI] [PubMed] [Google Scholar]
- 5.Halazonetis TD, Gorgoulis VG, Bartek J. An oncogene-induced DNA damage model for cancer development. Science. 2008;319:1352–1355. doi: 10.1126/science.1140735. [DOI] [PubMed] [Google Scholar]
- 6.Bjeldanes LF, Kim JY, Grose KR, Bartholomew JC, Bradfield CA. Aromatic hydrocarbon responsiveness-receptor agonists generated from indole-3-carbinol in vitro and in vivo: comparisons with 2,3,7,8-tetrachlorodibenzo-p-dioxin. Proc Natl Acad Sci USA. 1991;88:9543–9547. doi: 10.1073/pnas.88.21.9543. [DOI] [PMC free article] [PubMed] [Google Scholar]
- 7.Fu D, Calvo JA, Samson LD. Balancing repair and tolerance of DNA damage caused by alkylating agents. Nat Rev Cancer. 2012;12:104–120. doi: 10.1038/nrc3185. [DOI] [PMC free article] [PubMed] [Google Scholar]
- 8.Greten FR, et al. IKKbeta links inflammation and tumorigenesis in a mouse model of colitis-associated cancer. Cell. 2004;118:285–296. doi: 10.1016/j.cell.2004.07.013. [DOI] [PubMed] [Google Scholar]
- 9.Martincorena I, et al. Universal Patterns of Selection in Cancer and Somatic Tissues. Cell. 2017;171:1029–1041 e1021. doi: 10.1016/j.cell.2017.09.042. [DOI] [PMC free article] [PubMed] [Google Scholar]
- 10.Bailey MH, et al. Comprehensive Characterization of Cancer Driver Genes and Mutations. Cell. 2018;173:371–385 e318. doi: 10.1016/j.cell.2018.02.060. [DOI] [PMC free article] [PubMed] [Google Scholar]
- 11.Huber S, et al. IL-22BP is regulated by the inflammasome and modulates tumorigenesis in the intestine. Nature. 2012;491:259–263. doi: 10.1038/nature11535. [DOI] [PMC free article] [PubMed] [Google Scholar]
- 12.Lindemans CA, et al. Interleukin-22 promotes intestinal-stem-cell-mediated epithelial regeneration. Nature. 2015 doi: 10.1038/nature16460. [DOI] [PMC free article] [PubMed] [Google Scholar]
- 13.Zenewicz LA, et al. IL-22 deficiency alters colonic microbiota to be transmissible and colitogenic. J Immunol. 2013;190:5306–5312. doi: 10.4049/jimmunol.1300016. [DOI] [PMC free article] [PubMed] [Google Scholar]
- 14.Barker N, et al. Crypt stem cells as the cells-of-origin of intestinal cancer. Nature. 2009;457:608–611. doi: 10.1038/nature07602. [DOI] [PubMed] [Google Scholar]
- 15.Barker N, et al. Identification of stem cells in small intestine and colon by marker gene Lgr5. Nature. 2007;449:1003–1007. doi: 10.1038/nature06196. [DOI] [PubMed] [Google Scholar]
- 16.Snippert HJ, et al. Intestinal crypt homeostasis results from neutral competition between symmetrically dividing Lgr5 stem cells. Cell. 2010;143:134–144. doi: 10.1016/j.cell.2010.09.016. [DOI] [PubMed] [Google Scholar]
- 17.Sanos SL, et al. RORgammat and commensal microflora are required for the differentiation of mucosal interleukin 22-producing NKp46+ cells. Nat Immunol. 2009;10:83–91. doi: 10.1038/ni.1684. [DOI] [PMC free article] [PubMed] [Google Scholar]
- 18.Falck J, Coates J, Jackson SP. Conserved modes of recruitment of ATM, ATR and DNA-PKcs to sites of DNA damage. Nature. 2005;434:605–611. doi: 10.1038/nature03442. [DOI] [PubMed] [Google Scholar]
- 19.Barry SP, et al. STAT3 modulates the DNA damage response pathway. Int J Exp Pathol. 2010;91:506–514. doi: 10.1111/j.1365-2613.2010.00734.x. [DOI] [PMC free article] [PubMed] [Google Scholar]
- 20.Pickert G, et al. STAT3 links IL-22 signaling in intestinal epithelial cells to mucosal wound healing. J Exp Med. 2009;206:1465–1472. doi: 10.1084/jem.20082683. [DOI] [PMC free article] [PubMed] [Google Scholar]
- 21.Rogakou EP, Pilch DR, Orr AH, Ivanova VS, Bonner WM. DNA double-stranded breaks induce histone H2AX phosphorylation on serine 139. J Biol Chem. 1998;273:5858–5868. doi: 10.1074/jbc.273.10.5858. [DOI] [PubMed] [Google Scholar]
- 22.Fischer M. Census and evaluation of p53 target genes. Oncogene. 2017;36:3943–3956. doi: 10.1038/onc.2016.502. [DOI] [PMC free article] [PubMed] [Google Scholar]
- 23.Merritt AJ, et al. The role of p53 in spontaneous and radiation-induced apoptosis in the gastrointestinal tract of normal and p53-deficient mice. Cancer Res. 1994;54:614–617. [PubMed] [Google Scholar]
- 24.Qiu W, et al. PUMA regulates intestinal progenitor cell radiosensitivity and gastrointestinal syndrome. Cell Stem Cell. 2008;2:576–583. doi: 10.1016/j.stem.2008.03.009. [DOI] [PMC free article] [PubMed] [Google Scholar]
- 25.Hernandez P, Gronke K, Diefenbach A. A catch-22: Interleukin-22 and cancer. Eur J Immunol. 2018;48:15–31. doi: 10.1002/eji.201747183. [DOI] [PubMed] [Google Scholar]
- 26.Schumacher F, et al. A secondary metabolite of Brassicales, 1-methoxy-3-indolylmethyl glucosinolate, as well as its degradation product, 1-methoxy-3-indolylmethyl alcohol, forms DNA adducts in the mouse, but in varying tissues and cells. Arch Toxicol. 2014;88:823–836. doi: 10.1007/s00204-013-1149-7. [DOI] [PubMed] [Google Scholar]
- 27.Kiss EA, et al. Natural aryl hydrocarbon receptor ligands control organogenesis of intestinal lymphoid follicles. Science. 2011;334:1561–1565. doi: 10.1126/science.1214914. [DOI] [PubMed] [Google Scholar]
- 28.Li Y, et al. Exogenous Stimuli Maintain Intraepithelial Lymphocytes via Aryl Hydrocarbon Receptor Activation. Cell. 2011;147:629–640. doi: 10.1016/j.cell.2011.09.025. [DOI] [PubMed] [Google Scholar]
- 29.Lee JS, et al. AHR drives the development of gut ILC22 cells and postnatal lymphoid tissues via pathways dependent on and independent of Notch. Nat Immunol. 2012;13:144–151. doi: 10.1038/ni.2187. [DOI] [PMC free article] [PubMed] [Google Scholar]
- 30.Metidji A, et al. The Environmental Sensor AHR Protects from Inflammatory Damage by Maintaining Intestinal Stem Cell Homeostasis and Barrier Integrity. Immunity. 2018;49:353–362 e355. doi: 10.1016/j.immuni.2018.07.010. [DOI] [PMC free article] [PubMed] [Google Scholar]
- 31.Eberl G, Littman DR. Thymic origin of intestinal alphabeta T cells revealed by fate mapping of RORgammat+ cells. Science. 2004;305:248–251. doi: 10.1126/science.1096472. [DOI] [PubMed] [Google Scholar]
- 32.Kreymborg K, et al. IL-22 is expressed by Th17 cells in an IL-23-dependent fashion, but not required for the development of autoimmune encephalomyelitis. J Immunol. 2007;179:8098–8104. doi: 10.4049/jimmunol.179.12.8098. [DOI] [PubMed] [Google Scholar]
- 33.Alonzi T, et al. Essential role of STAT3 in the control of the acute-phase response as revealed by inducible gene inactivation [correction of activation] in the liver. Mol Cell Biol. 2001;21:1621–1632. doi: 10.1128/MCB.21.5.1621-1632.2001. [DOI] [PMC free article] [PubMed] [Google Scholar]
- 34.el Marjou F, et al. Tissue-specific and inducible Cre-mediated recombination in the gut epithelium. Genesis. 2004;39:186–193. doi: 10.1002/gene.20042. [DOI] [PubMed] [Google Scholar]
- 35.Schmidt JV, Su GH, Reddy JK, Simon MC, Bradfield CA. Characterization of a murine Ahr null allele: involvement of the Ah receptor in hepatic growth and development. Proc Natl Acad Sci U S A. 1996;93:6731–6736. doi: 10.1073/pnas.93.13.6731. [DOI] [PMC free article] [PubMed] [Google Scholar]
- 36.Walisser JA, Glover E, Pande K, Liss AL, Bradfield CA. Aryl hydrocarbon receptor-dependent liver development and hepatotoxicity are mediated by different cell types. Proc Natl Acad Sci USA. 2005;102:17858–17863. doi: 10.1073/pnas.0504757102. [DOI] [PMC free article] [PubMed] [Google Scholar]
- 37.Skarnes WC, et al. A conditional knockout resource for the genome-wide study of mouse gene function. Nature. 2011;474:337–342. doi: 10.1038/nature10163. [DOI] [PMC free article] [PubMed] [Google Scholar]
- 38.Farley FW, Soriano P, Steffen LS, Dymecki SM. Widespread recombinase expression using FLPeR (flipper) mice. Genesis. 2000;28:106–110. [PubMed] [Google Scholar]
- 39.Gronke K, Kofoed-Nielsen M, Diefenbach A. Isolation and Flow Cytometry Analysis of Innate Lymphoid Cells from the Intestinal Lamina Propria. Methods Mol Biol. 2017;1559:255–265. doi: 10.1007/978-1-4939-6786-5_17. [DOI] [PubMed] [Google Scholar]
- 40.Cossarizza A, et al. Guidelines for the use of flow cytometry and cell sorting in immunological studies. Eur J Immunol. 2017;47:1584–1797. doi: 10.1002/eji.201646632. [DOI] [PMC free article] [PubMed] [Google Scholar]
- 41.Schindelin J, et al. Fiji: an open-source platform for biological-image analysis. Nat Methods. 2012;9:676–682. doi: 10.1038/nmeth.2019. [DOI] [PMC free article] [PubMed] [Google Scholar]
- 42.Trapnell C, et al. Transcript assembly and quantification by RNA-Seq reveals unannotated transcripts and isoform switching during cell differentiation. Nat Biotechnol. 2010;28:511–515. doi: 10.1038/nbt.1621. [DOI] [PMC free article] [PubMed] [Google Scholar]
- 43.Subramanian A, et al. Gene set enrichment analysis: a knowledge-based approach for interpreting genome-wide expression profiles. Proc Natl Acad Sci U S A. 2005;102:15545–15550. doi: 10.1073/pnas.0506580102. [DOI] [PMC free article] [PubMed] [Google Scholar]
- 44.Quaroni A, Wands J, Trelstad RL, Isselbacher KJ. Epithelioid cell cultures from rat small intestine. Characterization by morphologic and immunologic criteria. J Cell Biol. 1979;80:248–265. doi: 10.1083/jcb.80.2.248. [DOI] [PMC free article] [PubMed] [Google Scholar]
- 45.Takahashi M, Nakatsugi S, Sugimura T, Wakabayashi K. Frequent mutations of the beta-catenin gene in mouse colon tumors induced by azoxymethane. Carcinogenesis. 2000;21:1117–1120. [PubMed] [Google Scholar]
- 46.Schumacher F, Herrmann K, Florian S, Engst W, Glatt H. Optimized enzymatic hydrolysis of DNA for LC-MS/MS analyses of adducts of 1-methoxy-3-indolylmethyl glucosinolate and methyleugenol. Anal Biochem. 2013;434:4–11. doi: 10.1016/j.ab.2012.11.001. [DOI] [PubMed] [Google Scholar]
- 47.Schumacher F, et al. Detection of DNA adducts originating from 1-methoxy-3-indolylmethyl glucosinolate using isotope-dilution UPLC-ESI-MS/MS. Anal Chem. 2012;84:6256–6262. doi: 10.1021/ac301436q. [DOI] [PubMed] [Google Scholar]
- 48.Speckmann B, et al. Selenium increases hepatic DNA methylation and modulates one-carbon metabolism in the liver of mice. J Nutr Biochem. 2017;48:112–119. doi: 10.1016/j.jnutbio.2017.07.002. [DOI] [PubMed] [Google Scholar]
Associated Data
This section collects any data citations, data availability statements, or supplementary materials included in this article.