A recent article by Barbash et al. reported on the first publically available, 2017 data of United States (US) hospital performance on the Centers for Medicare & Medicaid Services (CMS) “Early Management Bundle for Severe Sepsis/Septic Shock” (SEP-1) quality measure [1]. They demonstrate that 87% of hospitals reported SEP-1 data, at an average compliance with all elements of the bundle of 49% (standard deviation (SD) 19%). In addition to their demonstrating the hospital characteristics associated with high SEP-1 performance, an aggregated state-level description is an important complimentary analysis given the state-specific sepsis quality mandates and initiatives existing and forthcoming. Specifically, pre-dating SEP-1 and beginning in 2014, New York required hospitals to implement sepsis care protocols. Also at the time of writing, Illinois and New Jersey are adopting similar mandates while Ohio and Wisconsin are adopting sepsis public health initiatives [2–4].
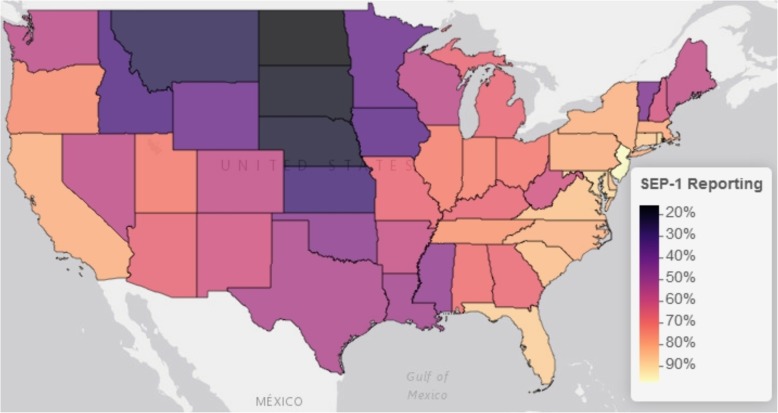
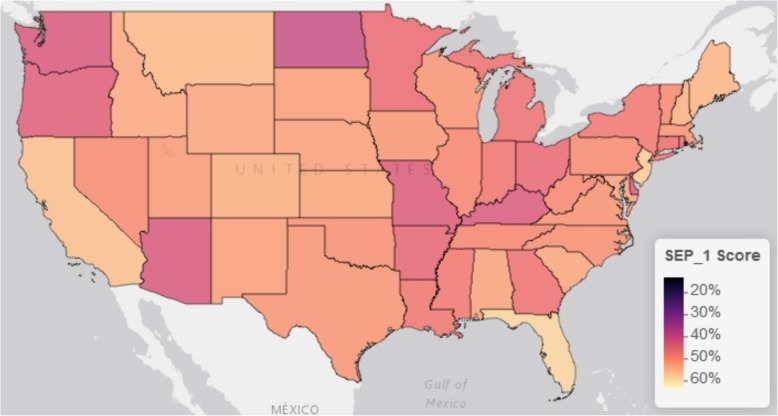
In our analysis, we utilized a different, larger denominator file of the 4793 hospitals in the CMS Hospital General Information dataset, resulting in a lower proportion (63% vs. 87% in Barbash et al.) of national hospitals with complete reporting of SEP-1 from January 1 to December 31, 2017. Despite this difference, we demonstrated the same national hospital SEP-1 performance at a national mean of 50% (SD 19%). Aggregating the data at the level of the 56 states and territories available, the percent of each state’s hospitals that were compliant with SEP-1 reporting requirements ranged from 16% (North Dakota) to 100% (Rhode Island and Virgin Islands), at an average of 63% (SD 9%). This is comparable to the national average but with a standard deviation demonstrating wide state variation in individual state’s hospital reporting compliance. Furthermore, this variation appears geographically clustered, with lower reporting throughout the north-central part of the continental US (Fig. 1). In regard to each state’s average hospital performance in SEP-1 bundle compliance, the states’ mean hospital SEP-1 performance ranged from 9% (Virgin Islands) to 63% (Hawaii) around a state average of 48% (SD 9%), comparable to the national mean of all hospitals but with a narrower standard deviation. In contrast to states’ hospital reporting compliance, states’ mean SEP-1 scores do not appear to visually cluster within the continental US (Fig. 2)
Fig. 1.
Continental US map of state’s percent of hospitals compliant with SEP-1 reporting. Mapping was performed using the leaflet package for R (Version 2.0.1) with the Esri World Gray Canvas basemap (Esri, Delorme, NAVTEQ)
Fig. 2.
Continental US map of the means of state’s hospitals’ SEP-1 scores. The SEP-1 score represents the percent of patients with sepsis sampled from each hospital that received all components of the Centers for Medicaid & Medicare Services “Early Management Bundle for Severe Sepsis/Septic Shock” (SEP-1) inpatient quality measure. For this figure, hospital scores were summarized as the mean hospital score for each state. Mapping was performed using the leaflet package for R (Version 2.0.1) with the Esri World Gray Canvas basemap (Esri, Delorme, NAVTEQ)
These data demonstrate that there is a similar magnitude of variation between states' SEP-1 reporting compliance and performance (SD 9% for both). (Table 1). By the time of this analysis, New York’s hospitals’ reporting compliance with overlapping SEP-1 measure was relatively high, with 82% of hospitals completing SEP-1 reporting. However, New York’s hospitals’ performance in completing the patient-care components of the SEP-1 bundle was just below the national average with 47% (SD 17%) of the state’s hospitals’ sampled SEP-1 patients receiving all components of the SEP− 1 bundle. It remains to be seen whether specific state mandates and initiatives have an impact in addition to the national mandates.
Table 1.
US state and territories’ hospitals’ reporting compliance and score performance with SEP-1, 2017
| State | Hospitals in CMS Universe (N) | State’s hospitals reporting SEP-1 data (%) | State’s hospitals with incomplete reporting of SEP-1 data (%) | Hospitals’ SEP-1 score mean (SD) |
Hospitals’ SEP-1 score median (IQR) |
|---|---|---|---|---|---|
| New Jersey | 66 | 97 | 3 | 57.3 (18.3) | 58 (44–69) |
| Rhode Island | 11 | 90.9 | 9.1 | 46.2 (21) | 39 (33–63) |
| Maryland | 49 | 89.8 | 8.2 | 52.4 (16.4) | 51 (40–62) |
| Florida | 184 | 88 | 9.8 | 58.3 (17.9) | 58 (47–71) |
| Washington, DC | 8 | 87.5 | 12.5 | 33 (22.8) | 30 (21–38) |
| Connecticut | 31 | 87.1 | 12.9 | 45.9 (18.5) | 42 (32–59) |
| Virginia | 85 | 85.9 | 14.1 | 50.6 (22.5) | 52 (36–66) |
| Delaware | 7 | 85.7 | 14.3 | 42.5 (12.1) | 37 (34–49) |
| South Carolina | 60 | 85 | 15 | 52.9 (17.8) | 52 (42–66) |
| North Carolina | 105 | 82.9 | 17.1 | 50 (16.8) | 48 (30–61) |
| New York | 170 | 82.4 | 14.7 | 47.1 (17.4) | 46 (33–60) |
| California | 341 | 82.1 | 15.8 | 55.8 (18.6) | 55 (44–69) |
| Pennsylvania | 171 | 81.9 | 15.8 | 49.6 (16.7) | 46 (39–58) |
| Massachusetts | 63 | 81 | 15.9 | 50.6 (15.2) | 47 (40–63) |
| Tennessee | 108 | 76.9 | 18.5 | 48.7 (16.5) | 49 (39–60) |
| Oregon | 60 | 75 | 20 | 43.2 (20.3) | 40 (30–61) |
| Indiana | 120 | 73.3 | 19.2 | 46.8 (19.4) | 47 (32–60) |
| Illinois | 180 | 72.8 | 24.4 | 48.9 (18.6) | 50 (37–60) |
| Utah | 46 | 71.7 | 26.1 | 51.6 (12.9) | 51 (43–61) |
| Ohio | 170 | 71.2 | 25.3 | 45 (17.5) | 44 (32–59) |
| Alabama | 91 | 69.2 | 23.1 | 52.4 (18.6) | 51.5 (39–66) |
| Georgia | 132 | 67.4 | 25.8 | 46.4 (17.1) | 47 (34–60) |
| Michigan | 131 | 67.2 | 29.8 | 46.2 (18.2) | 43 (33–59) |
| Kentucky | 91 | 67 | 31.9 | 42.2 (16.8) | 40.5 (33–49) |
| Missouri | 112 | 67 | 30.4 | 42.8 (22.5) | 34.5 (27–57) |
| Arizona | 78 | 66.7 | 30.8 | 42.1 (14.5) | 42 (34–49) |
| New Hampshire | 26 | 61.5 | 34.6 | 54.2 (20.8) | 57 (42–69) |
| West Virginia | 49 | 61.2 | 36.7 | 49 (19.5) | 49.5 (37–65) |
| New Mexico | 41 | 61 | 36.6 | 51.7 (22.7) | 46 (32–71) |
| Arkansas | 75 | 58.7 | 41.3 | 44.5 (18.8) | 45.5 (33–54) |
| Maine | 33 | 57.6 | 42.4 | 54.6 (19.9) | 57 (41–67) |
| Colorado | 80 | 57.5 | 38.8 | 53.8 (16.7) | 56 (46–62) |
| Nevada | 35 | 57.1 | 42.9 | 49.6 (17.4) | 43 (39–58) |
| Washington | 90 | 56.7 | 37.8 | 42.1 (16.4) | 44 (31–54) |
| Hawaii | 23 | 56.5 | 43.5 | 63.2 (13) | 64 (53–75) |
| Wisconsin | 126 | 56.3 | 39.7 | 50.7 (16.6) | 51 (39–63) |
| Texas | 409 | 53.5 | 39.9 | 50.7 (20.6) | 50 (35–65) |
| Louisiana | 119 | 51.3 | 42 | 47 (21) | 48 (34–64) |
| US Virgin Islands | 2 | 50 | 50 | 9 (4.2) | 9 (8–11) |
| Mississippi | 95 | 47.4 | 43.2 | 47.1 (19.6) | 43 (35–55) |
| Oklahoma | 123 | 46.3 | 43.1 | 50.1 (21.3) | 48.5 (37–65) |
| Alaska | 22 | 45.5 | 50 | 40 (18) | 41 (33–48) |
| Vermont | 14 | 42.9 | 57.1 | 49.3 (12.5) | 53 (43–58) |
| Wyoming | 28 | 39.3 | 53.6 | 52.6 (19.3) | 46 (39–70) |
| Minnesota | 130 | 38.5 | 56.9 | 45.4 (15) | 42.5 (34–59) |
| Iowa | 116 | 35.3 | 61.2 | 51 (19.2) | 50 (36–62) |
| Puerto Rico | 52 | 34.6 | 63.5 | 13.3 (20.6) | 7 (0–14) |
| Idaho | 42 | 33.3 | 66.7 | 53.2 (17.7) | 52.5 (44–66) |
| Kansas | 136 | 30.9 | 61.8 | 52.9 (21.1) | 54 (38–67) |
| Montana | 62 | 25.8 | 69.4 | 55 (23.3) | 63.5 (40–69) |
| Nebraska | 89 | 21.3 | 75.3 | 51.9 (14.3) | 52 (41–60) |
| South Dakota | 58 | 19 | 72.4 | 51.7 (18.6) | 56 (38–66) |
| North Dakota | 44 | 15.9 | 81.8 | 39.9 (26.3) | 34 (20–52) |
| American Samoa | 1 | 0 | 100 | NA | NA |
| Guam | 2 | 0 | 100 | 10 (NA) | 10 (NA) |
| Marianna Islands | 1 | 0 | 100 | NA | NA |
Acknowledgements
Not applicable.
Funding
During this work Dr. Kempker received support from the Agency for Healthcare Research and Quality [K08HS025240] and the National Institutes of Health’s National Heart, Lung, and Blood Institute [L30 HL124529-01].
Availability of data and materials
Data are freely available at https://data.medicare.gov/data/hospital-compare. By time of publication these data may have been moved into the archive at https://data.medicare.gov/data/archives/hospital-compare.
Abbreviations
- CMS
Centers for Medicaid & Medicare Services
- SD
Standard deviation
- SEP-1
“Early Management Bundle for Severe Sepsis/Septic Shock” sepsis quality care bundle
- US
United States of America
Authors’ contributions
JAK analyzed the data and drafted the manuscript. GSM, HEW, MRK, and LAW contributed to the project development, analysis, and interpretation and edited the manuscript. All authors read and approved the final manuscript.
Ethics approval and consent to participate
Not applicable.
Consent for publication
Not applicable.
Competing interests
The authors declare that they have no competing interests.
Publisher’s Note
Springer Nature remains neutral with regard to jurisdictional claims in published maps and institutional affiliations.
Contributor Information
Jordan A. Kempker, Phone: 404 616 9175, Email: jkempke@emory.edu
Michael R. Kramer, Email: mkram02@emory.edu
Lance A. Waller, Email: lwaller@emory.edu
Henry E. Wang, Email: Henry.E.Wang@uth.tmc.edu
Greg S. Martin, Email: greg.martin@emory.edu
References
- 1.Barbash IJ, Davis B, Kahn JM. National performance on the Medicare SEP-1 Sepsis Quality Measure. Crit Care Med. 2018. [Epub ahead of print]. [DOI] [PMC free article] [PubMed]
- 2.New York State Department of Health Office of Quality and Patient Safety. New York State Report on Sepsis Care Improvement Initiative: hospital quality performance [Available from: https://www.health.ny.gov/press/reports/docs/2015_sepsis_care_improvement_initiative.pdf. Accessed 17 Dec 2018.
- 3.Centers for Disease Control and Prevention. State policy approaches to sepsis prevention and early recognition [Available from: https://www.cdc.gov/hai/pdfs/sepsis/vs-sepsis-policy-final.pdf. Accessed 17 Dec 2018.
- 4.Sepsis Alliance. New Jersey now one of three states to mandate sepsis protocols [Available from: https://www.sepsis.org/sepsis-in-the-news/new-jersey-now-one-three-states-mandate-sepsis-protocols/. Accessed 17 Dec 2018.
Associated Data
This section collects any data citations, data availability statements, or supplementary materials included in this article.
Data Availability Statement
Data are freely available at https://data.medicare.gov/data/hospital-compare. By time of publication these data may have been moved into the archive at https://data.medicare.gov/data/archives/hospital-compare.


